POWER VIEW AND POWERPIVOT BASICS - Impact Analytix: Business
99
POWER VIEW AND POWERPIVOT BASICS
Transcript of POWER VIEW AND POWERPIVOT BASICS - Impact Analytix: Business

POWER VIEW AND POWERPIVOT BASICS

AGENDA
• Power View: What it is and what you can do with it!
• PowerPivot: What it is and what you can do with it!
• Basics
o Installation
oCreating mash-ups
oDesigning PowerPivot reports
oExtending with DAX
oPublishing to SharePoint PowerPivot Gallery
oConsuming as data source in SharePoint
• Resources

POWER VIEW
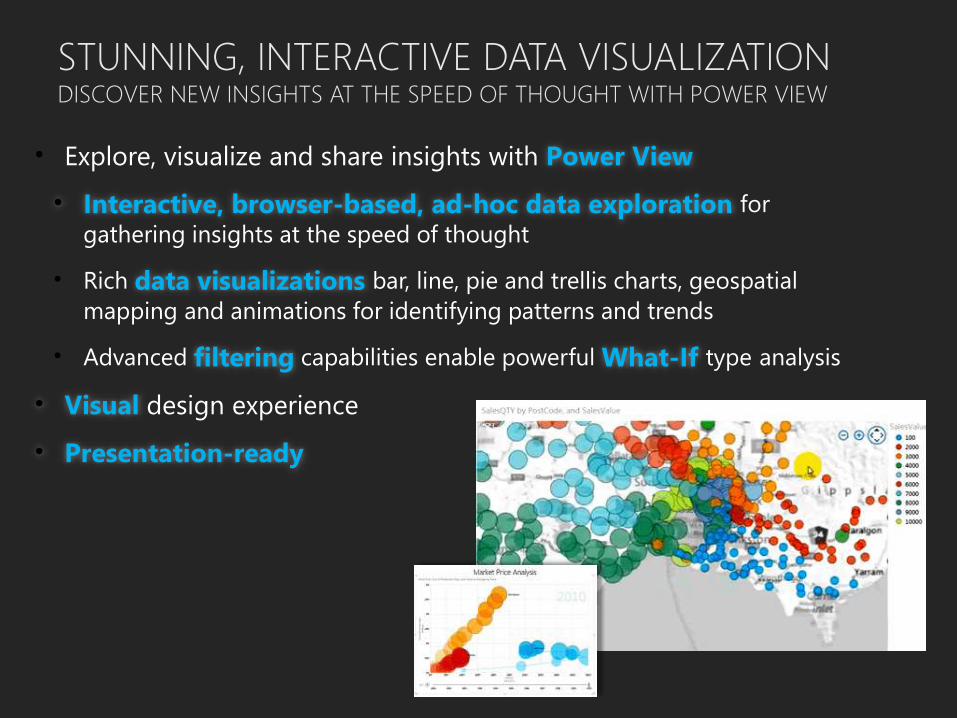
STUNNING, INTERACTIVE DATA VISUALIZATIONDISCOVER NEW INSIGHTS AT THE SPEED OF THOUGHT WITH POWER VIEW
• Explore, visualize and share insights with Power View
• Interactive, browser-based, ad-hoc data exploration for
gathering insights at the speed of thought
• Rich data visualizations bar, line, pie and trellis charts, geospatial
mapping and animations for identifying patterns and trends
• Advanced filtering capabilities enable powerful What-If type analysis
• Visual design experience
• Presentation-ready

POWER VIEW

MANY POWER VIEW 2012 FEATURES
Motion charts
Export to PowerPoint
What-If type analysis
Geospatial Mapping
Interactive, user defined drill paths
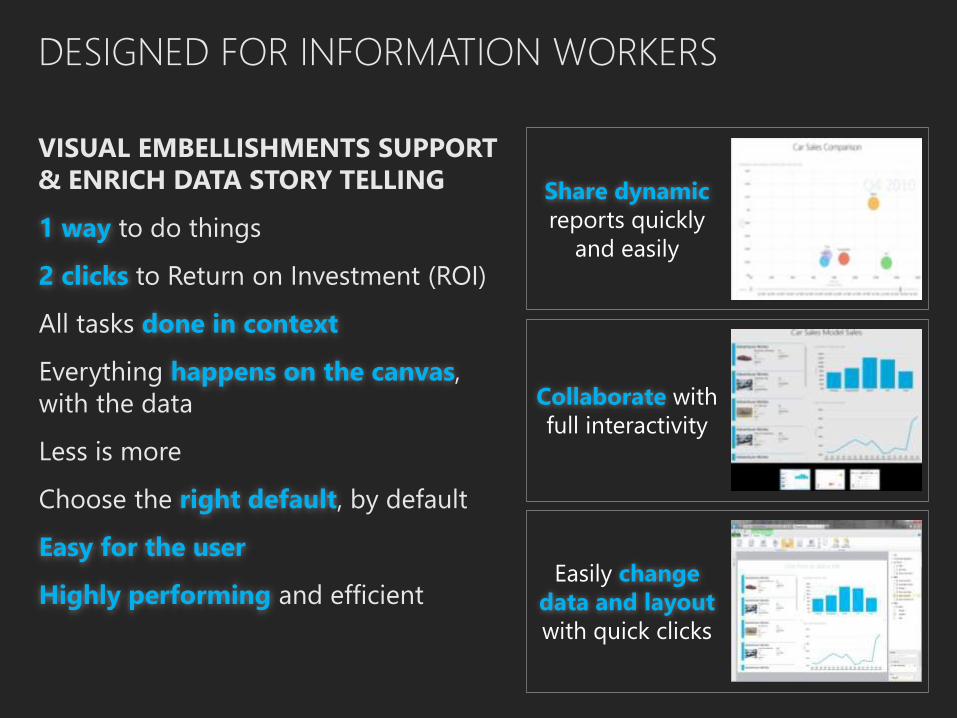
DESIGNED FOR INFORMATION WORKERS
VISUAL EMBELLISHMENTS SUPPORT
& ENRICH DATA STORY TELLING
1 way to do things
2 clicks to Return on Investment (ROI)
All tasks done in context
Everything happens on the canvas,
with the data
Less is more
Choose the right default, by default
Easy for the user
Highly performing and efficientEasily change
data and layout
with quick clicks
Collaborate with
full interactivity
Share dynamic
reports quickly
and easily
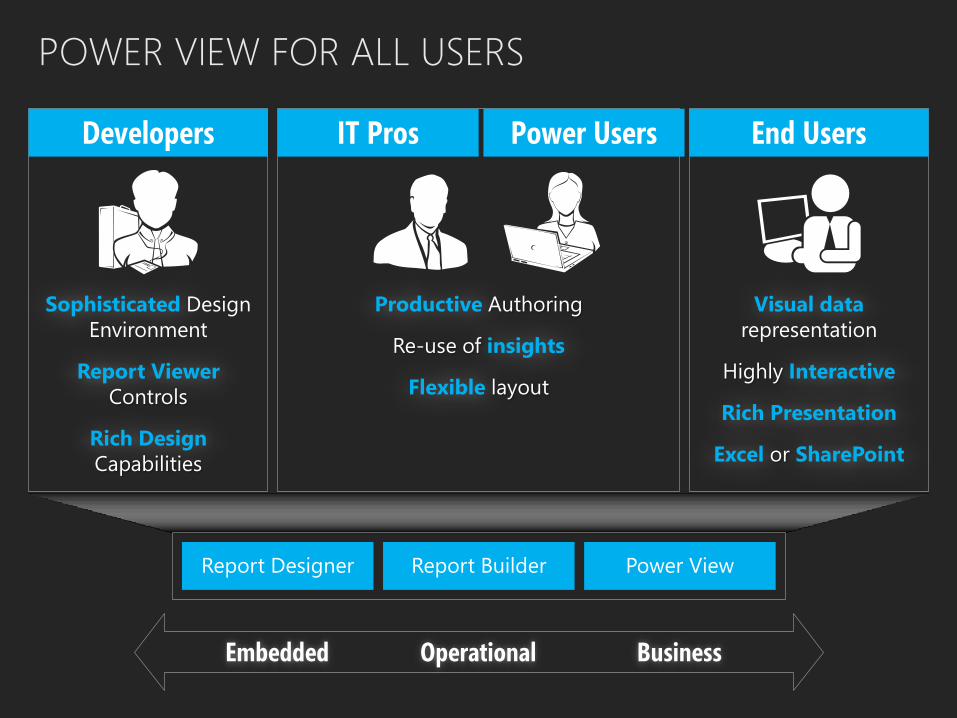
Sophisticated Design
Environment
Report Viewer
Controls
Rich Design
Capabilities
Productive Authoring
Re-use of insights
Flexible layout
Visual data
representation
Highly Interactive
Rich Presentation
Excel or SharePoint
POWER VIEW FOR ALL USERS
Embedded Operational Business
Report Designer Report Builder Power View
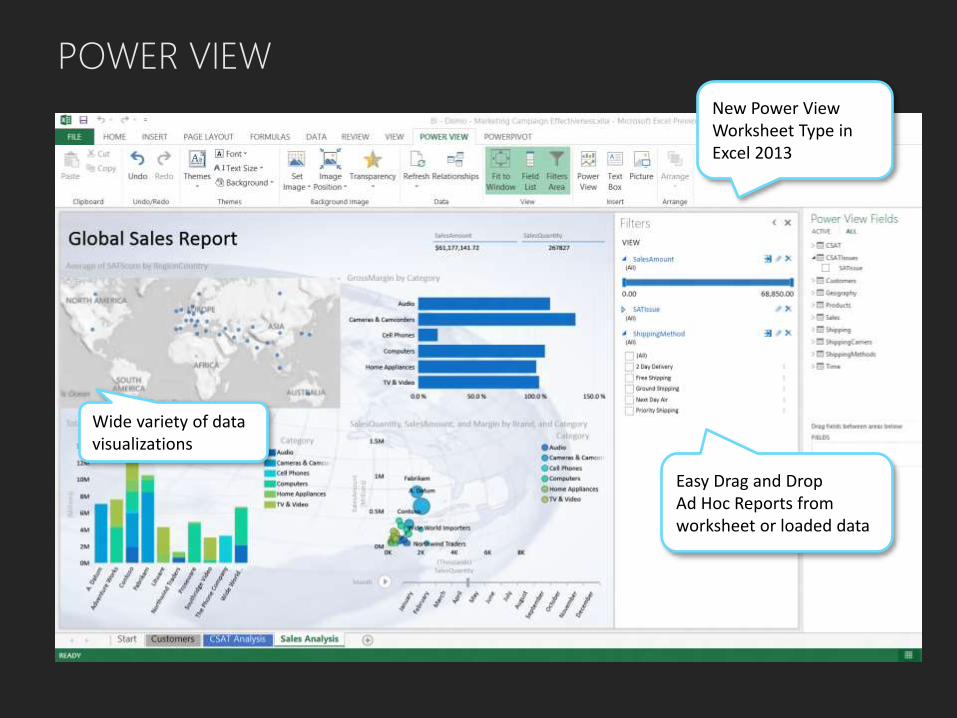
POWER VIEW
Wide variety of data visualizations
Easy Drag and Drop Ad Hoc Reports from worksheet or loaded data
New Power View Worksheet Type in Excel 2013
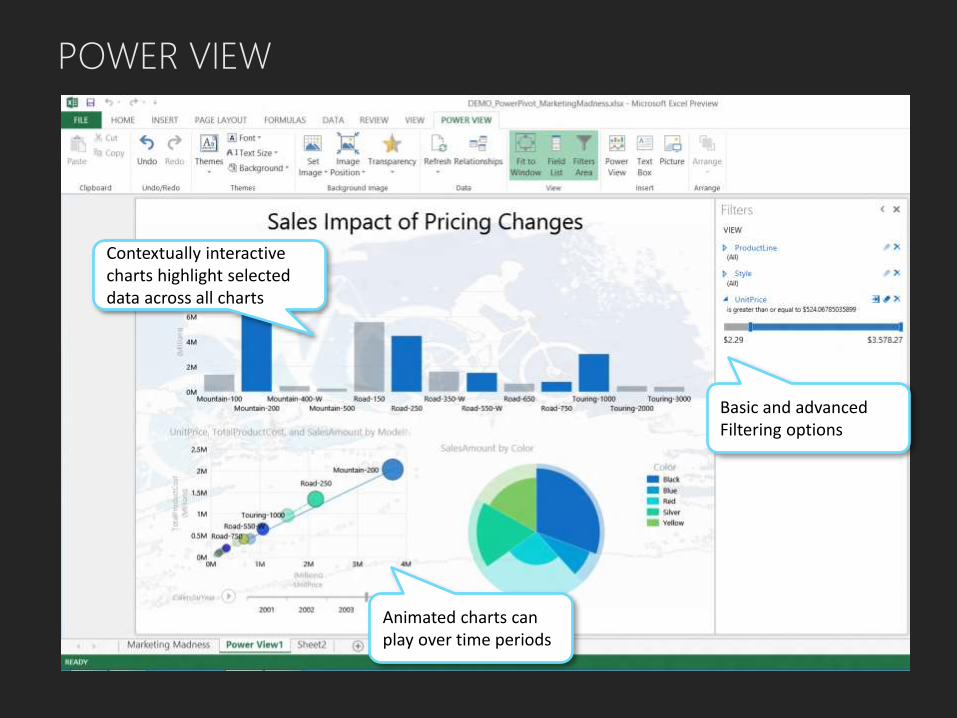
Contextually interactive charts highlight selected data across all charts
Animated charts can play over time periods
POWER VIEW
Basic and advanced Filtering options

DEMO


POWERPIVOT

POWERPIVOT ANALYST TOP 10
1. Ability to work with massive data volumes in tens of millions
2. Mash ups (pivot tables) from multiple tables and a wide variety of data
source types
3. 80+ contextual DAX measures, time intelligence, distinct count, and many
other complex logical functions
4. PowerPivot Relationships in-memory, highly-scalable technology is so
much faster than classic VLOOKUPs
5. World-class 5x, 10x and even 15x Data Compression
6. SharePoint PowerPivot Gallery and automated, scheduled data refresh
7. SharePoint PowerPivot self-service reporting data source
8. SharePoint PowerPivot usage and query source tracking
9. User friendly, configurable Slicers join multiple pivot charts and pivot
tables for interactive dashboards
10. Minimal learning curve for experienced Excel users to
easily develop creative and impactful analytic solutions
POWERPIVOT MASSIVE DATA VOLUMES
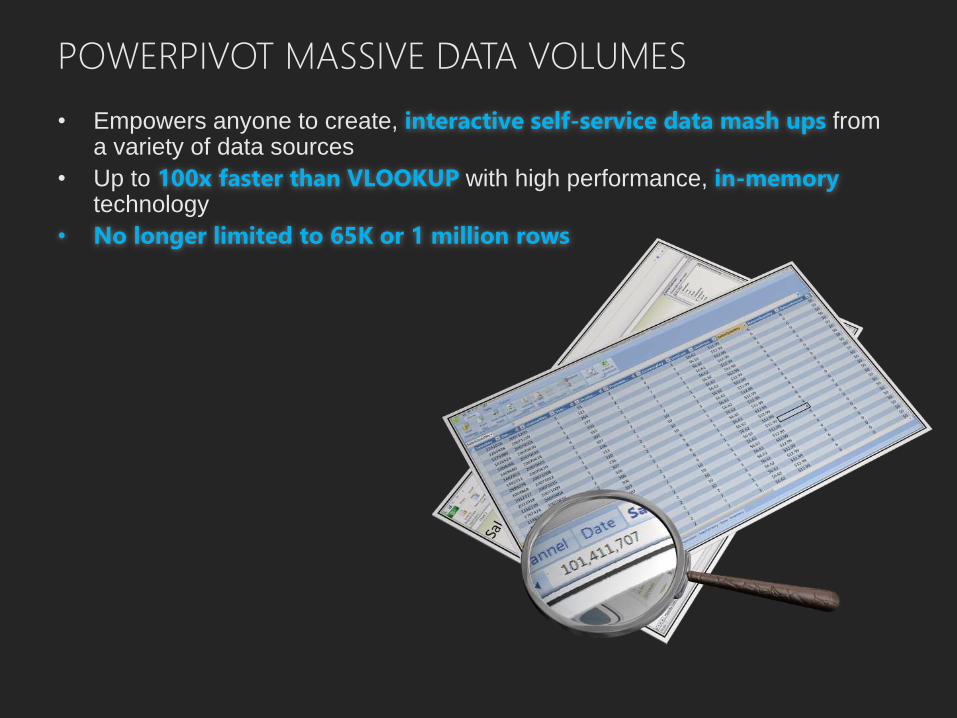
• Empowers anyone to create, interactive self-service data mash ups from a variety of data sources
• Up to 100x faster than VLOOKUP with high performance, in-memorytechnology
• No longer limited to 65K or 1 million rows

POWERPIVOT CASE STUDY
Recent Retail Scenario
74 million rows, 11GB raw compressed to
> 1GB in PowerPivot

DATA SOURCES
• Excel Worksheet Data
• Databases: Relational or multidimensional
• Microsoft SQL Server
• Microsoft Access
• Microsoft Analysis Services Cubes
• Reports: Reporting Services data feeds
• Data Feeds: Cloud, web service or other internet data source feeds
• Text: Raw delimited text files
• Other Data Sources:
• Microsoft SQL Azure
• Microsoft SQL Server Parallel Data Warehouse
• Oracle, Teradata, Sybase, Informix, IBM DB2
• Others (OLE DB/ODBC)
• Excel Files
• SAP or SAP BW

POWERPIVOT WITH SAP
• PowerPivot for combining SAP ECC, SAP BW, SAP HANA data sources
with other Non-SAP data
• Options with No Third Party: NetWeaver, Open Hub, Reporting Services
• Options with Third Party: Theobald, ERPLink, Simplement
• Much easier reporting than traditional SAP reporting tools
DATA ANALYSIS EXPRESSIONS (DAX)
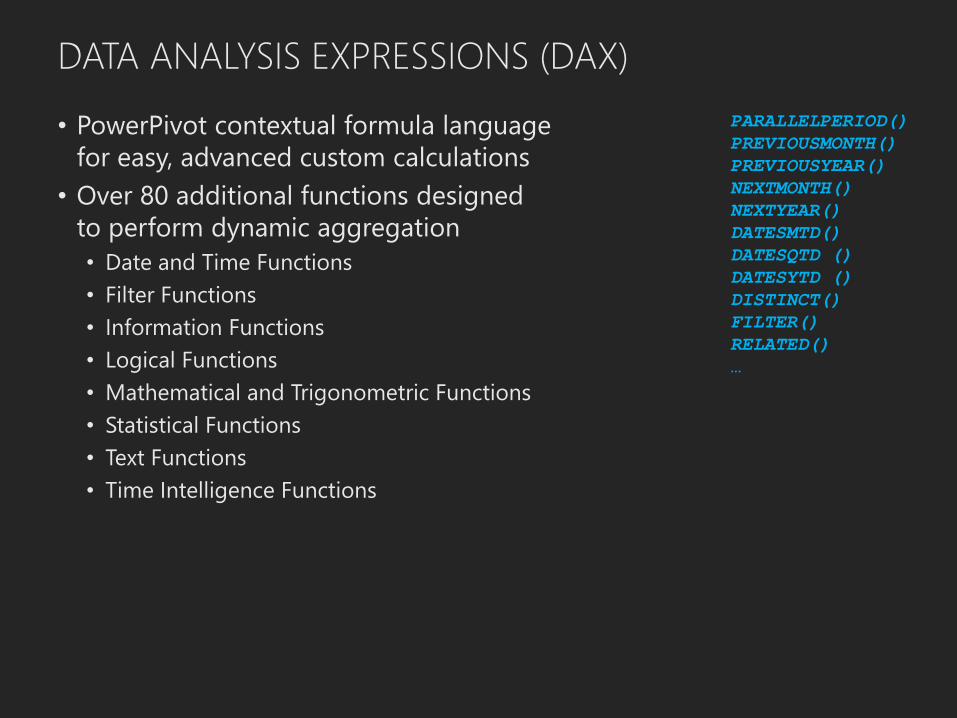
• PowerPivot contextual formula language
for easy, advanced custom calculations
• Over 80 additional functions designed
to perform dynamic aggregation
• Date and Time Functions
• Filter Functions
• Information Functions
• Logical Functions
• Mathematical and Trigonometric Functions
• Statistical Functions
• Text Functions
• Time Intelligence Functions
PARALLELPERIOD()
PREVIOUSMONTH()
PREVIOUSYEAR()
NEXTMONTH()
NEXTYEAR()
DATESMTD()
DATESQTD ()
DATESYTD ()
DISTINCT()
FILTER()
RELATED()
…
POWERPIVOT GALLERY IN SHAREPOINT
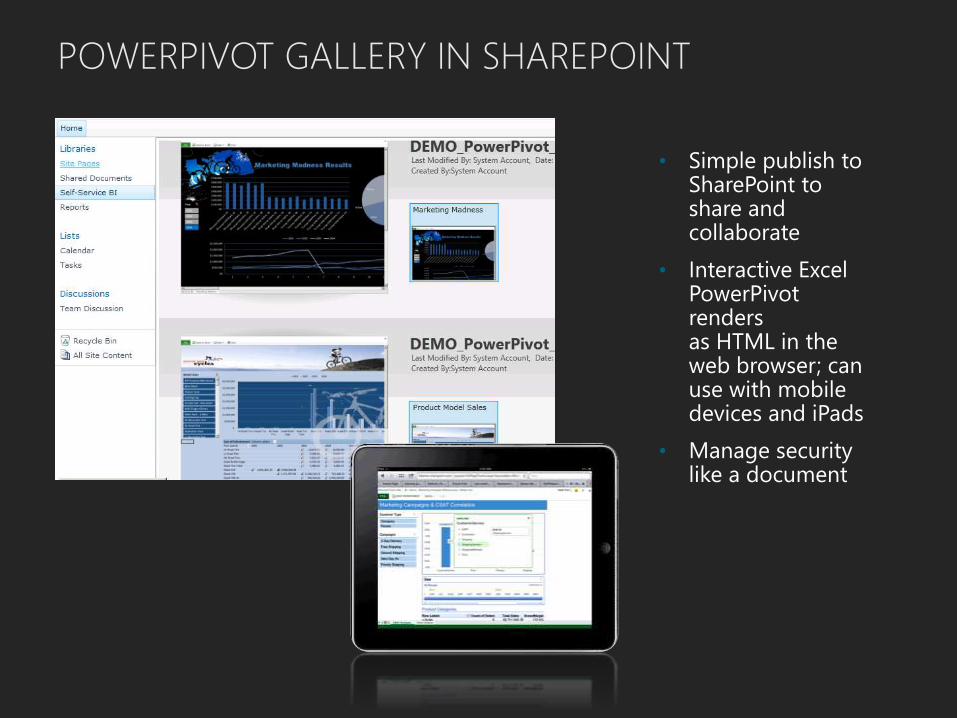
• Simple publish to SharePoint to share and collaborate
• Interactive Excel PowerPivot renders as HTML in the web browser; can use with mobile devices and iPads
• Manage security like a document

POWERPIVOT DATA SOURCE FOR POWER VIEW
• Create new Power View reports fromExcel PowerPivot data sources orBI Semantic Models
• Easily Preview report views

POWERPIVOT DATA SOURCES IN SHAREPOINT
• Browse Excel PowerPivot
• Create New Power View report
• Schedule Data Refresh
Browse, create Power View report or Schedule Data Refresh

• Personal/Team Dashboards and Ad Hoc Reports from PowerPivotdata sources in SharePoint
POWERPIVOT DATA SOURCES IN SHAREPOINT

POWERPIVOT MANAGEMENT DASHBOARD
• Increase IT efficiency:
• Familiar Technologies for Authoring, Sharing, Security and Compliance
• Visualize system performance and usage
• Find out what data sources are being used
• PowerPivot is
• great for IT:
• Track the usage of PowerPivots
• Discover mission-critical applications

NEW EXCEL 2013 CONTROLS
• New Excel controls via Prodiance integration for even better self-
service BI governance, controls and monitoring
• Audit and Control Management Server
• Discovery and Risk Assessment
• Spreadsheet Inquire
• Spreadsheet Compare
• Database Compare
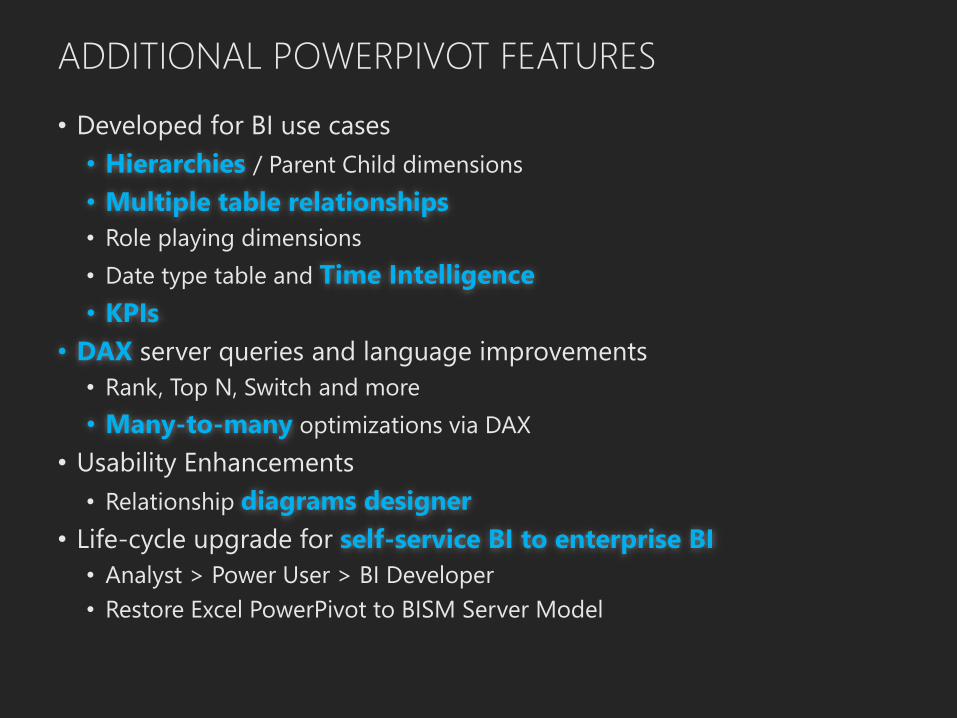
ADDITIONAL POWERPIVOT FEATURES
• Developed for BI use cases
• Hierarchies / Parent Child dimensions
• Multiple table relationships
• Role playing dimensions
• Date type table and Time Intelligence
• KPIs
• DAX server queries and language improvements
• Rank, Top N, Switch and more
• Many-to-many optimizations via DAX
• Usability Enhancements
• Relationship diagrams designer
• Life-cycle upgrade for self-service BI to enterprise BI
• Analyst > Power User > BI Developer
• Restore Excel PowerPivot to BISM Server Model
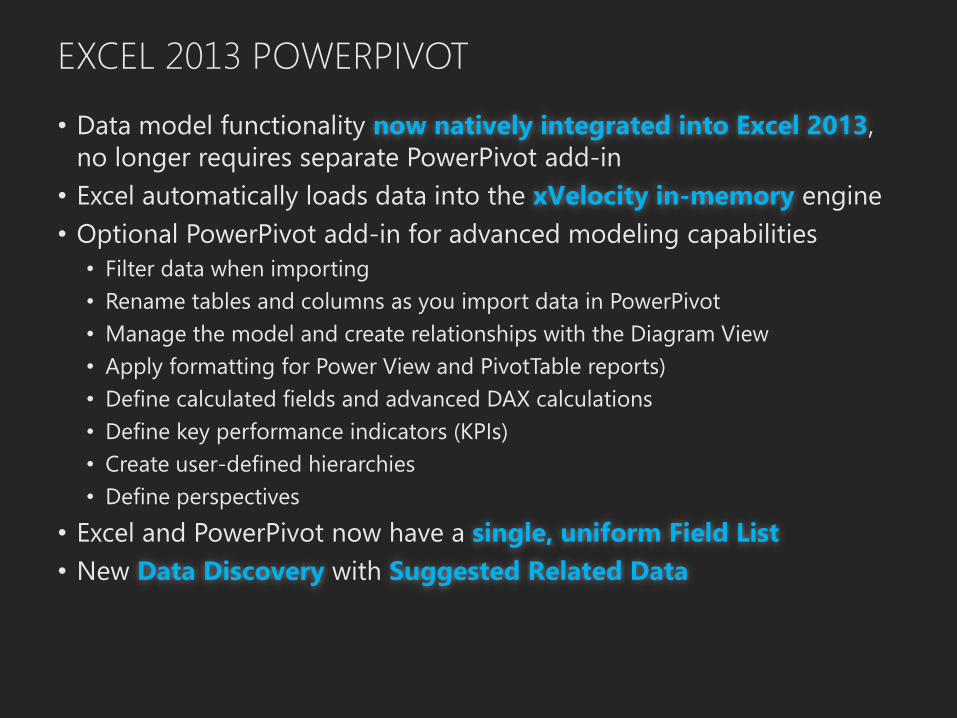
EXCEL 2013 POWERPIVOT
• Data model functionality now natively integrated into Excel 2013,
no longer requires separate PowerPivot add-in
• Excel automatically loads data into the xVelocity in-memory engine
• Optional PowerPivot add-in for advanced modeling capabilities
• Filter data when importing
• Rename tables and columns as you import data in PowerPivot
• Manage the model and create relationships with the Diagram View
• Apply formatting for Power View and PivotTable reports)
• Define calculated fields and advanced DAX calculations
• Define key performance indicators (KPIs)
• Create user-defined hierarchies
• Define perspectives
• Excel and PowerPivot now have a single, uniform Field List
• New Data Discovery with Suggested Related Data

EXCEL 2013 POWERPIVOT
Enhance analytic context with
the new ability to automatically
import Suggested Related Data

POWERPIVOT EXAMPLES
Social AnalyticsTwitter, LinkedIn
and Facebook
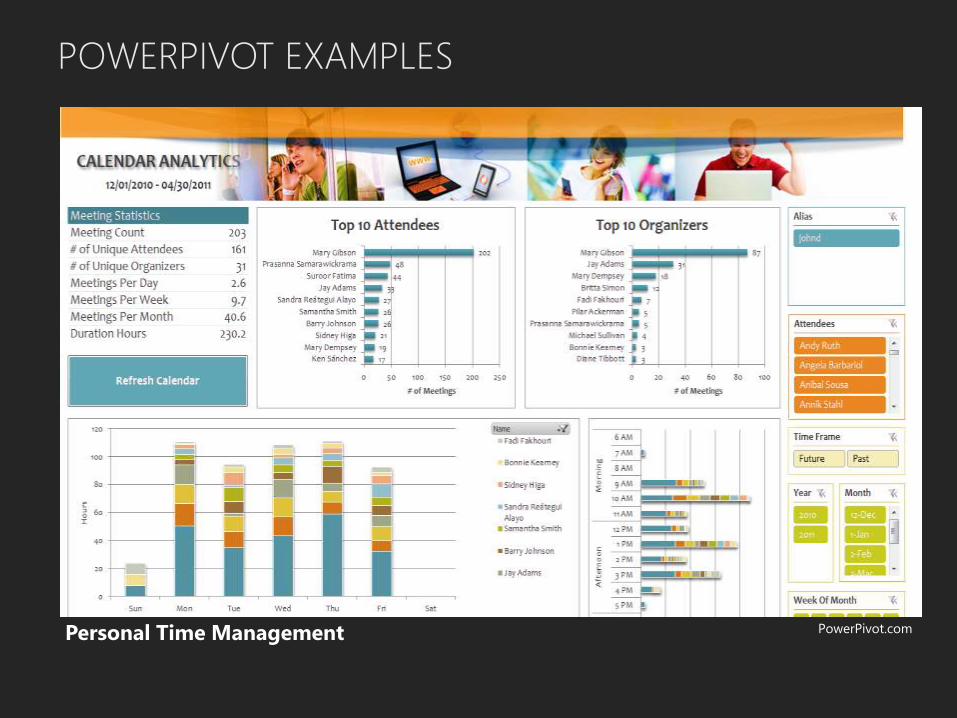
POWERPIVOT EXAMPLES
Personal Time Management PowerPivot.com

POWERPIVOT EXAMPLES
Sports PowerPivot.com

POWERPIVOT EXAMPLES
Retail
PivotStream
POWERPIVOT EXAMPLES
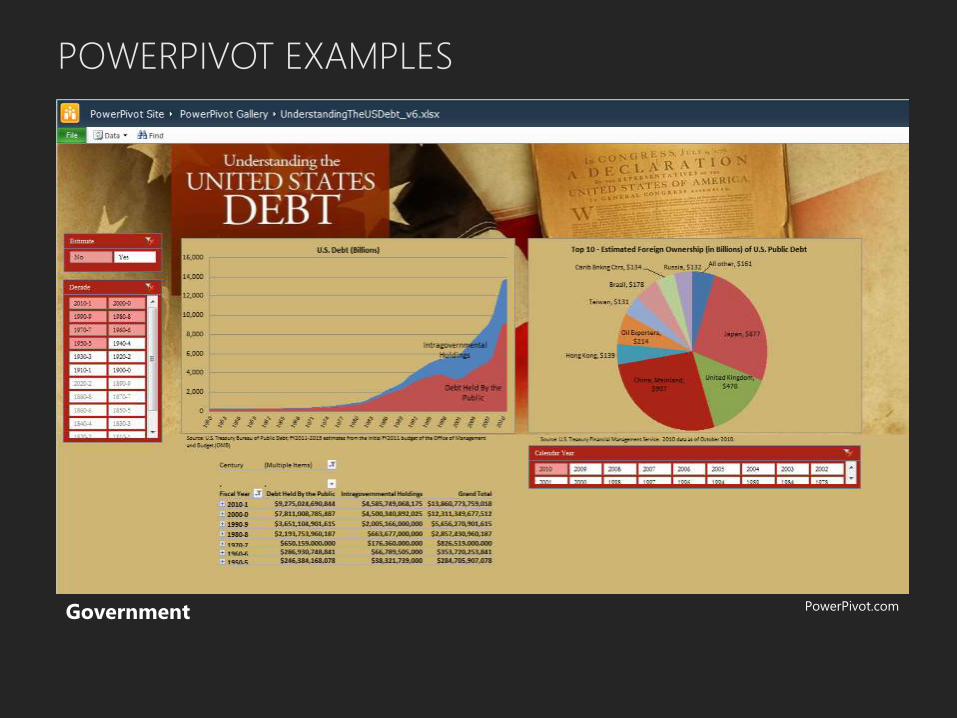
Government PowerPivot.com
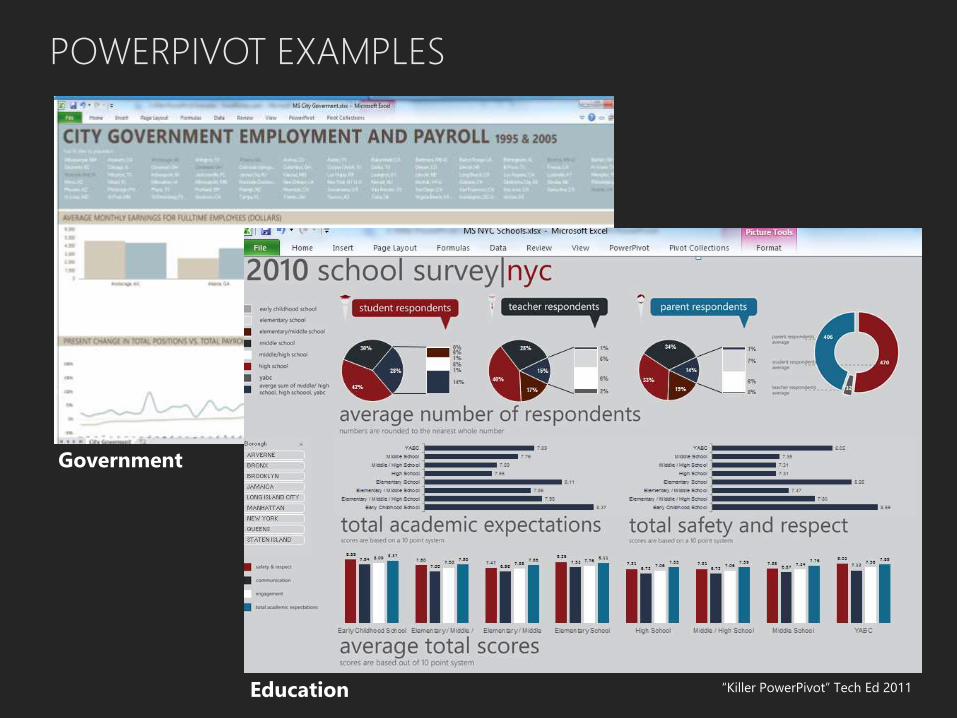
Government
POWERPIVOT EXAMPLES
Education “Killer PowerPivot” Tech Ed 2011
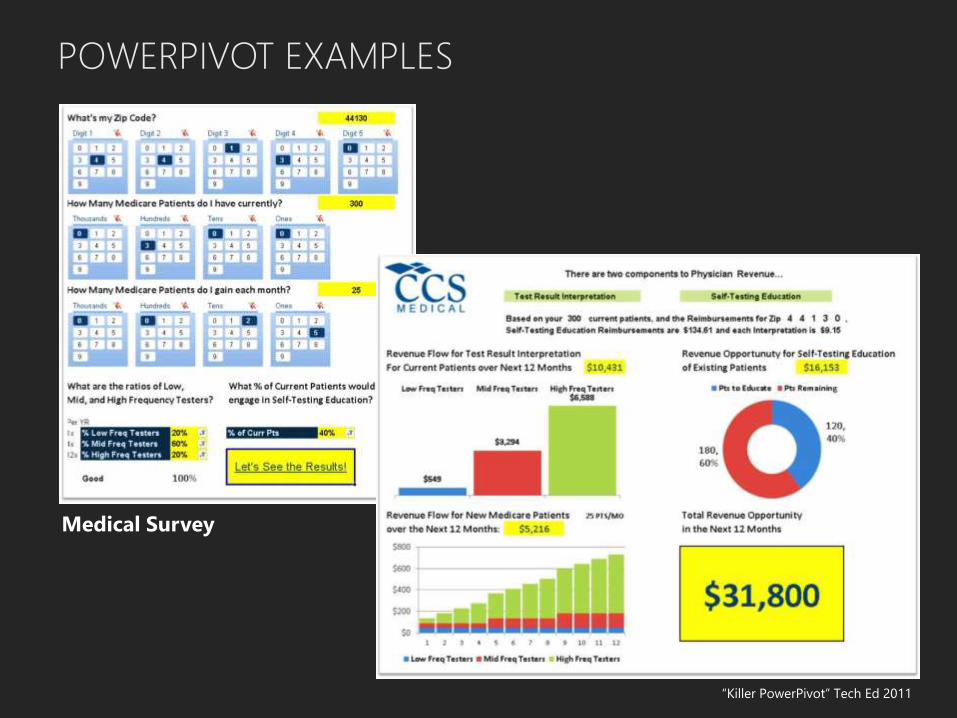
POWERPIVOT EXAMPLES
Medical Survey
“Killer PowerPivot” Tech Ed 2011
COMMON POWERPIVOT APPLICATIONS
• Personalized Excel and SharePoint Dashboards
• Excel Reports, Reporting Services Report Builder and
PerformancePoint Dashboards built on PowerPivot models
• Power User mashes up and personalizes corporate data sets for
team reporting model usage
• Many data source types available!!!
• Forecasting, Budgeting, What-If Analysis
• Combining OLAP actuals with free form data scenarios
• Unions of Excel files with same column structures to combine
departmental inputs into one consolidated view
• Surveys

DEMO

POWER VIEW BASICS

EXCEL 2013 POWER VIEW DATA SOURCE
• Data right within Excel 2013 can be a data source for
Power View
• When tables and relationships are added, Excel is creating
an Excel Data Model behind the scenes
• Optionally the Excel data model can be edited in
PowerPivot in Excel for more sophisticated data model for
Power View reports
• You can also create Power View reports based on a tabular
model running on a SQL Server 2012 Analysis Services
(SSAS) server
• Tabular and data models act as a bridge between the
complexities of back-end data sources and your
perspective of the data

CREATE POWER VIEW REPORT
1
Insert a Power View Report from the INSERT menu
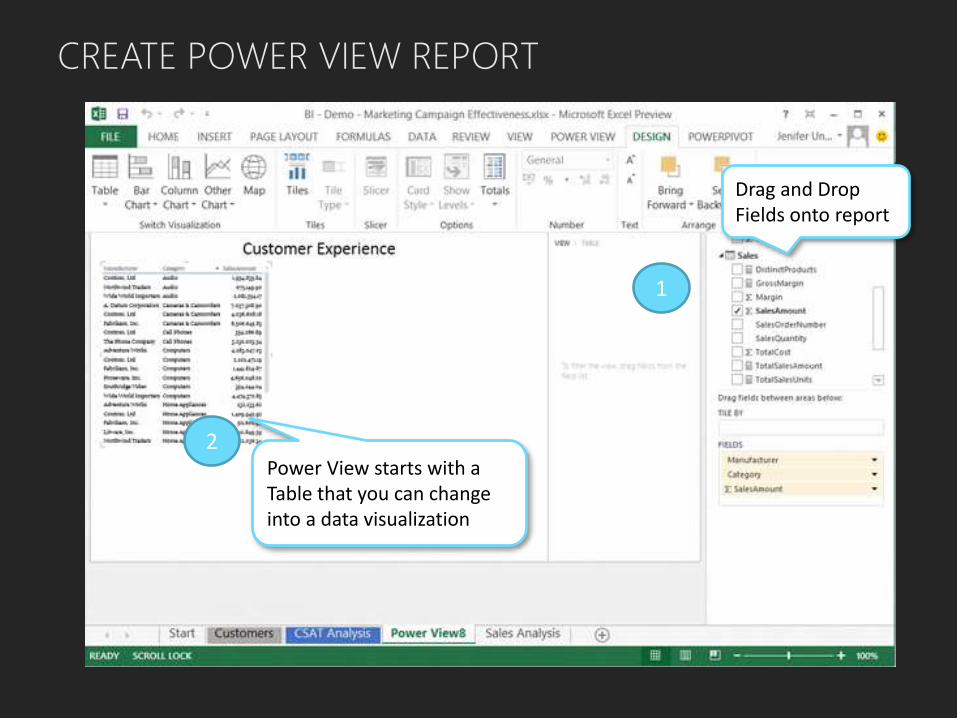
CREATE POWER VIEW REPORT
1
Drag and DropFields onto report
2Power View starts with a Table that you can change into a data visualization

CREATE DATA VISUALIZATION
1
Select the table, click DESIGN menu and choose a Chart type
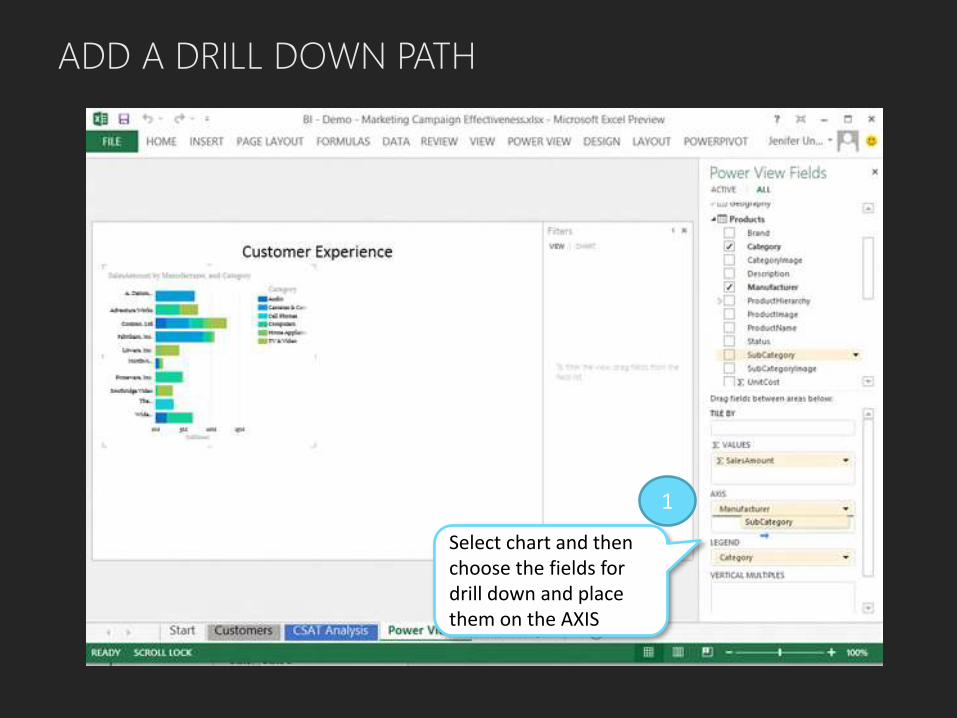
ADD A DRILL DOWN PATH
1
Select chart and then choose the fields for drill down and place them on the AXIS
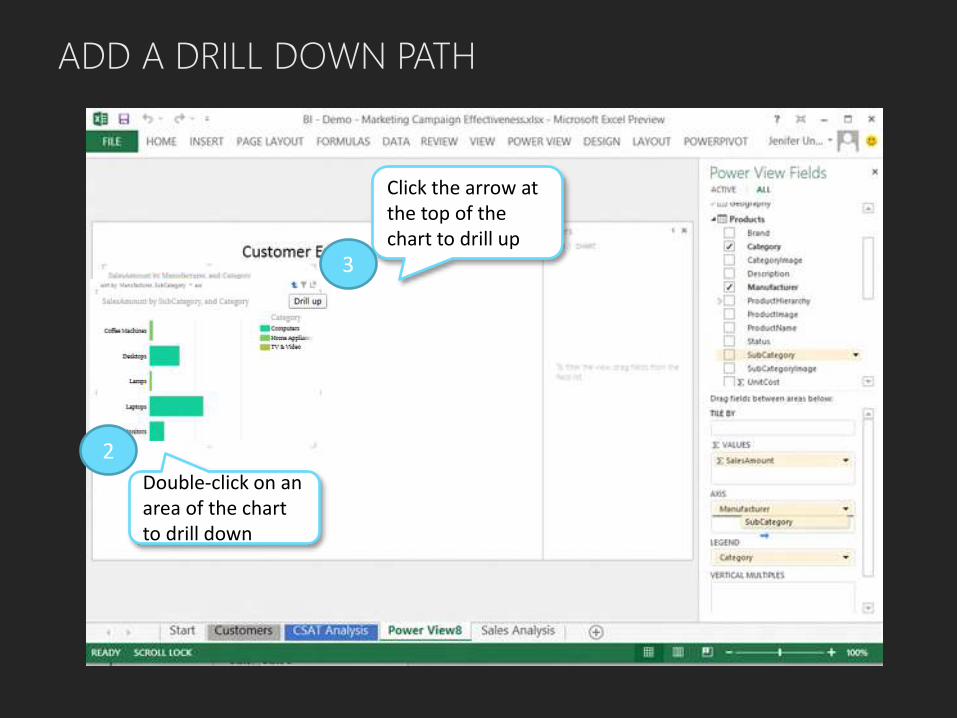
ADD A DRILL DOWN PATH
2
Double-click on an area of the chart to drill down
Click the arrow at the top of the chart to drill up
3

CREATE INTERACTIVE MAP
1
Select fields and drag to LOCATIONS
2 Select the table, click DESIGN menu and choose Map
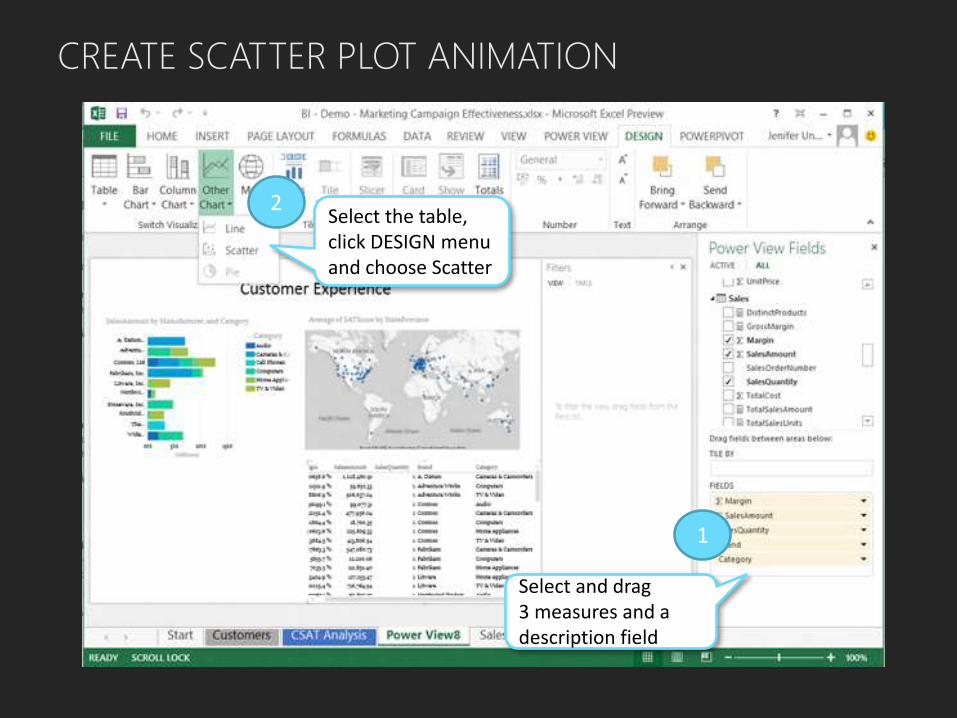
CREATE SCATTER PLOT ANIMATION
1
Select and drag 3 measures and a description field
2Select the table, click DESIGN menu and choose Scatter
1
Select and drag 3 measures and a description field
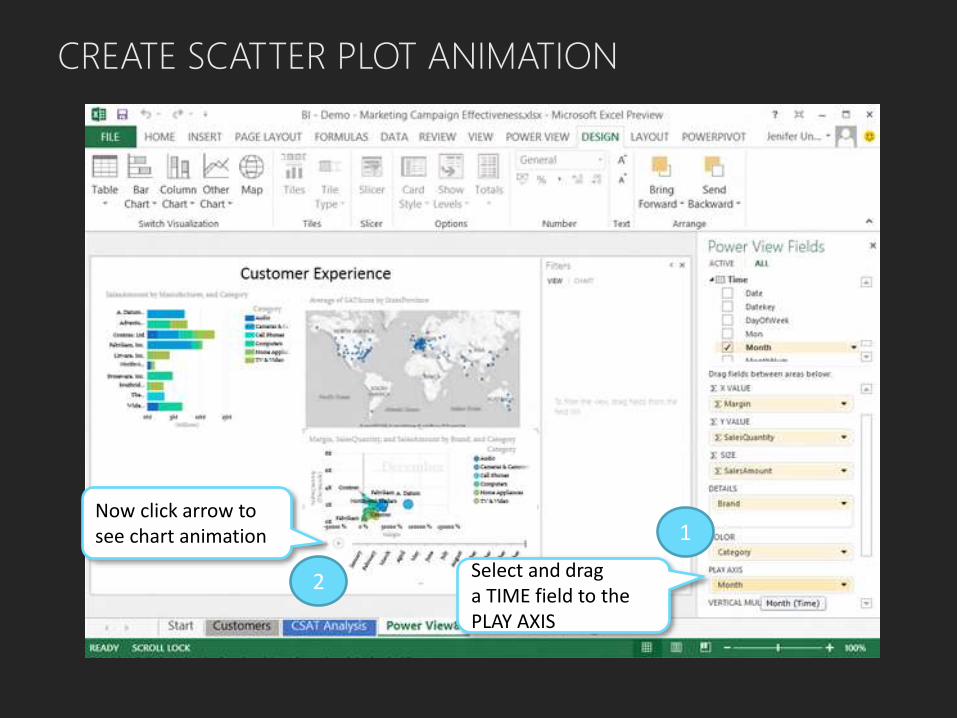
CREATE SCATTER PLOT ANIMATION
1
Select and drag a TIME field to the PLAY AXIS
Now click arrow to see chart animation
2

ADD A FILTER
1
Select and drag a field to the Filters area

ADD A FILTER
1
Adjust filters and view report

ZOOMING AND SORTING
At the top of every chart in Power
View there is a “Pop out” icon that
allows you to zoom that chart to
full screen size
There is also a “Sort By” option that
allows you to sort the data by a
selected field in Ascending or
Descending order
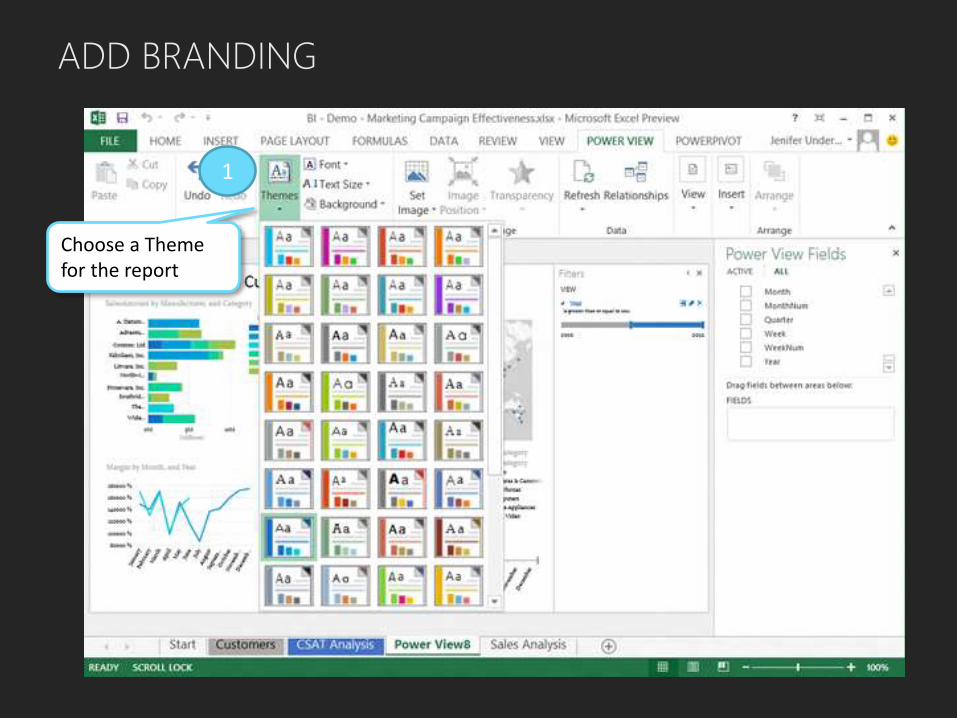
ADD BRANDING
1
Choose a Theme for the report

ADD BRANDING
1
Add a background image to the report

SAVE AND PUBLISH REPORT
• Power View reports can be saved simply by using the File > Save
menu options in Excel
• To publish a report, choose File > Save As or File > Share and choose
the publishing location

POWERPIVOT BASICS

GETTING STARTED
1
To Start PowerPivot, open Excel and click the PowerPivot tab
2
To start loading data from various sources, click the PowerPivot Window Launch icon.
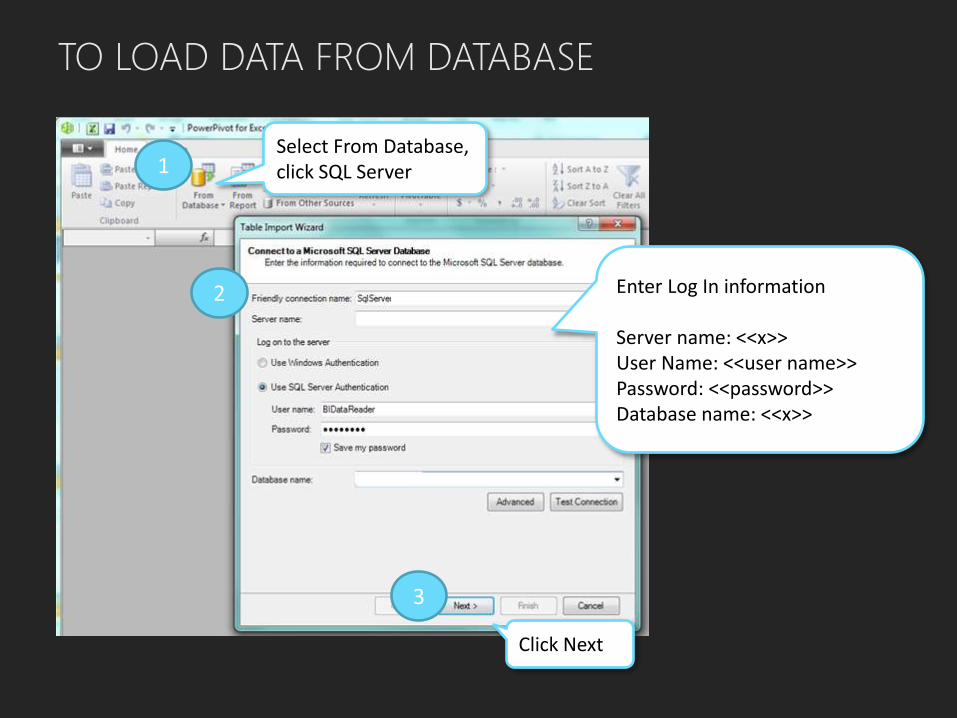
TO LOAD DATA FROM DATABASE
1Select From Database, click SQL Server
2 Enter Log In information
Server name: <<x>>User Name: <<user name>>Password: <<password>>Database name: <<x>>
3
Click Next
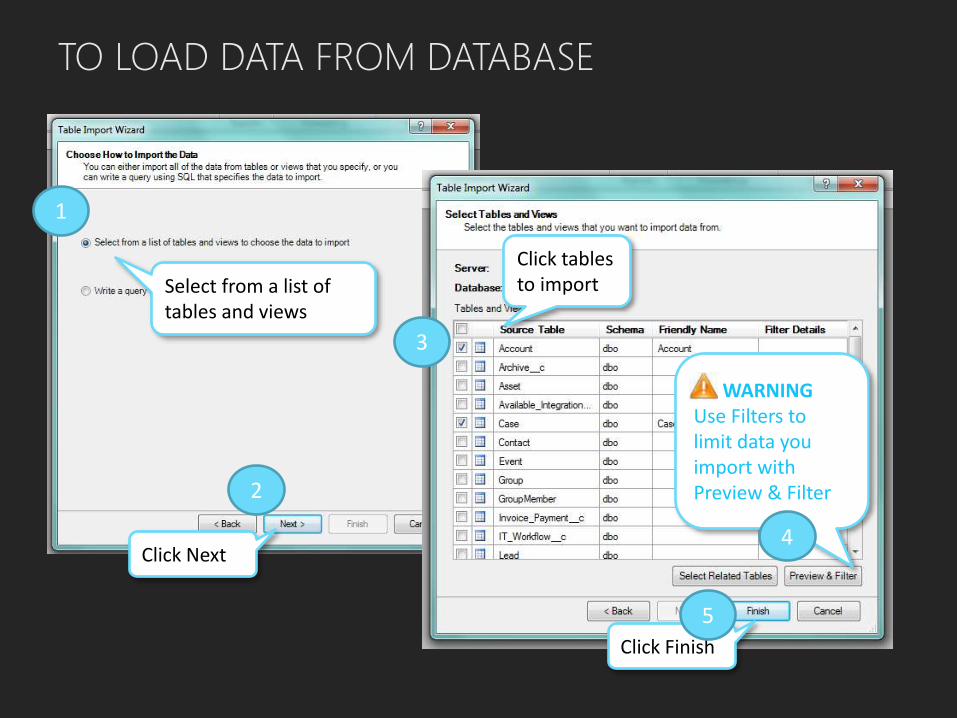
TO LOAD DATA FROM DATABASE
1
Select from a list of tables and views
2
Click Next
3
Click tables to import
Click Finish
WARNINGUse Filters to limit data you import with Preview & Filter
4
5

USING PREVIEW & FILTER
1 Select column drop down arrow to display Filter options
2 Choose Filter type
3
Enter Filter criteria
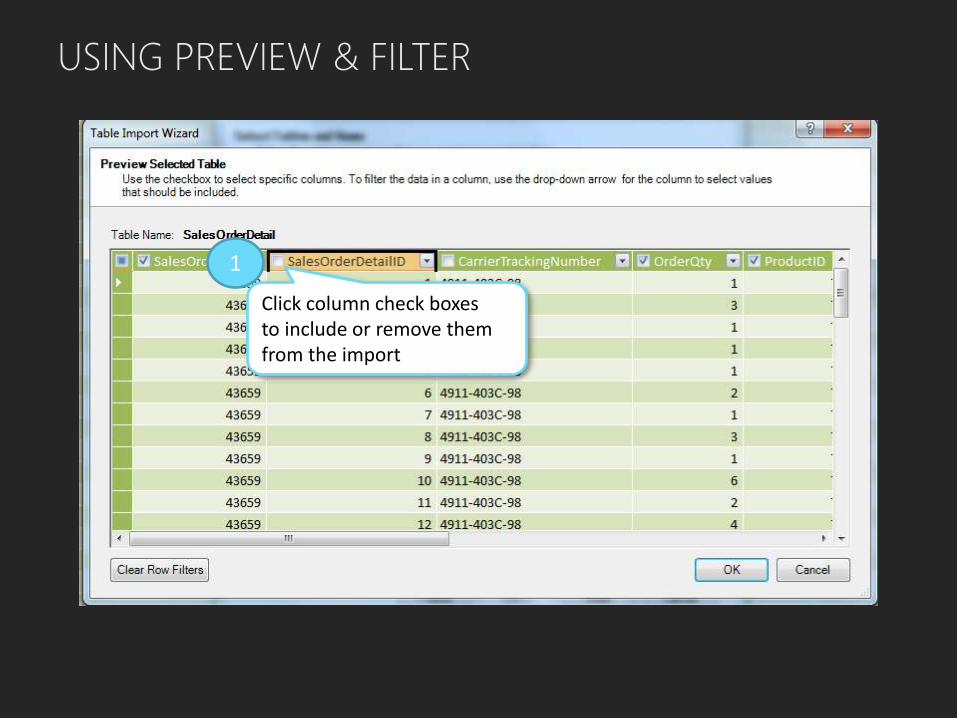
1
Click column check boxes to include or remove them from the import
USING PREVIEW & FILTER
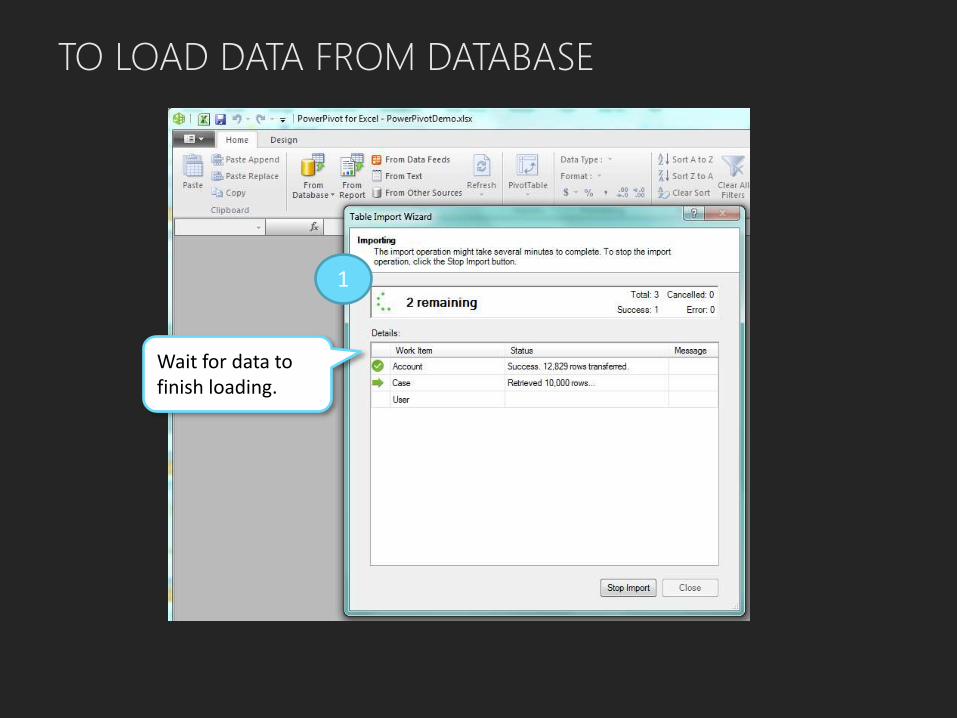
TO LOAD DATA FROM DATABASE
Wait for data to finish loading.
1

USING ADVANCED FILTERING
Select Write a Queryto have better Filter control or use advanced features
2
Click Next
1
Click Design for Visual Query Designer
3

Select table to Filter
2
Click OK
1
3
Click Run Query to Test
Select Field to Filter
Click Filter Icon
Define Filter criteria
4
6
5
USING ADVANCED FILTERING

Each Table loaded to a PowerPivot Worksheet
1
Unlike OLAP Cubes, PowerPivot data is not automatically refreshed. It is copied. To Refresh data, click the Refresh icon.
2
TO LOAD DATA FROM DATABASE

CREATE RELATIONSHIPS
Click Design tab
12
Click Manage Relationships
CREATE RELATIONSHIPS
• A relationship is a connection between two
data sources that establishes how data should
be correlated together in PowerPivot
• Relationships join data together from unrelated sources
• For example, Employee ID might be a value that uniquely identifies an
employee and that ID could be related to various payroll, HR and expense
reporting systems
• In a perfect world Employee ID would be the same in all the systems for
enabling PowerPivot automatic relationship detection
• In reality intermediate mapping tables are often used to cross reference
Employee ID in one system to another system Employee ID value;
mapping tables need to be imported into PowerPivot to relate systems
that do not have exact matching identifiers
• Some relationships are created automatically in data imports while
others require manual creation in PowerPivot

CREATE RELATIONSHIPS
Requires a unique identifier, non-repeating rows
Link to unique identifiers, can be repeated
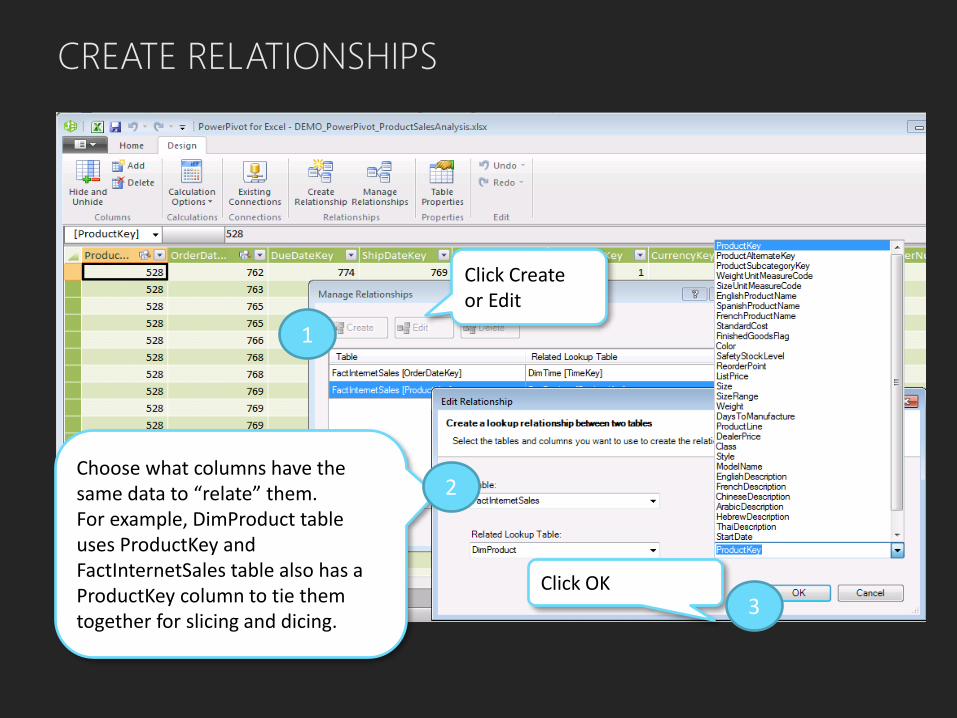
Click Create or Edit
1
CREATE RELATIONSHIPS
Choose what columns have the same data to “relate” them. For example, DimProduct table uses ProductKey and FactInternetSales table also has a ProductKey column to tie them together for slicing and dicing.
2
Click OK3

CREATE RELATIONSHIPS
New Diagram View in “Denali” PowerPivot 1
2
Drag and drop to Create Relationships or Hierarchies
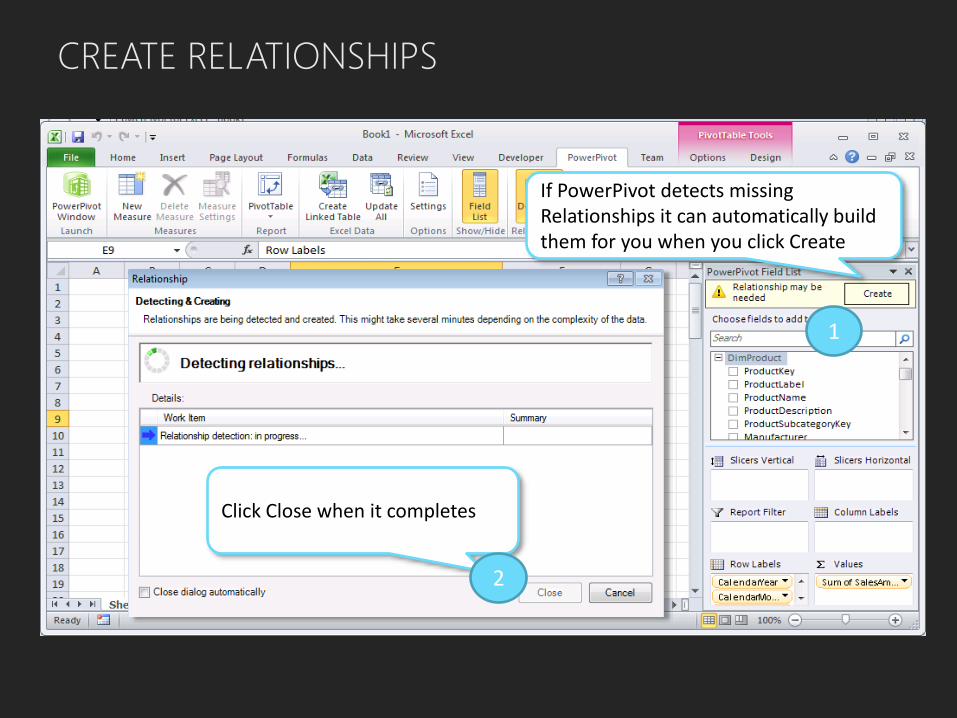
If PowerPivot detects missing Relationships it can automatically build them for you when you click Create
Click Close when it completes
1
2
CREATE RELATIONSHIPS
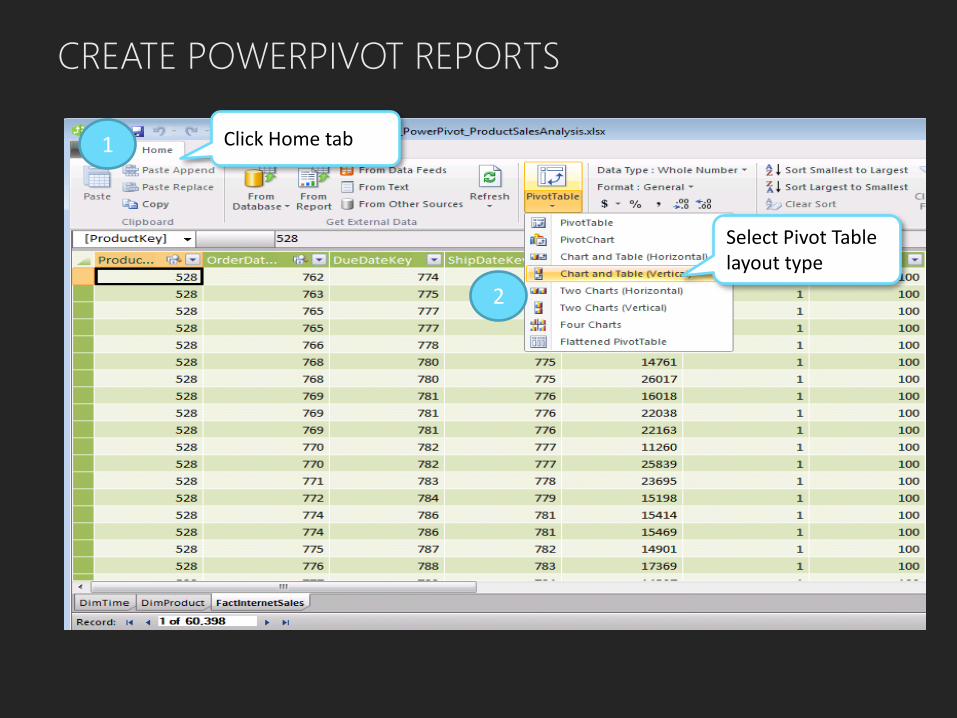
1 Click Home tab
2
Select Pivot Table layout type
CREATE POWERPIVOT REPORTS

1
Pick field for “Power” Pivoting
NOTEAll fields are nowavailable for drag and drop reporting!
CREATE POWERPIVOT REPORTS

1
Create interactive reports and charts
CREATE POWERPIVOT REPORTS
Insert Slicerfor dynamic filtering
3
Insert Chartsfor dynamic visuals
2
Apply Conditional Formatting or Sparklines
4
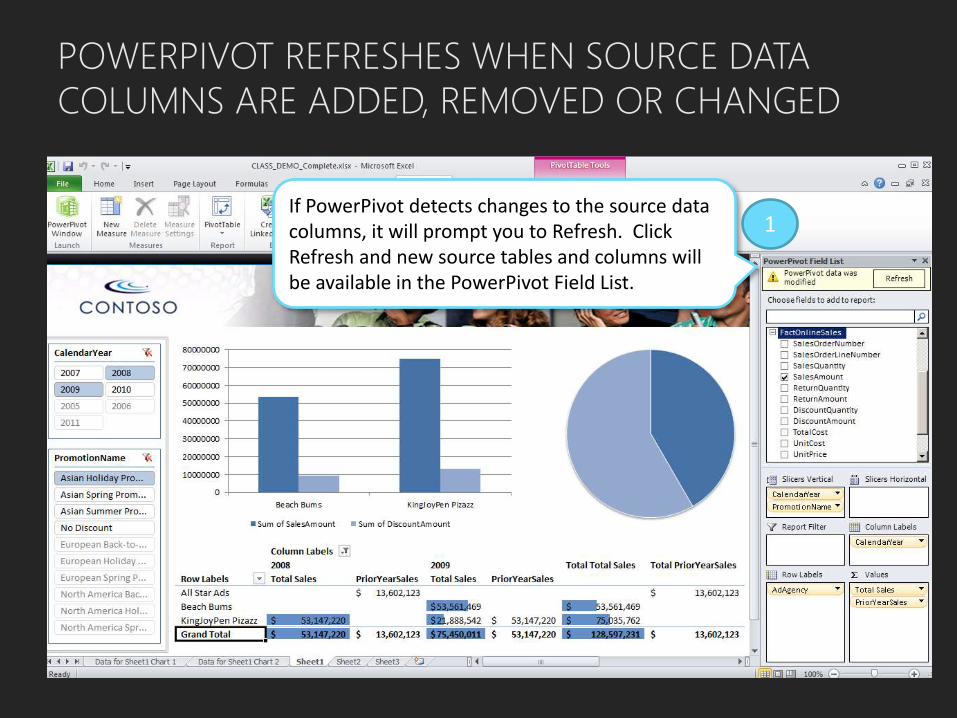
POWERPIVOT REFRESHES WHEN SOURCE DATA COLUMNS ARE ADDED, REMOVED OR CHANGED
If PowerPivot detects changes to the source data columns, it will prompt you to Refresh. Click Refresh and new source tables and columns will be available in the PowerPivot Field List.
1
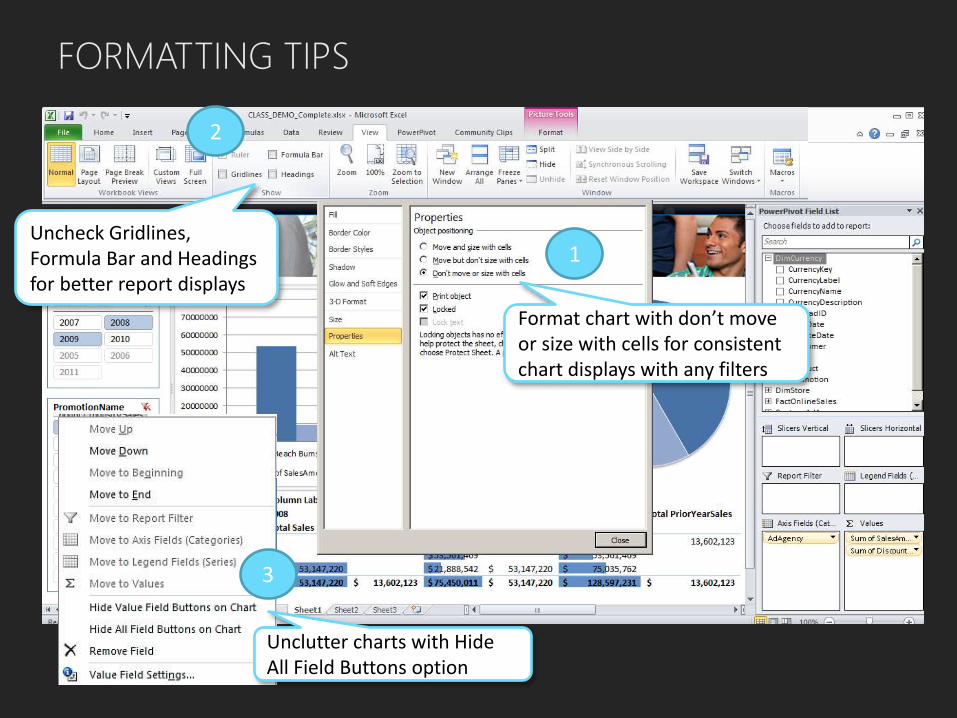
FORMATTING TIPS
1
Format chart with don’t move or size with cells for consistent chart displays with any filters
Uncheck Gridlines, Formula Bar and Headings for better report displays
2
3
Unclutter charts with Hide All Field Buttons option

CREATE AND MANAGE SETS
1 Create and Manage Custom sets with Pivot Table Options
Define and Name Custom Set
2
Toggle off filtered items in totals
3
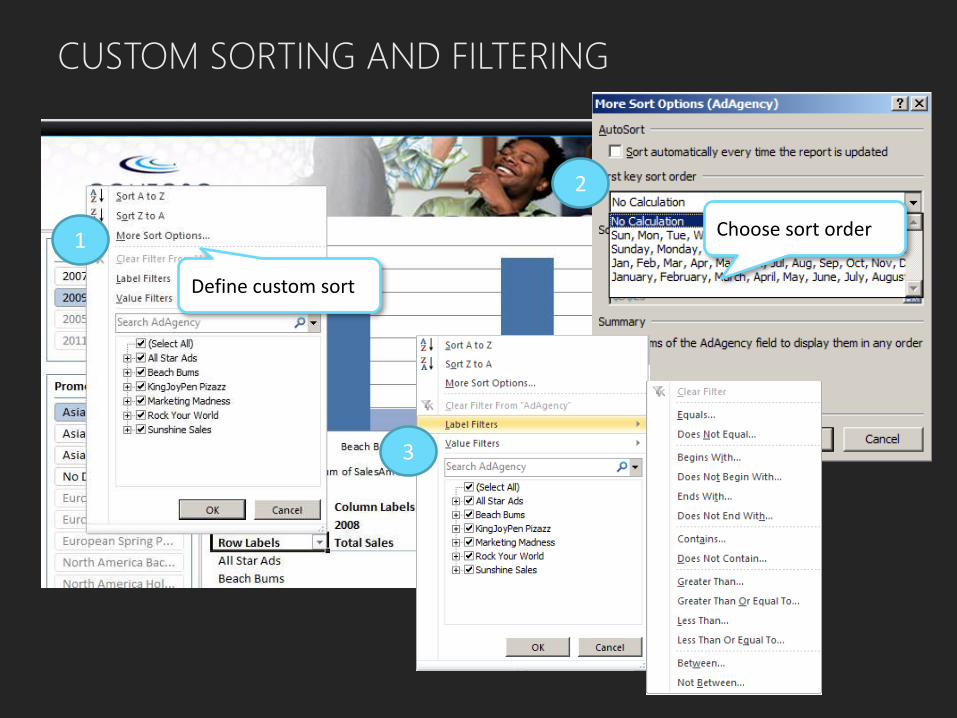
CUSTOM SORTING AND FILTERING
1
2
Define custom sort
Choose sort order
3
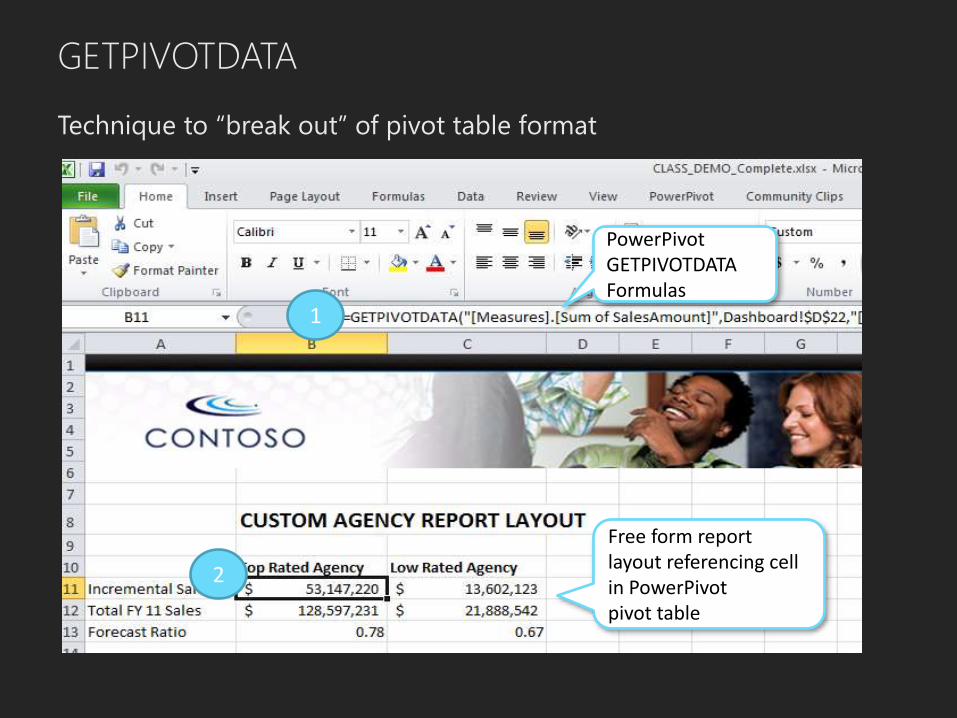
GETPIVOTDATA
Technique to “break out” of pivot table format
PowerPivot GETPIVOTDATA Formulas
Free form report layout referencing cell in PowerPivot pivot table
1
2

CONVERT TO FORMULAS
Pivot Table OptionsConvert to Formulas
1
2

LOADING ADDITIONAL DATA TO MASH UP
• Loading data using simple copy and paste
• Loading data from an MS Word table
• Loading data from text files
• Loading data from Excel files
• Loading data other types of data sources
−SQL Server, Oracle, Teradata, Sybase, Informix, IBM DB2
−OLEDB and ODBC
−Analysis Services Cubes
−Data Feeds
−SAP or SAP BW
• Loading data from Reporting Services Reports
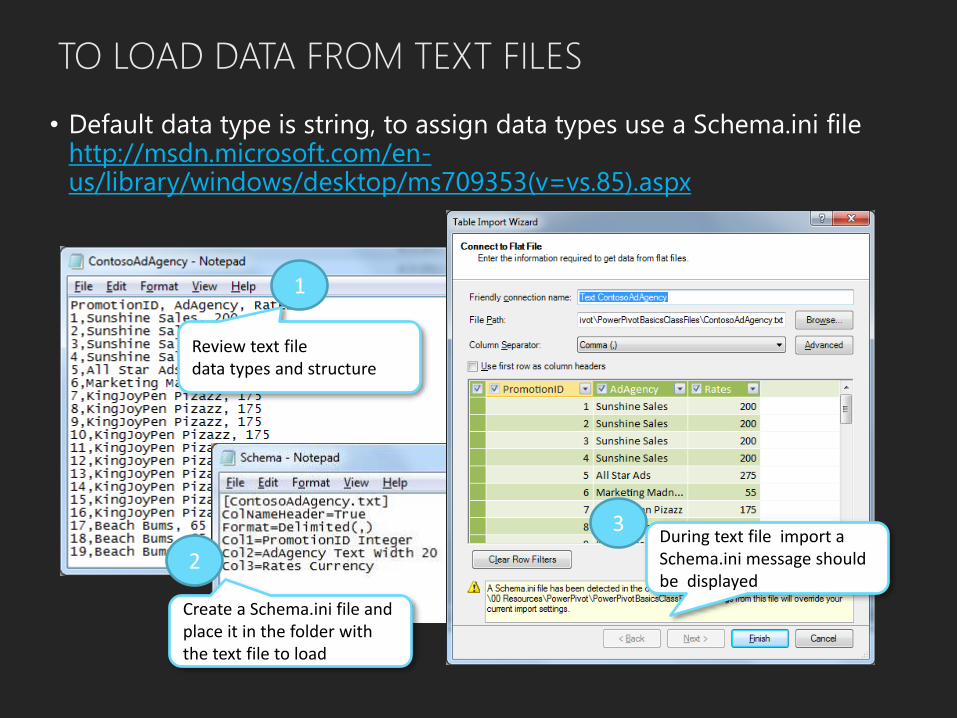
TO LOAD DATA FROM TEXT FILES
http://msdn.microsoft.com/en-us/library/windows/desktop/ms709353(v=vs.85).aspx
Review text file data types and structure
1
Create a Schema.ini file and place it in the folder with the text file to load
2
3During text file import a Schema.ini message should be displayed
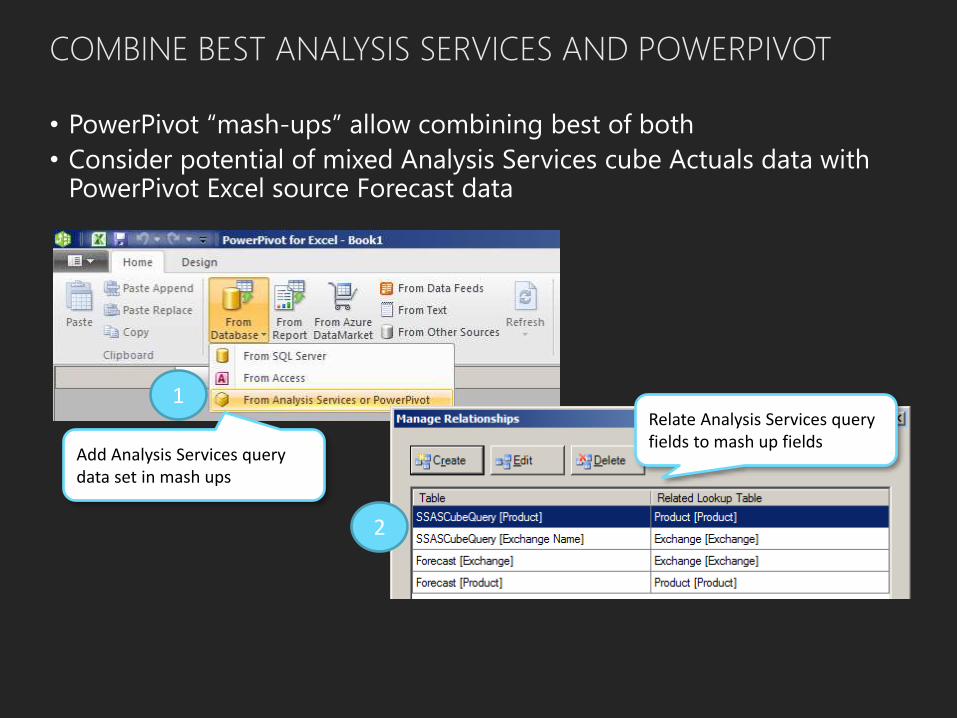
COMBINE BEST ANALYSIS SERVICES AND POWERPIVOT
Add Analysis Services query data set in mash ups
1
2
Relate Analysis Services query fields to mash up fields

TO LOAD, LINK AND USE AN EXTERNAL LIST
1
3
Click the PowerPivot tab
Select all the cells in the list
2
Create a list that contains a column that has the same content as a column in the other data sources in a new worksheet in the same PowerPivot workbook.
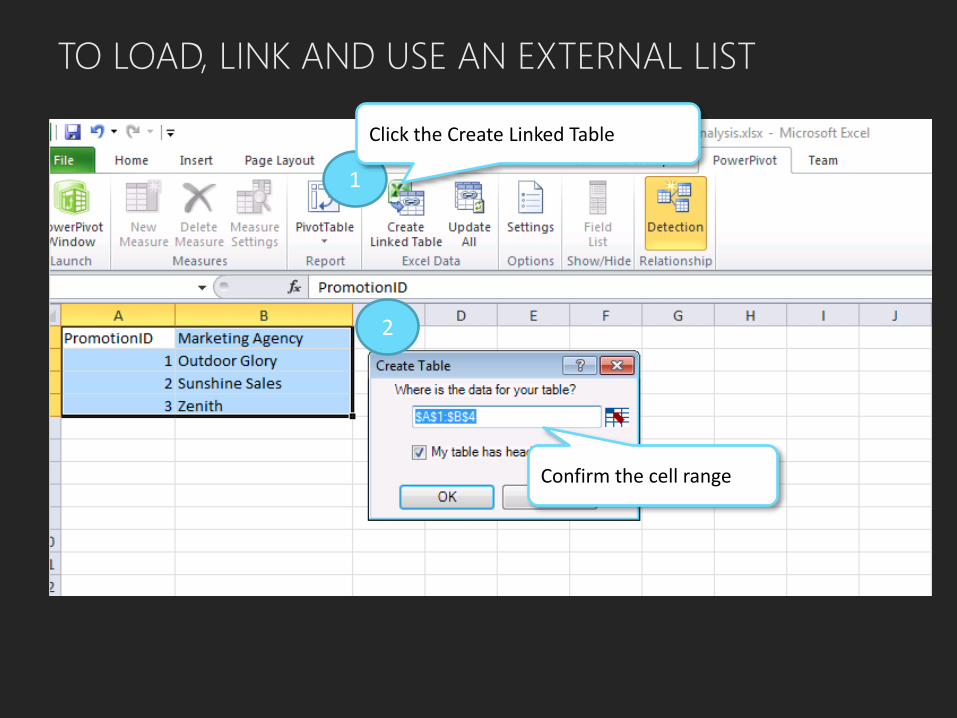
TO LOAD, LINK AND USE AN EXTERNAL LIST
1
Click the Create Linked Table
2
Confirm the cell range
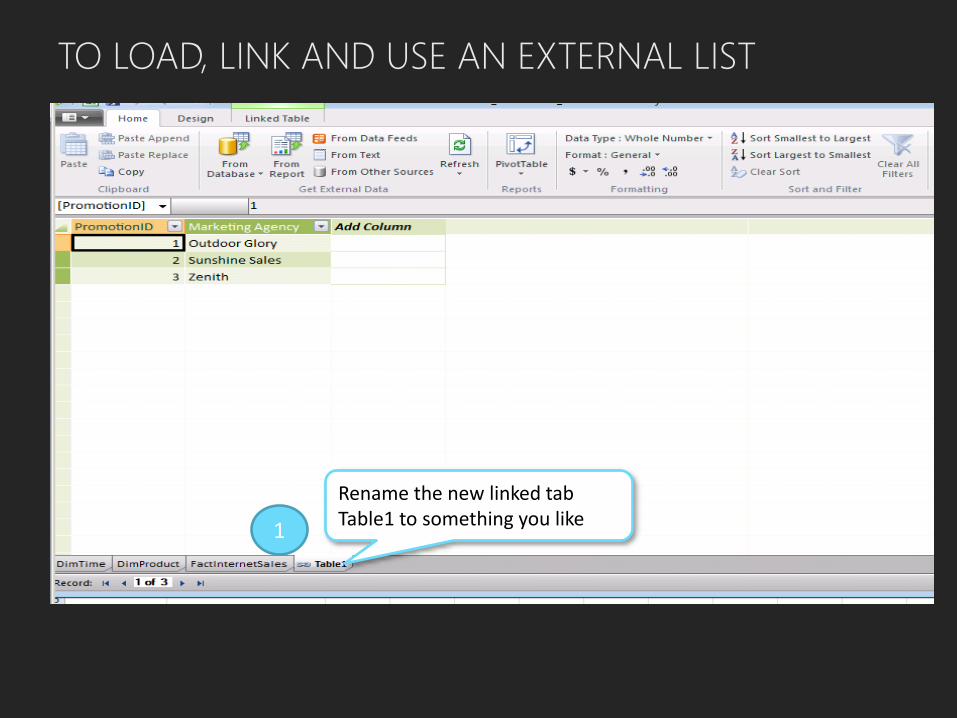
TO LOAD, LINK AND USE AN EXTERNAL LIST
1
Rename the new linked tab Table1 to something you like

TO LOAD, LINK AND USE AN EXTERNAL LIST
3
Choose what columns have the same data to “relate” them. For this example, PromotionKey matches PromotionID.
5
Click Create
Click Design tab1
2 Click Manage Relationships
Click Create to add your list
4

TO LOAD, LINK AND USE AN EXTERNAL LIST
Optionally “Hide” unfriendly columns by clicking Hide and Unhide
1
2
Choose fields to Hide in Pivot Table
3
Click OK

TO LOAD, LINK AND USE AN EXTERNAL LIST
1
Click Home tab
2Select Pivot Table layout type
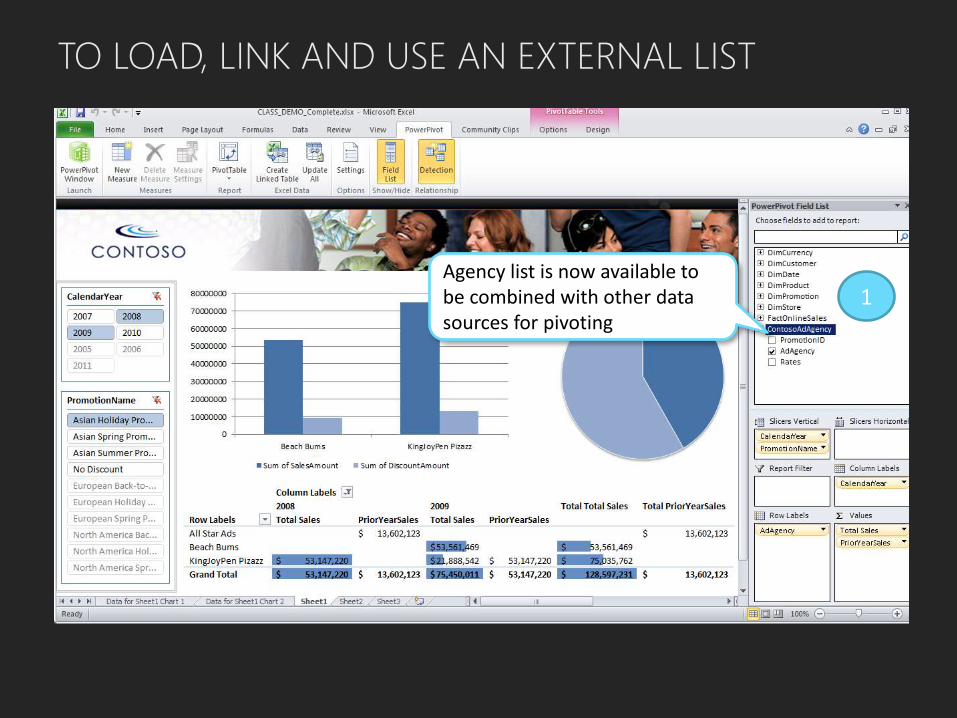
TO LOAD, LINK AND USE AN EXTERNAL LIST
Agency list is now available to be combined with other data sources for pivoting
1

LINKING TO MULTIPLE PIVOT OBJECTS
2
Right-click Slicer and select PivotTable Connections
3
Choose the Pivot Tables you want the Slicer to dynamically filter
Select Slicer Tools and Slicer Settings or click PivotTable Connections
1

TO ADD A DAX CALCULATED MEASURE
3
Click New Measure
Enter Measure Settings and add a Formula
1
2
New Measure is now available with a Calculator icon

VIEWING AND EDITING DATA SOURCES
Select Source
Click Open to change queries/tables and Edit to change data source
1
2

DAX EXPRESSIONS
Enter a DAX expressionidentified by prompt “expression evaluated for each row in a table”
2
Click Add Column1

DAX EXPRESSIONS
Example PREVIOUSYEARDAX formula syntax
1

DAX EXPRESSIONS
INFORMATION FUNCTIONS
• ISBLANK(<value>)
• ISERROR(<value>)
• ISLOGICAL(<value>)
• ISNONTEXT(<value>)
• ISNUMBER(<value>)
• ISTEXT(<value>)
FILTER AND VALUE FUNCTIONS
• ALL(<table_or_column>)
• ALLEXCEPT(<table>,column1>,<column2>,…)
• BLANK()
• CALCULATE(<expression>,<filter>,<filter>…)
• CALCULATETABLE( <expression>, <filter>…)
• DISTINCT(<column>)
• EARLIER(<column>, <number>)
• EARLIEST(<table_or_column>)
• FILTER(<table>,<filter>)
• RELATED(<column>)
• RELATEDTABLE(<table>)
• VALUES(<column>)
• FIRSTNONBLANK(<column>,<expression>)
http://powerpivot-info.com/post/53-list-of-powerpivot-dax-functions-short

DAX EXPRESSIONS
TIME INTELLIGENCE
• DATESINPERIOD(<date_column>…)
• DATESBETWEEN(<column>,<start_date>…)
• DATEADD(<date_column>,…)
• FIRSTDATE (<datecolumn>)
• LASTDATE (<datecolumn>)
• LASTNONBLANK (<datecolumn>,…)
• STARTOFMONTH (<date_column>)
• STARTOFYEAR(<date_column>[,<YE_date>])
• ENDOFMONTH(<date_column>)
• ENDOFYEAR(<date_column>)
• PARALLELPERIOD(<date_column>,…)
• PREVIOUSDAY(<date_column>)
• PREVIOUSMONTH(<date_column>)
• PREVIOUSYEAR(<date_column>)
• NEXTDAY(<date_column>)
• NEXTMONTH(<date_column>)
• NEXTYEAR(<date_column>[,<YE_date>])
• DATESMTD(<date_column>)
• DATESQTD (<date_column>)
• DATESYTD (<date_column> [,<YE_date>])
http://powerpivot-info.com/post/53-list-of-powerpivot-dax-functions-short
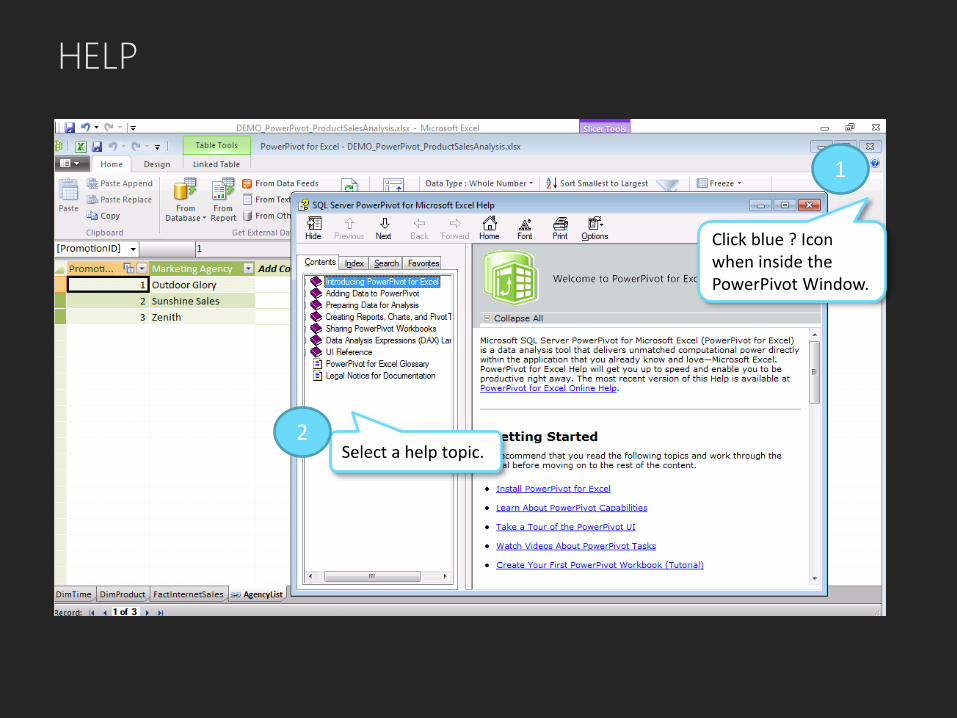
HELP
1
Click blue ? Icon when inside the PowerPivot Window.
Select a help topic.2

HELP
1Go to http://www.powerpivot.com
Watch videos and review other help sources

GOOD POWERPIVOT WEB SITES AND BOOKS
• http://www.PowerPivot.com• http://powerpivot-info.com• http://powerpivotgeek.com• http://powerpivotpro.com• http://blogs.msdn.com/powerpivot
https://datamarket.azure.com