Power & Scale – Daiwa Securities Group Business … · uncertainties that could cause the Daiwa...
33
– Power & Scale – Daiwa Securities Group Business Strategy Autumn 2005 Daiwa Securities Group Inc. This presentation may contain forward-looking statements about the Daiwa Securities Group. You can identify these statements by the fact that they do not relate strictly to historic or current facts. These statements discuss future expectations, identify strategies, contain projections of results of operations or of financial condition or state other “forward-looking”information. These statements are based on currently available information and represent the beliefs of the management of the Daiwa Securities Group. These statements are subject to numerous risks and uncertainties that could cause the Daiwa Securities Group’s actual results, performance, achievements or financial condition to differ materially from those described or implied in the forward-looking statements. The Daiwa Securities Group undertakes no obligation to publicly update any forward-looking statements after the date of this presentation. These potential risks and uncertainties include, but are not limited to: competition within the financial services industries in Japan and overseas, our ability to adjust our business focus and to maintain profitable strategic alliances, volatile and sudden movements in the international securities markets, foreign exchange and global economic situations affecting the Daiwa Securities Group.
-
Upload
dinhkhuong -
Category
Documents
-
view
215 -
download
0
Transcript of Power & Scale – Daiwa Securities Group Business … · uncertainties that could cause the Daiwa...
– Power & Scale –Daiwa Securities Group Business Strategy
Autumn 2005 Daiwa Securities Group Inc.
This presentation may contain forward-looking statements about the Daiwa Securities Group. You can identify these statements by the fact that they do not relate strictly to historic or current facts. These statements discuss future expectations, identify strategies, contain projections of results of operations or of financial condition or state other “forward-looking”information. These statements are based on currently available information and represent the beliefs of the management of the Daiwa Securities Group. These statements are subject to numerous risks and uncertainties that could cause the Daiwa Securities Group’s actual results, performance, achievements or financial condition to differ materially from those described or implied in the forward-looking statements. The Daiwa Securities Group undertakes no obligation to publicly update any forward-looking statements after the date of this presentation. These potential risks and uncertainties include, but are not limited to: competition within the financial services industries in Japan and overseas, our ability to adjust our business focus and to maintain profitable strategic alliances, volatile and sudden movements in the international securities markets, foreign exchange and global economic situations affecting the Daiwa Securities Group.
2
Table of Contents
Achievements in 1H FY2005 ・ ・ ・ ・ 3
Wholesale business ・ ・ ・ ・ 8
Retail business ・ ・ ・ ・ 13
Corporate value enhancement ・ ・ ・ ・ 29
3
Our strategies have started to bring tangible results
Our strategies have started to bring tangible results
Our Achievements in 1H FY2005
4
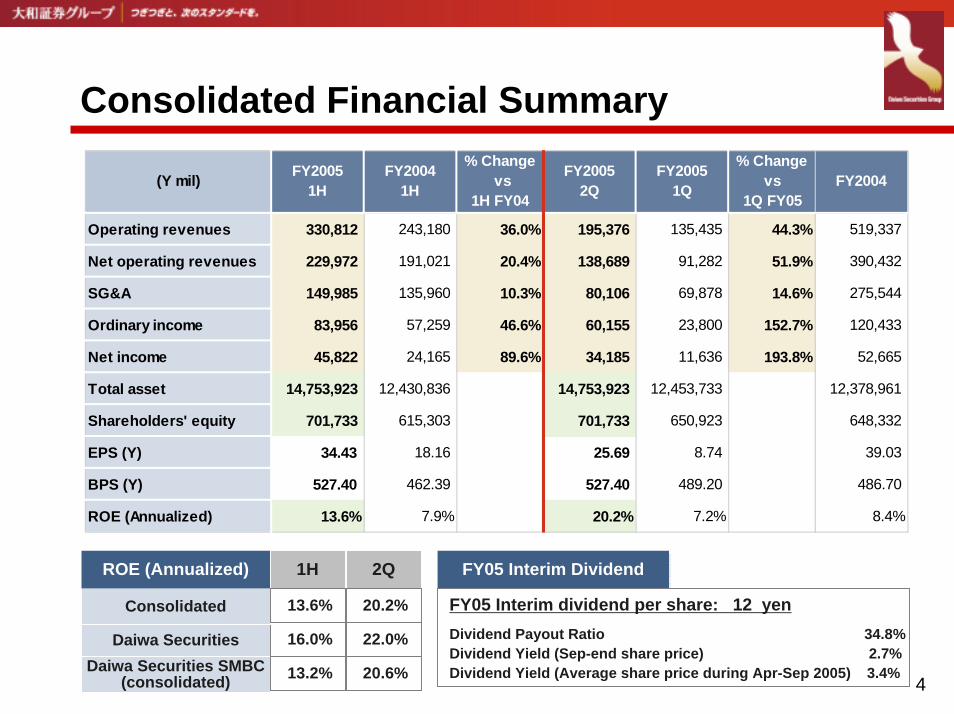
Consolidated Financial Summary
Operating revenues 330,812 243,180 36.0% 195,376 135,435 44.3% 519,337
Net operating revenues 229,972 191,021 20.4% 138,689 91,282 51.9% 390,432
SG&A 149,985 135,960 10.3% 80,106 69,878 14.6% 275,544
Ordinary income 83,956 57,259 46.6% 60,155 23,800 152.7% 120,433
Net income 45,822 24,165 89.6% 34,185 11,636 193.8% 52,665
Total asset 14,753,923 12,430,836 14,753,923 12,453,733 12,378,961
Shareholders' equity 701,733 615,303 701,733 650,923 648,332
EPS (Y) 34.43 18.16 25.69 8.74 39.03
BPS (Y) 527.40 462.39 527.40 489.20 486.70
ROE (Annualized) 13.6% 7.9% 20.2% 7.2% 8.4%
(Y mil) FY20041H
FY20051H FY2004FY2005
2QFY2005
1Q
% Changevs
1Q FY05
% Change vs
1H FY04
22.0%Daiwa Securities
20.6%Daiwa Securities SMBC (consolidated)
2Q
16.0%
13.2%
1H
20.2%Consolidated 13.6%
FY05 Interim DividendFY05 Interim DividendROE (Annualized)
FY05 Interim dividend per share: 12 yenDividend Payout Ratio 34.8%Dividend Yield (Sep-end share price) 2.7%Dividend Yield (Average share price during Apr-Sep 2005) 3.4%
5
Highlights of Consolidated EarningsResults achieved by building a strong business foundation ROE above 10%
Results achieved by building a strong business foundation ROE above 10%
0
50
100
150
200
250
1H/02 2H/02 1H/03 2H/03 1H/04 2H/04 1H/050
3
6
9
12
15
Net operating revenues Ordinary income ROE (right)
(Y bil) (%)
ROE 13.6%
Consolidated Revenues and Ordinary Income
6
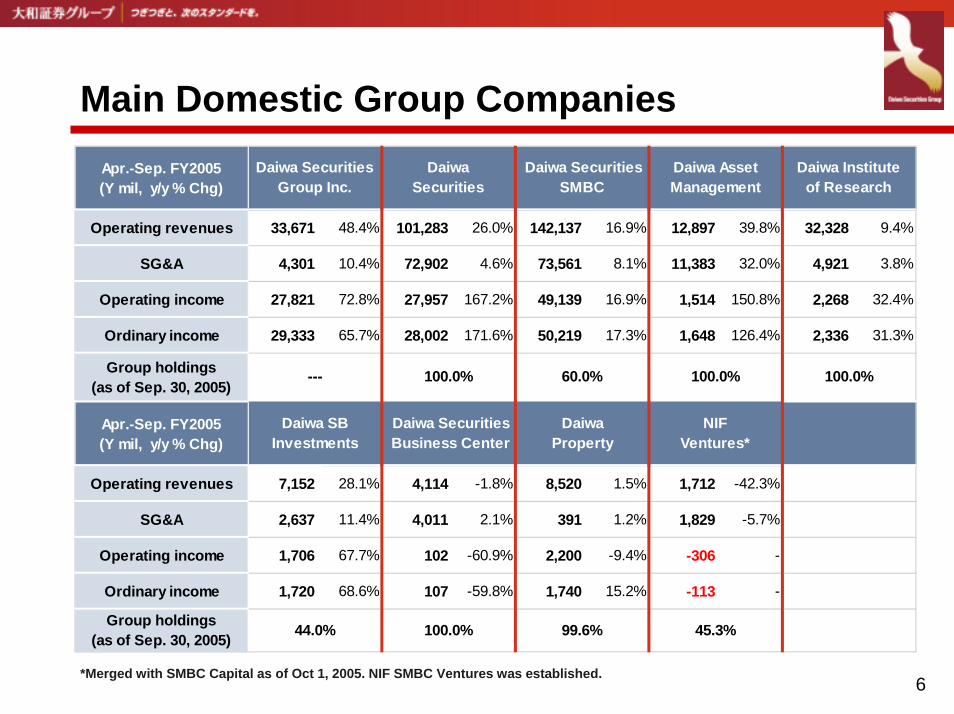
Main Domestic Group CompaniesApr.-Sep. FY2005(Y mil, y/y % Chg)
Operating revenues 33,671 48.4% 101,283 26.0% 142,137 16.9% 12,897 39.8% 32,328 9.4%
SG&A 4,301 10.4% 72,902 4.6% 73,561 8.1% 11,383 32.0% 4,921 3.8%
Operating income 27,821 72.8% 27,957 167.2% 49,139 16.9% 1,514 150.8% 2,268 32.4%
Ordinary income 29,333 65.7% 28,002 171.6% 50,219 17.3% 1,648 126.4% 2,336 31.3%
Group holdings(as of Sep. 30, 2005)
Apr.-Sep. FY2005(Y mil, y/y % Chg)
Operating revenues 7,152 28.1% 4,114 -1.8% 8,520 1.5% 1,712 -42.3%
SG&A 2,637 11.4% 4,011 2.1% 391 1.2% 1,829 -5.7%
Operating income 1,706 67.7% 102 -60.9% 2,200 -9.4% -306 -
Ordinary income 1,720 68.6% 107 -59.8% 1,740 15.2% -113 -
Group holdings(as of Sep. 30, 2005) 44.0% 100.0% 99.6% 45.3%
100.0% 60.0% 100.0% 100.0%
Daiwa SecuritiesSMBC
Daiwa AssetManagement
Daiwa Instituteof Research
Daiwa SBInvestments
Daiwa Securities Business Center
DaiwaProperty
NIFVentures*
Daiwa SecuritiesGroup Inc.
DaiwaSecurities
---
*Merged with SMBC Capital as of Oct 1, 2005. NIF SMBC Ventures was established.
7
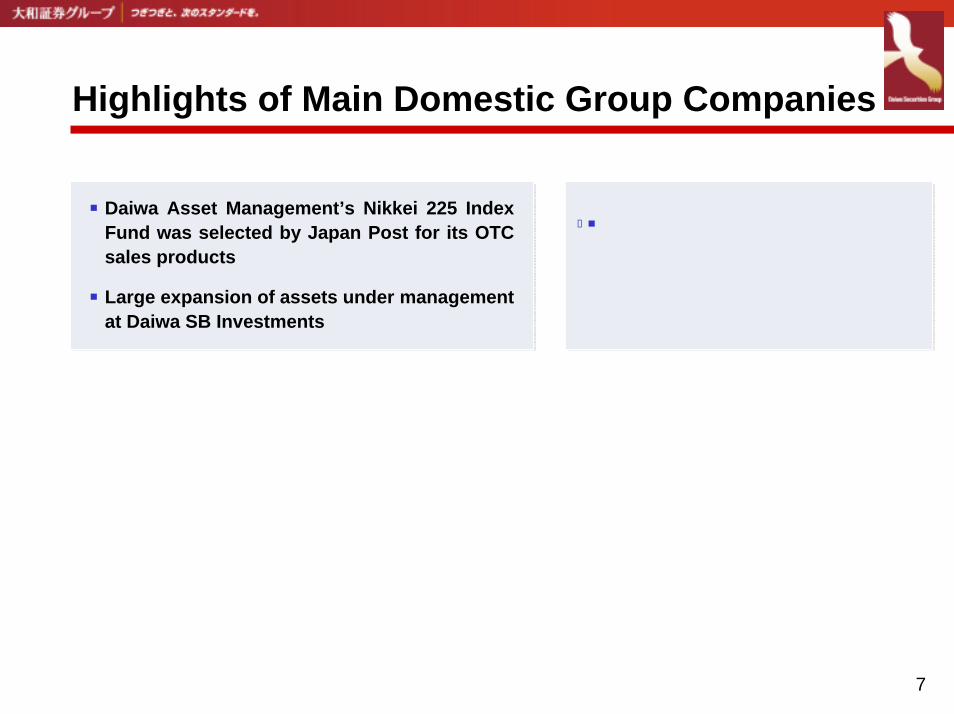
Highlights of Main Domestic Group Companies
Daiwa Asset Management’s Nikkei 225 Index Fund was selected by Japan Post for its OTC sales products
Large expansion of assets under management at Daiwa SB Investments
Daiwa Asset Management’s Nikkei 225 Index Fund was selected by Japan Post for its OTC sales products
Large expansion of assets under management at Daiwa SB Investments
Mainichi Economist magazine’sanalyst & economist ranking
Ranked No.1 for 3 years in a row
Mainichi Economist magazine’sanalyst & economist ranking
Ranked No.1 for 3 years in a row
Daiwa Asset Management, Daiwa SB InvestmentsDaiwa Asset Management, Daiwa SB Investments Daiwa Institute of ResearchDaiwa Institute of Research
Funds under Management (Daiwa AM, Daiwa SB Investments)Funds under Management (Daiwa AM, Daiwa SB Investments)
Merged with SMBC Capital (Oct. 1) NIF SMBC Ventures was established
Became one of the top venture capital firms
Merged with SMBC Capital (Oct. 1) NIF SMBC Ventures was established
Became one of the top venture capital firms
NIF SMBC VenturesNIF SMBC Ventures
0
5,000
10,000
15,000
0.0%
10.0%
20.0%
30.0%
40.0%
Daiwa SB Investment 2,505 2,687 3,303 3,664 3,599 3,907 3,901 3,948 4,590
Daiwa AM (MMF+MTGBF) 3,453 2,917 2,541 2,380 2,181 2,029 1,859 1,765 1,656
Daiwa AM (Bonds) 1,644 1,784 1,793 1,728 1,661 1,695 1,697 1,643 1,898
Daiwa AM (Equities) 1,228 1,438 1,612 1,895 1,901 2,064 2,118 2,452 2,879
Total 8,830 8,826 9,249 9,667 9,342 9,695 9,575 9,808 11,023
Daiwa AM share (right) 18.3% 16.5% 15.2% 15.2% 14.6% 14.1% 13.4% 13.0% 13.2%
3/03 9/03 3/04 6/04 9/04 12/04 3/05 6/05 9/05
(Y bil)
s
8
Wholesale
Significant increase in trading gainsIB issues expected to increase in latter halfLarge growth in private equity investments
Significant increase in trading gainsIB issues expected to increase in latter halfLarge growth in private equity investments
9
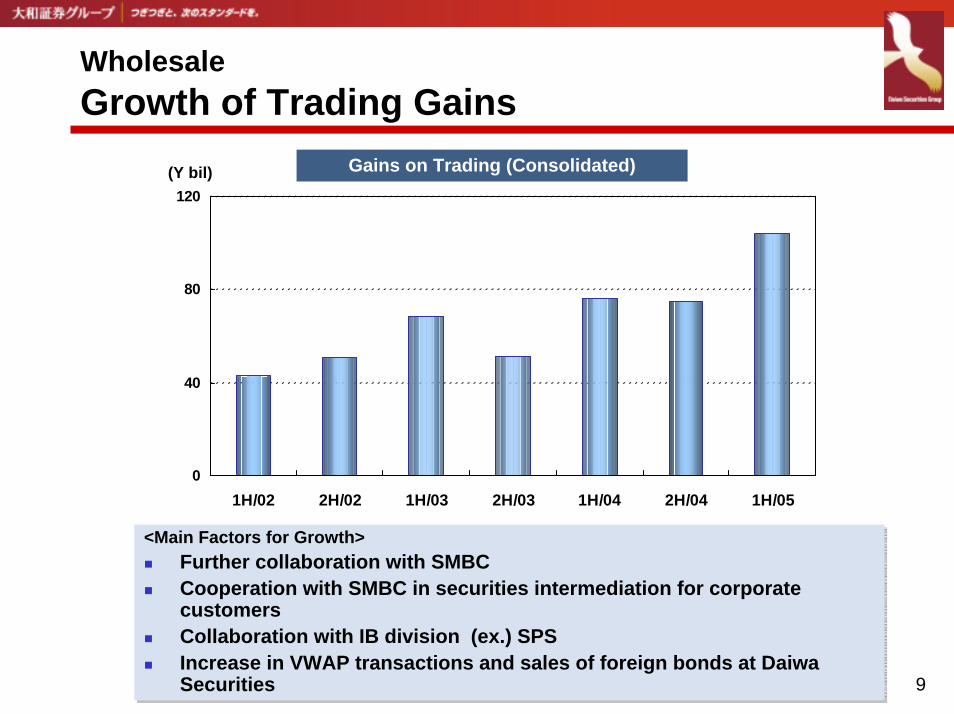
Wholesale Growth of Trading Gains
0
40
80
120
1H/02 2H/02 1H/03 2H/03 1H/04 2H/04 1H/05
Gains on Trading (Consolidated)(Y bil)
<Main Factors for Growth>Further collaboration with SMBC Cooperation with SMBC in securities intermediation for corporatecustomersCollaboration with IB division (ex.) SPS Increase in VWAP transactions and sales of foreign bonds at Daiwa Securities
<Main Factors for Growth>Further collaboration with SMBC Cooperation with SMBC in securities intermediation for corporatecustomersCollaboration with IB division (ex.) SPS Increase in VWAP transactions and sales of foreign bonds at Daiwa Securities
10
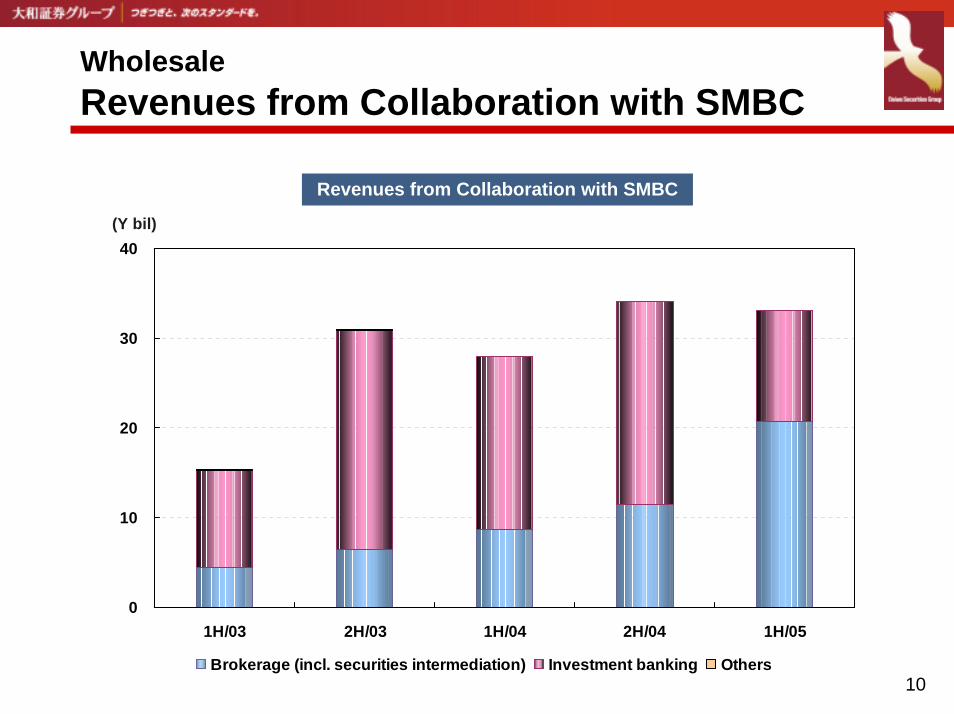
WholesaleRevenues from Collaboration with SMBC
Revenues from Collaboration with SMBC
(Y bil)
0
10
20
30
40
1H/03 2H/03 1H/04 2H/04 1H/05
Brokerage (incl. securities intermediation) Investment banking Others
11
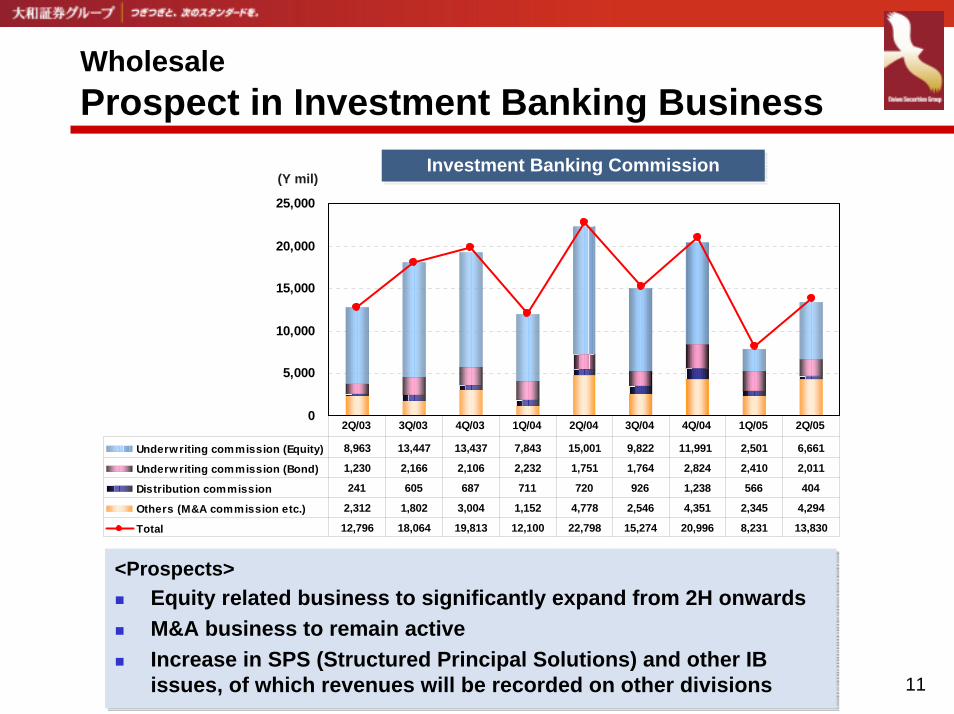
WholesaleProspect in Investment Banking Business
0
5,000
10,000
15,000
20,000
25,000
Underwriting commission (Equity) 8,963 13,447 13,437 7,843 15,001 9,822 11,991 2,501 6,661
Underwriting commission (Bond) 1,230 2,166 2,106 2,232 1,751 1,764 2,824 2,410 2,011
Distribution commission 241 605 687 711 720 926 1,238 566 404
Others (M&A commission etc.) 2,312 1,802 3,004 1,152 4,778 2,546 4,351 2,345 4,294
Total 12,796 18,064 19,813 12,100 22,798 15,274 20,996 8,231 13,830
2Q/03 3Q/03 4Q/03 1Q/04 2Q/04 3Q/04 4Q/04 1Q/05 2Q/05
(Y mil)Investment Banking CommissionInvestment Banking Commission
<Prospects>Equity related business to significantly expand from 2H onwardsM&A business to remain activeIncrease in SPS (Structured Principal Solutions) and other IB issues, of which revenues will be recorded on other divisions
<Prospects>Equity related business to significantly expand from 2H onwardsM&A business to remain activeIncrease in SPS (Structured Principal Solutions) and other IB issues, of which revenues will be recorded on other divisions
12
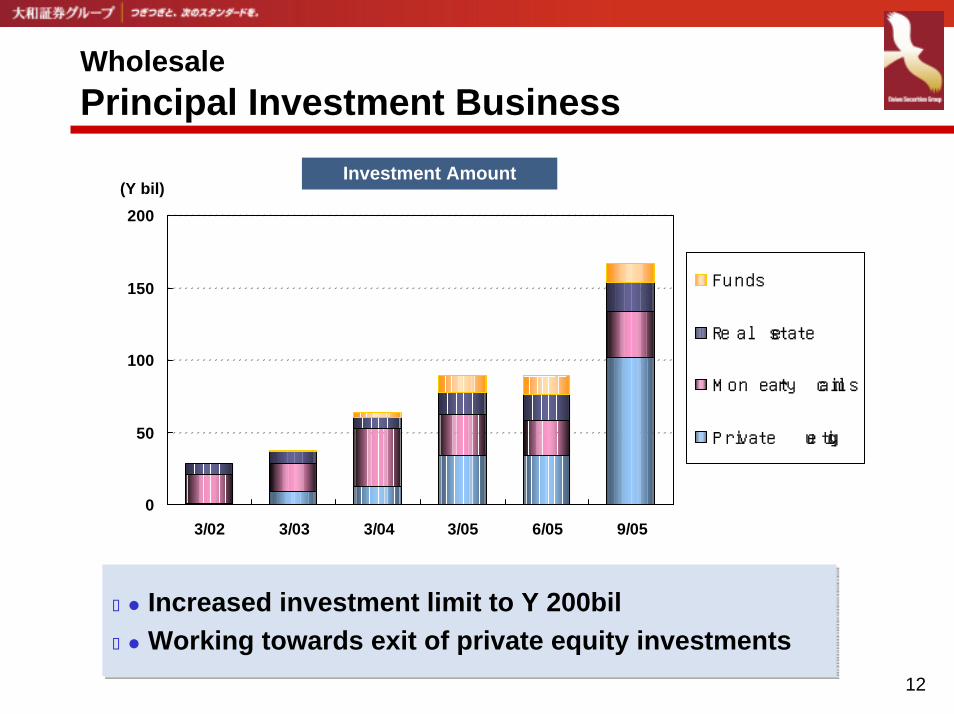
WholesalePrincipal Investment Business
0
50
100
150
200
3/02 3/03 3/04 3/05 6/05 9/05
Funds
Real estate
Monetary claims
Private equity
Investment Amount(Y bil)
Increased investment limit to Y 200bilWorking towards exit of private equity investmentsIncreased investment limit to Y 200bilWorking towards exit of private equity investments
13
Retail
Advance in Daiwa Direct (online trading)Continued expansion of Daiwa SMAProgress in increasing net customer assetsGrowth of agency commissions
Advance in Daiwa Direct (online trading)Continued expansion of Daiwa SMAProgress in increasing net customer assetsGrowth of agency commissions
14
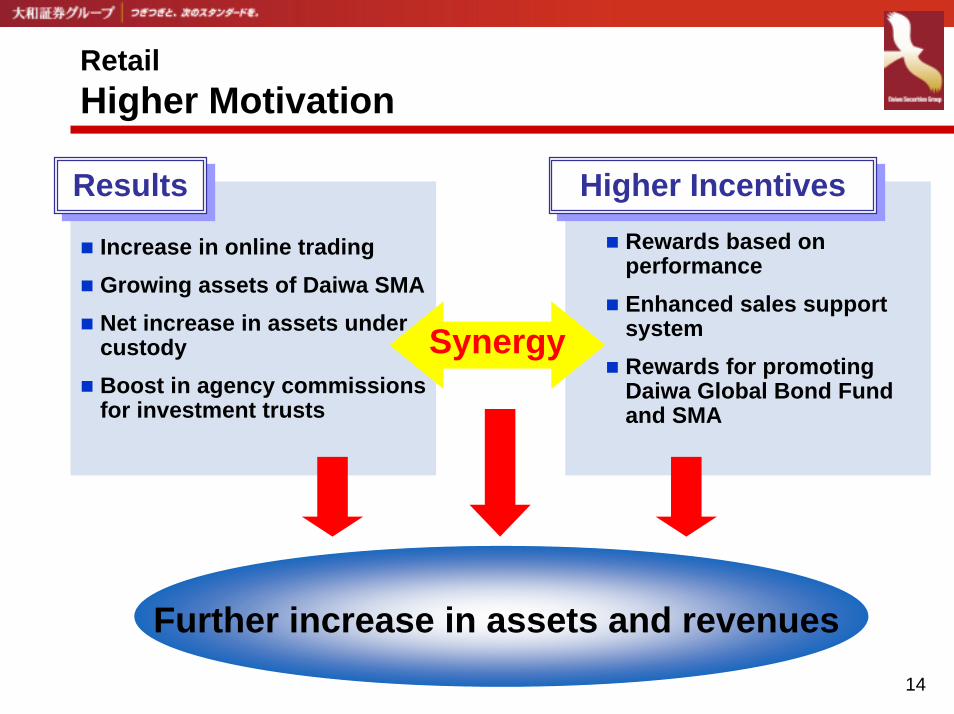
Retail Higher Motivation
Increase in online tradingGrowing assets of Daiwa SMANet increase in assets under custodyBoost in agency commissions for investment trusts
Rewards based on performanceEnhanced sales support systemRewards for promoting Daiwa Global Bond Fund and SMA
Synergy
ResultsResults Higher IncentivesHigher Incentives
Further increase in assets and revenues
15
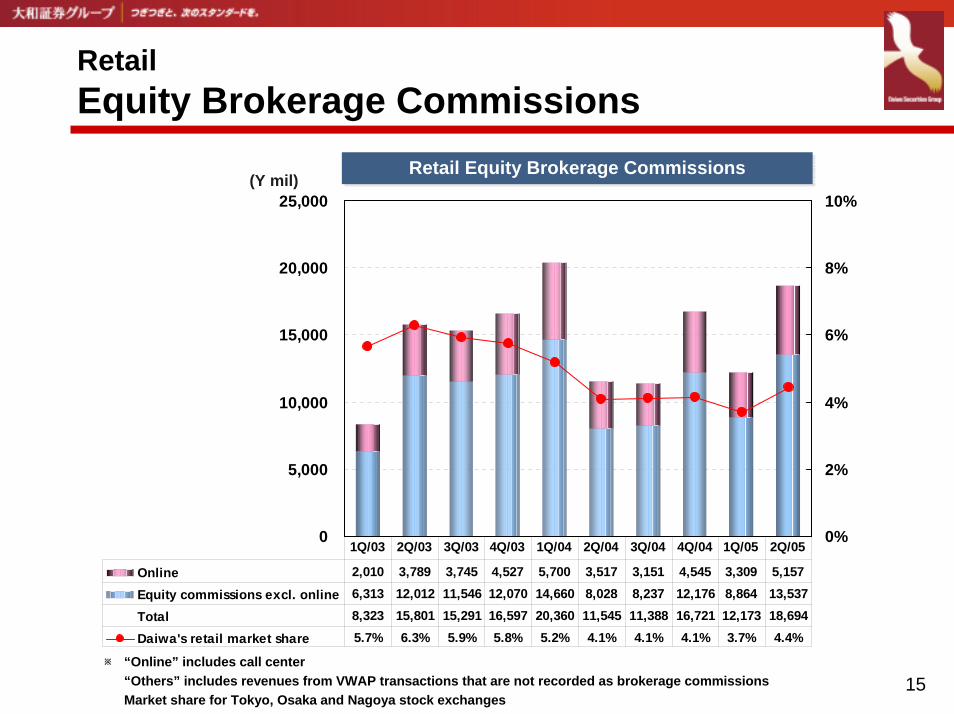
Retail Equity Brokerage Commissions
0
5,000
10,000
15,000
20,000
25,000
0%
2%
4%
6%
8%
10%
Online 2,010 3,789 3,745 4,527 5,700 3,517 3,151 4,545 3,309 5,157
Equity commissions excl. online 6,313 12,012 11,546 12,070 14,660 8,028 8,237 12,176 8,864 13,537
Total 8,323 15,801 15,291 16,597 20,360 11,545 11,388 16,721 12,173 18,694
Daiwa's retail market share 5.7% 6.3% 5.9% 5.8% 5.2% 4.1% 4.1% 4.1% 3.7% 4.4%
1Q/03 2Q/03 3Q/03 4Q/03 1Q/04 2Q/04 3Q/04 4Q/04 1Q/05 2Q/05
(Y mil) Retail Equity Brokerage CommissionsRetail Equity Brokerage Commissions
※ “Online” includes call center“Others” includes revenues from VWAP transactions that are not recorded as brokerage commissions Market share for Tokyo, Osaka and Nagoya stock exchanges
16
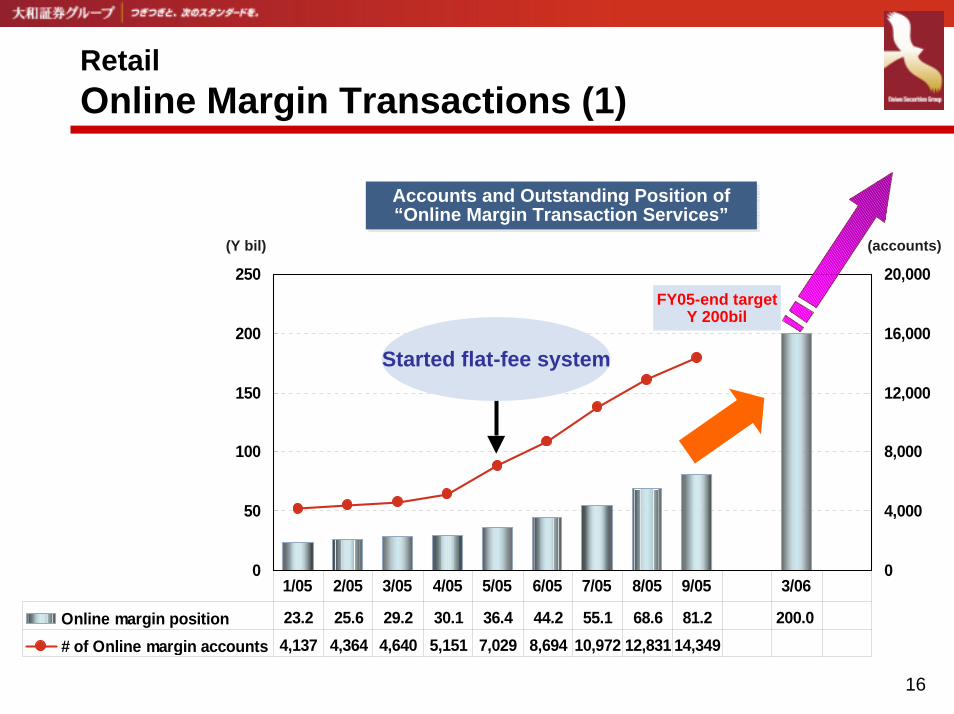
Retail Online Margin Transactions (1)
0
50
100
150
200
250
0
4,000
8,000
12,000
16,000
20,000
Online margin position 23.2 25.6 29.2 30.1 36.4 44.2 55.1 68.6 81.2 200.0
# of Online margin accounts 4,137 4,364 4,640 5,151 7,029 8,694 10,972 12,831 14,349
1/05 2/05 3/05 4/05 5/05 6/05 7/05 8/05 9/05 3/06
(accounts)(Y bil)
FY05-end targetY 200bil
Started flat-fee system
Accounts and Outstanding Position of “Online Margin Transaction Services”Accounts and Outstanding Position of “Online Margin Transaction Services”
17
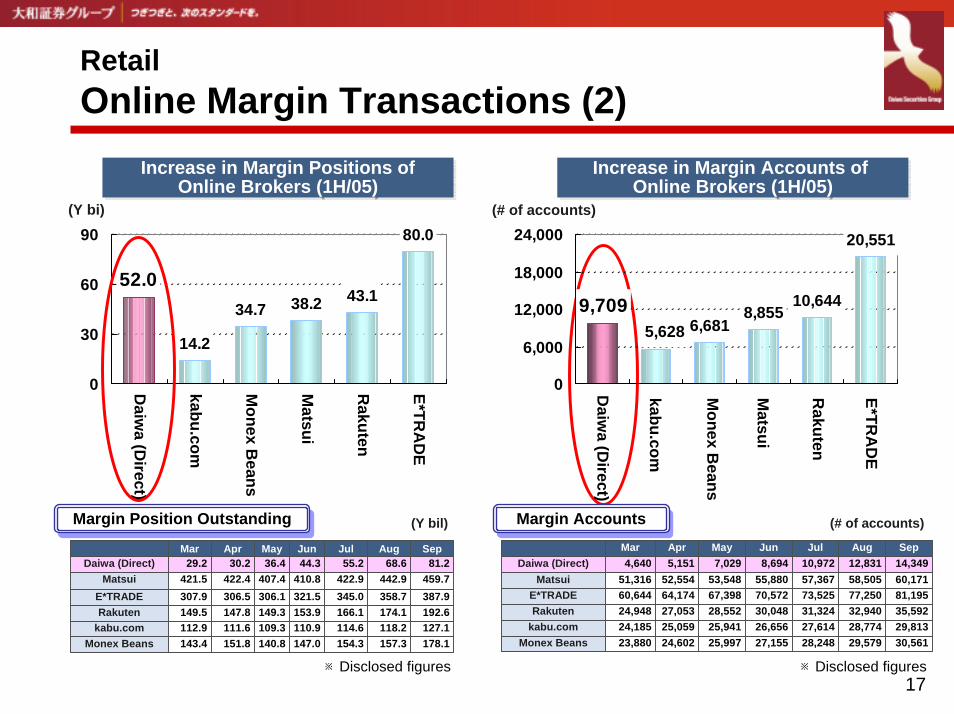
Retail Online Margin Transactions (2)
14.2
38.2 43.1
80.0
52.034.7
0
30
60
90(Y bi)
Daiw
a (Direct)
Matsui
E*TRA
DE
Rakuten
kabu.com
Monex B
eans
Margin Position OutstandingMargin Position Outstanding (Y bil)
Increase in Margin Positions ofOnline Brokers (1H/05)
Increase in Margin Positions ofOnline Brokers (1H/05)
Increase in Margin Accounts of Online Brokers (1H/05)
Increase in Margin Accounts of Online Brokers (1H/05)
6,6818,855
10,644
20,551
9,7095,628
0
6,000
12,000
18,000
24,000(# of accounts)
Daiw
a (Direct)
Matsui
E*TRA
DE
Rakuten
kabu.com
Monex B
eans
Margin AccountsMargin Accounts (# of accounts)
143.4112.9149.5307.9421.5
29.2Mar
157.3118.2174.1358.7442.9
68.6Aug
151.8111.6147.8306.5422.4
30.2Apr
140.8109.3149.3306.1407.4
36.4May
147.0110.9153.9321.5410.8
44.3Jun
154.3114.6166.1345.0422.9
55.2Jul
178.1127.1192.6387.9459.7
81.2Sep
Rakuten
Monex Beans
Daiwa (Direct)
kabu.com
E*TRADEMatsui
23,88024,18524,94860,64451,316
4,640Mar
24,60225,05927,05364,17452,554
5,151Apr
25,99725,94128,55267,39853,548
7,029May
27,15526,65630,04870,57255,880
8,694Jun
28,24827,61431,32473,52557,36710,972Jul
29,57928,77432,94077,25058,50512,831Aug
30,56129,81335,59281,19560,17114,349Sep
Rakuten
Monex Beans
Daiwa (Direct)
kabu.com
E*TRADEMatsui
※Disclosed figures ※Disclosed figures
18
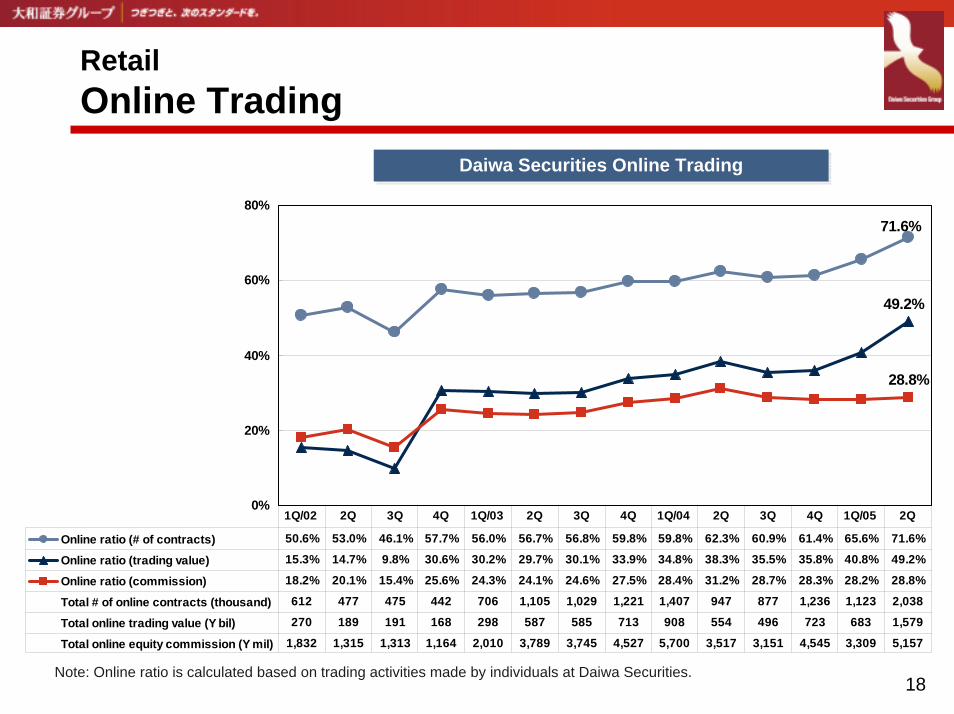
Retail Online Trading
Daiwa Securities Online TradingDaiwa Securities Online Trading
71.6%
49.2%
28.8%
0%
20%
40%
60%
80%
Online ratio (# of contracts) 50.6% 53.0% 46.1% 57.7% 56.0% 56.7% 56.8% 59.8% 59.8% 62.3% 60.9% 61.4% 65.6% 71.6%
Online ratio (trading value) 15.3% 14.7% 9.8% 30.6% 30.2% 29.7% 30.1% 33.9% 34.8% 38.3% 35.5% 35.8% 40.8% 49.2%
Online ratio (commission) 18.2% 20.1% 15.4% 25.6% 24.3% 24.1% 24.6% 27.5% 28.4% 31.2% 28.7% 28.3% 28.2% 28.8%
Total # of online contracts (thousand) 612 477 475 442 706 1,105 1,029 1,221 1,407 947 877 1,236 1,123 2,038
Total online trading value (Y bil) 270 189 191 168 298 587 585 713 908 554 496 723 683 1,579
Total online equity commission (Y mil) 1,832 1,315 1,313 1,164 2,010 3,789 3,745 4,527 5,700 3,517 3,151 4,545 3,309 5,157
1Q/02 2Q 3Q 4Q 1Q/03 2Q 3Q 4Q 1Q/04 2Q 3Q 4Q 1Q/05 2Q
Note: Online ratio is calculated based on trading activities made by individuals at Daiwa Securities.

19
Retail “Daiwa Direct” Sales of Equity Investment Trusts
Sales of Equity Investment Trusts in “Daiwa Direct” Course Sales of Equity Investment Trusts in “Daiwa Direct” Course
100
1,540
0
300
600
900
1,200
1,500
1,800
9/04 10/04 11/04 12/04 1/05 2/05 3/05 4/05 5/05 6/05 7/05 8/05 9/05
※ index as 9/04=100
20
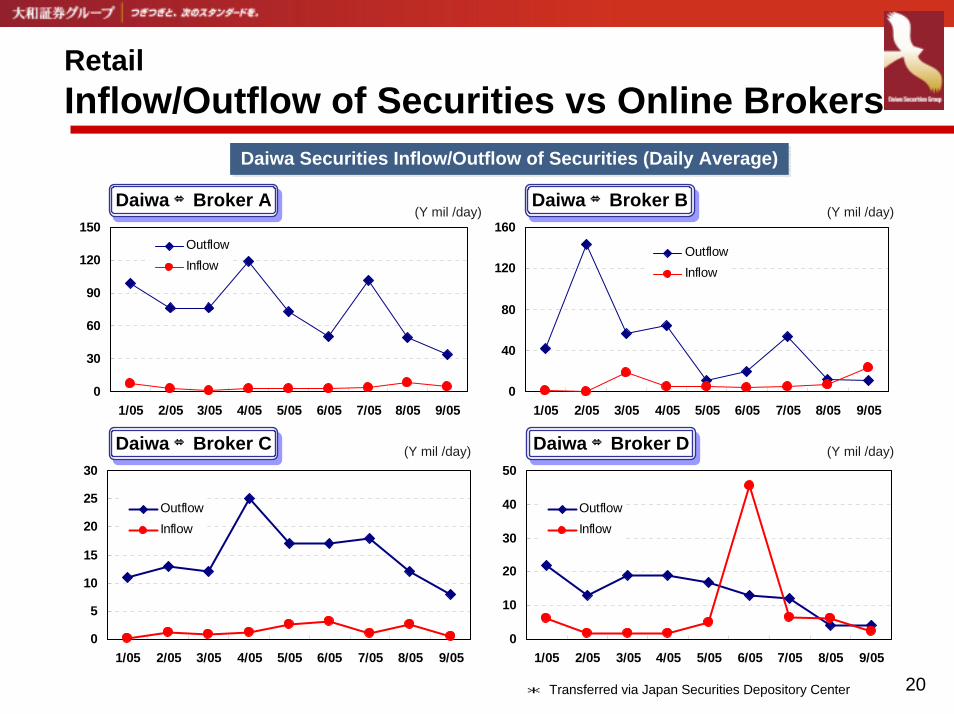
Retail Inflow/Outflow of Securities vs Online Brokers
Daiwa Securities Inflow/Outflow of Securities (Daily Average)Daiwa Securities Inflow/Outflow of Securities (Daily Average)
0
10
20
30
40
50
1/05 2/05 3/05 4/05 5/05 6/05 7/05 8/05 9/05
OutflowInflow
0
30
60
90
120
150
1/05 2/05 3/05 4/05 5/05 6/05 7/05 8/05 9/05
OutflowInflow
0
5
10
15
20
25
30
1/05 2/05 3/05 4/05 5/05 6/05 7/05 8/05 9/05
OutflowInflow
0
40
80
120
160
1/05 2/05 3/05 4/05 5/05 6/05 7/05 8/05 9/05
OutflowInflow
Daiwa ⇔Broker ADaiwa ⇔Broker A
Daiwa ⇔Broker CDaiwa ⇔Broker C
Daiwa ⇔Broker BDaiwa ⇔Broker B
Daiwa ⇔Broker DDaiwa ⇔Broker D
(Y mil /day)
(Y mil /day) (Y mil /day)
(Y mil /day)
* Transferred via Japan Securities Depository Center
21
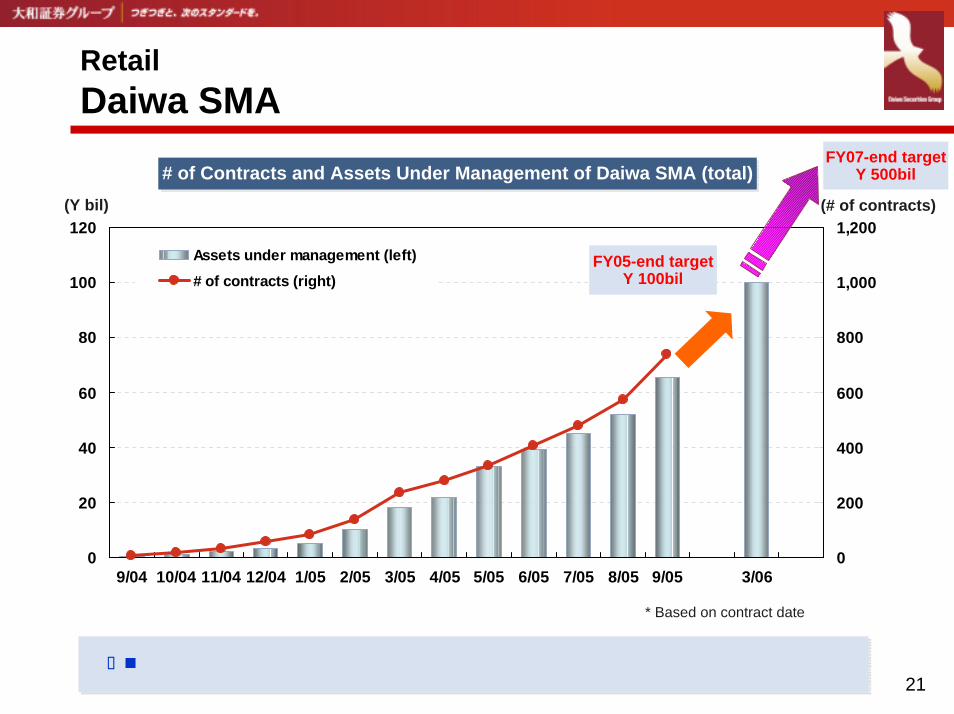
Retail Daiwa SMA
# of Contracts and Assets Under Management of Daiwa SMA (total)# of Contracts and Assets Under Management of Daiwa SMA (total)
0
20
40
60
80
100
120
9/04 10/04 11/04 12/04 1/05 2/05 3/05 4/05 5/05 6/05 7/05 8/05 9/05 3/060
200
400
600
800
1,000
1,200Assets under management (left)
# of contracts (right)
(Y bil) (# of contracts)
FY05-end targetY 100bil
FY07-end targetY 500bil
* Based on contract date
Additional contracts by existing SMA customers increased from Aug Additional contracts by existing SMA customers increased from Aug
22
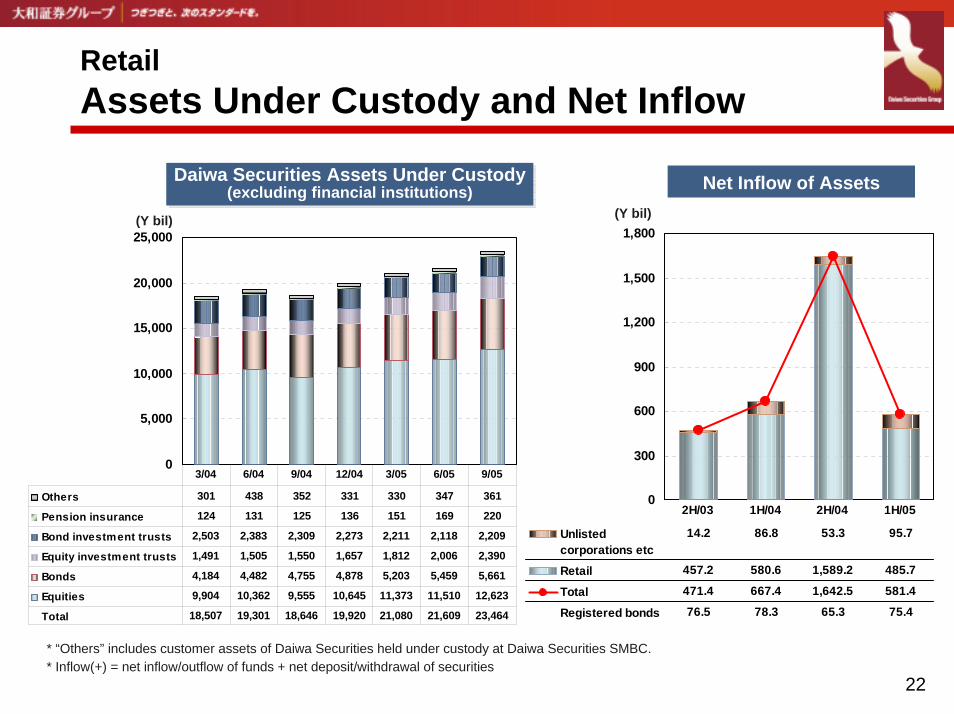
Retail Assets Under Custody and Net Inflow
Daiwa Securities Assets Under Custody(excluding financial institutions)
0
300
600
900
1,200
1,500
1,800
Unlistedcorporations etc
14.2 86.8 53.3 95.7
Retail 457.2 580.6 1,589.2 485.7
Total 471.4 667.4 1,642.5 581.4
Registered bonds 76.5 78.3 65.3 75.4
2H/03 1H/04 2H/04 1H/05
(Y bil)
0
5,000
10,000
15,000
20,000
25,000
Others 301 438 352 331 330 347 361
Pension insurance 124 131 125 136 151 169 220
Bond investment trusts 2,503 2,383 2,309 2,273 2,211 2,118 2,209
Equity investment trusts 1,491 1,505 1,550 1,657 1,812 2,006 2,390
Bonds 4,184 4,482 4,755 4,878 5,203 5,459 5,661
Equities 9,904 10,362 9,555 10,645 11,373 11,510 12,623
Total 18,507 19,301 18,646 19,920 21,080 21,609 23,464
3/04 6/04 9/04 12/04 3/05 6/05 9/05
(Y bil)
Daiwa Securities Assets Under Custody(excluding financial institutions) Net Inflow of Assets
* “Others” includes customer assets of Daiwa Securities held under custody at Daiwa Securities SMBC.* Inflow(+) = net inflow/outflow of funds + net deposit/withdrawal of securities
23
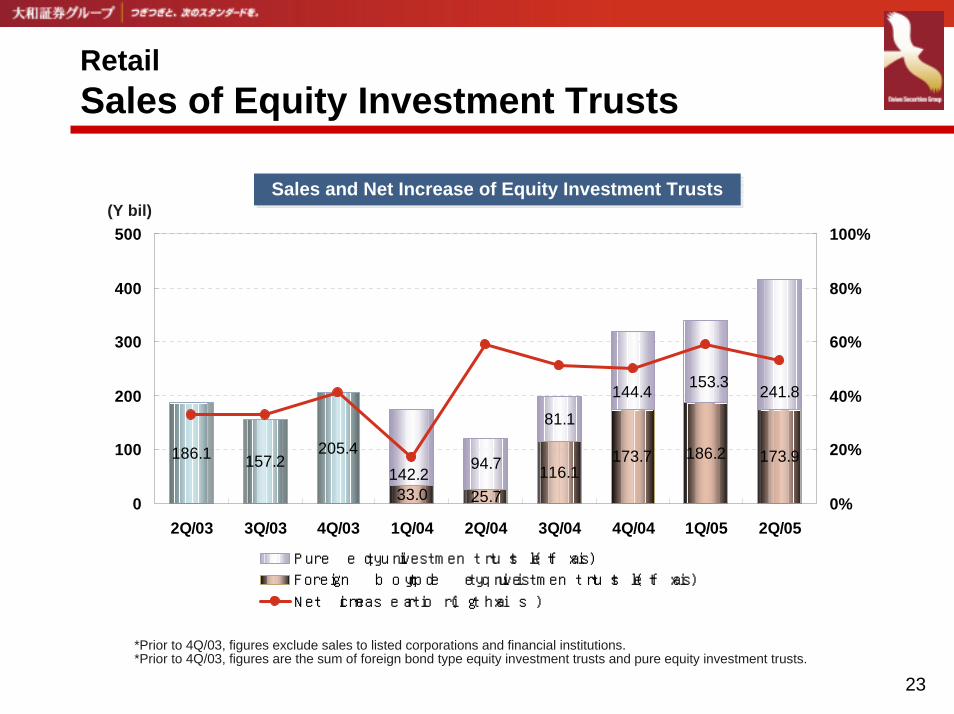
Retail Sales of Equity Investment Trusts
Sales and Net Increase of Equity Investment Trusts(Y bil)
186.1 157.2205.4
33.0 25.7116.1
173.7 186.2 173.994.7
81.1
142.2
144.4 153.3 241.8
0
100
200
300
400
500
2Q/03 3Q/03 4Q/03 1Q/04 2Q/04 3Q/04 4Q/04 1Q/05 2Q/050%
20%
40%
60%
80%
100%
Pure equity investment trust (left axis)
Foreign bond type equity investment trust (left axis)
Net increase ratio (r ight axis)
Sales and Net Increase of Equity Investment Trusts
*Prior to 4Q/03, figures exclude sales to listed corporations and financial institutions.*Prior to 4Q/03, figures are the sum of foreign bond type equity investment trusts and pure equity investment trusts.
24
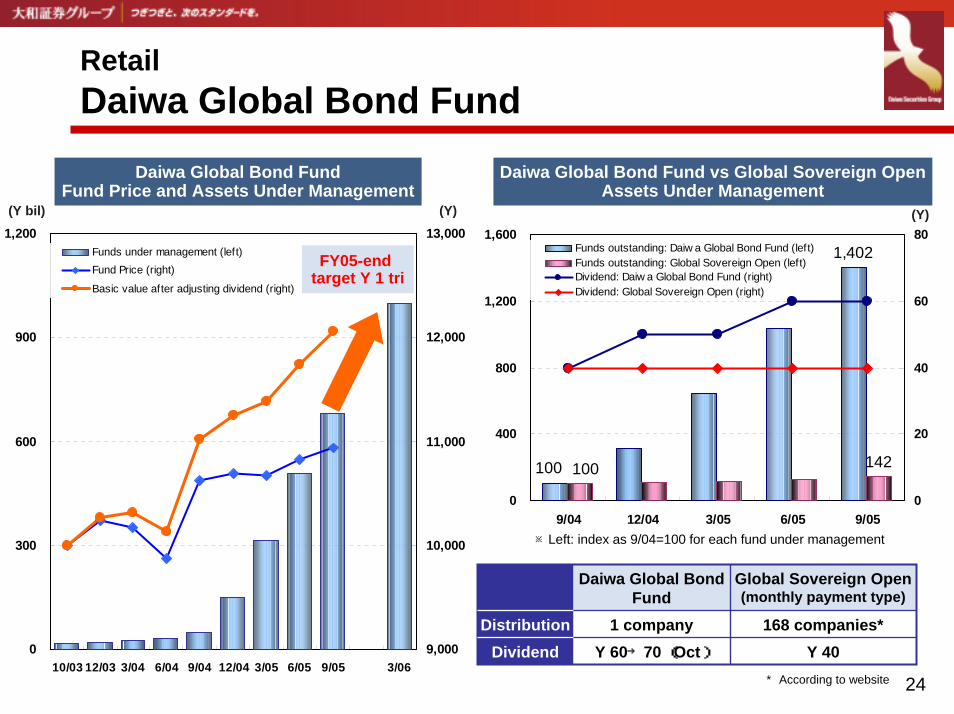
Retail Daiwa Global Bond Fund
1,402
142100 100
0
400
800
1,200
1,600
9/04 12/04 3/05 6/05 9/050
20
40
60
80Funds outstanding: Daiw a Global Bond Fund (left)Funds outstanding: Global Sovereign Open (left)Dividend: Daiw a Global Bond Fund (right)Dividend: Global Sovereign Open (right)
0
300
600
900
1,200
10/03 12/03 3/04 6/04 9/04 12/04 3/05 6/05 9/05 3/069,000
10,000
11,000
12,000
13,000Funds under management (left)Fund Price (right)
Basic value after adjusting dividend (right)
Daiwa Global Bond FundFund Price and Assets Under Management
(Y bil) (Y)
Daiwa Global Bond Fund vs Global Sovereign OpenAssets Under Management
(Y)
※Left: index as 9/04=100 for each fund under management
FY05-end target Y 1 tri
Y 40Y 60→70 (Oct)Dividend168 companies*1 companyDistribution
Global Sovereign Open (monthly payment type)
Daiwa Global Bond Fund
* According to website
25
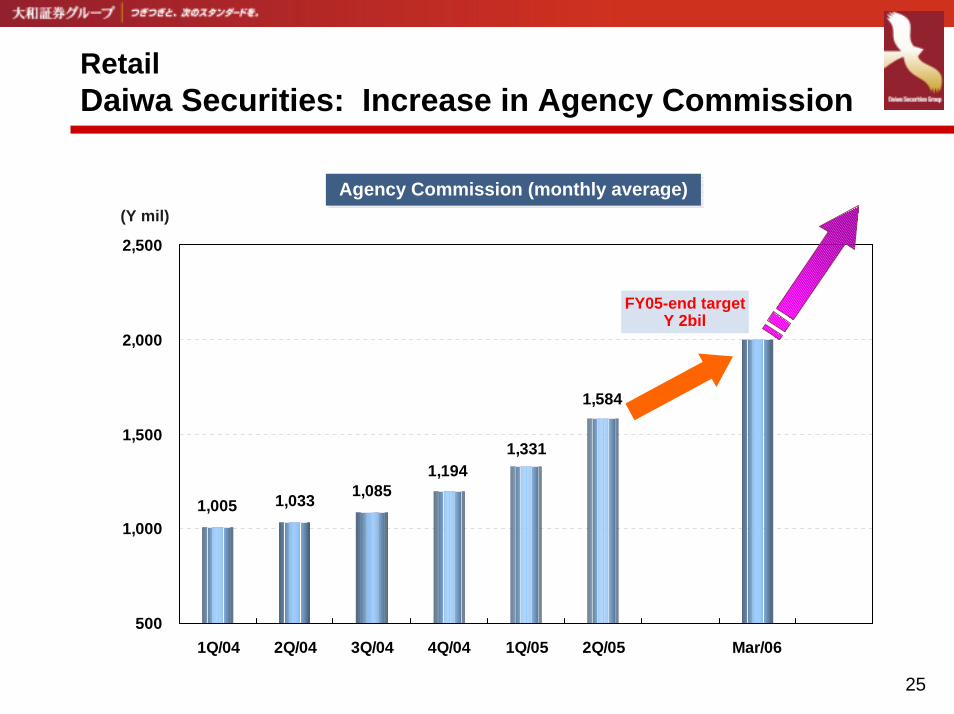
Retail Daiwa Securities: Increase in Agency Commission
1,005 1,033 1,0851,194
1,331
1,584
500
1,000
1,500
2,000
2,500
1Q/04 2Q/04 3Q/04 4Q/04 1Q/05 2Q/05 Mar/06
(Y mil)Agency Commission (monthly average)Agency Commission (monthly average)
FY05-end targetY 2bil
26
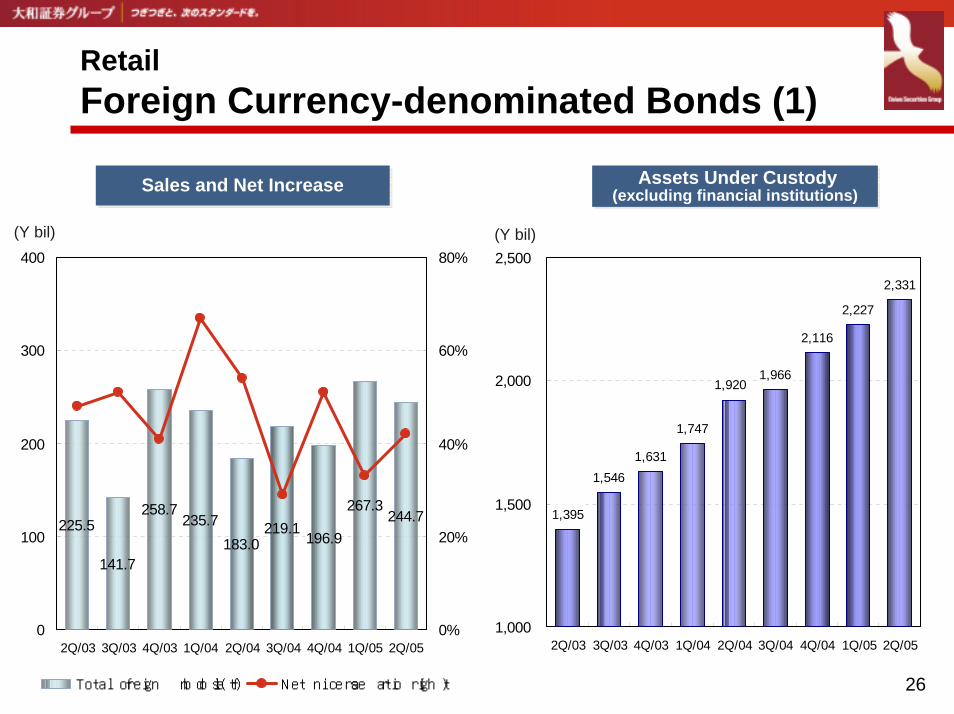
Retail Foreign Currency-denominated Bonds (1)
Sales and Net IncreaseSales and Net Increase Assets Under Custody(excluding financial institutions)
Assets Under Custody(excluding financial institutions)
225.5
141.7
258.7235.7
183.0219.1
196.9
267.3244.7
0
100
200
300
400
2Q/03 3Q/03 4Q/03 1Q/04 2Q/04 3Q/04 4Q/04 1Q/05 2Q/050%
20%
40%
60%
80%
Total foreign bonds (left) Net increase ratio (right)
(Y bil)
1,395
1,5461,631
1,747
1,966
2,116
2,227
2,331
1,920
1,000
1,500
2,000
2,500
2Q/03 3Q/03 4Q/03 1Q/04 2Q/04 3Q/04 4Q/04 1Q/05 2Q/05
(Y bil)
27
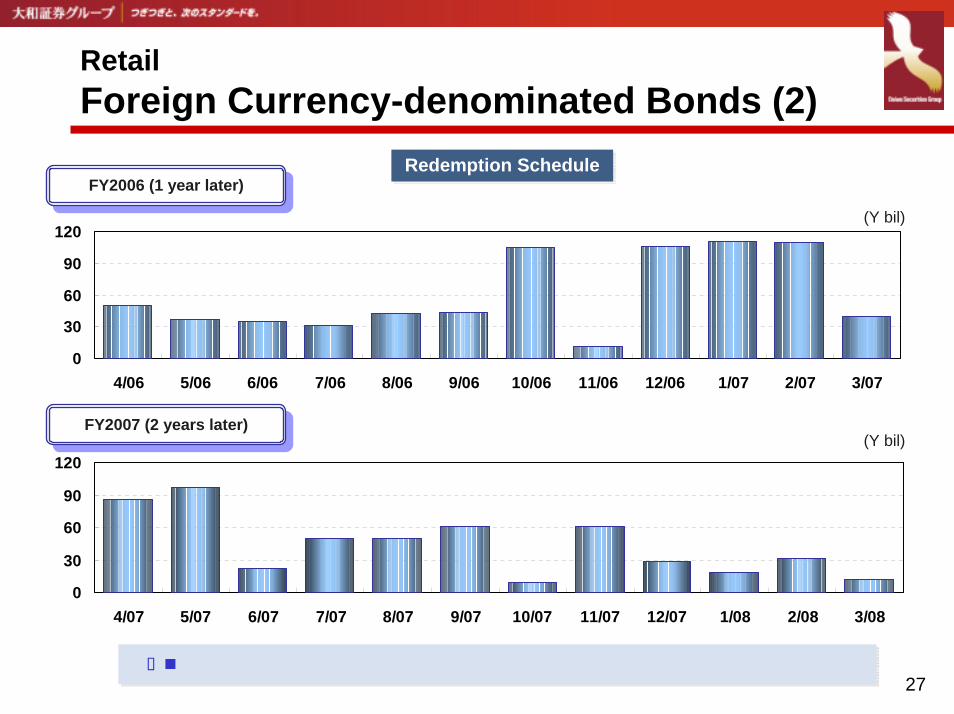
Retail Foreign Currency-denominated Bonds (2)
Redemption ScheduleRedemption ScheduleFY2006 (1 year later)
0
30
60
90
120
4/06 5/06 6/06 7/06 8/06 9/06 10/06 11/06 12/06 1/07 2/07 3/07
(Y bil)
FY2006 (1 year later)
0
30
60
90
120
4/07 5/07 6/07 7/07 8/07 9/07 10/07 11/07 12/07 1/08 2/08 3/08
(Y bil)FY2007 (2 years later)FY2007 (2 years later)
Over Y50 bil of average monthly redemption after FY2006 Over Y50 bil of average monthly redemption after FY2006

28
Retail Target Figures for FY2005
Y 200 bilY 200 bil
Y 1 trilY 1 tril Y 2 bilY 2 bil
Y 100 bilY 100 bil
Contract Assets of Daiwa SMA
Contract Assets of Daiwa SMAOnline Margin PositionOnline Margin Position
Net Assets under management of
Daiwa Global Bond Fund
Net Assets under management of
Daiwa Global Bond FundMonthly Agency
CommissionMonthly Agency
Commission
29
Corporate Value Enhancement
30
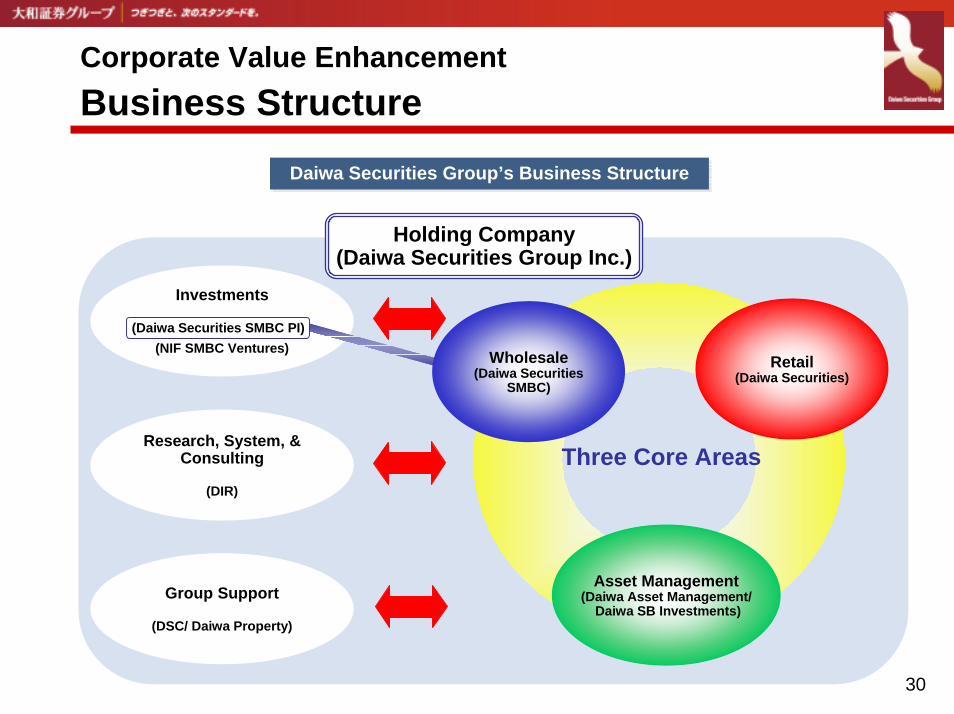
Corporate Value EnhancementBusiness Structure
Daiwa Securities Group’s Business StructureDaiwa Securities Group’s Business Structure
Three Core Areas
Retail(Daiwa Securities)
Asset Management(Daiwa Asset Management/
Daiwa SB Investments)
Investments
(NIF SMBC Ventures)
Research, System, & Consulting
(DIR)
Group Support
(DSC/ Daiwa Property)
Holding Company(Daiwa Securities Group Inc.)
(Daiwa Securities SMBC PI)
Wholesale(Daiwa Securities
SMBC)
31
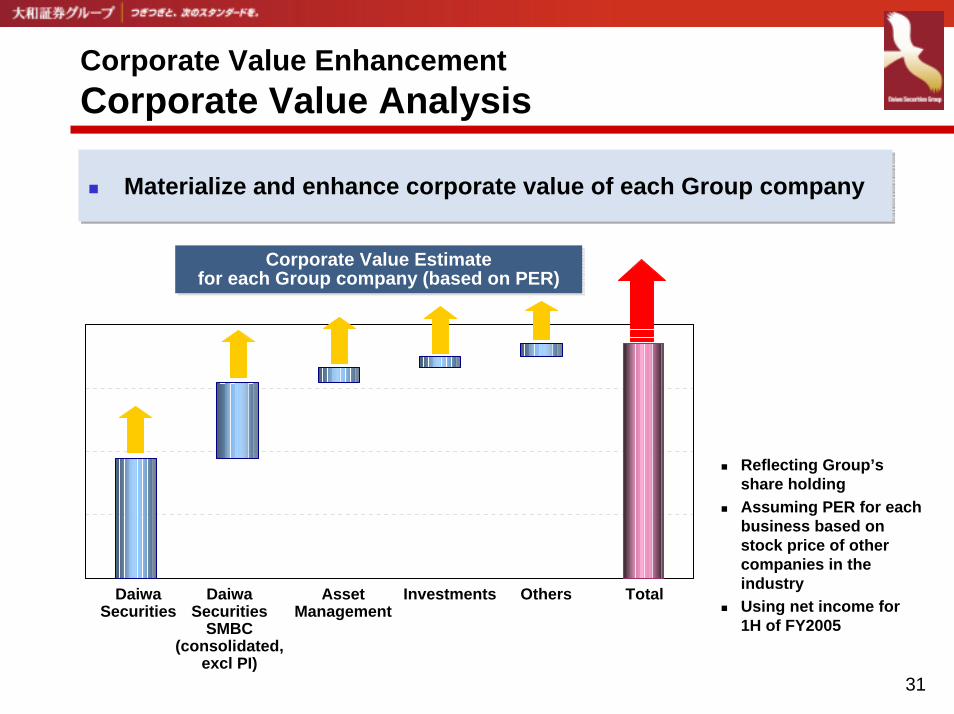
Corporate Value EnhancementCorporate Value Analysis
Materialize and enhance corporate value of each Group companyMaterialize and enhance corporate value of each Group company
Total
Reflecting Group’s share holdingAssuming PER for each business based on stock price of other companies in the industryUsing net income for 1H of FY2005
OthersInvestmentsAssetManagement
Daiwa Securities
SMBC(consolidated,
excl PI)
Daiwa Securities
Corporate Value Estimate for each Group company (based on PER)
Corporate Value Estimate for each Group company (based on PER)
32
Corporate Value EnhancementDividend Policy
Guideline: Payout ratio of 30% ⇒ More aggressively return benefit to shareholders when achieving strong earnings, considering capital allocation
FY2005 interim dividend: Y 12 per share *Payout ratio of 34.8%
Daiwa Securities Group Inc.Investor RelationsTEL: +81-3-3243-3841 FAX: +81-3-3242-0955E-mail: [email protected]: http://www.daiwa.jp/ir/