Power Quality Distributed Generation: What Problem Are You ...
18
1 Power Quality David G. Loucks, P.E. Eaton/Cutler-Hammer [email protected] Distributed Generation: What Problem Are You Asking It To Solve? 2 What Is Distributed Generation? • Battery UPS • Flywheel (Rotary UPS) • SAG Corrector (Capacitor Storage) • Superconducting Magnetic Energy Storage • Microturbine • Fuel Cell • Photovoltaic • Engine Generator (Diesel, Compressed Natural Gas) Generation of Power closer to the point of use.
Transcript of Power Quality Distributed Generation: What Problem Are You ...
1
Power Quality
David G. Loucks, P.E.Eaton/Cutler-Hammer
Distributed Generation:What Problem Are You
Asking It To Solve?
2
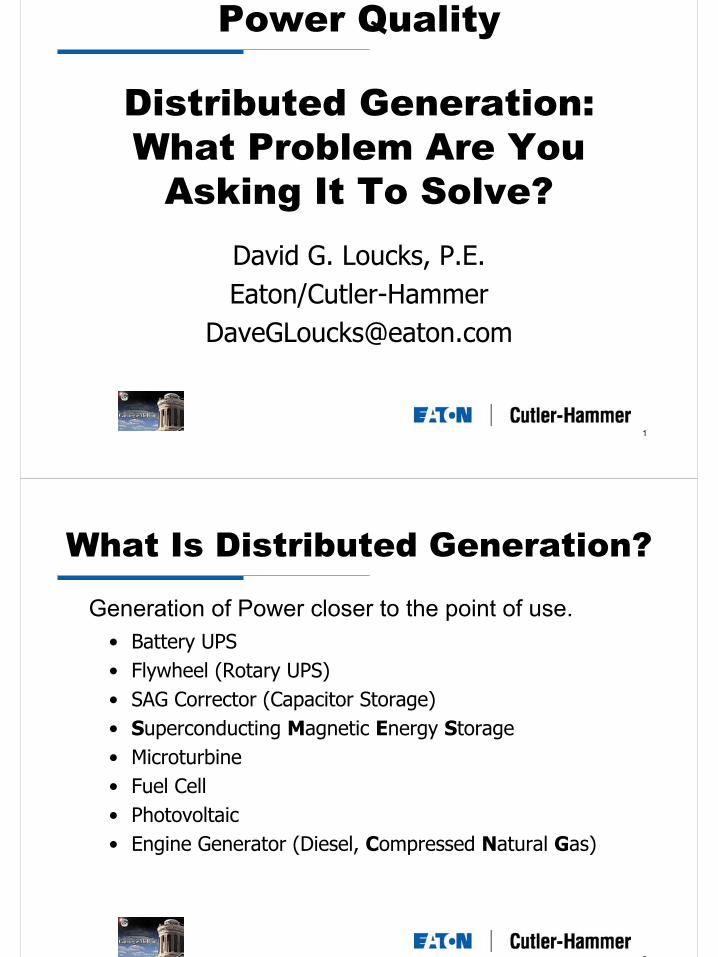
What Is Distributed Generation?
• Battery UPS• Flywheel (Rotary UPS)• SAG Corrector (Capacitor Storage)• Superconducting Magnetic Energy Storage• Microturbine• Fuel Cell• Photovoltaic• Engine Generator (Diesel, Compressed Natural Gas)
Generation of Power closer to the point of use.
3
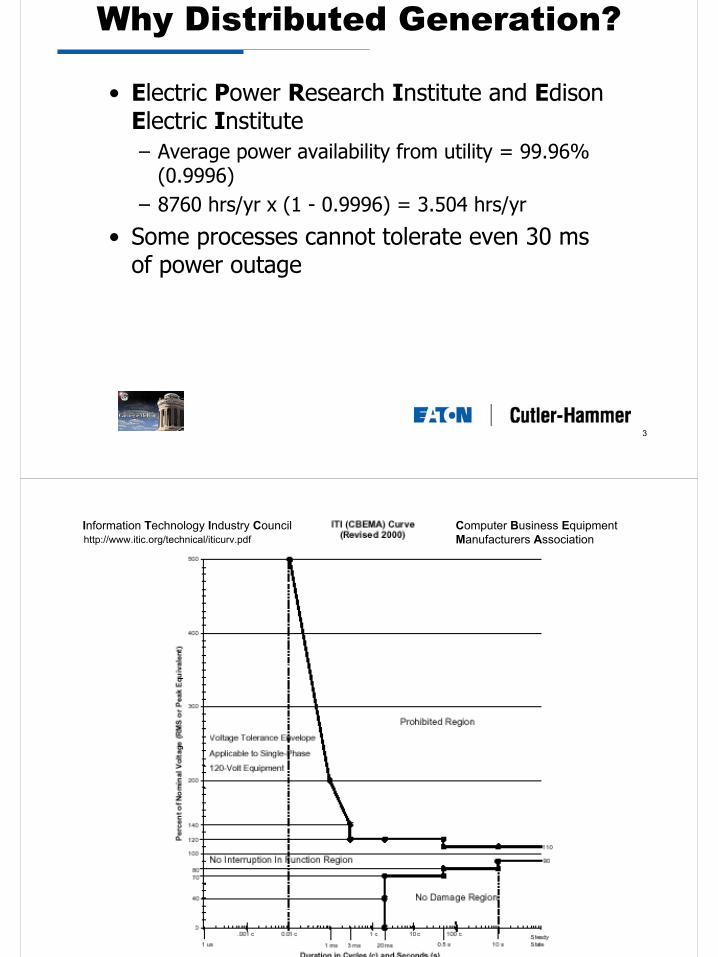
Why Distributed Generation?
• Electric Power Research Institute and Edison Electric Institute– Average power availability from utility = 99.96%
(0.9996)– 8760 hrs/yr x (1 - 0.9996) = 3.504 hrs/yr
• Some processes cannot tolerate even 30 ms of power outage
Information Technology Industry Council Computer Business Equipment Manufacturers Associationhttp://www.itic.org/technical/iticurv.pdf
5
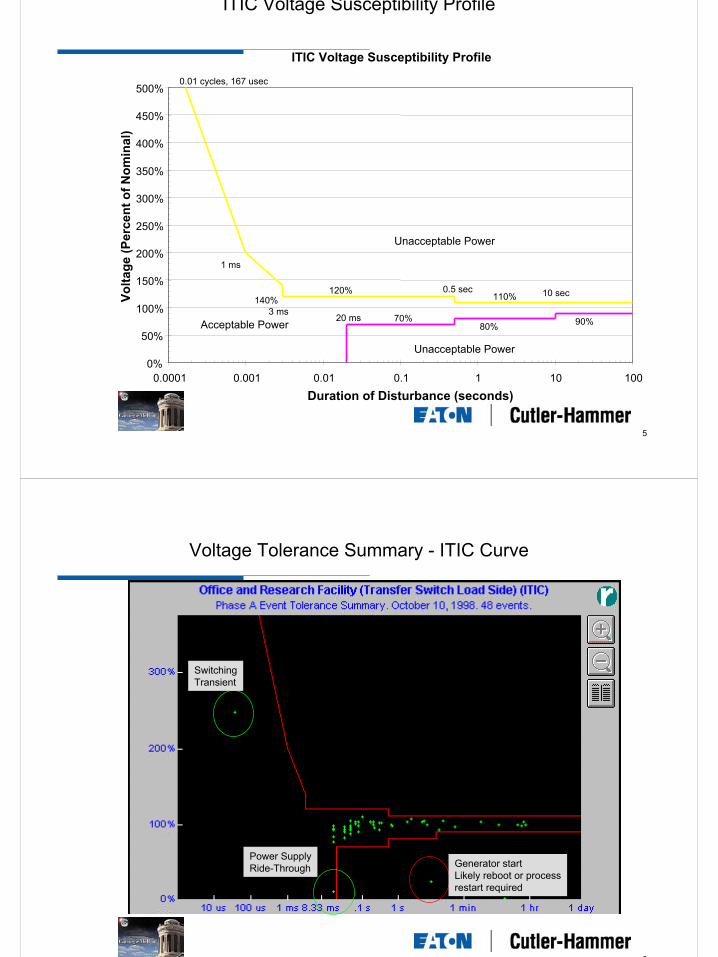
ITIC Voltage Susceptibility Profile
1000%
50%
100%
150%
200%
250%
300%
350%
400%
450%
500%
0.0001 0.001 0.01 0.1 1 10
Duration of Disturbance (seconds)
Vo
ltag
e (P
erce
nt
of
No
min
al)
Acceptable Power
Unacceptable Power
Unacceptable Power
0.01 cycles, 167 usec
1 ms
3 ms20 ms
0.5 sec 10 sec120%
70%
110%
80% 90%
140%
ITIC Voltage Susceptibility Profile
6
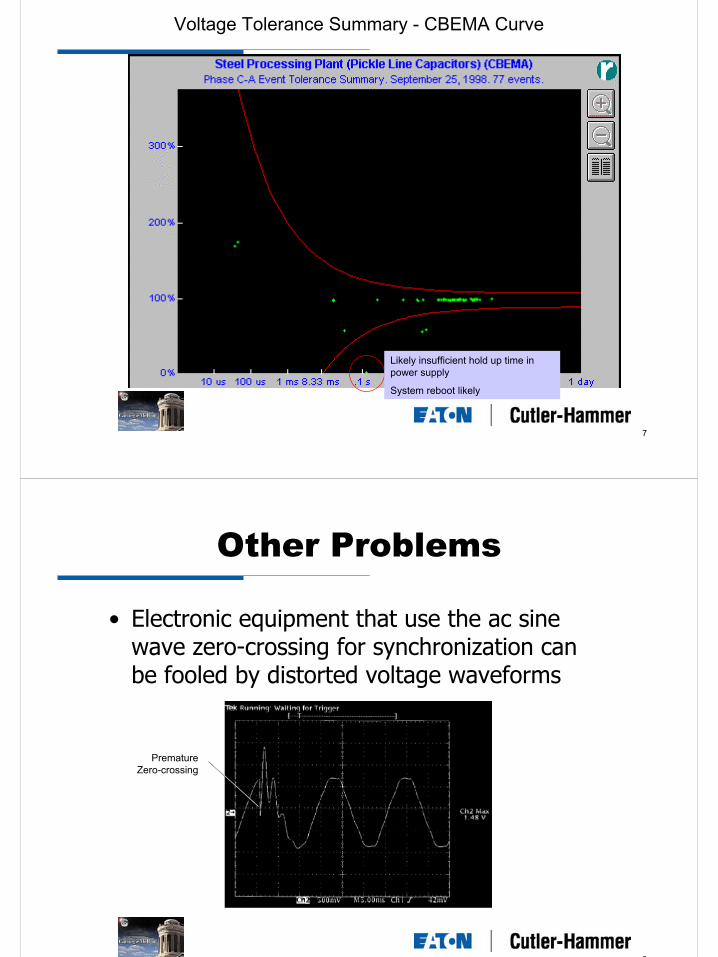
Voltage Tolerance Summary - ITIC Curve
Generator startLikely reboot or processrestart required
SwitchingTransient
Power SupplyRide-Through
7
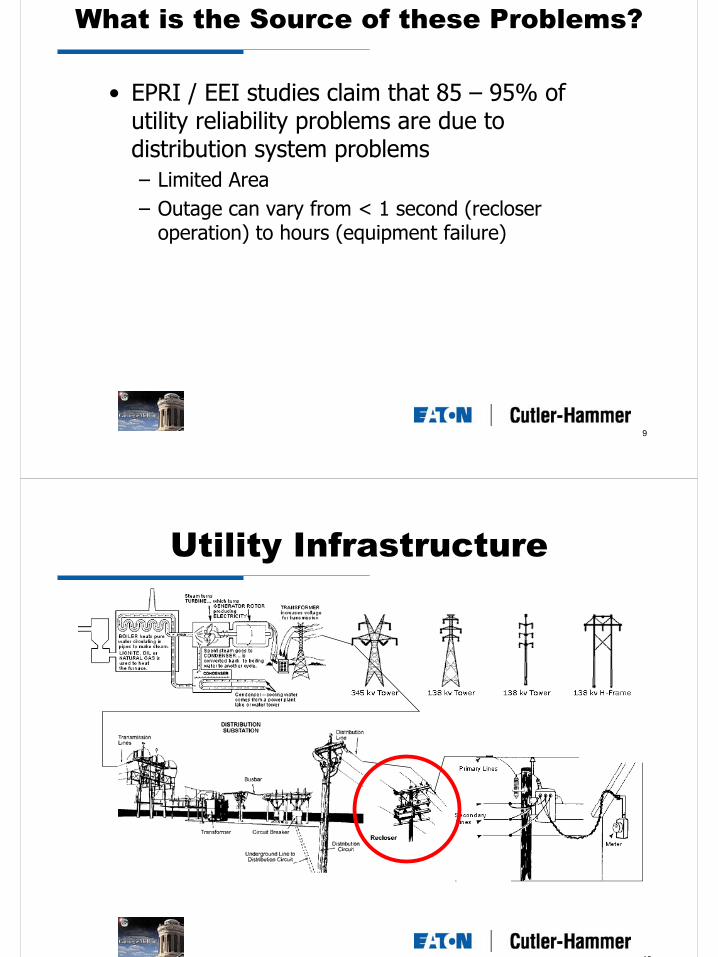
Voltage Tolerance Summary - CBEMA Curve
Likely insufficient hold up time in power supply
System reboot likely
8
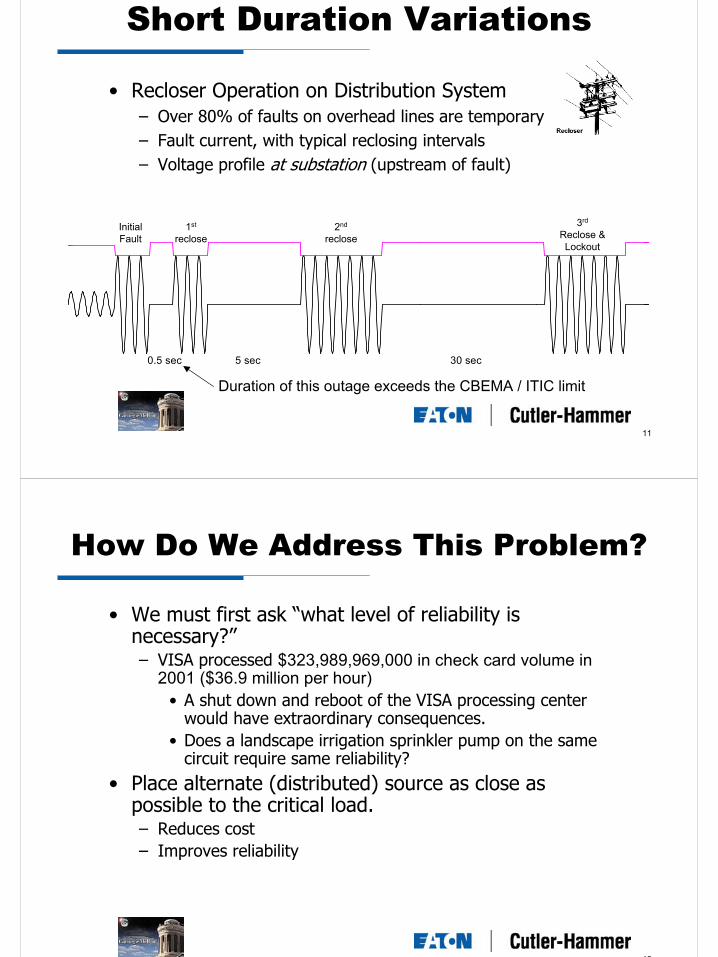
Other Problems
• Electronic equipment that use the ac sine wave zero-crossing for synchronization can be fooled by distorted voltage waveforms
PrematureZero-crossing
9
What is the Source of these Problems?
• EPRI / EEI studies claim that 85 – 95% of utility reliability problems are due to distribution system problems– Limited Area– Outage can vary from < 1 second (recloser
operation) to hours (equipment failure)
10
Utility Infrastructure
11
Short Duration Variations
• Recloser Operation on Distribution System– Over 80% of faults on overhead lines are temporary– Fault current, with typical reclosing intervals– Voltage profile at substation (upstream of fault)
5 sec0.5 sec 30 sec
InitialFault
1st
reclose2nd
reclose
3rd
Reclose &Lockout
Duration of this outage exceeds the CBEMA / ITIC limit
12
How Do We Address This Problem?
• We must first ask “what level of reliability is necessary?”– VISA processed $323,989,969,000 in check card volume in
2001 ($36.9 million per hour)• A shut down and reboot of the VISA processing center
would have extraordinary consequences.• Does a landscape irrigation sprinkler pump on the same
circuit require same reliability?
• Place alternate (distributed) source as close as possible to the critical load.– Reduces cost– Improves reliability
13
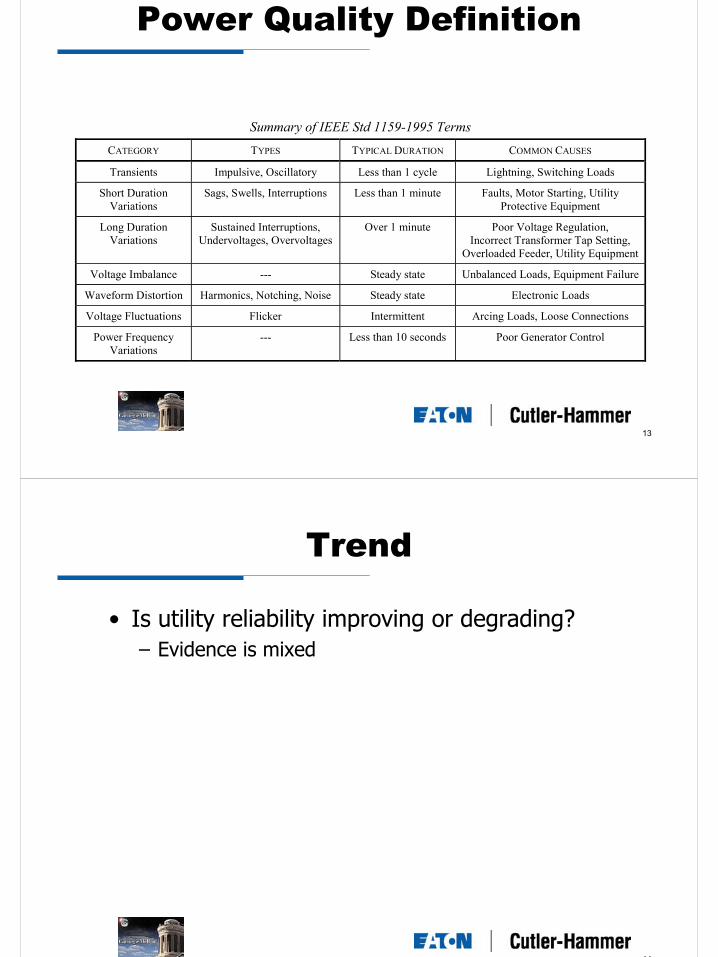
Power Quality Definition
Summary of IEEE Std 1159-1995 Terms
CATEGORY TYPES TYPICAL DURATION COMMON CAUSES
Transients Impulsive, Oscillatory Less than 1 cycle Lightning, Switching Loads
Short DurationVariations
Sags, Swells, Interruptions Less than 1 minute Faults, Motor Starting, UtilityProtective Equipment
Long DurationVariations
Sustained Interruptions,Undervoltages, Overvoltages
Over 1 minute Poor Voltage Regulation,Incorrect Transformer Tap Setting,
Overloaded Feeder, Utility Equipment
Voltage Imbalance --- Steady state Unbalanced Loads, Equipment Failure
Waveform Distortion Harmonics, Notching, Noise Steady state Electronic Loads
Voltage Fluctuations Flicker Intermittent Arcing Loads, Loose Connections
Power FrequencyVariations
--- Less than 10 seconds Poor Generator Control
14
Trend
• Is utility reliability improving or degrading?– Evidence is mixed
15
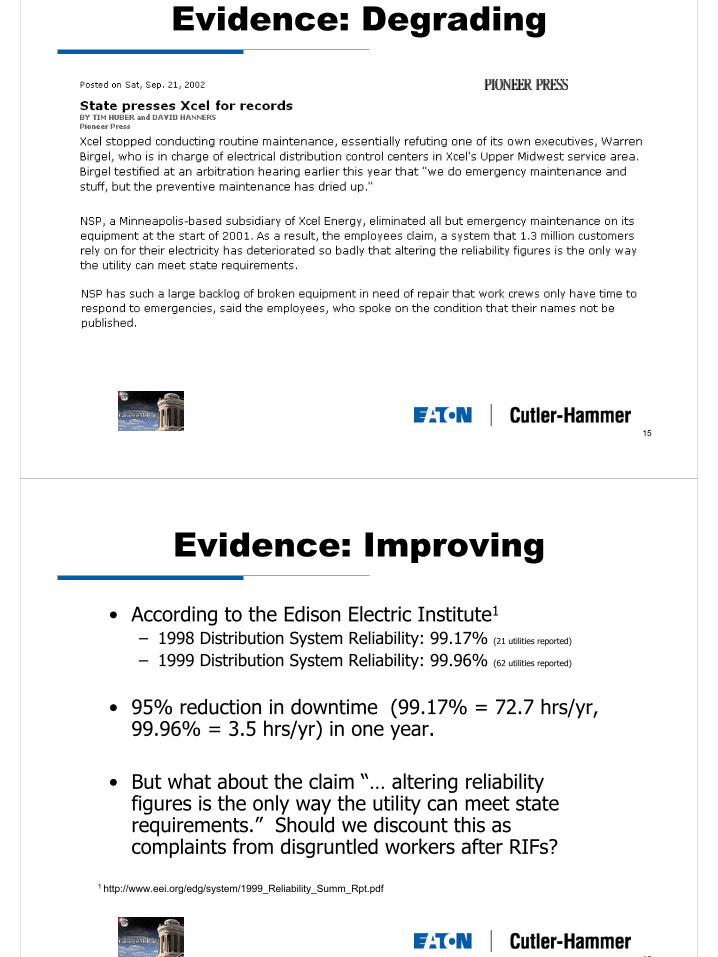
Evidence: Degrading
16
Evidence: Improving
• According to the Edison Electric Institute1
– 1998 Distribution System Reliability: 99.17% (21 utilities reported)
– 1999 Distribution System Reliability: 99.96% (62 utilities reported)
• 95% reduction in downtime (99.17% = 72.7 hrs/yr, 99.96% = 3.5 hrs/yr) in one year.
• But what about the claim “… altering reliability figures is the only way the utility can meet state requirements.” Should we discount this as complaints from disgruntled workers after RIFs?
1 http://www.eei.org/edg/system/1999_Reliability_Summ_Rpt.pdf
17
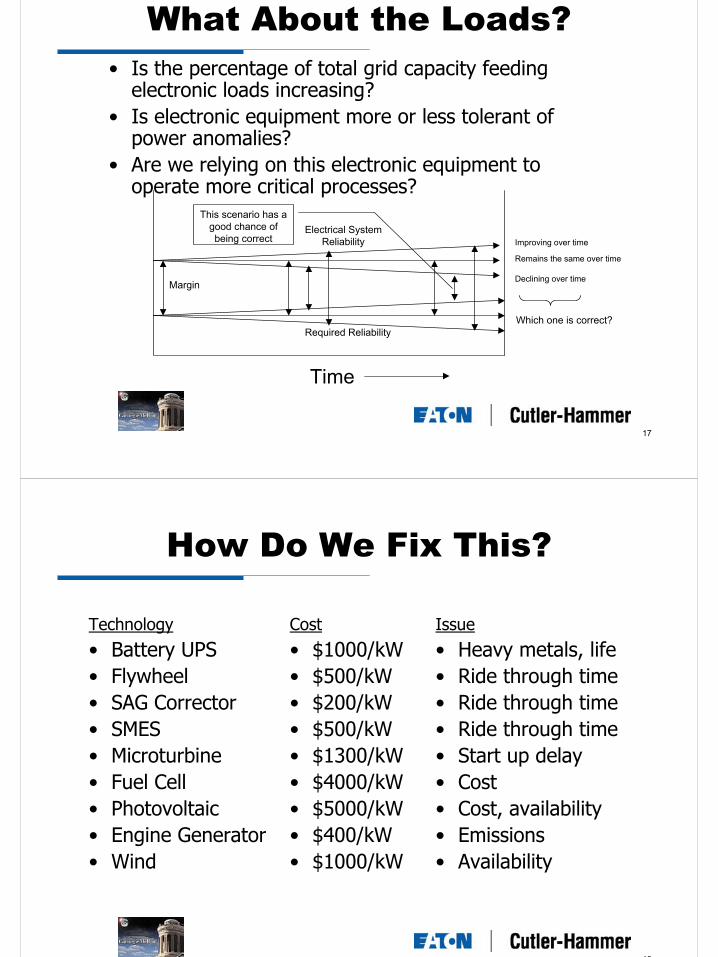
What About the Loads?• Is the percentage of total grid capacity feeding
electronic loads increasing?• Is electronic equipment more or less tolerant of
power anomalies?• Are we relying on this electronic equipment to
operate more critical processes?
Improving over time
Remains the same over time
Declining over time
Which one is correct?
Time
Electrical SystemReliability
Required Reliability
Margin
This scenario has a good chance of being correct
18
How Do We Fix This?
• Battery UPS• Flywheel • SAG Corrector• SMES• Microturbine• Fuel Cell• Photovoltaic• Engine Generator• Wind
Technology
• $1000/kW• $500/kW• $200/kW• $500/kW• $1300/kW• $4000/kW• $5000/kW• $400/kW• $1000/kW
Cost
• Heavy metals, life• Ride through time• Ride through time• Ride through time• Start up delay• Cost• Cost, availability• Emissions• Availability
Issue
19
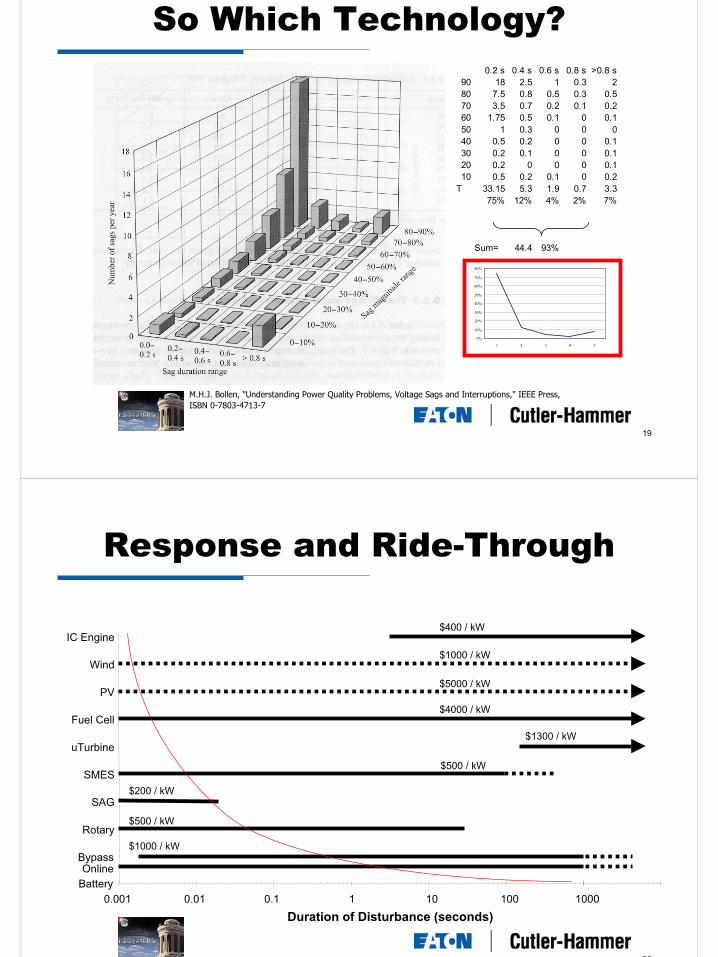
So Which Technology?
M.H.J. Bollen, "Understanding Power Quality Problems, Voltage Sags and Interruptions," IEEE Press, ISBN 0-7803-4713-7
0.2 s 0.4 s 0.6 s 0.8 s >0.8 s90 18 2.5 1 0.3 280 7.5 0.8 0.5 0.3 0.570 3.5 0.7 0.2 0.1 0.260 1.75 0.5 0.1 0 0.150 1 0.3 0 0 040 0.5 0.2 0 0 0.130 0.2 0.1 0 0 0.120 0.2 0 0 0 0.110 0.5 0.2 0.1 0 0.2
T 33.15 5.3 1.9 0.7 3.375% 12% 4% 2% 7%
Sum= 44.4 93%
0%
10%
20%
30%
40%
50%
60%
70%
80%
1 2 3 4 5
20
Response and Ride-Through
1000
Bypass
Rotary
SAG
SMES
uTurbine
Fuel Cell
PV
Wind
IC Engine
0.001 0.01 0.1 1 10 100
Duration of Disturbance (seconds)
OnlineBattery
$400 / kW
$1000 / kW
$5000 / kW
$4000 / kW
$1300 / kW
$500 / kW
$200 / kW
$500 / kW
$1000 / kW
21
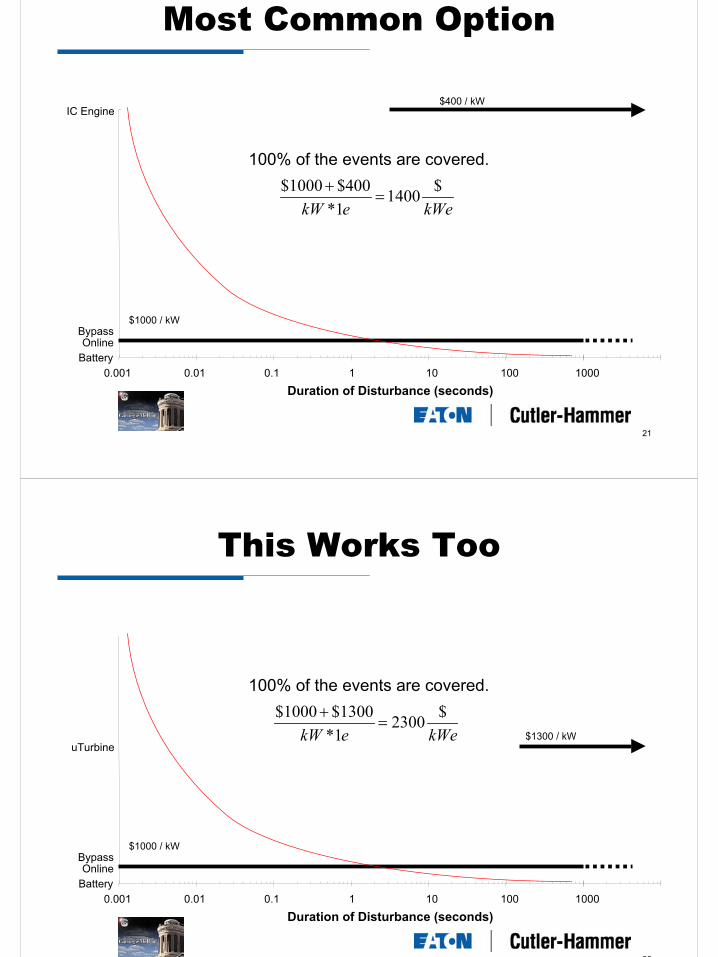
Most Common Option
1000
Bypass
IC Engine
0.001 0.01 0.1 1 10 100
Duration of Disturbance (seconds)
OnlineBattery
100% of the events are covered.
$1000 / kW
$400 / kW
kWeekW
$1400
1*
400$1000$=
+
22
This Works Too
1000
Bypass
uTurbine
0.001 0.01 0.1 1 10 100
Duration of Disturbance (seconds)
OnlineBattery
100% of the events are covered.
$1300 / kW
$1000 / kW
kWeekW
$2300
1*
1300$1000$=
+
23
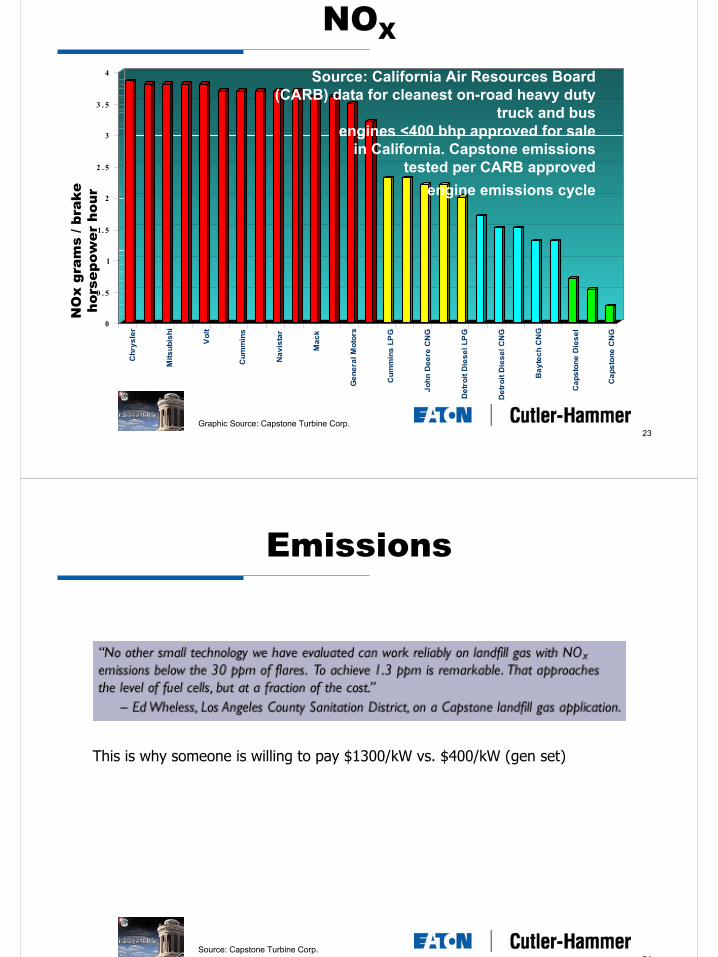
NOX
0
0 . 5
1
1. 5
2
2 . 5
3
3 . 5
4
Ch
rys
ler
Mit
su
bis
hi
Vo
lt
Cu
mm
ins
Na
vis
tar
Ma
ck
Ge
ne
ral
Mo
tors
Cu
mm
ins
LP
G
Jo
hn
De
ere
CN
G
De
tro
it D
ies
el
LP
G
De
tro
it D
ies
el
CN
G
Ba
yte
ch
CN
G
Ca
ps
ton
e D
ies
el
Ca
ps
ton
e C
NG
Source: California Air Resources Board (CARB) data for cleanest on-road heavy duty
truck and busengines <400 bhp approved for sale
in California. Capstone emissions tested per CARB approved
engine emissions cycle
NO
x gr
ams
/ bra
ke
hors
epow
er h
our
Graphic Source: Capstone Turbine Corp.
24
Emissions
Source: Capstone Turbine Corp.
This is why someone is willing to pay $1300/kW vs. $400/kW (gen set)
25
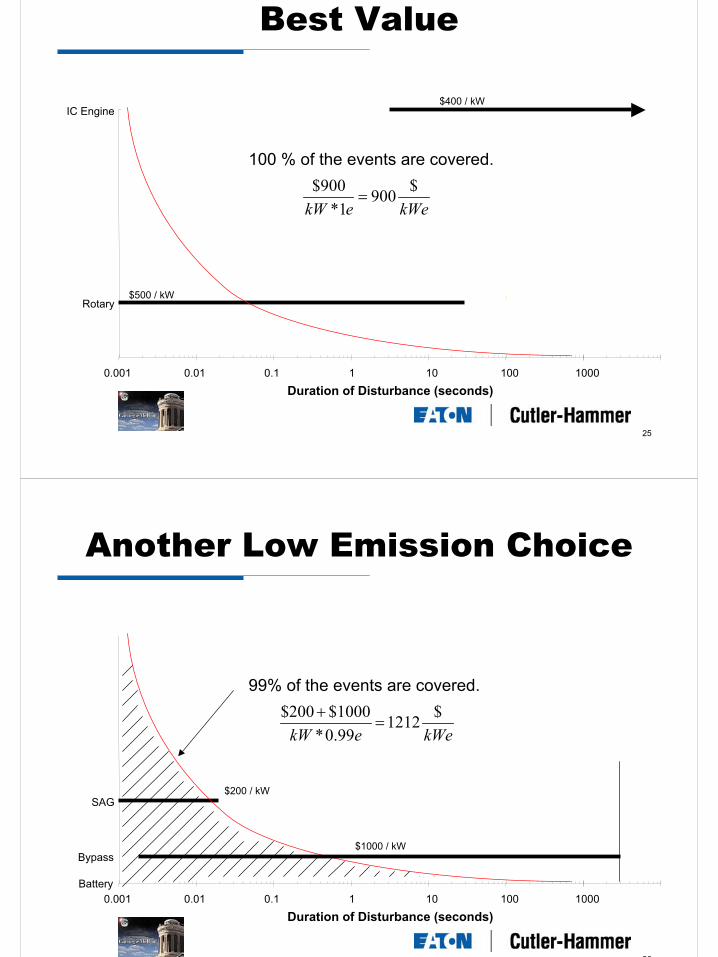
Best Value
1000
Rotary
IC Engine
0.001 0.01 0.1 1 10 100
Duration of Disturbance (seconds)
100 % of the events are covered.
$500 / kW
$400 / kW
kWeekW
$900
1*
900$=
26
Another Low Emission Choice
1000
SAG
0.001 0.01 0.1 1 10 100
Duration of Disturbance (seconds)
Battery
99% of the events are covered.
$200 / kW
kWeekW
$1212
99.0*
1000$200$=
+
Bypass$1000 / kW
27
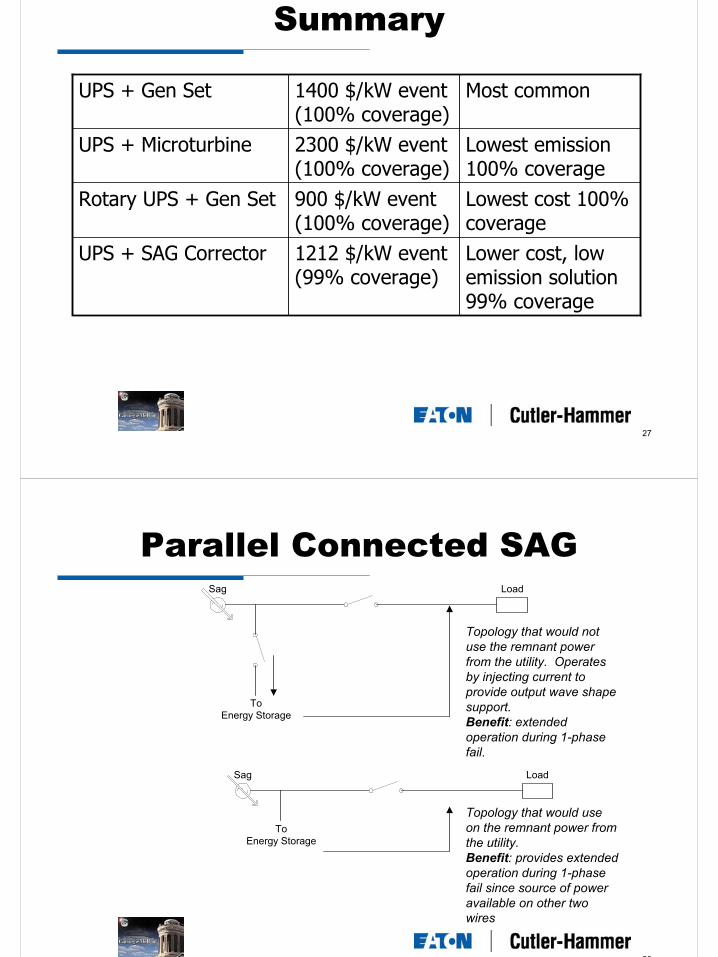
Summary
1212 $/kW event (99% coverage)
900 $/kW event(100% coverage)
2300 $/kW event(100% coverage)
1400 $/kW event(100% coverage)
Lower cost, low emission solution 99% coverage
Lowest cost 100% coverage
Lowest emission 100% coverage
Most common
UPS + SAG Corrector
Rotary UPS + Gen Set
UPS + Microturbine
UPS + Gen Set
28
Parallel Connected SAGSag Load
ToEnergy Storage
Topology that would not use the remnant power from the utility. Operates by injecting current to provide output wave shape support.Benefit: extended operation during 1-phase fail.
Sag Load
ToEnergy Storage
Topology that would use on the remnant power from the utility.Benefit: provides extended operation during 1-phase fail since source of power available on other two wires
29
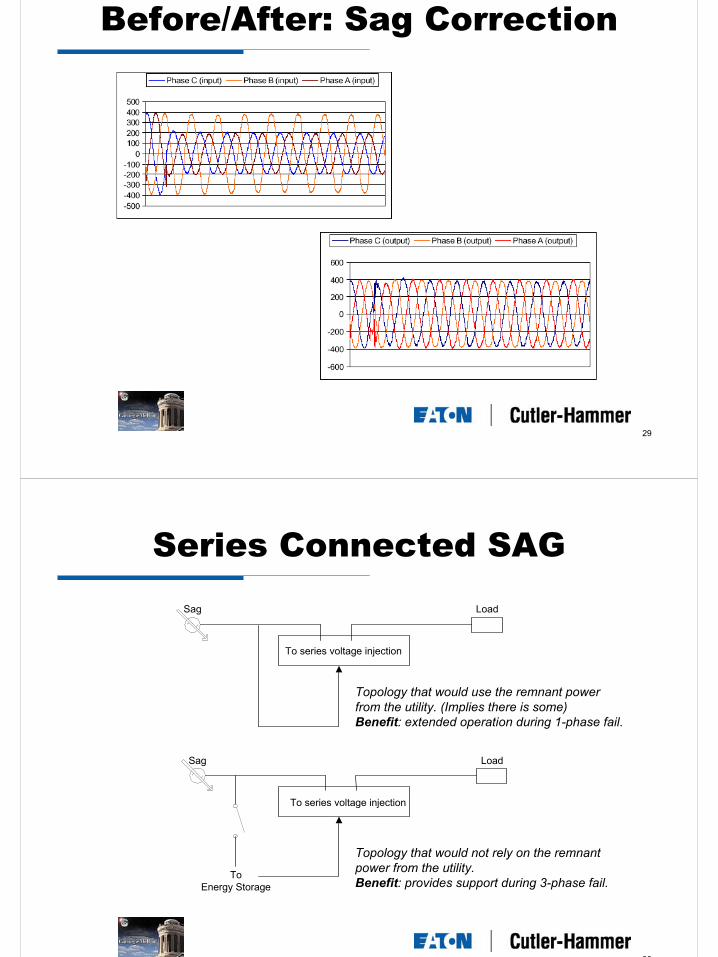
Before/After: Sag Correction
30
Series Connected SAGSag Load
To series voltage injection
Topology that would use the remnant power from the utility. (Implies there is some)Benefit: extended operation during 1-phase fail.
Sag Load
To series voltage injection
ToEnergy Storage
Topology that would not rely on the remnant power from the utility.Benefit: provides support during 3-phase fail.
31
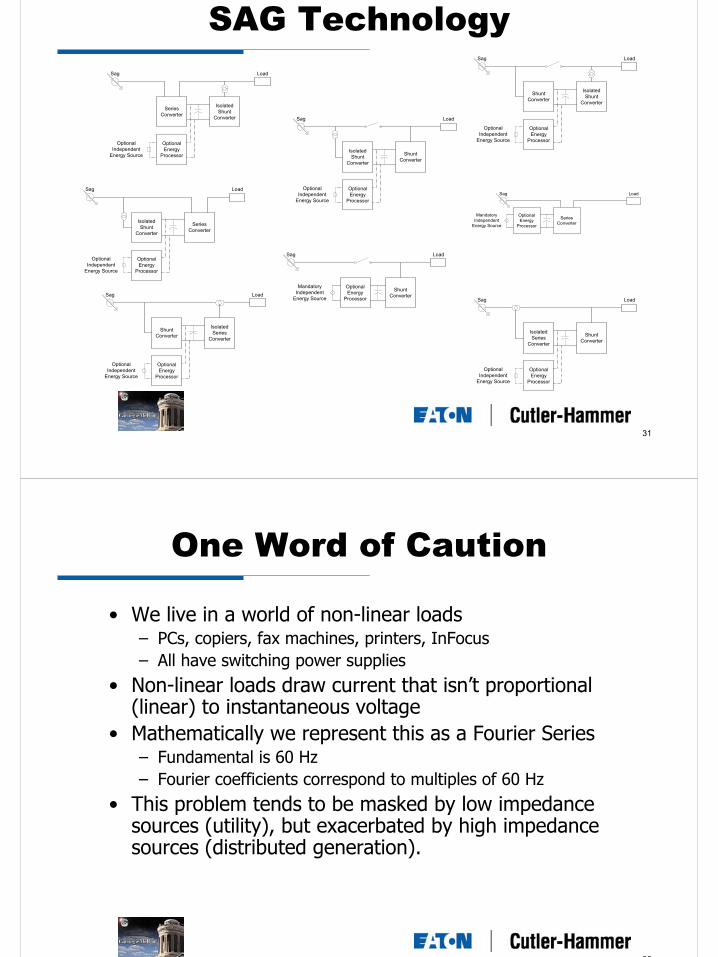
SAG Technology
Sag Load
ShuntConverter
MandatoryIndependent
Energy Source
OptionalEnergy
Processor
Sag Load
ShuntConverter
OptionalIndependent
Energy Source
OptionalEnergy
Processor
IsolatedShunt
Converter
Sag Load
IsolatedShunt
Converter
OptionalIndependent
Energy Source
OptionalEnergy
Processor
ShuntConverter
Sag Load
SeriesConverter
MandatoryIndependent
Energy Source
OptionalEnergy
Processor
Sag Load
SeriesConverter
OptionalIndependent
Energy Source
OptionalEnergy
Processor
IsolatedShunt
Converter
Sag Load
IsolatedSeries
Converter
OptionalIndependent
Energy Source
OptionalEnergy
Processor
ShuntConverter
Sag Load
IsolatedShunt
Converter
OptionalIndependent
Energy Source
OptionalEnergy
Processor
SeriesConverter
Sag Load
ShuntConverter
OptionalIndependent
Energy Source
OptionalEnergy
Processor
IsolatedSeries
Converter
32
One Word of Caution
• We live in a world of non-linear loads– PCs, copiers, fax machines, printers, InFocus– All have switching power supplies
• Non-linear loads draw current that isn’t proportional (linear) to instantaneous voltage
• Mathematically we represent this as a Fourier Series– Fundamental is 60 Hz– Fourier coefficients correspond to multiples of 60 Hz
• This problem tends to be masked by low impedance sources (utility), but exacerbated by high impedance sources (distributed generation).
33
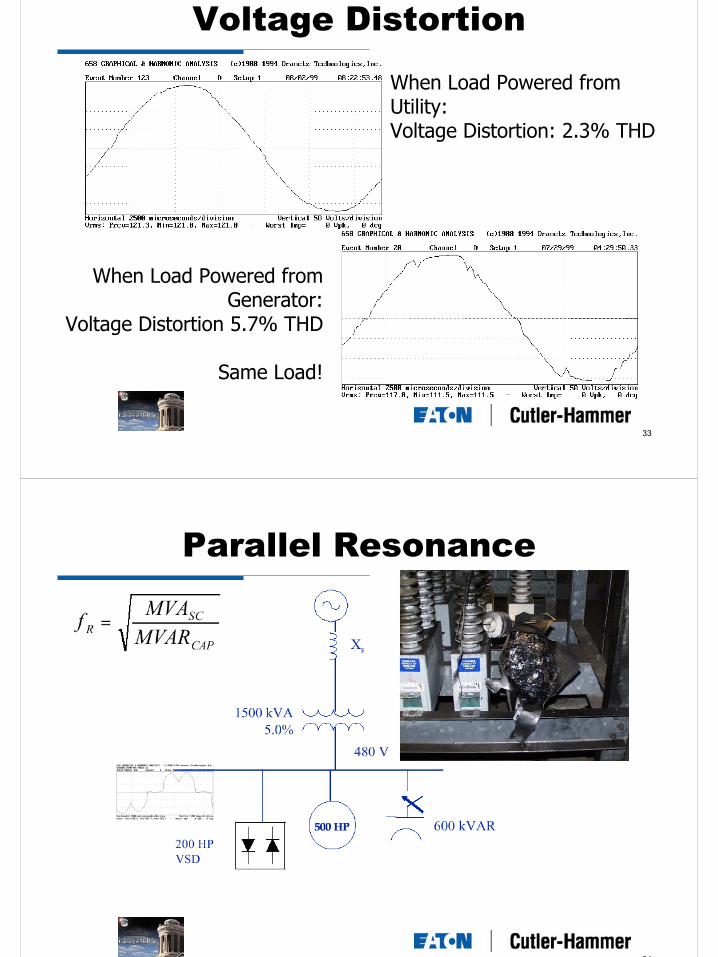
Voltage Distortion
When Load Powered fromUtility:Voltage Distortion: 2.3% THD
When Load Powered fromGenerator:
Voltage Distortion 5.7% THD
Same Load!
34
Parallel Resonance

35
There is more to say
… but I’ve run out of time!
Thank you for you interest