POWER PLANT WATER USAGE AND LOSS STUDY - … Library/Research/Coal/ewr/water...POWER PLANT WATER...
104
POWER PLANT WATER USAGE AND LOSS STUDY August 2005 Revised May 2007 Prepared for: The United States Department of Energy National Energy Technology Laboratory DOE Gasification Technology Manager: Gary J. Stiegel DOE Project Manager: James R. Longanbach Project Manager: Michael D. Rutkowski Principal Investigators: Michael G. Klett Norma J. Kuehn Ronald L. Schoff Vladimir Vaysman Jay S. White
Transcript of POWER PLANT WATER USAGE AND LOSS STUDY - … Library/Research/Coal/ewr/water...POWER PLANT WATER...

POWER PLANT WATER USAGE AND LOSS STUDY
August 2005
Revised May 2007
Prepared for:
The United States Department of Energy National Energy Technology Laboratory
DOE Gasification Technology Manager: Gary J. Stiegel
DOE Project Manager: James R. Longanbach
Project Manager: Michael D. Rutkowski
Principal Investigators: Michael G. Klett Norma J. Kuehn
Ronald L. Schoff Vladimir Vaysman
Jay S. White

Power Plant Water Usage and Loss Study
i August 2005
TABLE OF CONTENTS
TABLE OF CONTENTS ...................................................................................................................... I LIST OF TABLES............................................................................................................................. III LIST OF FIGURES ............................................................................................................................ V LIST OF ACRONYMS AND ABBREVIATIONS ................................................................................... VI EXECUTIVE SUMMARY .................................................................................................................. IX
APPROACH .................................................................................................................................. IX PLANT COMPARISONS .................................................................................................................. X RESULTS ..................................................................................................................................... XI SUGGESTED FUTURE WORK....................................................................................................... XII
1. INTRODUCTION........................................................................................................................1 1.1 APPROACH ........................................................................................................................1 1.2 PLANT COMPARISONS .......................................................................................................2 1.3 PLANT DESIGN BASIS........................................................................................................3
2. WATER LOSS ANALYSIS OF THE CONOCOPHILLIPS E-GAS IGCC PLANT ...........................8 2.1 HEAT AND MATERIAL BALANCE.....................................................................................10 2.2 EMISSIONS PERFORMANCE..............................................................................................14 2.3 WATER BALANCES .........................................................................................................14 2.4 RAW WATER USAGE.......................................................................................................18
3. WATER LOSS ANALYSIS OF THE GE ENERGY RADIANT-CONVECTIVE IGCC PLANT .......19 3.1 HEAT AND MATERIAL BALANCE.....................................................................................21 3.2 EMISSIONS PERFORMANCE..............................................................................................25 3.3 WATER BALANCES .........................................................................................................25 3.4 RAW WATER USAGE.......................................................................................................29
4. WATER LOSS ANALYSIS OF THE GE ENERGY QUENCH IGCC PLANT ...............................30 4.1 HEAT AND MATERIAL BALANCE.....................................................................................32 4.2 EMISSIONS PERFORMANCE..............................................................................................36 4.3 WATER BALANCES .........................................................................................................36 4.4 RAW WATER USAGE.......................................................................................................40
5. WATER LOSS ANALYSIS OF THE SHELL IGCC PLANT ........................................................41 5.1 HEAT AND MATERIAL BALANCE.....................................................................................43 5.2 EMISSIONS PERFORMANCE..............................................................................................47 5.3 WATER BALANCES .........................................................................................................47 5.4 RAW WATER USAGE.......................................................................................................51
6. WATER LOSS ANALYSIS OF A NATURAL GAS COMBINED CYCLE PLANT ...........................52 6.1 HEAT AND MATERIAL BALANCE.....................................................................................54 6.2 EMISSIONS PERFORMANCE..............................................................................................57 6.3 WATER BALANCES .........................................................................................................58 6.4 RAW WATER USAGE.......................................................................................................60
7. WATER LOSS ANALYSIS OF A SUBCRITICAL PULVERIZED COAL PLANT ............................62 7.1 HEAT AND MATERIAL BALANCE.....................................................................................64 7.2 EMISSIONS PERFORMANCE..............................................................................................67 7.3 WATER BALANCES .........................................................................................................68 7.4 RAW WATER USAGE.......................................................................................................70
8. WATER LOSS ANALYSIS OF A SUPERCRITICAL PULVERIZED COAL PLANT........................72

Power Plant Water Usage and Loss Study
ii August 2005
8.1 HEAT AND MATERIAL BALANCE.....................................................................................74 8.2 EMISSIONS PERFORMANCE..............................................................................................77 8.3 WATER BALANCES .........................................................................................................78 8.4 WATER USAGE................................................................................................................80
9. RESULTS.................................................................................................................................82 9.1 PROCESS LOSSES.............................................................................................................82 9.2 FLUE GAS LOSSES...........................................................................................................83 9.3 COOLING WATER LOSSES ...............................................................................................83 9.4 RAW WATER USAGE.......................................................................................................86 9.5 RECOMMENDATIONS.......................................................................................................88

Power Plant Water Usage and Loss Study
iii August 2005
LIST OF TABLES
Table ES-1 Water Loss Summary, gallons per MWh..................................................................xiii Table 1-1 Site Characteristics ......................................................................................................... 4 Table 1-2 Base Coal Analysis – Pittsburgh No. 8 .......................................................................... 5 Table 1-3 Natural Gas Analysis...................................................................................................... 6 Table 1-4 Greer Limestone Analysis .............................................................................................. 6 Table 1-5 Cooling System Assumptions......................................................................................... 7 Table 2-1 E-GAS IGCC Plant Performance Summary 100 Percent Load ..................................... 9 Table 2-2 E-GAS™ Gasifier-Based Dual-Train IGCC Stream Tables (page 1 of 2) .................. 12 Table 2-3 Air Emissions IGCC, Oxygen-Blown E-GAS™ ......................................................... 14 Table 2-4 E-GAS™ IGCC Overall Water Balance ...................................................................... 15 Table 2-5 E-GAS™ IGCC Water Loss by Function .................................................................... 15 Table 2-6 E-GAS™ IGCC Water Balance Around Gasification Island....................................... 17 Table 2-7 E-GAS™ IGCC Water Balance Around Power Island................................................ 17 Table 2-8 E-GAS™ IGCC Water Balance Around Cooling Water System................................. 17 Table 2-9 E-GAS™ IGCC Raw Water Usage.............................................................................. 18 Table 3-1 GE Energy Radiant-Convective IGCC Plant Performance Summary 100 Percent Load
................................................................................................................................... 20 Table 3-2 GE Energy Radiant-Convective IGCC Stream Tables (page 1 of 2) ........................... 23 Table 3-3 Airborne Emissions IGCC, Oxygen-Blown GE Energy Radiant-Convective ............ 25 Table 3-4 GE Energy Radiant-Convective IGCC Overall Water Balance................................... 26 Table 3-5 GE Energy Radiant-Convective IGCC Water Loss by Function ................................. 26 Table 3-6 GE Energy Radiant-Convective IGCC Water Balance Around Gasification Island ... 28 Table 3-7 GE Energy Radiant-Convective IGCC Water Balance Around Power Island............. 28 Table 3-8 GE Energy Radiant-Convective IGCC Water Balance Around Cooling Water System
................................................................................................................................... 28 Table 3-9 GE Energy Radiant-Convective IGCC Raw Water Usage........................................... 29 Table 4-1 GE Energy Quench IGCC Plant Performance Summary 100 Percent Load................ 31 Table 4-2 GE Energy Quench IGCC Stream Tables (page 1 of 2)............................................... 34 Table 4-3 Airborne Emissions IGCC, Oxygen-Blown GE Energy ............................................. 36 Table 4-4 GE Energy Quench IGCC Overall Water Balance....................................................... 37 Table 4-5 GE Energy Quench IGCC Water Loss by Function..................................................... 37 Table 4-6 GE Energy Quench IGCC Water Balance Around Gasification Island....................... 39 Table 4-7 GE Energy Quench IGCC Water Balance Around Power Island ................................ 39 Table 4-8 GE Energy Quench IGCC Water Balance Around Cooling Water System................. 39 Table 4-9 GE Energy Quench IGCC Raw Water Usage .............................................................. 40 Table 5-1 Shell IGCC Plant Performance Summary 100 Percent Load....................................... 42 Table 5-2 Shell Gasifier-Based Dual-Train IGCC Stream Tables (page 1 of 2) .......................... 45 Table 5-3 Shell Gasifier Airborne Emissions IGCC, Oxygen-Blown Shell................................. 47 Table 5-4 Shell IGCC Overall Water Balance.............................................................................. 48 Table 5-5 Shell IGCC Water Loss by Function............................................................................ 48 Table 5-6 Shell IGCC Water Balance Around Gasification Island .............................................. 50 Table 5-7 Shell IGCC Water Balance Around Power Island ....................................................... 50 Table 5-8 Shell IGCC Water Balance Around Cooling Water System........................................ 50 Table 5-9 Shell IGCC Raw Water Usage ..................................................................................... 51

Power Plant Water Usage and Loss Study
iv August 2005
Table 6-1 Two 7FA x One NGCC Plant Performance Summary - 100 Percent Load ................. 53 Table 6-2 Natural Gas Combined Cycle Stream Table ................................................................ 56 Table 6-3 Airborne Emissions Two 7FA x One NGCC............................................................... 57 Table 6-4 NGCC Overall Water Balance ..................................................................................... 58 Table 6-5 NGCC Water Loss by Function ................................................................................... 58 Table 6-6 NGCC Water Balance Around Gas Turbine Island ..................................................... 60 Table 6-7 NGCC Water Balance Around Cooling Water System................................................ 60 Table 6-8 NGCC Raw Water Usage............................................................................................. 61 Table 7-1 Subcritical PC Boiler Plant Performance Summary 100 PERCENT LOAD............... 63 Table 7-2 Subcritical PC Boiler Stream Table ............................................................................. 66 Table 7-3 Emission Limits Set by BACT..................................................................................... 67 Table 7-4 Airborne Emissions Subcritical PC Boiler ................................................................... 67 Table 7-5 Subcritical PC Boiler Overall Water Balance .............................................................. 68 Table 7-6 Subcritical PC Boiler Water Loss by Function ............................................................ 68 Table 7-7 Subcritical PC Boiler Water Balance Around FGD Island .......................................... 70 Table 7-8 Subcritical PC Boiler Water Balance Around Cooling Water System ........................ 70 Table 7-9 Subcritical PC Boiler Raw Water Usage...................................................................... 71 Table 8-1 Supercritical PC Boiler Plant Performance Summary 100 Percent Load .................... 73 Table 8-2 Supercritical PC Boiler Stream Table .......................................................................... 76 Table 8-3 Emission Limits Set by BACT..................................................................................... 77 Table 8-4 Airborne Emissions Subcritical PC.............................................................................. 77 Table 8-5 Supercritical PC Boiler Overall Water Balance ........................................................... 78 Table 8-6 Supercritical PC Boiler Water Loss by Function ......................................................... 78 Table 8-7 Supercritical PC Boiler Water Balance Around FGD Island ....................................... 80 Table 8-8 Supercritical PC Boiler Water Balance Around Cooling Water System ..................... 80 Table 8-9 Supercritical PC Boiler Raw Water Usage................................................................... 81 Table 9-1 Water Loss Summary, gallons per MWh ..................................................................... 84 Table 9-2 Water Loss Summary, gallons per MMBtu.................................................................. 84 Table 9-3 Raw Water Usage Summary, gallons per MWh .......................................................... 86

Power Plant Water Usage and Loss Study
v August 2005
LIST OF FIGURES
Figure ES-1 IGCC Water Loss Summary for Various Gasifier Types, gallons per MWh.......... xiii Figure ES-2 Comparison of Water Loss for Various Fossil Plants, gallons per MWh ............... xiv Figure ES-3 Comparison of Raw Water Usage for Various Fossil Plants, gallons per MWh .... xiv Figure 2-1 E-GAS™ Gasifier-Based IGCC Case – Block Flow Diagram................................... 11 Figure 2-2 E-GAS™ Gasifier-Based IGCC Case – Block Flow Diagram – Water Flows in
Gallons per Minute .................................................................................................... 16 Figure 3-1 GE Energy Radiant-Convective IGCC Case – Block Flow Diagram......................... 22 Figure 3-2 GE Energy Radiant-Convective IGCC Case – Block Flow Diagram – Water Flows in
Gallons per Minute .................................................................................................... 27 Figure 4-1 GE Energy Quench IGCC Case – Block Flow Diagram ............................................ 33 Figure 4-2 GE Energy Quench IGCC Case – Block Flow Diagram – Water Flows in Gallons per
Minute........................................................................................................................ 38 Figure 5-1 Shell Gasifier-Based IGCC Case – Block Flow Diagram .......................................... 44 Figure 5-2 Shell Gasifier-Based IGCC Case – Block Flow Diagram – Water Flows in Gallons
per Minute.................................................................................................................. 49 Figure 6-1 Natural Gas Combined Cycle Case – Block Flow Diagram....................................... 55 Figure 6-2 NGCC Case – Block Flow Diagram – Water Flows in Gallons per Minute .............. 59 Figure 7-1 Subcritical PC Boiler Case – Block Flow Diagram.................................................... 65 Figure 7-2 Subcritical PC Boiler Case – Block Flow Diagram – Water Flows in Gallons per
Minute........................................................................................................................ 69 Figure 8-1 Supercritical PC Boiler Case – Block Flow Diagram................................................. 75 Figure 8-2 Supercritical PC Boiler Case – Block Flow Diagram – Water Flows in Gallons per
Minute........................................................................................................................ 79 Figure 9-1 IGCC Water Loss Summary for Various Gasifier Types, gallons per MWh ............. 85 Figure 9-2 Comparison of Water Loss for Various Fossil Plants, gallons per MWh................... 85 Figure 9-3 Comparison of Raw Water Usage for Various Fossil Plants, gallons per MWh ........ 87

Power Plant Water Usage and Loss Study
vi August 2005
LIST OF ACRONYMS AND ABBREVIATIONS
AGR Acid gas removal ASU Air separation unit BACT Best available control technology BFW Boiler feedwater Btu British thermal unit CAA Clean Air Act CAAA Clean Air Act Amendments of 1990 CCT Clean coal technology cfm Cubic feet per minute CF Capacity factor CH4 Methane CO2 Carbon dioxide COS Carbonyl sulfide CSC Connective syngas cooler CT Combustion turbine CW Cooling water CWT Cold water temperature DLN Dry low NOx DOE Department of Energy E-GasTM Global Energy gasifier technology EPA Environmental Protection Agency EPC Engineering, procurement, construction ESP Electrostatic precipitator FD Forced draft FGD Flue gas desulfurization FRP Fiberglass-reinforced plastic GE General Electric GE R-C GE Energy Radiant-Convective IGCC GE Quench GE Energy Quench IGCC gpm Gallons per minute GT Gas turbine h Hour H2 Hydrogen HHV Higher heating value
Power Plant Water Usage and Loss Study
vii August 2005
Hg Mercury hp Horsepower HP High pressure HRSG Heat recovery steam generator HWT Hot water temperature Hz Hertz in. H2O Inches water in. Hga Inches mercury (absolute pressure) in. W.C. Inches water column ID Induced draft IGCC Integrated gasification combined cycle IP Intermediate pressure ISO International Standards Organization kV Kilovolt kW Kilowatt kWe Kilowatts electric kWh Kilowatt-hour kWt Kilowatts thermal lb Pound LHV Lower heating value LP Low pressure MCR Maximum coal burning rate MDEA Methyldiethanolamine MMBtu Million British thermal units (also shown as 106 Btu) MWe Megawatts electric MWh Megawatts-hour MWt Megawatts thermal
N2 Nitrogen NETL National Energy Technology Laboratory N/A Not applicable NGCC Natural gas combined cycle NH3 Ammonia NOx Oxides of nitrogen NSPS New Source Performance Standards O&M Operations and maintenance OD Outside diameter

Power Plant Water Usage and Loss Study
viii August 2005
PA Primary air PC Pulverized coal PC Sub Subcritical Pulverized coal system PC Super Supercritical Pulverized coal system pph Pounds per hour ppmvd Parts per million volume, dry PSD Prevention of significant deterioration psia Pounds per square inch absolute psig Pounds per square inch gage rpm Revolutions per minute scfm Standard cubic feet per minute RSC Radiant syngas cooler SC Supercritical SCR Selective catalytic reduction SG Syngas SO2 Sulfur dioxide ST Steam turbine TGTU Tail gas treating unit tpd Tons per day tph Tons per hour WB Wet bulb wt% Weight percent

Power Plant Water Usage and Loss Study
ix August 2005
EXECUTIVE SUMMARY
This report was updated in May 2007. The cooling tower evaporative and blowdown losses were overstated in the initial report, and those numbers were modified in this update. All numbers impacted by the change in cooling tower losses were also updated. No other changes were made.
Estimates have been previously made of water usage or water loss for conceptual power plant configurations and have been used as the basis for comparisons of the water impacts of technology options. These previous estimates have been made using available flow sheet data that have generally not been complete, and as a result have generated potentially misleading comparisons. It is important that any comparisons be made using data from complete water balances for the flow sheets and that all uses, makeup streams, discharges, internal generation and losses be accounted for in the balance and assessment of water streams in order to establish credible conclusions.
It is the intent of the study reported here to (1) establish a thorough accounting of water usage throughout the power plant and establish a credible methodology that can be used for future studies, (2) provide a baseline set of cases and water loss data for assessing potential improvements and evaluating R&D programs, and (3) provide a basis for comparing water usage in various types of advanced power systems.
The objective of this study is to prepare a source of information from which valid comparisons can be made for the water loss between the various fossil fuel power plants such as IGCC, PC, and NGCC. The purposes include:
1. Draw valid comparisons on a common basis for (a) various fossil fuel power generation technologies, and (b) different gasification technologies.
2. Provide data to evaluate the water usage and loss issues and identify areas for research and development to reduce water losses.
3. Provide an initial assessment of the potential for reduction in water loss in gasification applications through the use of technology improvements.
The current study has developed the information, methodology, and water accounting systems to enable a credible assessment of water usage and loss in power plant systems. This then achieves objective #1 above. Objectives #2 and 3 can be addressed in future studies using the methodology developed here.
APPROACH
This study is based on a normalized comparison of seven fossil fuel power plants, each designed from a common design basis, nominally producing 500 MWe net. Coal-fired plants used a common coal, and one plant was fired on natural gas. A common mid-USA site was used as the
Power Plant Water Usage and Loss Study
x August 2005
base design plant location with evaporative cooling towers used to reject condenser heat. The plants reviewed included:
• ConocoPhillips E-GasTM IGCC (E-Gas) • GE Energy Radiant-Convective IGCC (GE R-C) • GE Energy Quench IGCC (GE Quench) • Shell IGCC (Shell) • Natural Gas Combined Cycle (NGCC) • Subcritical PC (PC Sub) • Supercritical PC (PC Super)
PLANT COMPARISONS
For each of the plants, heat and material balances were prepared on a common basis with emphasis on the water usage and loss. The distinction between usage and loss is defined as follows:
Raw Water Usage is defined as the water metered from a raw water source and used in the plant processes for any and all purposes, such as cooling tower makeup, condenser makeup, slurry preparation makeup, ash handling makeup, syngas humidification, quench system makeup, and FGD system makeup. In this study, all plants are equipped with evaporative cooling towers, and all process blowdown streams are assumed to be treated and recycled to the cooling tower. Usage represents the overall impact of the process on the water source.
Water Loss is defined as the water exiting the system and represents the overall “loss” of water to the environment. Such losses can occur as physical losses including process blowdown streams, water entrained in solids, or gas streams vented to the atmosphere, or they can occur through chemical reactions such as gasification shift or hydrolysis. Because water also enters the system with the fuel and ambient air and through combustion reactions, water loss is greater than raw water usage. While the difference between raw water usage and water loss represents the liberation of fuel bound moisture and products of combustion which exit the system and enter the atmosphere, this potential net generation of water resources (water out > water in) is not directly available and is “lost” to the water budget
Water flows, makeup, and points of loss were identified and quantified. Since essentially all fuel-bound hydrogen ends up as water, hydrogen was tracked for each plant and major process area. The cooling tower makeup requirements were separately determined using a consistently applied methodology. Assessing the effects of climatological changes on plant performance and the need for oversizing equipment relative to the standard design have not been addressed in this report but could be considered for future studies.
For each of the seven power plants, the following were prepared:
• Plant Performance Summary

Power Plant Water Usage and Loss Study
xi August 2005
• Heat and Material Balance
• Emission Performance
• Process Block Flow Diagram
• Water Block Flow Diagram
• Overall Water Balance
• Major Plant Sections Water Balance
RESULTS
Water loss results are summarized in Table ES-1. Figure ES-1 shows the results in the form of a bar graph comparing various types of gasifiers. Figure ES-2 shows a comparison of various power plant systems. Water loss is based on an overall balance of the plant source and exit streams. This includes coal moisture, air humidity, process makeup, cooling tower makeup (equivalent to evaporation plus blowdown), process losses (including losses through reactions, solids entrainment, and process makeup/blowdown) and flue gas losses.
The raw water usage in this study is defined as the total amount of water to be supplied from local water resources to provide for the needs of the plant. Raw water usage differs from water loss. The difference is attributable to water entering the system via humid air intake, water content of the fuel, and water produced in gasification/combustion reactions. For example in the cooling tower, the raw water usage is makeup to the cooling tower while the cooling tower loss calculation includes water recycled from other sources. The raw water usage can be the determining factor for plant siting and permitting, as it may have a significant impact on local water availability. The results of the raw water usage calculations are summarized as a bar graph in Figure ES-3.
Process losses are more pronounced with the IGCC plants due to the need to add water to the gasification reactions and promote shift to hydrogen and carbon dioxide. There are no process losses with the NGCC plant. PC plant process losses are confined to water lost with disposal of the FGD gypsum cake. The process losses in each of the systems are the smallest category of loss.
Flue gas losses vary with the type of power plant and the methodology for conditioning either the syngas or the flue gas. Each of the IGCC plants has syngas humidification for NOx mitigation. All of the gasification cases utilize nitrogen injection to dilute the syngas, and the E-Gas and Shell cases have supplemental steam dilution along with the nitrogen dilution. This can be seen in the variations of flue gas water losses for the IGCC gas turbines. The NGCC does not utilize natural gas humidification before firing in the GT combustor; however, the flue gas losses are indicative of the water produced from the air and fuel. The PC power plants each have FGD. These wet processes result in significant water losses to the flue gas from evaporation.
Eighty to ninety-nine percent of the power plant raw water usage is through a combination of cooling tower evaporation and blowdown. This water usage is based on a generic site and

Power Plant Water Usage and Loss Study
xii August 2005
assumed cooling tower performance characteristics (see Section 1.3.3). Cooling tower performance as a function of plant condenser duty (plus 100 MMBtu/h of auxiliary load) was assumed for each power plant. Water loss differences are associated with plant condenser duty which can be traced back to plant efficiency and other uses of condensing steam such as methods of syngas humidification or syngas dilution.
SUGGESTED FUTURE WORK
This study consists of the initial phase of an effort to thoroughly document the use of water in power plants, particularly in IGCC applications. The plant configurations used here are based on current commercial offerings and on rigorous systems analysis results. The sites are generic middle USA and water for process and cooling makeup is readily available. There were no economic analyses performed.
• The plant designs from this study can be used as a baseline for conducting additional systems analysis. This analysis would be based upon such design changes as location, water use limitations, and plant efficiency. Changes in process design could also determine the sensitivity to water loss.
• This report should provide some basis for reviewing the design assumptions, technology capabilities, system performance, etc. and identify areas where new technology approaches or gasifier designs could lead to substantially lower water requirements. In turn, this can be a tool for planning R&D and gaining acceptance of out-of-the-box proposals for R&D projects.

Power Plant Water Usage and Loss Study
xiii August 2005
Table ES-1 Water Loss Summary, gallons per MWh
E-Gas gal/MWh
Shell gal/MWh
GE R-C gal/MWh
GE Quench gal/MWh
NGCC gal/MWh
PC Sub gal/MWh
PC Supe gal/MWh
Process losses
Coal drying moisture 3.3 Water lost in gasification shift 11.1 6.0 16.7 18.2
Ash quench blowdown 8.7 7.8 8.4 9.3 Water with slag 3.0 3.7 3.3 3.7
Water lost in COS hydrolysis 0.0 0.2 0.0 0.1 Sour water blowdown 3.1 4.5 0.5 2.5 Water with gypsum 9.3 8.3 Total 26 25 29 34 0 9 8
Flue gas losses GT flue gas 105.5 75.3 78.0 104.8 87.0 Incinerator flue gas 1.5 Boiler flue gas 107.0 94.8 Total 106 77 78 105 87 107 95
Cooling water losses Cooling tower blowdown 75.3 85.1 86.1 92.9 70.6 149.4 133.9 Cooling tower evaporation 225.9 255.5 258.5 278.9 212.0 448.5 401.9 Total 301 341 345 372 283 598 536
Grand Total 433 443 452 510 370 714 639
Figure ES-1 IGCC Water Loss Summary for Various Gasifier Types, gallons per MWh
0
100
200
300
400
500
600
Wat
er L
oss,
Gal
/MW
h
E-Gas Shell GE R-C GE Quench
Process Losses Flue Gas Losses Cooling Tower Losses Total

Power Plant Water Usage and Loss Study
xiv August 2005
Figure ES-2 Comparison of Water Loss for Various Fossil Plants, gallons per MWh
26106
301
433 gal/MWh
2577
341
443 gal/MWh
2978
345
452 gal/MWh
34105
372
510 gal/MWh
087
283
370 gal/MWh
9107
598
714 gal/MWh
895
536
639 gal/MWh
0
100
200
300
400
500
600
700
800
Wat
er L
oss,
Gal
/MW
h
E-Gas Shell GE R-C GE Quench NGCC PC Sub PC Super
Process Losses Flue Gas losses Cooling Tower Losses Total Losses
Figure ES-3 Comparison of Raw Water Usage for Various Fossil Plants, gallons per MWh
300
372 gal/MWh
340
390 gal/MWh
339
388 gal/MWh
347
439 gal/MWh
281
283 gal/MWh
594
664 gal/MWh
532
594 gal/MWh
0
100
200
300
400
500
600
700
800
Raw
Wat
er U
sage
, Gal
/MW
h
E-Gas Shell GE R-C GE Quench NGCC PC Sub PC Super
Slurry Quench Ash Handling Humidifier Cooling Tower Condenser FGD Total
Usage

Power Plant Water Usage and Loss Study
1 August 2005
1. INTRODUCTION
Estimates have been previously made of water usage or water loss for conceptual power plant configurations and have been used as the basis for comparisons of the water impacts of technology options. These previous estimates have been made using available flow sheet data that have generally not been complete, and as a result have generated potentially misleading comparisons. It is important that any comparisons be made using data from complete water balances for the flow sheets and that all uses, makeup streams, discharges, internal generation and losses be accounted for in the balance and assessment of water streams in order to establish credible conclusions.
It is the intent of the study reported here to (1) establish a thorough accounting of water usage throughout the power plant and establish a credible methodology that can be used for future studies, (2) provide a baseline set of cases and water loss data for assessing potential improvements and evaluating R&D programs, and (3) provide a basis for comparing water usage in various types of advanced power systems.
The objective of this study is to prepare a source of information from which valid comparisons can be made for the water loss between the various fossil fuel power plants such as IGCC, PC, and NGCC. The purposes include:
1. Draw valid comparisons on a common basis for (a) various fossil fuel power generation technologies, and (b) different gasification technologies.
2. Provide data to evaluate the water usage and loss issues and identify areas for research and development to reduce water losses.
3. Provide an initial assessment of the potential for reduction in water loss in gasification applications through the use of technology improvements.
The current study has developed the information, methodology, and water accounting systems to enable a credible assessment of water usage and loss in power plant systems. This then achieves objective #1 above. Objectives #2 and 3 can be addressed in future studies using the methodology developed here.
1.1 APPROACH
This study was based on a normalized comparison of seven fossil fuel power plants, each designed from a common design basis, nominally producing 500 MWe net. Coal-fired plants used a common coal, and one plant was fired on natural gas. A common mid-USA site was the base design plant location.

Power Plant Water Usage and Loss Study
2 August 2005
The plants reviewed were as follows:
• ConocoPhillips E-GasTM IGCC (E-Gas) • GE Energy Radiant-Convective IGCC (GE R-C) • GE Energy Quench IGCC (GE Quench) • Shell IGCC (Shell) • Natural Gas Combined Cycle (NGCC) • Subcritical PC (PC Sub) • Supercritical PC (PC Super)
1.2 PLANT COMPARISONS
For each of the plants, heat and material balances were prepared on a common basis with emphasis on the water usage and loss. The distinction between usage and loss is defined as follows:
Raw Water Usage is defined as the water metered from a raw water source and used in the plant processes for any and all purposes, such as cooling tower makeup, condenser makeup, slurry preparation makeup, ash handling makeup, syngas humidification, quench system makeup, and FGD system makeup. In this study, all plants are equipped with evaporative cooling towers, and all process blowdown streams are assumed to be treated and recycled to the cooling tower. Usage represents the overall impact of the process on the water source.
Water Loss is defined as the water exiting the system and represents the overall “loss” of water to the environment. Such losses can occur as physical losses including process blowdown streams, water entrained in solids, or gas streams vented to the atmosphere, or they can occur through chemical reactions such as gasification shift or hydrolysis. Because water also enters the system with the fuel and ambient air and through combustion reactions, water loss is greater than raw water usage. While the difference between raw water usage and water loss represents the liberation of fuel bound moisture and products of combustion which exit the system and enter the atmosphere, this potential net generation of water resources (water out > water in) is not directly available and is “lost” to the water budget
Water flows, makeup, and points of loss were identified and quantified. Since essentially all fuel-bound hydrogen ends up as water, hydrogen was tracked for each plant and major process area. The cooling tower makeup requirements were separately determined using a consistently applied methodology as described in Section 1.3.3. Assessing the effects of climatological changes on plant performance and the need for oversizing equipment relative to the standard design have not been addressed in this report but could be considered for future studies.
Power Plant Water Usage and Loss Study
3 August 2005
For each of the seven power plants, the following were prepared as deliverables:
• Plant Performance Summary
• Heat and Material Balance
• Emission Performance
• Process Block Flow Diagram
• Water Block Flow Diagram
• Overall Water Balance
• Major Plant Sections Water Balance
• Discussion of Water Loss
1.3 PLANT DESIGN BASIS
The performance and environmental data developed in this report are the result of maintaining a consistent design basis throughout. Common design inputs for site, ambient, and fuel characteristics were developed and are defined in the following subsections.
1.3.1 Plant Site and Ambient Design Conditions
The plant site is assumed to be a mid-United States location consisting of approximately 300 usable acres (not including ash disposal) within 15 miles of a medium-sized metropolitan area, with a well-established infrastructure capable of supporting the required construction work force. The area immediately surrounding the site has a mixture of agricultural and light industrial uses. The site is served by a river of adequate quantity for use as makeup cooling water with minimal pretreatment.
A railroad line suitable for unit coal trains passes within 2-1/2 miles of the site boundary. A well-developed road network serves the site, capable of carrying multiple loads and with overhead restriction of not less than 16 feet (Interstate Standard).
The site is on relatively flat land with a maximum difference in elevation within the site of about 30 feet. The topography of the area surrounding the site is rolling hills, with elevations within 2,000 yards not more than 300 feet above the site elevation.
The site is within Seismic Zone 1, as defined by the Uniform Building Code. Table 1-1 lists the ambient characteristics of this site.

Power Plant Water Usage and Loss Study
4 August 2005
Table 1-1 Site Characteristics
Location Mid USA Topography Level Elevation 500 feet Design Air Pressure 14.4 psia Design Temperature, dry bulb 63°F Corresponding Relative Humidity 55% Design Temperature, dry bulb max. 89°F Design Temperature, wet bulb max. 75°F Design Temperature, min. 1°F Transportation Rail access Water On site Ash Disposal Off site
1.3.2 Feedstocks
Feedstocks are characterized in the following tables:
Pittsburgh No. 8 coal See Table 1-2
Natural gas See Table 1-3
Greer limestone See Table 1-4

Power Plant Water Usage and Loss Study
5 August 2005
Table 1-2 Base Coal Analysis – Pittsburgh No. 8
Ultimate Analysis Constituent Air Dry, % Dry, % As Received, %
Carbon Hydrogen Nitrogen Sulfur Ash Oxygen
Total
71.88 4.97 1.26 2.99
10.30 8.60 100.00
73.79 4.81 1.29 3.07
10.57 6.47 100.00
69.36 5.18 1.22 2.89 9.94
11.41 100.00
Proximate Analysis Dry Basis, % As Received, % Moisture Ash Volatile Matter Fixed Carbon
Total
Sulfur Btu Content Moisture and Ash Free (MAF), Btu
-- 10.57 38.20
51.23 100.00
3.07
13,244 14,810
6.00 9.94
35.91 48.15 100.00
2.89
12,450
Ash Analysis, % Silica, SiO2 Aluminum Oxide, Al2O3 Iron Oxide, Fe2O3 Titanium Dioxide, TiO2 Calcium Oxide, CaO Magnesium Oxide, MgO Sodium Oxide, Na2O Potassium Oxide, K2O Sulfur Trioxide, SO3 Phosphorous Pentoxide, P2O5
Total
48.1 22.3 24.2 1.3 1.3 0.6 0.3 1.5 0.8
0.1 100
Ash Fusion Temperature Reducing
Atmosphere, °F Oxidizing
Atmosphere, °F Initial Deformation Spherical Hemispherical Fluid
2015 2135 2225 2450
2570 2614 2628 2685

Power Plant Water Usage and Loss Study
6 August 2005
Table 1-3 Natural Gas Analysis
Volume, % CH4 90 C2H6 5 N2 5 HHV, Btu/scf 1,002 HHV, Btu/lb 21,824
Table 1-4 Greer Limestone Analysis
Dry Basis, % Calcium Carbonate, CaCO3 80.40 Magnesium Carbonate, MgCO3 3.50 Silica, SiO2 10.32 Aluminum Oxide, Al2O3 3.16 Iron Oxide, Fe2O3 1.24 Sodium Oxide, Na2O 0.23 Potassium Oxide, K2O 0.72 Balance 0.43
1.3.3 Cooling System Makeup Methodology
All cases in this report are compared based on the cooling system as described in this subsection. Each design case assumes that the waste heat from all plant components is rejected by the closed recirculating water system equipped with evaporative mechanical draft cooling towers. Thus, the cooling system heat duty takes into account heat load not only from the steam turbine condenser, but also from the gasifier, combustion turbine, steam turbine, ASU and other plant auxiliaries.
Heat from the steam turbine condenser is removed by the circulating water system, which takes suction from the circulating water pumps located in the cooling tower basin. Heat from the balance-of-plant equipment is also removed by the cooling water system via the auxiliary cooling water system. In this study it is assumed that the auxiliary heat load is 100 MMBtu/h for all cases. The heated circulating water is then discharged back to the cooling tower where cooling occurs mostly by evaporation. While for a specific plant, the cooling system is optimized to meet project economic and technical design criteria, hypothetical assumptions were made for comparative purposes in this study.
Makeup water is drawn from the plant raw water supply system to account for water losses due to evaporation, cooling tower blowdown, and drift in the cooling system, and water losses related to other plant processes. Water losses due to evaporation are largely dependent upon

Power Plant Water Usage and Loss Study
7 August 2005
cooling system heat duty, since about 70% of heat in the cooling tower is rejected by evaporation. The amount of cooling system blowdown, generally a function of the makeup water quality, amounts to one-fourth of the makeup. The makeup water available for most cooling towers in the US will permit two to four cycles of concentrations of dissolved solids in the circulating water. For a specific installation, an economic balance between blowdown and water treatment is typically established in order to obtain the lowest capital costs. Four cycles of concentration are assumed for this study.
Cooling system sizing is based upon wet bulb average maximum temperatures that are exceeded by no more than 2% during the year for the Chicago area. Total water losses (evaporation, blowdown and drift) are calculated as follows: [1]
• Evaporative losses of 0.8 percent of the circulating water flow rate per 10°F of range
• Drift losses of 0.001 percent of the circulating water flow rate
• Blowdown losses as follows:
o Blowdown Losses = Evaporative Losses / (Cycles of Concentration - 1)
Where cycles of concentration is a measure of water quality, and a value of 4 was chosen for this study. Evaporative and drift losses are combined and reported as evaporative losses in the balance of the report.
Other cooling system assumptions in this study are summarized in Table 1-5:
Table 1-5 Cooling System Assumptions
System type: Closed recirculating system with evaporative mechanical draft cooling towers
Design dry bulb max. ambient temperature, °F 89
Design wet bulb max. ambient temperature, °F 75
Cooling tower approach, °F 5
Cooling tower range, °F 25
Cold circulating water temperature to condenser, °F 80
Hot circulating water temperature from condenser, °F 105
Circulating water cycles of concentration 4
Cooling tower drift (% of CW flow rate) 0.001%
1 Cooling Tower Fundamentals, ed. John C. Hensley, 2nd Edition, The Marley Cooling Tower Company, Mission, Kansas, 1985
Power Plant Water Usage and Loss Study
8 August 2005
2. WATER LOSS ANALYSIS OF THE CONOCOPHILLIPS E-GAS IGCC PLANT
The study design goal was to track the water flows and usages for all the major sections of the plant. Since essentially all fuel-bound hydrogen ends up as water, hydrogen was also tracked for each plant and major process area. An overall water balance and a water balance for each major plant section was then generated.
This IGCC plant design is based on the ConocoPhillips Energy Corporation E-GAS™ gasification technology, which utilizes two pressurized entrained-flow E-GAS™ two-stage gasifiers to meet the syngas fuel requirements for two General Electric 7FA combustion turbines.
The power generation technology is based on selection of a gas turbine derived from the General Electric 7FA machine. The plant is configured with two gasifiers including processes to progressively cool and clean the gas, making it suitable for combustion in the gas turbines. The resulting plant produces a net output of 526 MWe at a net efficiency of 39.2 percent on an HHV basis. Performance is based on the properties of Pittsburgh No. 8 coal, described in the plant design basis. Overall performance for the entire plant is summarized in Table 2-1, which includes auxiliary power requirements.

Power Plant Water Usage and Loss Study
9 August 2005
Table 2-1 E-GAS IGCC Plant Performance Summary
100 Percent Load
POWER SUMMARY (Gross Power at Generator Terminals, kWe) Gas Turbine Power Steam Turbine Total
394,000 227,900 621,900
AUXILIARY LOAD SUMMARY, kWe Coal Handling Coal Milling Coal Slurry Pumps Slag Handling and Dewatering Air Separation Unit Auxiliaries Oxygen Compressor Main Nitrogen Compressor Nitrogen Boost Compressor Recycle Gas Blower Syngas Recycle Blower HP Boiler Feedwater Pump LP Boiler Feedwater Pump Humidification Tower Pump Humidification Makeup Pump Condensate Pump Flash Bottoms Pump Circulating Water Pumps Cooling Tower Fans Scrubber Pumps Amine Unit Auxiliaries Gas Turbine Auxiliaries Steam Turbine Auxiliaries Claus Plant/TGTU Auxiliaries Miscellaneous Balance of Plant Transformer Loss
460 950 330 300
40,500 10,220 23,040
750 760
2,370 3,800
200 260 180 400 150
3,420 1,890
400 1,700
800 400 300
1,000 1,510
TOTAL AUXILIARIES, kWe 96,070 Net Power, kWe Net Plant Efficiency, % HHV Net Heat Rate, Btu/kWh (HHV)
525,830 39.2%
8,717 CONDENSER COOLING DUTY, 106 Btu/h 1,139 CONSUMABLES As-Received Coal Feed, lb/h Thermal Input, kWt Gasifier Oxygen (95% pure), lb/h Claus Plant Oxygen (95% pure), lb/h Water (for slurry), lb/h
368,068 1,342,028
323,028 4,819
156,150
1 HHV of As-Fed Pittsburgh 6 % Moisture Coal is 12,450 Btu/lb

Power Plant Water Usage and Loss Study
10 August 2005
2.1 HEAT AND MATERIAL BALANCE
The heat and material balance for the IGCC plant is based on the syngas fuel requirements for two General Electric 7FA gas turbines. Ambient operating conditions are indicated in the plant design basis. The pressurized entrained flow E-GAS™ two-stage gasifier uses a coal/water slurry and oxygen to produce a medium heating value fuel gas.
The syngas produced in the gasifier first stage at about 2500°F is quenched to 1900°F by reacting with slurry injected into the second stage. The syngas passes through a fire tube boiler syngas cooler and leaves at 1060°F where it then is used to heat the fuel gas saturation water. High-pressure saturated steam is generated in the syngas cooler and is joined with the main steam supply.
The gas goes through a series of additional gas coolers and cleanup processes including a cyclone, filter, scrubber, COS hydrolysis reactor, and an amine-based AGR plant. Slag captured by the filter and syngas scrubber is recovered in a slag recovery unit. Regeneration gas from the AGR plant is fed to a Claus plant, where elemental sulfur is recovered.
This plant utilizes a combined cycle for combustion of the syngas from the gasifier to generate electric power. Syngas humidification along with steam and nitrogen dilution of the syngas aids in minimizing formation of NOX during combustion in the gas turbine burner section. A Brayton cycle using air and combustion products as working fluid is used in conjunction with a conventional subcritical steam Rankine cycle. The two cycles are coupled by generation of steam in the heat recovery steam generator (HRSG), by feedwater heating in the HRSG, and by heat recovery from the IGCC process (fire tube boiler syngas cooler).
Figure 2-1 is a modified block flow diagram for the overall plant with individual streams identified. Table 2-2 follows the figure with detailed composition and state points for the numbered streams.

Power Plant Water Usage and Loss Study
11 August 2005
Figure 2-1 E-GAS™ Gasifier-Based IGCC Case – Block Flow Diagram
E-GASGASIFIER & SYNGASCOOLER
SOURWATER
STRIPPER
ELEVATEDPRESSURE ASU
SYNGASSCRUBBER
GAS COOLINGBFW HEATING & KNOCKOUT
TAIL GASTREATMENT
UNIT
COSHYDROLYSIS
COAL SLURRY
6
5GASIFIEROXIDANT
7
SLAG
AIR TO ASU
VENT GAS
1
2
8
9
12
17
10
HRSG
GE 7FA+GAS TURBINE
AMBIENT AIRTURBINE COOLING AIR FLUE GAS STACK GAS
MDEAACID GASREMOVAL
SULFURPLANT
OXIDANT
3
13
11
SYNGASNITROGEN DILUENT
4
15
WATER RECYCLETO SLURRY PREPARATION
CLAUSPLANT
ACIDGAS
SULFURPRODUCT
CLEANGAS
MERCURYREMOVAL
SYNGASHUMIDIFICATION
& REHEAT
GASTURBINE
COMBUSTOR
TAIL GASRECYCLE TO
GASIFIER
ACID GASCONCENTRATOR
AIR
3
OXIDANT
AC
ID G
AS
RE
CY
CL
E
1416
STEAM

Power Plant Water Usage and Loss Study
12 August 2005
Table 2-2 E-GAS™ Gasifier-Based Dual-Train IGCC Stream Tables (page 1 of 2)
1 2 3 4 5 6A 7 8 9 10V-L Mole Fraction
Ar 0.0094 0.0402 0.0360 0.0000 0.0360 0.0000 0.0000 0.0112 0.0091 0.0000CH4 0.0000 0.0000 0.0000 0.0000 0.0000 0.0000 0.0000 0.0091 0.0074 0.0000CO 0.0000 0.0000 0.0000 0.0000 0.0000 0.0000 0.0000 0.5426 0.4418 0.0000CO2 0.0003 0.0050 0.0000 0.0000 0.0000 0.0000 0.0000 0.0924 0.0752 0.5120COS 0.0000 0.0000 0.0000 0.0000 0.0000 0.0000 0.0000 0.0000 0.0000 0.0000H2 0.0000 0.0000 0.0000 0.0000 0.0000 0.0000 0.0000 0.3294 0.2682 0.0000H2O 0.0108 0.1850 0.0000 0.0000 0.0000 1.0000 0.0000 0.0062 0.1907 0.0623H2S 0.0000 0.0000 0.0000 0.0000 0.0000 0.0000 0.0000 0.0000 0.0000 0.4257N2 0.7719 0.7694 0.0140 1.0000 0.0140 0.0000 0.0000 0.0092 0.0075 0.0000NH3 0.0000 0.0000 0.0000 0.0000 0.0000 0.0000 0.0000 0.0000 0.0000 0.0000O2 0.2076 0.0004 0.9500 0.0000 0.9500 0.0000 0.0000 0.0000 0.0000 0.0000SO2 0.0000 0.0000 0.0000 0.0000 0.0000 0.0000 0.0000 0.0000 0.0000 0.0000
Total 1.0000 1.0000 1.0000 1.0000 1.0000 1.0000 0.0000 1.0000 1.0000 1.0000
V-L Flowrate (lbmol/hr) 28,559 2,725 150 33,714 10,023 8,668 0 32,831 40,316 747V-L Flowrate (lb/hr) 823,906 72,819 4,819 944,459 323,028 156,150 0 685,753 820,610 28,517Solids Flowrate (lb/hr) 0 0 0 0 0 368,068 37,850 0 0 0
Temperature (°F) 225 70 90 450 305 59 2,500 123 535 123Pressure (psia) 190.0 16.4 30.0 295.0 560.0 14.4 500.0 370.8 350.0 30.2Density (lb/ft3) 0.746 0.125 0.164 0.847 2.199 62.622 185.286 1.240 0.667 0.186Molecular Weight 28.849 26.743 32.229 28.013 32.229 18.015 - 20.888 20.354 38.165
A - Solids flowrate includes dry coal; V-L flowrate includes slurry water and water from coal
Power Plant Water Usage and Loss Study
13 August 2005
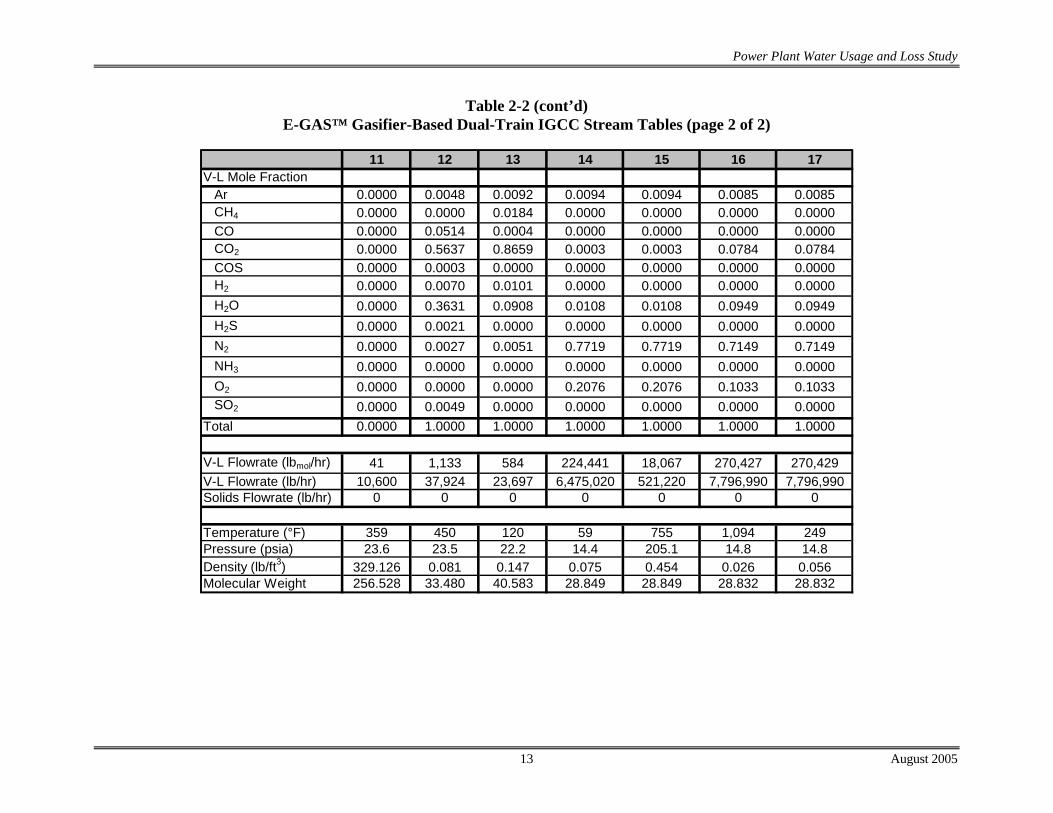
Table 2-2 (cont’d) E-GAS™ Gasifier-Based Dual-Train IGCC Stream Tables (page 2 of 2)
11 12 13 14 15 16 17V-L Mole Fraction
Ar 0.0000 0.0048 0.0092 0.0094 0.0094 0.0085 0.0085CH4 0.0000 0.0000 0.0184 0.0000 0.0000 0.0000 0.0000CO 0.0000 0.0514 0.0004 0.0000 0.0000 0.0000 0.0000CO2 0.0000 0.5637 0.8659 0.0003 0.0003 0.0784 0.0784COS 0.0000 0.0003 0.0000 0.0000 0.0000 0.0000 0.0000H2 0.0000 0.0070 0.0101 0.0000 0.0000 0.0000 0.0000H2O 0.0000 0.3631 0.0908 0.0108 0.0108 0.0949 0.0949H2S 0.0000 0.0021 0.0000 0.0000 0.0000 0.0000 0.0000N2 0.0000 0.0027 0.0051 0.7719 0.7719 0.7149 0.7149NH3 0.0000 0.0000 0.0000 0.0000 0.0000 0.0000 0.0000O2 0.0000 0.0000 0.0000 0.2076 0.2076 0.1033 0.1033SO2 0.0000 0.0049 0.0000 0.0000 0.0000 0.0000 0.0000
Total 0.0000 1.0000 1.0000 1.0000 1.0000 1.0000 1.0000
V-L Flowrate (lbmol/hr) 41 1,133 584 224,441 18,067 270,427 270,429V-L Flowrate (lb/hr) 10,600 37,924 23,697 6,475,020 521,220 7,796,990 7,796,990Solids Flowrate (lb/hr) 0 0 0 0 0 0 0
Temperature (°F) 359 450 120 59 755 1,094 249Pressure (psia) 23.6 23.5 22.2 14.4 205.1 14.8 14.8Density (lb/ft3) 329.126 0.081 0.147 0.075 0.454 0.026 0.056Molecular Weight 256.528 33.480 40.583 28.849 28.849 28.832 28.832

Power Plant Water Usage and Loss Study
14 August 2005
2.2 EMISSIONS PERFORMANCE
The operation of the combined cycle unit in conjunction with oxygen-blown IGCC technology is projected to result in very low levels of emissions of NOX, SO2, and particulate. A salable byproduct is produced in the form of elemental sulfur. A summary of the plant emissions is presented in Table 2-3.
Table 2-3 Air Emissions
IGCC, Oxygen-Blown E-GAS™
lb/106 Btu tons/year 80% capacity lb/MWh
SO2 0.014 221 0.120 NOX 0.024 386 0.210 Particulates 0.006 98 0.053 CO2 204 3,269,000 1,774
The low level of SO2 in the plant emissions is achieved by capture of the sulfur in the gas by the amine-based AGR process. The AGR process removes over 99 percent of the sulfur compounds in the fuel gas down to a level of 30 ppm. This results in a concentration in the flue gas of 3 ppm. The H2S-rich regeneration gas from the AGR system is fed to a Claus plant, producing elemental sulfur. The tail gas treatment unit removes most of the sulfur from the Claus tail gas, which is recycled to the Claus unit. Tail gas from the tail gas treatment unit is recycled to the gasifier.
NOX emissions are limited to 5 ppmvd in the flue gas (normalized to 15 percent O2) by the combined use of syngas dilution (humidification along with steam and nitrogen dilution), and combustion turbine firing based on the DOE/GE development programs to lower NOX emissions to single digits. Ammonia is removed with process condensate prior to the low-temperature AGR process, which helps lower NOX levels as well. A selective catalytic reduction (SCR) process is not required.
Particulate discharge to the atmosphere is limited to extremely low values by the use of the syngas scrubber and the gas washing effect of the AGR absorber.
CO2 emissions are equal to those of other coal-burning facilities on an intensive basis (1b/106 Btu), since a similar fuel is used. However, total CO2 emissions are lower for a plant with this capacity due to the relatively high thermal efficiency.
2.3 WATER BALANCES
Figure 2-2 shows the water flows through the entire plant in gallons per minute. All the water is accounted for including the water lost in chemical reactions or gained in the combustion of

Power Plant Water Usage and Loss Study
15 August 2005
hydrogen in the syngas. Table 2-4 shows an overall water balance for the entire plant and Table 2-5 shows the water loss by major function. The cooling water system is by far the largest water consumer accounting for approximately 70 percent of the water lost followed by 24 percent of the water lost in the flue gas. The slurry fed E-Gas gasification process accounts for 6 percent of the losses.
Table 2-4 E-GAS™ IGCC Overall Water Balance
Water In Water Out No Location Flow (gpm) No Location Flow (gpm)1 Moisture in coal 44.2 A Water Lost in Gasification Shift 97.4C Syngas Combustion of H2 in GT 411.0 6 Ash Handling Blowdown 76.622 Combustion air for GT 80.3 7 Water with Slag 26.533 Raw Water 3,256 B Water loss in COS Hydrolysis 0.2
Moisture in Air to ASU 18.1 24 GT Flue gas 924.4 31 Sour water blowdown 26.8 37 Cooling tower blowdown 659.7 36 Cooling tower evaporation 1,980 Moisture from ASU Vent 18.1 3,810 3,810
Table 2-5 E-GAS™ IGCC Water Loss by Function
Gasification losses gpm gal/MWh Water Lost in Gasification Shift 97.4 11.1 Ash Handling Blowdown 76.6 8.7 Water with Slag 26.5 3.0 Water loss in COS Hydrolysis 0.2 0.0 Sour water blowdown 26.8 3.1 Total 227.5 26.0 Flue gas losses GT Flue gas 924.4 105.5 Total 924.4 105.5 Cooling water losses Cooling tower blowdown 659.7 75.3 Cooling tower evaporation 1,980 225.9 Total 2,640 301.2 Grand Total 3,792 432.7

Power Plant Water Usage and Loss Study
16 August 2005
Figure 2-2 E-GAS™ Gasifier-Based IGCC Case – Block Flow Diagram – Water Flows in Gallons per Minute
SLURRYMIXER
COAL1 GASIFIER
COAL SLURRY
3
2
SLURRYWATER
ASHHANDLING
MAKE-UPWATER
5
7
SLAG (WET)
WATERWASH8
9
4
MAKE-UPWATER
11TO SOUR WATER STRIPPER
COSHYDROLYSIS12
GAS COOLING&
KNOCKOUT13
14
AMINEUNIT15 CLAUS
PLANT25TAIL GAS
TREATMENT UNIT
SOUR WATERSTRIPPER 3230
HUMIDIFIER
17
18
MAKE-UPWATER
19TO SOURWATER
STRIPPER
GASTURBINE20 23
16
21
DILUENTSTEAM
28
31BLOWDOWN
CONDENSATE&
DEAERATIONWATER
TREATING
6BLOWDOWN
AIR(HUMID)
19
HRSG 24STACK GAS
STEAMTURBINE
COLD REHEAT
HP STEAM
IP STEAM
LP STEAM
SPRAY WATER
BLOWDOWN
EVAPORATION
BLOWDOWN
COOLINGWATERSYSTEM
MAKEUP WATER
MAKEUP WATER
MAKEUPWATER TO
HUMIDIFIER
MAKEUPWATER TO
ASH HANDLING
RAWWATER
33
34
35
5
37
3639
38
22
18
CWS
CWR
AWATER
LOST TOSHIFT
BWATER
LOST TOHYDROLYSIS
H2 & CH4COMBUSTION
C
CONDENSATE
[Water Flow, gpm]
[44.2] [356.3]
[1980]
10
[312.1]
[72.2]
[26.5]
[246.3]
[17,864]
[81.6]
[164.7] [164.5]
[0.2][142.8]
[31.5]
29 [11.8]
[21.7]
[7.3]
[14.4]
[267.7]
[1.0]
[26.8]
[239.9]
[3.1]
[31.5]
[3,420]
[301.1]
[276.8]
[156.1]
[80.3]
[924.4]
[411.0]
[924.4]
[301.1][165.6]
[17.0]
[9.8]
[97.4]
[87.4] [76.6]
[87.4]
[3256]
[660]
21
DILUENTSTEAMTO GT
[156.1]
BFW
[2630]
SLURRYMAKEUPWATER
4[72.2]
SLURRYMIXER
COAL1 GASIFIER
COAL SLURRY
3
2
SLURRYWATER
ASHHANDLING
MAKE-UPWATER
5
7
SLAG (WET)
WATERWASH8
9
4
MAKE-UPWATER
11TO SOUR WATER STRIPPER
COSHYDROLYSIS12
GAS COOLING&
KNOCKOUT13
14
AMINEUNIT15 CLAUS
PLANT25TAIL GAS
TREATMENT UNIT
SOUR WATERSTRIPPER 3230
SLURRYMIXER
COAL1 GASIFIER
COAL SLURRY
3
2
SLURRYWATER
ASHHANDLING
MAKE-UPWATER
5
7
SLAG (WET)
WATERWASH8
9
4
MAKE-UPWATER
11TO SOUR WATER STRIPPER
COSHYDROLYSIS12
GAS COOLING&
KNOCKOUT13
14
AMINEUNIT15 CLAUS
PLANT25TAIL GAS
TREATMENT UNIT
SOUR WATERSTRIPPER 3230
HUMIDIFIER
17
18
MAKE-UPWATER
19TO SOURWATER
STRIPPER
GASTURBINE20 23
16
21
DILUENTSTEAM
28
HUMIDIFIER
17
18
MAKE-UPWATER
19TO SOURWATER
STRIPPER
GASTURBINE20 23
16
21
DILUENTSTEAM
28
31BLOWDOWN
CONDENSATE&
DEAERATIONWATER
TREATING
6BLOWDOWN
AIR(HUMID)
19
HRSG 24STACK GAS
STEAMTURBINE
COLD REHEAT
HP STEAM
IP STEAM
LP STEAM
31BLOWDOWN
CONDENSATE&
DEAERATIONWATER
TREATING
6BLOWDOWN
AIR(HUMID)
19
HRSG 24STACK GAS
STEAMTURBINE
COLD REHEAT
HP STEAM
IP STEAM
LP STEAM
SPRAY WATER
BLOWDOWN
EVAPORATION
BLOWDOWN
COOLINGWATERSYSTEM
MAKEUP WATER
MAKEUP WATER
MAKEUPWATER TO
HUMIDIFIER
MAKEUPWATER TO
ASH HANDLING
RAWWATER
33
34
35
5
37
3639
38
22
18
CWS
CWR
AWATER
LOST TOSHIFT
BWATER
LOST TOHYDROLYSIS
H2 & CH4COMBUSTION
C
CONDENSATE
[Water Flow, gpm]
[44.2] [356.3]
[1980]
10
[312.1]
[72.2]
[26.5]
[246.3]
[17,864]
[81.6]
[164.7] [164.5]
[0.2][142.8]
[31.5]
29 [11.8]
[21.7]
[7.3]
[14.4]
[267.7]
[1.0]
[26.8]
[239.9]
[3.1]
[31.5]
[3,420]
[301.1]
[276.8]
[156.1]
[80.3]
[924.4]
[411.0]
[924.4]
[301.1][165.6]
[17.0]
[9.8]
[97.4]
[87.4] [76.6]
[87.4]
[3256]
[660]
21
DILUENTSTEAMTO GT
[156.1]
BFW
[2630]
SLURRYMAKEUPWATER
4[72.2]
Power Plant Water Usage and Loss Study
17 August 2005
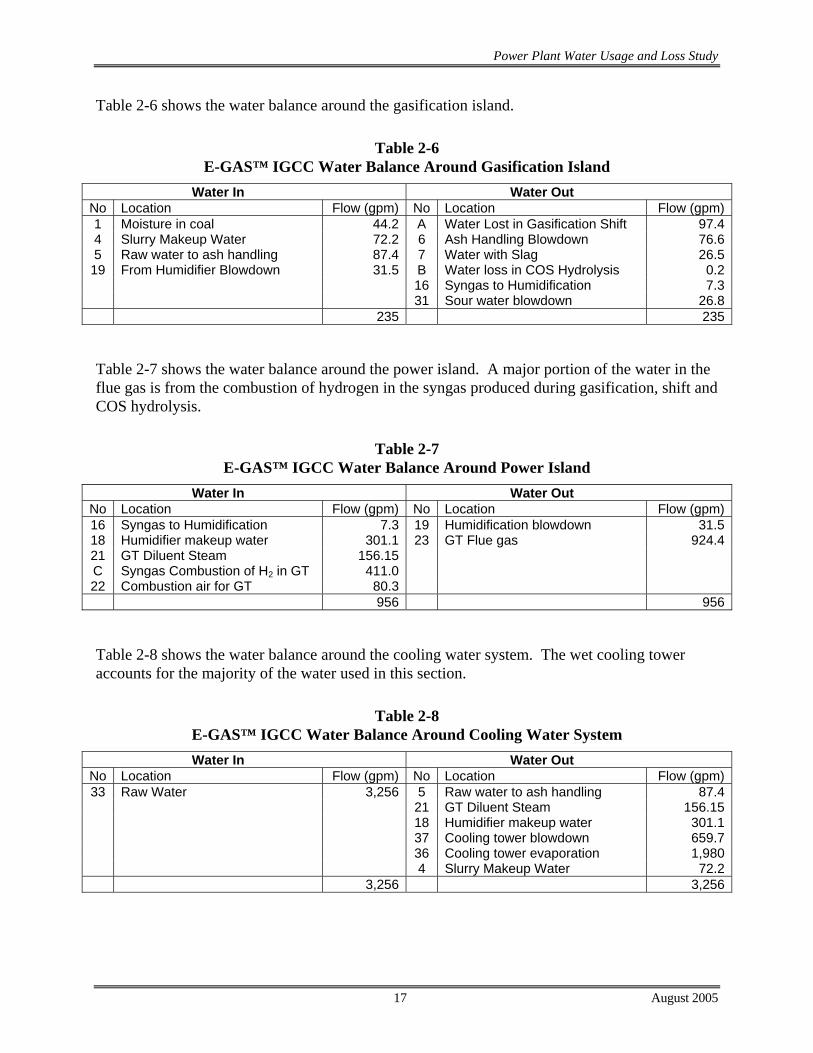
Table 2-6 shows the water balance around the gasification island.
Table 2-6 E-GAS™ IGCC Water Balance Around Gasification Island
Water In Water Out No Location Flow (gpm) No Location Flow (gpm)1 Moisture in coal 44.2 A Water Lost in Gasification Shift 97.44 Slurry Makeup Water 72.2 6 Ash Handling Blowdown 76.65 Raw water to ash handling 87.4 7 Water with Slag 26.519 From Humidifier Blowdown 31.5 B Water loss in COS Hydrolysis 0.2
16 Syngas to Humidification 7.3 31 Sour water blowdown 26.8 235 235
Table 2-7 shows the water balance around the power island. A major portion of the water in the flue gas is from the combustion of hydrogen in the syngas produced during gasification, shift and COS hydrolysis.
Table 2-7 E-GAS™ IGCC Water Balance Around Power Island
Water In Water Out No Location Flow (gpm) No Location Flow (gpm)16 Syngas to Humidification 7.3 19 Humidification blowdown 31.518 Humidifier makeup water 301.1 23 GT Flue gas 924.421 GT Diluent Steam 156.15 C Syngas Combustion of H2 in GT 411.0 22 Combustion air for GT 80.3
956 956
Table 2-8 shows the water balance around the cooling water system. The wet cooling tower accounts for the majority of the water used in this section.
Table 2-8 E-GAS™ IGCC Water Balance Around Cooling Water System
Water In Water Out No Location Flow (gpm) No Location Flow (gpm)33 Raw Water 3,256 5 Raw water to ash handling 87.4
21 GT Diluent Steam 156.15 18 Humidifier makeup water 301.1 37 Cooling tower blowdown 659.7 36 Cooling tower evaporation 1,980 4 Slurry Makeup Water 72.2 3,256 3,256
Power Plant Water Usage and Loss Study
18 August 2005
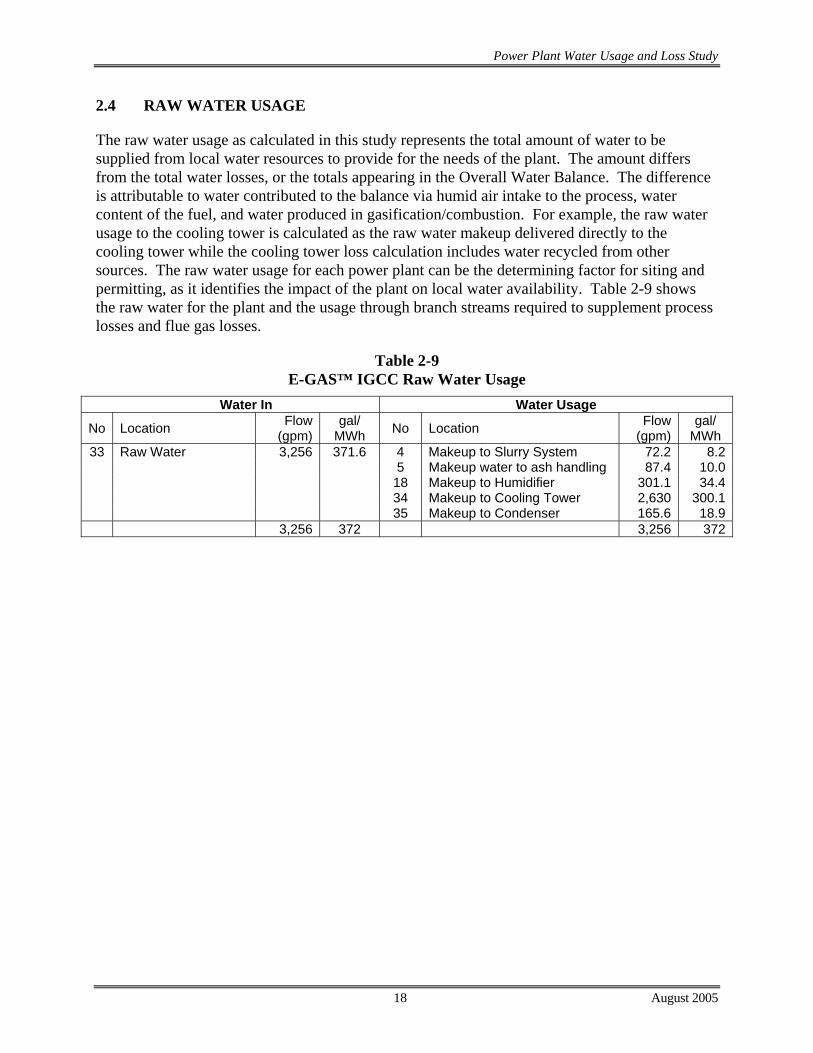
2.4 RAW WATER USAGE
The raw water usage as calculated in this study represents the total amount of water to be supplied from local water resources to provide for the needs of the plant. The amount differs from the total water losses, or the totals appearing in the Overall Water Balance. The difference is attributable to water contributed to the balance via humid air intake to the process, water content of the fuel, and water produced in gasification/combustion. For example, the raw water usage to the cooling tower is calculated as the raw water makeup delivered directly to the cooling tower while the cooling tower loss calculation includes water recycled from other sources. The raw water usage for each power plant can be the determining factor for siting and permitting, as it identifies the impact of the plant on local water availability. Table 2-9 shows the raw water for the plant and the usage through branch streams required to supplement process losses and flue gas losses.
Table 2-9 E-GAS™ IGCC Raw Water Usage
Water In Water Usage
No Location Flow (gpm)
gal/ MWh No Location Flow
(gpm)gal/
MWh 33 Raw Water 3,256 371.6 4 Makeup to Slurry System 72.2 8.2
5 Makeup water to ash handling 87.4 10.0 18 Makeup to Humidifier 301.1 34.4 34 Makeup to Cooling Tower 2,630 300.1 35 Makeup to Condenser 165.6 18.9 3,256 372 3,256 372
Power Plant Water Usage and Loss Study
19 August 2005
3. WATER LOSS ANALYSIS OF THE GE ENERGY RADIANT-CONVECTIVE IGCC PLANT
The study design goal was to track the water flows and usages for all the major sections of the plant. Since essentially all fuel-bound hydrogen ends up as water, hydrogen was also tracked for each plant and major process area. An overall water balance and a water balance for each major plant section was then generated.
This IGCC plant design is based on the GE Energy technology, which utilizes a pressurized entrained-flow, oxygen-blown gasification process. The plant configuration is based on the radiant/convective gasifier option operating at approximately 815 psia.
The power generation technology is based on selection of two gas turbines derived from the General Electric 7FA machine. The plant is configured with two operating gasifiers including processes to progressively cool and clean the gas, making it suitable for combustion in the gas turbines. The resulting plant produces a net output of 571 MWe at a net efficiency of 39.4 percent on an HHV basis. Performance is based on the properties of Pittsburgh No. 8 coal, described in the plant design basis. Overall performance for the entire plant is summarized in Table 3-1 which includes auxiliary power requirements.

Power Plant Water Usage and Loss Study
20 August 2005
Table 3-1 GE Energy Radiant-Convective IGCC Plant Performance Summary
100 Percent Load
POWER SUMMARY (Gross Power at Generator Terminals, kWe) Gas Turbine Power Sweet Gas Expander Power Steam Turbine Total
394,000 9,670
270,180 673,850
AUXILIARY LOAD SUMMARY, kWe Coal Handling Coal Milling Coal Slurry Pumps Slag Handling and Dewatering Air Separation Unit Auxiliaries Oxygen Compressor Main Nitrogen Compressor Nitrogen Boost Compressor Claus Tail Gas Recycle Compressor HP Boiler Feedwater Pumps IP Boiler Feedwater Pumps LP Boiler Feedwater Pumps Humidification Tower Pumps Scrubber Pumps Circulating Water Pumps Cooling Tower Fans Condensate Pump Selexol Unit Auxiliaries Gas Turbine Auxiliaries Steam Turbine Auxiliaries Claus Plant Auxiliaries Miscellaneous Balance of Plant Transformer Loss
520 1,050
360 210
44,200 15,300 22,650
880 770
4,200 100 30
130 100
3,080 1,840
280 2,810
800 400 200
1,000 1,690
TOTAL AUXILIARIES, kWe 102,600 Net Power, kWe Net Plant Efficiency, % HHV Net Heat Rate, Btu/kWh (HHV)
571,250 39.4%
8,668 CONDENSER COOLING DUTY, 106 Btu/h 1,440 CONSUMABLES As-Received Coal Feed, lb/h Thermal Input1, kWt Gasifier Oxygen (95% pure), lb/h Claus Plant Oxygen (95% pure), lb/h Water (for slurry), lb/h
397,706 1,451,124
378,897 4,926
182,455
1 HHV of As-Fed Pittsburgh 6 % Moisture Coal is 12,450 Btu/lb
Power Plant Water Usage and Loss Study
21 August 2005
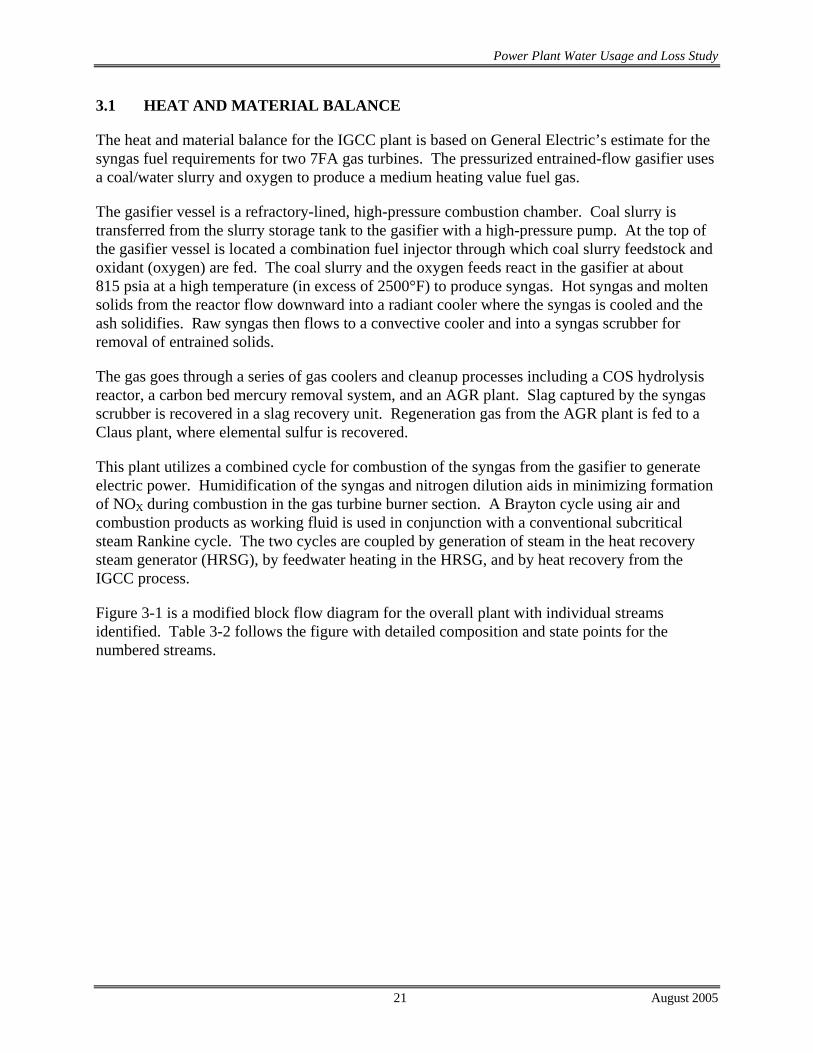
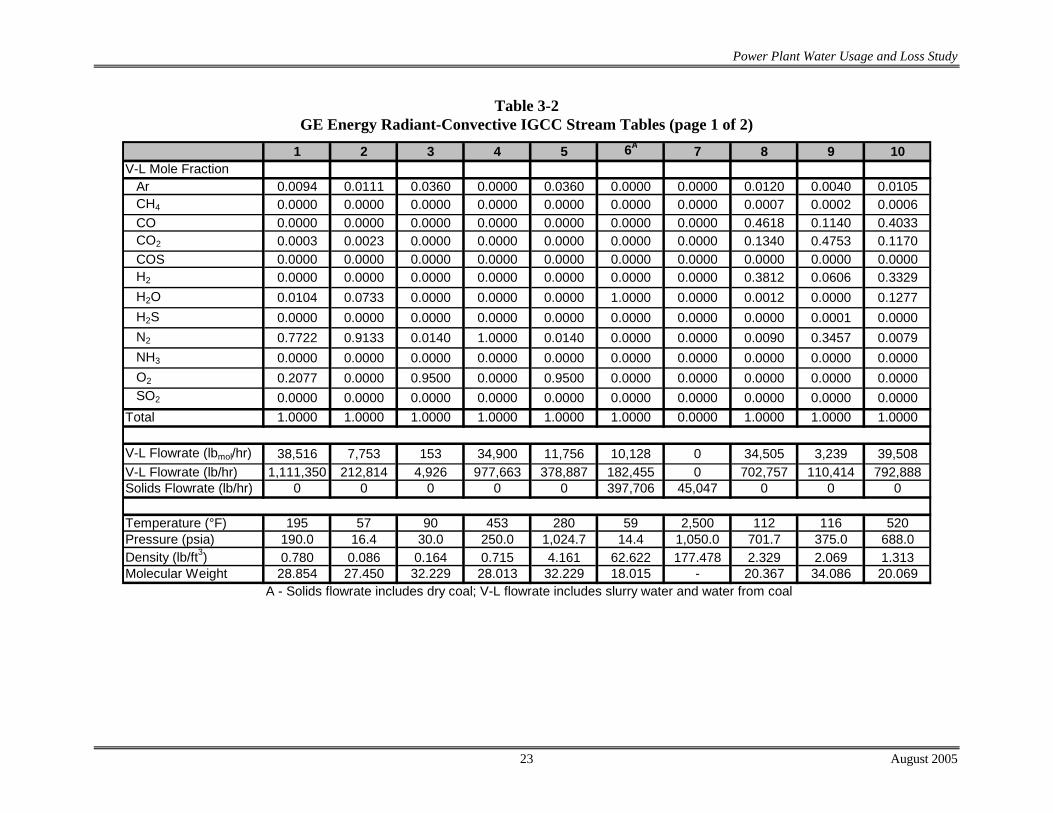
3.1 HEAT AND MATERIAL BALANCE
The heat and material balance for the IGCC plant is based on General Electric’s estimate for the syngas fuel requirements for two 7FA gas turbines. The pressurized entrained-flow gasifier uses a coal/water slurry and oxygen to produce a medium heating value fuel gas.
The gasifier vessel is a refractory-lined, high-pressure combustion chamber. Coal slurry is transferred from the slurry storage tank to the gasifier with a high-pressure pump. At the top of the gasifier vessel is located a combination fuel injector through which coal slurry feedstock and oxidant (oxygen) are fed. The coal slurry and the oxygen feeds react in the gasifier at about 815 psia at a high temperature (in excess of 2500°F) to produce syngas. Hot syngas and molten solids from the reactor flow downward into a radiant cooler where the syngas is cooled and the ash solidifies. Raw syngas then flows to a convective cooler and into a syngas scrubber for removal of entrained solids.
The gas goes through a series of gas coolers and cleanup processes including a COS hydrolysis reactor, a carbon bed mercury removal system, and an AGR plant. Slag captured by the syngas scrubber is recovered in a slag recovery unit. Regeneration gas from the AGR plant is fed to a Claus plant, where elemental sulfur is recovered.
This plant utilizes a combined cycle for combustion of the syngas from the gasifier to generate electric power. Humidification of the syngas and nitrogen dilution aids in minimizing formation of NOX during combustion in the gas turbine burner section. A Brayton cycle using air and combustion products as working fluid is used in conjunction with a conventional subcritical steam Rankine cycle. The two cycles are coupled by generation of steam in the heat recovery steam generator (HRSG), by feedwater heating in the HRSG, and by heat recovery from the IGCC process.
Figure 3-1 is a modified block flow diagram for the overall plant with individual streams identified. Table 3-2 follows the figure with detailed composition and state points for the numbered streams.

Power Plant Water Usage and Loss Study
22 August 2005
Figure 3-1 GE Energy Radiant-Convective IGCC Case – Block Flow Diagram
CHEVRONTEXACOSECTION(RADIANTCOOLER)
SOURWATER
STRIPPER
ELEVATEDPRESSURE ASU
RAW GASCOOLER
GAS COOLINGBFW HEATING & KNOCKOUT
COSHYDROLYSIS
COAL SLURRY
6
5GASIFIEROXIDANT
7
SLAG
AIR TO ASU
VENT GAS
1
2
89
18
10
HRSG
GE 7FA+GAS TURBINE
AMBIENT AIRTURBINE COOLING AIR FLUE GAS STACK GAS
SELEXOLUNIT
SULFURPLANT
OXIDANT
3
13
11
SYNGASNITROGEN DILUENT
4
STRIPPERBLOWDOWN
CLAUSPLANT
SULFURPRODUCT
CLEANGAS
AIR
MERCURYREMOVAL
14
17
SYNGASEXPANDER
SYNGASHUMIDIFICATION
& H/P REHEAT
GASTURBINE
COMBUSTOR
15
12
16
SYNGAS TOI/P REHEATER
Power Plant Water Usage and Loss Study
23 August 2005
Table 3-2 GE Energy Radiant-Convective IGCC Stream Tables (page 1 of 2)
1 2 3 4 5 6A 7 8 9 10V-L Mole Fraction
Ar 0.0094 0.0111 0.0360 0.0000 0.0360 0.0000 0.0000 0.0120 0.0040 0.0105CH4 0.0000 0.0000 0.0000 0.0000 0.0000 0.0000 0.0000 0.0007 0.0002 0.0006CO 0.0000 0.0000 0.0000 0.0000 0.0000 0.0000 0.0000 0.4618 0.1140 0.4033CO2 0.0003 0.0023 0.0000 0.0000 0.0000 0.0000 0.0000 0.1340 0.4753 0.1170COS 0.0000 0.0000 0.0000 0.0000 0.0000 0.0000 0.0000 0.0000 0.0000 0.0000H2 0.0000 0.0000 0.0000 0.0000 0.0000 0.0000 0.0000 0.3812 0.0606 0.3329H2O 0.0104 0.0733 0.0000 0.0000 0.0000 1.0000 0.0000 0.0012 0.0000 0.1277H2S 0.0000 0.0000 0.0000 0.0000 0.0000 0.0000 0.0000 0.0000 0.0001 0.0000N2 0.7722 0.9133 0.0140 1.0000 0.0140 0.0000 0.0000 0.0090 0.3457 0.0079NH3 0.0000 0.0000 0.0000 0.0000 0.0000 0.0000 0.0000 0.0000 0.0000 0.0000O2 0.2077 0.0000 0.9500 0.0000 0.9500 0.0000 0.0000 0.0000 0.0000 0.0000SO2 0.0000 0.0000 0.0000 0.0000 0.0000 0.0000 0.0000 0.0000 0.0000 0.0000
Total 1.0000 1.0000 1.0000 1.0000 1.0000 1.0000 0.0000 1.0000 1.0000 1.0000
V-L Flowrate (lbmol/hr) 38,516 7,753 153 34,900 11,756 10,128 0 34,505 3,239 39,508V-L Flowrate (lb/hr) 1,111,350 212,814 4,926 977,663 378,887 182,455 0 702,757 110,414 792,888Solids Flowrate (lb/hr) 0 0 0 0 0 397,706 45,047 0 0 0
Temperature (°F) 195 57 90 453 280 59 2,500 112 116 520Pressure (psia) 190.0 16.4 30.0 250.0 1,024.7 14.4 1,050.0 701.7 375.0 688.0Density (lb/ft3) 0.780 0.086 0.164 0.715 4.161 62.622 177.478 2.329 2.069 1.313Molecular Weight 28.854 27.450 32.229 28.013 32.229 18.015 - 20.367 34.086 20.069
A - Solids flowrate includes dry coal; V-L flowrate includes slurry water and water from coal

Power Plant Water Usage and Loss Study
24 August 2005
Table 3-2 (cont’d) GE Energy Radiant-Convective IGCC Stream Tables (page 2 of 2)
11 12 13 14 15 16 17 18V-L Mole Fraction
Ar 0.0100 0.0000 0.0000 0.0116 0.0094 0.0094 0.0088 0.0088CH4 0.0006 0.0000 0.0000 0.0000 0.0000 0.0000 0.0000 0.0000CO 0.3814 0.0000 0.0000 0.1409 0.0000 0.0000 0.0000 0.0000CO2 0.1441 0.2938 0.0000 0.3411 0.0003 0.0003 0.0832 0.0832COS 0.0000 0.0005 0.0000 0.0008 0.0000 0.0000 0.0000 0.0000H2 0.3123 0.0000 0.0000 0.0852 0.0000 0.0000 0.0000 0.0000H2O 0.1180 0.0262 0.0000 0.0041 0.0104 0.0104 0.0760 0.0760H2S 0.0000 0.4549 0.0000 0.0117 0.0000 0.0000 0.0000 0.0000N2 0.0335 0.2245 0.0000 0.4044 0.7722 0.7722 0.7273 0.7273NH3 0.0000 0.0000 0.0000 0.0000 0.0000 0.0000 0.0000 0.0000O2 0.0000 0.0000 0.0000 0.0000 0.2077 0.2077 0.1047 0.1047SO2 0.0000 0.0000 0.0000 0.0000 0.0000 0.0000 0.0000 0.0000
Total 1.0000 1.0000 0.0000 1.0000 1.0000 1.0000 1.0000 1.0000
V-L Flowrate (lbmol/hr) 42,747 784 44 477 224,404 16,044 271,179 271,175V-L Flowrate (lb/hr) 903,302 27,614 11,293 15,019 6,475,020 462,940 7,893,050 7,893,050Solids Flowrate (lb/hr) 0 0 0 0 0 0 0 0
Temperature (°F) 535 120 353 120 59 724 1,080 237Pressure (psia) 370.0 30.0 23.6 369.5 14.7 225.6 14.8 14.8Density (lb/ft3) 0.732 0.170 329.568 1.868 0.076 0.512 0.026 0.058Molecular Weight 21.131 35.233 256.528 31.455 28.854 28.854 29.106 29.107

Power Plant Water Usage and Loss Study
25 August 2005
3.2 EMISSIONS PERFORMANCE
The operation of the combined cycle unit in conjunction with oxygen-blown GE Energy IGCC technology is projected to result in very low levels of emissions of NOX, SO2, and particulate. A salable byproduct is produced in the form of elemental sulfur. A summary of the plant emissions is presented in Table 3-3.
Table 3-3 Airborne Emissions
IGCC, Oxygen-Blown GE Energy Radiant-Convective
lb/106 Btu tons/year 80% capacity lb/MWh
SO2 0.007 116 0.058 NOX 0.022 384 0.192 Particulates 0.006 98 0.049 CO2 200 3,478,000 1,738
The low level of SO2 in the plant emissions is achieved by capture of the sulfur in the gas by the Selexol AGR process. The AGR process removes over 99 percent of the sulfur compounds in the fuel gas down to a level of 15 ppm. This results in a concentration in the flue gas of less than 2 ppm. The H2S-rich regeneration gas from the AGR system is fed to a Claus plant, producing elemental sulfur. The Claus tail gas, after hydrogenation, is recycled back to the AGR unit.
NOX emissions are limited to 5 ppmvd in the flue gas (normalized to 15 percent O2) by the combined use of syngas dilution (humidification along with nitrogen), and combustion turbine firing based on the DOE/GE development programs to lower NOX emissions to single digits. Ammonia is removed with process condensate prior to the low-temperature AGR process, which helps lower NOX levels as well. A selective catalytic reduction (SCR) process is not required.
Particulate discharge to the atmosphere is limited to extremely low values by the use of the syngas scrubber and the gas-washing effect of the AGR absorber.
CO2 emissions are equal to those of other coal-burning facilities on an intensive basis (1b/106 Btu), since a similar fuel is used. However, total CO2 emissions are lower for a plant with this capacity due to the relatively high thermal efficiency.
3.3 WATER BALANCES
Figure 3-2 shows the water flows through the entire plant in gallons per minute. All the water is accounted for including the water lost in chemical reactions or gained in the combustion of hydrogen in the syngas. Table 3-4 shows an overall water balance for the entire plant and Table 3-5 shows the water loss by major function. The cooling water system is by far the largest
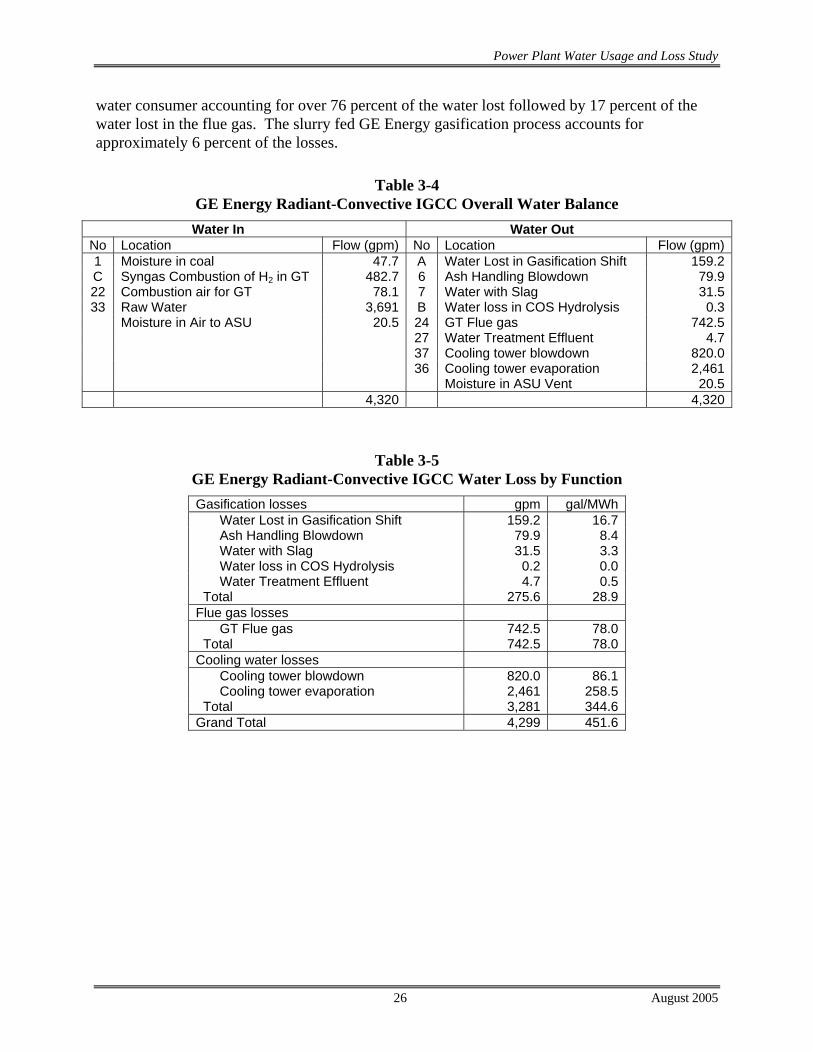
Power Plant Water Usage and Loss Study
26 August 2005
water consumer accounting for over 76 percent of the water lost followed by 17 percent of the water lost in the flue gas. The slurry fed GE Energy gasification process accounts for approximately 6 percent of the losses.
Table 3-4 GE Energy Radiant-Convective IGCC Overall Water Balance
Water In Water Out No Location Flow (gpm) No Location Flow (gpm)1 Moisture in coal 47.7 A Water Lost in Gasification Shift 159.2C Syngas Combustion of H2 in GT 482.7 6 Ash Handling Blowdown 79.922 Combustion air for GT 78.1 7 Water with Slag 31.533 Raw Water 3,691 B Water loss in COS Hydrolysis 0.3
Moisture in Air to ASU 20.5 24 GT Flue gas 742.5 27 Water Treatment Effluent 4.7 37 Cooling tower blowdown 820.0 36 Cooling tower evaporation 2,461 Moisture in ASU Vent 20.5 4,320 4,320
Table 3-5 GE Energy Radiant-Convective IGCC Water Loss by Function Gasification losses gpm gal/MWh Water Lost in Gasification Shift 159.2 16.7 Ash Handling Blowdown 79.9 8.4 Water with Slag 31.5 3.3 Water loss in COS Hydrolysis 0.2 0.0 Water Treatment Effluent 4.7 0.5 Total 275.6 28.9 Flue gas losses GT Flue gas 742.5 78.0 Total 742.5 78.0 Cooling water losses Cooling tower blowdown 820.0 86.1 Cooling tower evaporation 2,461 258.5 Total 3,281 344.6 Grand Total 4,299 451.6
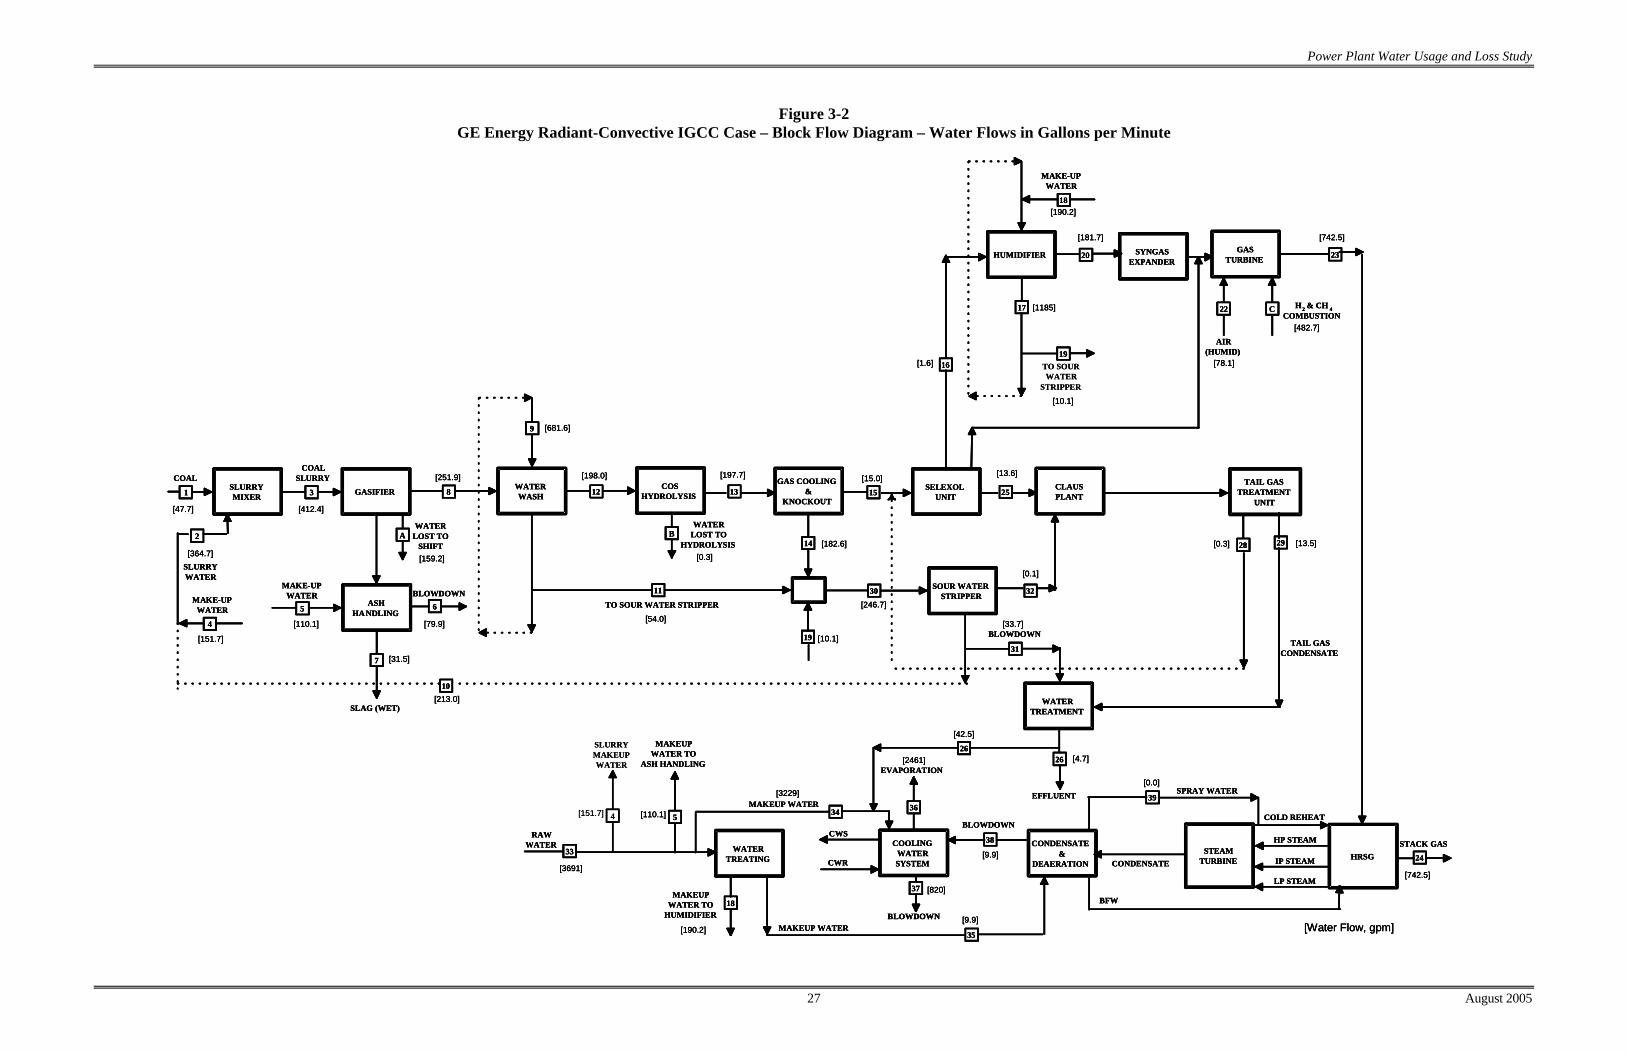
Power Plant Water Usage and Loss Study
27 August 2005
Figure 3-2 GE Energy Radiant-Convective IGCC Case – Block Flow Diagram – Water Flows in Gallons per Minute
SLURRYMIXER
COAL
1 GASIFIER
COAL SLURRY
3
2
SLURRYWATER
ASHHANDLING
MAKE-UPWATER
5
7
SLAG (WET)
WATERWASH8
9
4
MAKE-UPWATER
11
TO SOUR WATER STRIPPER
COSHYDROLYSIS12
GAS COOLING&
KNOCKOUT13
14
SELEXOLUNIT15
CLAUSPLANT25
TAIL GASTREATMENT
UNIT
SOUR WATERSTRIPPER 3230
HUMIDIFIER
17
19
GASTURBINE20 23
16
28
31
BLOWDOWN
CONDENSATE&
DEAERATION
WATERTREATING
6BLOWDOWN
AIR(HUMID)
HRSG 24
STACK GASSTEAM
TURBINE
COLD REHEAT
HP STEAM
IP STEAM
LP STEAM
SPRAY WATER
BLOWDOWN
EVAPORATION
BLOWDOWN
COOLINGWATERSYSTEM
MAKEUP WATER
MAKEUP WATER
MAKEUPWATER TO
HUMIDIFIER
MAKEUPWATER TO
ASH HANDLING
RAWWATER
33
34
35
5
37
3639
38
22
18
CWS
CWR
AWATER
LOST TOSHIFT
BWATER
LOST TOHYDROLYSIS
H2 & CH 4COMBUSTION
C
CONDENSATE
[Water Flow, gpm]
[47.7] [412.4]
[2461]
10
[364.7]
[151.7]
[31.5]
[251.9]
[681.6]
[54.0]
[198.0] [197.7]
[0.3][182.6] 29 [13.5]
[15.0]
[1.6]
[13.6]
[246.7]
[0.1]
[33.7]
[213.0]
[0.3]
[10.1]
[1185]
18
MAKE-UPWATER
[190.2]
[181.7]
[78.1]
[742.5]
[482.7]
[742.5]
[190.2][9.9]
[0.0]
[9.9]
[159.2]
[110.1] [79.9]
[110.1]
[3691]
[820]BFW
[3229]
SYNGASEXPANDER
TAIL GASCONDENSATE
WATERTREATMENT
19 [10.1]
26
[42.5]
26 [4.7]
EFFLUENT
TO SOURWATER
STRIPPER
SLURRYMAKEUPWATER
4[151.7]
SLURRYMIXER
COAL
1 GASIFIER
COAL SLURRY
3
2
SLURRYWATER
ASHHANDLING
MAKE-UPWATER
5
7
SLAG (WET)
WATERWASH8
9
4
MAKE-UPWATER
11
TO SOUR WATER STRIPPER
COSHYDROLYSIS12
GAS COOLING&
KNOCKOUT13
14
SELEXOLUNIT15
CLAUSPLANT25
TAIL GASTREATMENT
UNIT
SOUR WATERSTRIPPER 3230
SLURRYMIXER
COAL
1 GASIFIER
COAL SLURRY
3
2
SLURRYWATER
ASHHANDLING
MAKE-UPWATER
5
7
SLAG (WET)
WATERWASH8
9
4
MAKE-UPWATER
11
TO SOUR WATER STRIPPER
COSHYDROLYSIS12
GAS COOLING&
KNOCKOUT13
14
SELEXOLUNIT15
CLAUSPLANT25
TAIL GASTREATMENT
UNIT
SOUR WATERSTRIPPER 3230
HUMIDIFIER
17
19
GASTURBINE20 23
16
28
31
BLOWDOWN
CONDENSATE&
DEAERATION
WATERTREATING
6BLOWDOWN
AIR(HUMID)
HRSG 24
STACK GASSTEAM
TURBINE
COLD REHEAT
HP STEAM
HUMIDIFIER
17
19
GASTURBINE20 23
16
28
31
BLOWDOWN
CONDENSATE&
DEAERATION
WATERTREATING
6BLOWDOWN
AIR(HUMID)
HRSG 24
STACK GASSTEAM
TURBINE
COLD REHEAT
HP STEAM
IP STEAM
LP STEAM
SPRAY WATER
BLOWDOWN
EVAPORATION
BLOWDOWN
COOLINGWATERSYSTEM
MAKEUP WATER
MAKEUP WATER
MAKEUPWATER TO
HUMIDIFIER
MAKEUPWATER TO
ASH HANDLING
RAWWATER
33
34
35
5
37
3639
38
22
18
CWS
CWR
AWATER
LOST TOSHIFT
BWATER
LOST TOHYDROLYSIS
H2 & CH 4COMBUSTION
C
CONDENSATE
[Water Flow, gpm]
[47.7] [412.4]
[2461]
10
[364.7]
[151.7]
[31.5]
[251.9]
[681.6]
[54.0]
[198.0] [197.7]
[0.3][182.6] 29 [13.5]
[15.0]
[1.6]
[13.6]
[246.7]
[0.1]
[33.7]
[213.0]
[0.3]
[10.1]
[1185]
18
MAKE-UPWATER
[190.2]
[181.7]
[78.1]
[742.5]
[482.7]
[742.5]
[190.2][9.9]
[0.0]
[9.9]
[159.2]
[110.1] [79.9]
[110.1]
[3691]
[820]BFW
[3229]
SYNGASEXPANDER
TAIL GASCONDENSATE
WATERTREATMENT
19 [10.1]
26
[42.5]
26 [4.7]
EFFLUENT
[0.1]
[33.7]
[213.0]
[0.3]
[10.1]
[1185]
18
MAKE-UPWATER
[190.2]
[181.7]
[78.1]
[742.5]
[482.7]
[742.5]
[190.2][9.9]
[0.0]
[9.9]
[159.2]
[110.1] [79.9]
[110.1]
[3691]
[820]BFW
[3229]
SYNGASEXPANDER
TAIL GASCONDENSATE
WATERTREATMENT
19 [10.1]
26
[42.5]
26 [4.7]
EFFLUENT
TO SOURWATER
STRIPPER
SLURRYMAKEUPWATER
4[151.7]

Power Plant Water Usage and Loss Study
28 August 2005
Table 3-6 shows the water balance around the gasification island.
Table 3-6 GE Energy Radiant-Convective IGCC Water Balance Around Gasification Island
Water In Water Out No Location Flow (gpm) No Location Flow (gpm)1 Moisture in coal 47.7 A Water Lost in Gasification Shift 159.24 Slurry Makeup Water 151.7 6 Ash Handling Blowdown 79.95 Raw water to ash handling 110.1 7 Water with Slag 31.5 B Water loss in COS Hydrolysis 0.3 16 Syngas to Humidification 1.53 31 Sour water blowdown 23.7 29 Tail Gas Condensate 13.5 310 310
Table 3-7 shows the water balance around the power island. A major portion of the water in the flue gas is from the combustion of hydrogen in the syngas produced during gasification, shift and COS hydrolysis.
Table 3-7 GE Energy Radiant-Convective IGCC Water Balance Around Power Island
Water In Water Out No Location Flow (gpm) No Location Flow (gpm)16 Syngas to Humidification 1.5 19 Humidification blowdown 10.118 Humidifier makeup water 190.2 23 GT Flue gas 742.521 GT Diluent Steam 0 C Syngas Combustion of H2 in GT 482.7 22 Combustion air for GT 78.1
753 753
Table 3-8 shows the water balance around the cooling water system. The wet cooling tower accounts for the majority of the water used in this section.
Table 3-8 GE Energy Radiant-Convective IGCC Water Balance Around Cooling Water System
Water In Water Out No Location Flow (gpm) No Location Flow (gpm)33 Raw Water 3,691 5 Raw water to ash handling 110.126 From Waste Water treatment 42.5 21 GT Diluent Steam 0
18 Humidifier makeup water 190.2 37 Cooling tower blowdown 820.0 36 Cooling tower evaporation 2,461 4 Slurry Makeup Water 151.7 3,733 3,733

Power Plant Water Usage and Loss Study
29 August 2005
3.4 RAW WATER USAGE
The raw water usage as calculated in this study represents the total amount of water to be supplied from local water resources to provide for the needs of the plant. The amount differs from the total water losses, or the totals appearing in the Overall Water Balance. The difference is attributable to water contributed to the balance via humid air intake to the process, water content of the fuel, and water produced in gasification/combustion. For example, the raw water usage to the cooling tower is calculated as the raw water makeup delivered directly to the cooling tower while the cooling tower loss calculation includes water recycled from other sources. The raw water usage for each power plant can be the determining factor for siting and permitting, as it identifies the impact of the plant on local water availability. Table 3-9 shows the raw water for the plant and the usage through branch streams required to supplement process losses and flue gas losses.
Table 3-9 GE Energy Radiant-Convective IGCC Raw Water Usage
Water In Water Usage
No Location Flow (gpm)
gal/ MWh No Location Flow
(gpm)gal/
MWh 33 Raw Water 3,691 387.6 4 Makeup to Slurry System 151.7 15.9
5 Makeup water to ash handling 110.1 11.6 18 Makeup to Humidifier 190.2 20.0 34 Makeup to Cooling Tower 3,229 339.1 35 Makeup to Condenser 9.9 1.0 3,691 387.6 3,691 387.6

Power Plant Water Usage and Loss Study
30 August 2005
4. WATER LOSS ANALYSIS OF THE GE ENERGY QUENCH IGCC PLANT
The study design goal was to track the water flows and usages for all the major sections of the plant. Since essentially all fuel-bound hydrogen ends up as water, hydrogen was also tracked for each plant and major process area. An overall water balance and a water balance for each major plant section was then generated.
This IGCC plant design is based on the GE Energy technology, which utilizes a pressurized entrained-flow, oxygen-blown gasification process. The plant configuration is based on the quench gasifier option operating at approximately 965 psia.
The power generation technology is based on selection of two gas turbines derived from the General Electric 7FA machine. The plant is configured with two operating gasifiers including processes to progressively cool and clean the gas, making it suitable for combustion in the gas turbines. The resulting plant produces a net output of 522 MWe at a net efficiency of 35.4 percent on an HHV basis. Performance is based on the properties of Pittsburgh No. 8 coal, described in the plant design basis. Overall performance for the entire plant is summarized in Table 4-1, which includes auxiliary power requirements.

Power Plant Water Usage and Loss Study
31 August 2005
Table 4-1 GE Energy Quench IGCC Plant Performance Summary
100 Percent Load
POWER SUMMARY (Gross Power at Generator Terminals, kWe) Gas Turbine Power Sweet Gas Expander Power Steam Turbine Total
394,000 13,570
223,090 630,660
AUXILIARY LOAD SUMMARY, kWe Coal Handling Coal Milling Coal Slurry Pumps Slag Handling and Dewatering Air Separation Unit Auxiliaries Oxygen Compressor Main Nitrogen Compressor Nitrogen Boost Compressor Claus Tail Gas Recycle Compressor HP Boiler Feedwater Pumps IP Boiler Feedwater Pumps LP Boiler Feedwater Pumps Scrubber Pumps Circulating Water Pumps Cooling Tower Fans Condensate Pump Selexol Unit Auxiliaries Gas Turbine Auxiliaries Steam Turbine Auxiliaries Claus Plant Auxiliaries Miscellaneous Balance of Plant Transformer Loss
520 1,070
370 290
53,120 15,530 18,620
900 2,030 2,750
200 650 100
3,250 1,950
310 2,720
800 400 200
1,000 1,600
TOTAL AUXILIARIES, kWe 108,380 Net Power, kWe Net Plant Efficiency, % HHV Net Heat Rate, Btu/kWh (HHV)
522,280 35.5%
9,625 CONDENSER COOLING DUTY, 106 Btu/h 1,419 CONSUMABLES As-Received Coal Feed, lb/h Thermal Input1, kWt Gasifier Oxygen (95% pure), lb/h Claus Plant Oxygen (95% pure), lb/h Water (for slurry), lb/h
403,754 1,473,192
384,649 8,524
185,230
1 HHV of As-Fed Pittsburgh 6 % Moisture Coal is 12,450 Btu/lb

Power Plant Water Usage and Loss Study
32 August 2005
4.1 HEAT AND MATERIAL BALANCE
The heat and material balance for the IGCC plant is based on General Electric’s estimate for the syngas fuel requirements for two 7FA gas turbines. The pressurized entrained-flow gasifier uses a coal/water slurry and oxygen to produce a medium heating value fuel gas.
The gasifier vessel is a refractory-lined, high-pressure combustion chamber. Coal slurry is transferred from the slurry storage tank to the gasifier with a high-pressure pump. At the top of the gasifier vessel is located a combination fuel injector through which coal slurry feedstock and oxidant (oxygen) are fed. The coal slurry and the oxygen feeds react in the gasifier at about 965 psia at a high temperature (in excess of 2500°F) to produce syngas. Hot syngas and molten solids from the reactor flow downward into a water-filled quench chamber where the syngas is cooled and the ash solidifies. Raw syngas then flows to the syngas scrubber for removal of entrained solids.
The gas goes through a series of gas coolers and cleanup processes including a COS hydrolysis reactor, a carbon bed mercury removal system, and an AGR plant. Slag captured by the syngas scrubber is recovered in a slag recovery unit. Regeneration gas from the AGR plant is fed to a Claus plant, where elemental sulfur is recovered.
This plant utilizes a combined cycle for combustion of the syngas from the gasifier to generate electric power. Humidification of the syngas and nitrogen dilution aids in minimizing formation of NOX during combustion in the gas turbine burner section. A Brayton cycle using air and combustion products as working fluid is used in conjunction with a conventional subcritical steam Rankine cycle. The two cycles are coupled by generation of steam in the heat recovery steam generator (HRSG), by feedwater heating in the HRSG, and by heat recovery from the IGCC process.
Figure 4-1 is a modified block flow diagram for the overall plant with individual streams identified. Table 4-2 follows the figure with detailed composition and state points for the numbered streams.
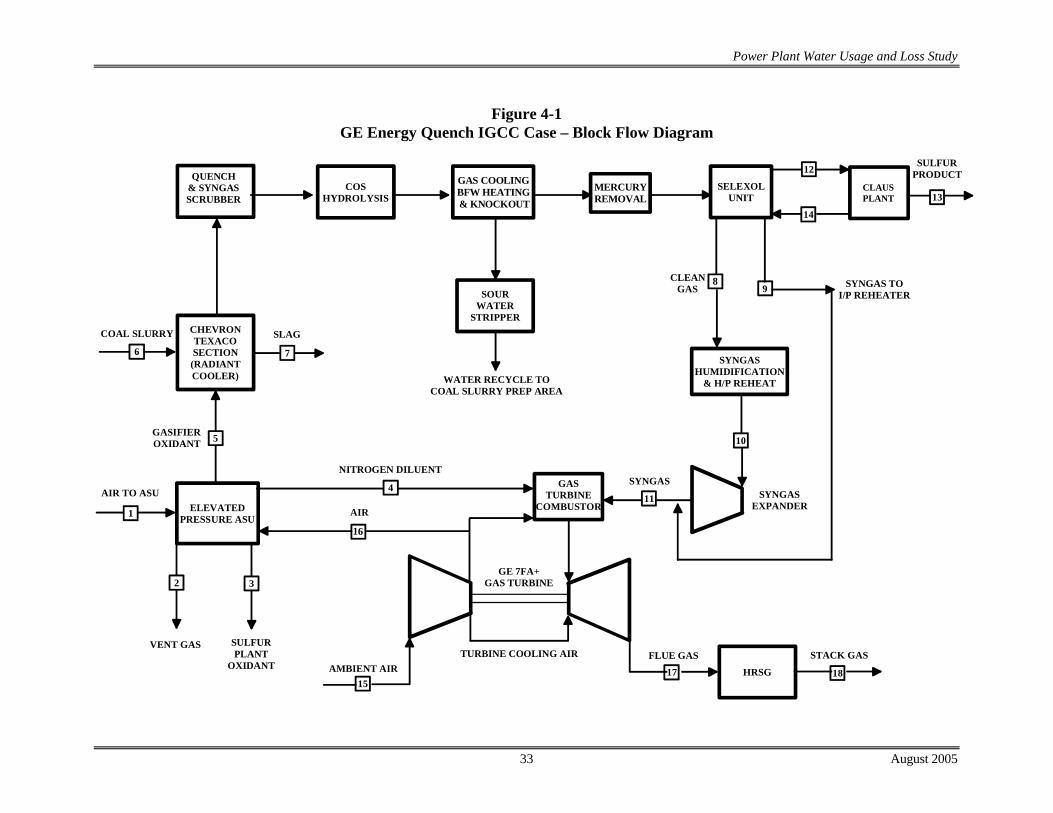
Power Plant Water Usage and Loss Study
33 August 2005
Figure 4-1 GE Energy Quench IGCC Case – Block Flow Diagram
CHEVRONTEXACOSECTION(RADIANTCOOLER)
SOURWATER
STRIPPER
ELEVATEDPRESSURE ASU
QUENCH& SYNGASSCRUBBER
GAS COOLINGBFW HEATING & KNOCKOUT
COSHYDROLYSIS
COAL SLURRY
6
5GASIFIEROXIDANT
7
SLAG
AIR TO ASU
VENT GAS
1
2
89
18
10
HRSG
GE 7FA+GAS TURBINE
AMBIENT AIRTURBINE COOLING AIR FLUE GAS STACK GAS
SELEXOLUNIT
SULFURPLANT
OXIDANT
3
13
11
SYNGASNITROGEN DILUENT
4
CLAUSPLANT
SULFURPRODUCT
CLEANGAS
AIR
MERCURYREMOVAL
14
17
SYNGASEXPANDER
SYNGASHUMIDIFICATION
& H/P REHEAT
GASTURBINE
COMBUSTOR
15
12
16
SYNGAS TOI/P REHEATER
WATER RECYCLE TOCOAL SLURRY PREP AREA
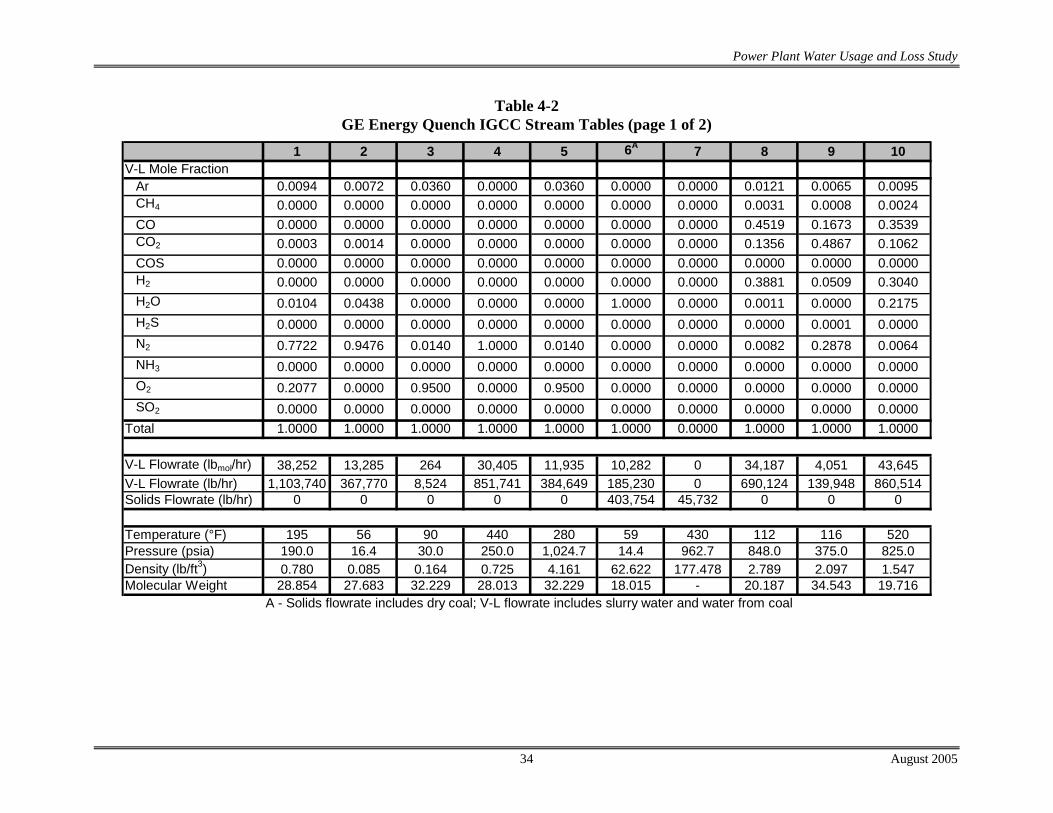
Power Plant Water Usage and Loss Study
34 August 2005
Table 4-2 GE Energy Quench IGCC Stream Tables (page 1 of 2)
1 2 3 4 5 6A 7 8 9 10V-L Mole Fraction
Ar 0.0094 0.0072 0.0360 0.0000 0.0360 0.0000 0.0000 0.0121 0.0065 0.0095CH4 0.0000 0.0000 0.0000 0.0000 0.0000 0.0000 0.0000 0.0031 0.0008 0.0024CO 0.0000 0.0000 0.0000 0.0000 0.0000 0.0000 0.0000 0.4519 0.1673 0.3539CO2 0.0003 0.0014 0.0000 0.0000 0.0000 0.0000 0.0000 0.1356 0.4867 0.1062COS 0.0000 0.0000 0.0000 0.0000 0.0000 0.0000 0.0000 0.0000 0.0000 0.0000H2 0.0000 0.0000 0.0000 0.0000 0.0000 0.0000 0.0000 0.3881 0.0509 0.3040H2O 0.0104 0.0438 0.0000 0.0000 0.0000 1.0000 0.0000 0.0011 0.0000 0.2175H2S 0.0000 0.0000 0.0000 0.0000 0.0000 0.0000 0.0000 0.0000 0.0001 0.0000N2 0.7722 0.9476 0.0140 1.0000 0.0140 0.0000 0.0000 0.0082 0.2878 0.0064NH3 0.0000 0.0000 0.0000 0.0000 0.0000 0.0000 0.0000 0.0000 0.0000 0.0000O2 0.2077 0.0000 0.9500 0.0000 0.9500 0.0000 0.0000 0.0000 0.0000 0.0000SO2 0.0000 0.0000 0.0000 0.0000 0.0000 0.0000 0.0000 0.0000 0.0000 0.0000
Total 1.0000 1.0000 1.0000 1.0000 1.0000 1.0000 0.0000 1.0000 1.0000 1.0000
V-L Flowrate (lbmol/hr) 38,252 13,285 264 30,405 11,935 10,282 0 34,187 4,051 43,645V-L Flowrate (lb/hr) 1,103,740 367,770 8,524 851,741 384,649 185,230 0 690,124 139,948 860,514Solids Flowrate (lb/hr) 0 0 0 0 0 403,754 45,732 0 0 0
Temperature (°F) 195 56 90 440 280 59 430 112 116 520Pressure (psia) 190.0 16.4 30.0 250.0 1,024.7 14.4 962.7 848.0 375.0 825.0Density (lb/ft3) 0.780 0.085 0.164 0.725 4.161 62.622 177.478 2.789 2.097 1.547Molecular Weight 28.854 27.683 32.229 28.013 32.229 18.015 - 20.187 34.543 19.716
A - Solids flowrate includes dry coal; V-L flowrate includes slurry water and water from coal
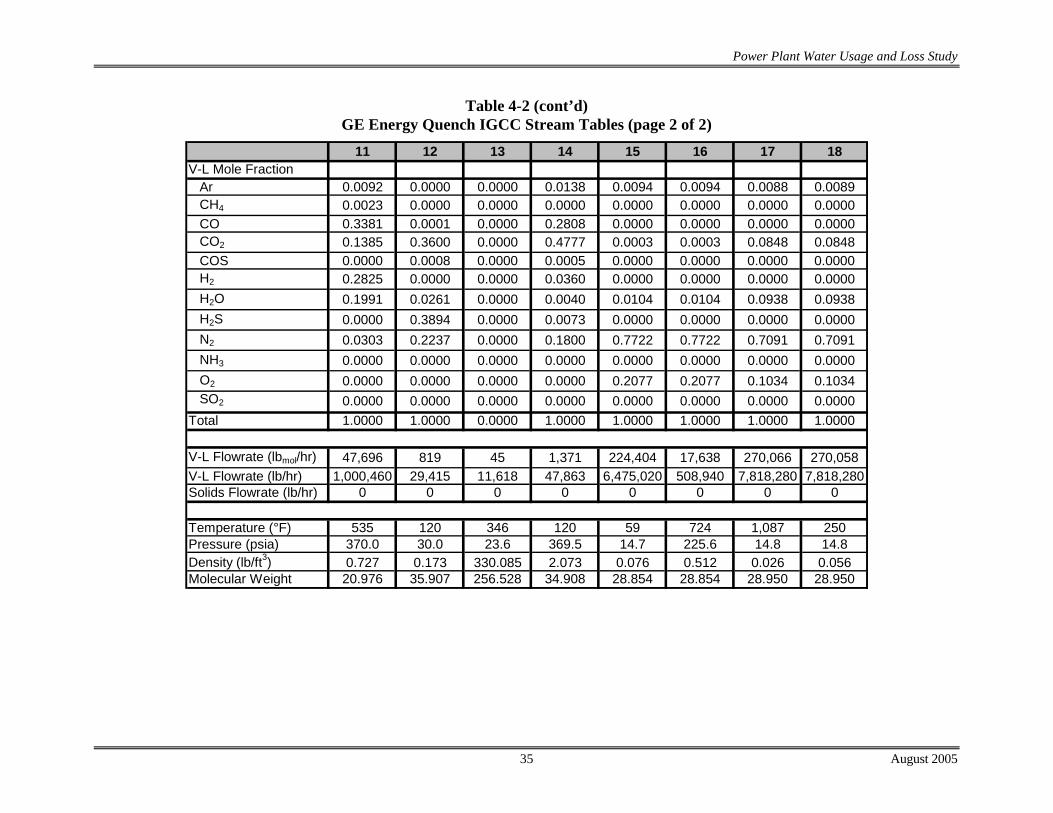
Power Plant Water Usage and Loss Study
35 August 2005
Table 4-2 (cont’d) GE Energy Quench IGCC Stream Tables (page 2 of 2)
11 12 13 14 15 16 17 18V-L Mole Fraction
Ar 0.0092 0.0000 0.0000 0.0138 0.0094 0.0094 0.0088 0.0089CH4 0.0023 0.0000 0.0000 0.0000 0.0000 0.0000 0.0000 0.0000CO 0.3381 0.0001 0.0000 0.2808 0.0000 0.0000 0.0000 0.0000CO2 0.1385 0.3600 0.0000 0.4777 0.0003 0.0003 0.0848 0.0848COS 0.0000 0.0008 0.0000 0.0005 0.0000 0.0000 0.0000 0.0000H2 0.2825 0.0000 0.0000 0.0360 0.0000 0.0000 0.0000 0.0000H2O 0.1991 0.0261 0.0000 0.0040 0.0104 0.0104 0.0938 0.0938H2S 0.0000 0.3894 0.0000 0.0073 0.0000 0.0000 0.0000 0.0000N2 0.0303 0.2237 0.0000 0.1800 0.7722 0.7722 0.7091 0.7091NH3 0.0000 0.0000 0.0000 0.0000 0.0000 0.0000 0.0000 0.0000O2 0.0000 0.0000 0.0000 0.0000 0.2077 0.2077 0.1034 0.1034SO2 0.0000 0.0000 0.0000 0.0000 0.0000 0.0000 0.0000 0.0000
Total 1.0000 1.0000 0.0000 1.0000 1.0000 1.0000 1.0000 1.0000
V-L Flowrate (lbmol/hr) 47,696 819 45 1,371 224,404 17,638 270,066 270,058V-L Flowrate (lb/hr) 1,000,460 29,415 11,618 47,863 6,475,020 508,940 7,818,280 7,818,280Solids Flowrate (lb/hr) 0 0 0 0 0 0 0 0
Temperature (°F) 535 120 346 120 59 724 1,087 250Pressure (psia) 370.0 30.0 23.6 369.5 14.7 225.6 14.8 14.8Density (lb/ft3) 0.727 0.173 330.085 2.073 0.076 0.512 0.026 0.056Molecular Weight 20.976 35.907 256.528 34.908 28.854 28.854 28.950 28.950
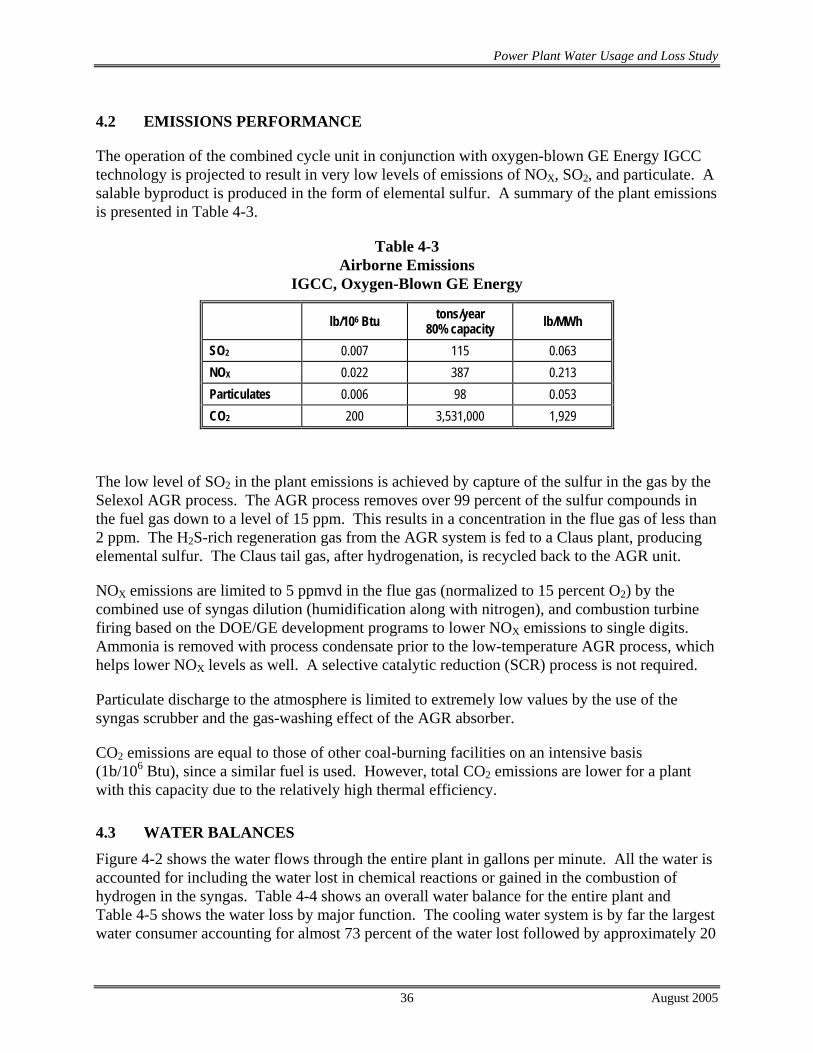
Power Plant Water Usage and Loss Study
36 August 2005
4.2 EMISSIONS PERFORMANCE
The operation of the combined cycle unit in conjunction with oxygen-blown GE Energy IGCC technology is projected to result in very low levels of emissions of NOX, SO2, and particulate. A salable byproduct is produced in the form of elemental sulfur. A summary of the plant emissions is presented in Table 4-3.
Table 4-3 Airborne Emissions
IGCC, Oxygen-Blown GE Energy
lb/106 Btu tons/year 80% capacity lb/MWh
SO2 0.007 115 0.063 NOX 0.022 387 0.213 Particulates 0.006 98 0.053 CO2 200 3,531,000 1,929
The low level of SO2 in the plant emissions is achieved by capture of the sulfur in the gas by the Selexol AGR process. The AGR process removes over 99 percent of the sulfur compounds in the fuel gas down to a level of 15 ppm. This results in a concentration in the flue gas of less than 2 ppm. The H2S-rich regeneration gas from the AGR system is fed to a Claus plant, producing elemental sulfur. The Claus tail gas, after hydrogenation, is recycled back to the AGR unit.
NOX emissions are limited to 5 ppmvd in the flue gas (normalized to 15 percent O2) by the combined use of syngas dilution (humidification along with nitrogen), and combustion turbine firing based on the DOE/GE development programs to lower NOX emissions to single digits. Ammonia is removed with process condensate prior to the low-temperature AGR process, which helps lower NOX levels as well. A selective catalytic reduction (SCR) process is not required.
Particulate discharge to the atmosphere is limited to extremely low values by the use of the syngas scrubber and the gas-washing effect of the AGR absorber.
CO2 emissions are equal to those of other coal-burning facilities on an intensive basis (1b/106 Btu), since a similar fuel is used. However, total CO2 emissions are lower for a plant with this capacity due to the relatively high thermal efficiency.
4.3 WATER BALANCES
Figure 4-2 shows the water flows through the entire plant in gallons per minute. All the water is accounted for including the water lost in chemical reactions or gained in the combustion of hydrogen in the syngas. Table 4-4 shows an overall water balance for the entire plant and Table 4-5 shows the water loss by major function. The cooling water system is by far the largest water consumer accounting for almost 73 percent of the water lost followed by approximately 20

Power Plant Water Usage and Loss Study
37 August 2005
percent of the water lost in the flue gas. The slurry fed GE Energy gasification process accounts for less than 7 percent of the losses.
Table 4-4 GE Energy Quench IGCC Overall Water Balance
Water In Water Out No Location Flow (gpm) No Location Flow (gpm)1 Moisture in coal 48.5 A Water Lost in Gasification Shift 158.0C Syngas Combustion of H2 in GT 493.1 6 Ash Handling Blowdown 81.122 Combustion air for GT 77.5 7 Water with Slag 32.033 Raw Water 3,824 B Water loss in COS Hydrolysis 0.5
Moisture in Air to ASU 21.0 24 GT Flue gas 912.6 27 Water Treatment Effluent 22.2 37 Cooling tower blowdown 808.8 36 Cooling tower evaporation 2,428 Moisture in ASU Vent 21.0 4,464 4,464
Table 4-5 GE Energy Quench IGCC Water Loss by Function
Gasification losses gpm gal/MWh Water Lost in Gasification Shift 158.0 18.2 Ash Handling Blowdown 81.1 9.3 Water with Slag 32.0 3.7 Water loss in COS Hydrolysis 0.5 0.1 Water Treatment Effluent 22.2 2.5 Total 293.7 33.7 Flue gas losses GT Flue gas 912.6 104.8 Total 912.6 104.8 Cooling water losses Cooling tower blowdown 808.8 92.9 Cooling tower evaporation 2,428 278.9 Total 3,236 371.8 Grand Total 4,443 510.4

Power Plant Water Usage and Loss Study
38 August 2005
Figure 4-2 GE Energy Quench IGCC Case – Block Flow Diagram – Water Flows in Gallons per Minute
SLURRYMIXER
COAL
1 GASIFIER
COAL SLURRY
3
2
SLURRYWATER
ASHHANDLING
MAKE-UPWATER
5
7
SLAG (WET)
WATERWASH8
MAKE-UPWATER
11
TO SOUR WATER STRIPPER
COSHYDROLYSIS12
GAS COOLING&
KNOCKOUT13
14
SELEXOLUNIT15
CLAUSPLANT25
TAIL GASTREATMENT
UNIT
SOUR WATERSTRIPPER 3230
HUMIDIFIER
17
19
TO SOURWATER
STRIPPER
GASTURBINE20 23
16
28
31
BLOWDOWN
CONDENSATE&
DEAERATION
WATERTREATING
6BLOWDOWN
AIR(HUMID)
HRSG 24
STACK GASSTEAM
TURBINE
COLD REHEAT
HP STEAM
IP STEAM
LP STEAM
SPRAY WATER
BLOWDOWN
EVAPORATION
BLOWDOWN
COOLINGWATERSYSTEM
MAKEUP WATER
MAKEUP WATER
MAKEUPWATER TO
HUMIDIFIER
MAKEUPWATER TO
ASH HANDLING
RAWWATER
33
34
35
5
37
3639
38
22
18
CWS
CWR
A
WATERLOST TO
SHIFTB
WATERLOST TO
HYDROLYSIS
H2 & CH 4COMBUSTION
C
CONDENSATE
[Water Flow, gpm]
[48.5] [418.7]
[2428]
[370.2]
[56.0][32.0]
[792.9]
[1526]
[492.2]
[0.5][465.2] 29 [19.7]
[16.6]
[1.3]
[18.1]
[2021]
[1.8]
[201.9]
[0.2]
[28.1]
[3155]
18
MAKE-UPWATER
[368.7]
[341.9]
[77.5]
[912.6]
[493.1]
[912.6]
[368.7][14.5]
[0.0]
[14.5]
[158.0]
[103.7] [81.1]
[3823]
[809]BFW
[3023]
SYNGASEXPANDER
TAIL GASCONDENSATE
9 [5621]
[491.7]
4
MAKE-UPWATER
[257.3]
10
19 [28.1]
[103.7]
QUENCH AND WATER WASH MAKEUP
QU
ENC
H R
ECYC
LE
WAT
ER W
ASH
REC
YCLE
SLURRY WATER
WATERTREATMENT
26
[199.4]
26 [22.2]
EFFLUENT
QUENCHMAKEUPWATER
10[56.0]
SLURRY MAKEUPWATER
4[257.3]
SLURRYMIXER
COAL
1 GASIFIER
COAL SLURRY
3
2
SLURRYWATER
ASHHANDLING
MAKE-UPWATER
5
7
SLAG (WET)
WATERWASH8
MAKE-UPWATER
11
TO SOUR WATER STRIPPER
COSHYDROLYSIS12
GAS COOLING&
KNOCKOUT13
14
SELEXOLUNIT15
CLAUSPLANT25
TAIL GASTREATMENT
UNIT
SOUR WATERSTRIPPER 3230
HUMIDIFIER
17
SLURRYMIXER
COAL
1 GASIFIER
COAL SLURRY
3
2
SLURRYWATER
ASHHANDLING
MAKE-UPWATER
5
7
SLAG (WET)
WATERWASH8
MAKE-UPWATER
11
TO SOUR WATER STRIPPER
COSHYDROLYSIS12
GAS COOLING&
KNOCKOUT13
14
SELEXOLUNIT15
CLAUSPLANT25
TAIL GASTREATMENT
UNIT
SOUR WATERSTRIPPER 3230
HUMIDIFIER
17
19
TO SOURWATER
STRIPPER
GASTURBINE20 23
16
28
31
BLOWDOWN
CONDENSATE&
DEAERATION
WATERTREATING
6BLOWDOWN
AIR(HUMID)
HRSG 24
STACK GASSTEAM
TURBINE
COLD REHEAT
HP STEAM
19
TO SOURWATER
STRIPPER
GASTURBINE20 23
16
28
31
BLOWDOWN
CONDENSATE&
DEAERATION
WATERTREATING
6BLOWDOWN
AIR(HUMID)
HRSG 24
STACK GASSTEAM
TURBINE
COLD REHEAT
HP STEAM
IP STEAM
LP STEAM
SPRAY WATER
BLOWDOWN
EVAPORATION
BLOWDOWN
COOLINGWATERSYSTEM
MAKEUP WATER
MAKEUP WATER
MAKEUPWATER TO
HUMIDIFIER
MAKEUPWATER TO
ASH HANDLING
RAWWATER
33
34
35
5
37
3639
38
22
18
CWS
CWR
A
WATERLOST TO
SHIFTB
WATERLOST TO
HYDROLYSIS
H2 & CH 4COMBUSTION
C
CONDENSATE
[Water Flow, gpm]
[48.5] [418.7]
[2428]
[370.2]
[56.0][32.0]
[792.9]
[1526]
[492.2]
[0.5][465.2] 29 [19.7]
[16.6]
[1.3]
[18.1]
[2021]
[1.8]
[201.9]
[0.2]
[28.1]
[3155]
18
MAKE-UPWATER
[368.7]
[341.9]
[77.5]
[912.6]
[493.1]
[912.6]
[368.7][14.5]
[0.0]
[14.5]
[158.0]
[103.7] [81.1]
[3823]
[809]BFW
[3023]
SYNGASEXPANDER
TAIL GASCONDENSATE
[1.8]
[201.9]
[0.2]
[28.1]
[3155]
18
MAKE-UPWATER
[368.7]
[341.9]
[77.5]
[912.6]
[493.1]
[912.6]
[368.7][14.5]
[0.0]
[14.5]
[158.0]
[103.7] [81.1]
[3823]
[809]BFW
[3023]
SYNGASEXPANDER
TAIL GASCONDENSATE
9 [5621]
[491.7]
4
MAKE-UPWATER
[257.3]
10
19 [28.1]
[103.7]
QUENCH AND WATER WASH MAKEUP
QU
ENC
H R
ECYC
LE
WAT
ER W
ASH
REC
YCLE
SLURRY WATER
WATERTREATMENT
26
[199.4]
26 [22.2]
EFFLUENT
QUENCHMAKEUPWATER
10[56.0]
SLURRY MAKEUPWATER
4[257.3]
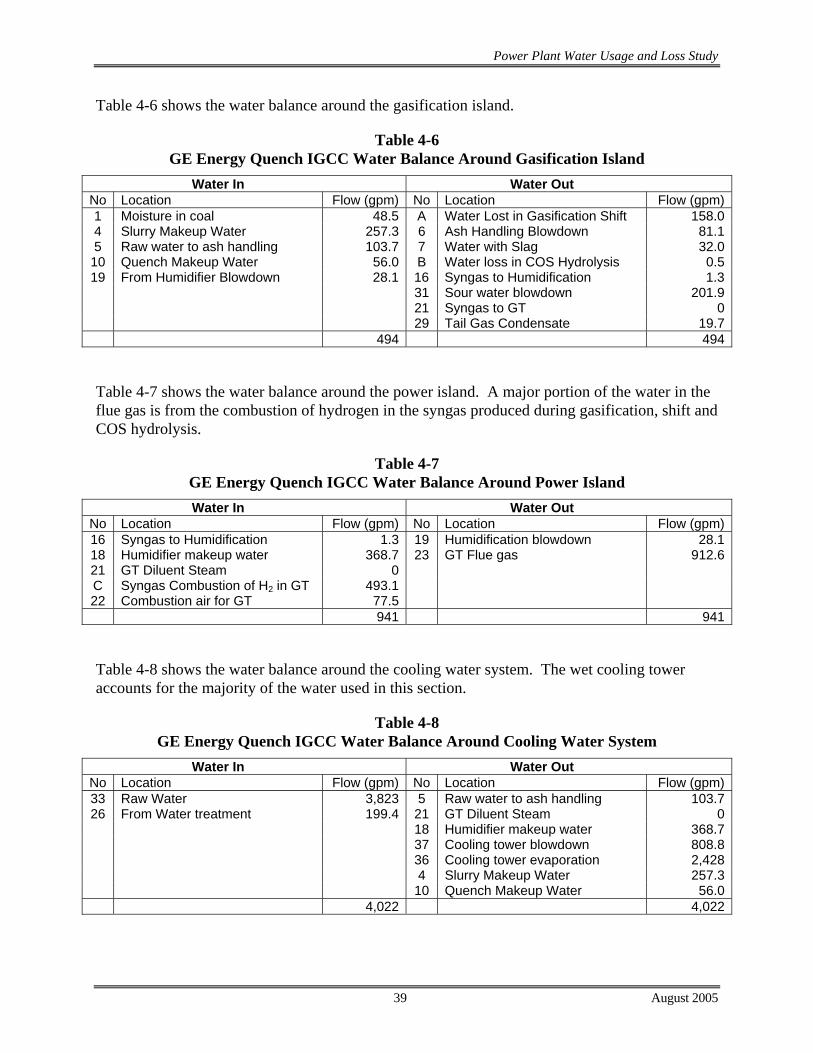
Power Plant Water Usage and Loss Study
39 August 2005
Table 4-6 shows the water balance around the gasification island.
Table 4-6 GE Energy Quench IGCC Water Balance Around Gasification Island
Water In Water Out No Location Flow (gpm) No Location Flow (gpm)1 Moisture in coal 48.5 A Water Lost in Gasification Shift 158.04 Slurry Makeup Water 257.3 6 Ash Handling Blowdown 81.15 Raw water to ash handling 103.7 7 Water with Slag 32.010 Quench Makeup Water 56.0 B Water loss in COS Hydrolysis 0.519 From Humidifier Blowdown 28.1 16 Syngas to Humidification 1.3
31 Sour water blowdown 201.9 21 Syngas to GT 0 29 Tail Gas Condensate 19.7 494 494
Table 4-7 shows the water balance around the power island. A major portion of the water in the flue gas is from the combustion of hydrogen in the syngas produced during gasification, shift and COS hydrolysis.
Table 4-7 GE Energy Quench IGCC Water Balance Around Power Island
Water In Water Out No Location Flow (gpm) No Location Flow (gpm)16 Syngas to Humidification 1.3 19 Humidification blowdown 28.118 Humidifier makeup water 368.7 23 GT Flue gas 912.621 GT Diluent Steam 0 C Syngas Combustion of H2 in GT 493.1 22 Combustion air for GT 77.5
941 941
Table 4-8 shows the water balance around the cooling water system. The wet cooling tower accounts for the majority of the water used in this section.
Table 4-8 GE Energy Quench IGCC Water Balance Around Cooling Water System
Water In Water Out No Location Flow (gpm) No Location Flow (gpm)33 Raw Water 3,823 5 Raw water to ash handling 103.726 From Water treatment 199.4 21 GT Diluent Steam 0
18 Humidifier makeup water 368.7 37 Cooling tower blowdown 808.8 36 Cooling tower evaporation 2,428 4 Slurry Makeup Water 257.3 10 Quench Makeup Water 56.0 4,022 4,022

Power Plant Water Usage and Loss Study
40 August 2005
4.4 RAW WATER USAGE
The raw water usage as calculated in this study represents the total amount of water to be supplied from local water resources to provide for the needs of the plant. The amount differs from the total water losses, or the totals appearing in the Overall Water Balance. The difference is attributable to water contributed to the balance via humid air intake to the process, water content of the fuel, and water produced in gasification/combustion. For example, the raw water usage to the cooling tower is calculated as the raw water makeup delivered directly to the cooling tower while the cooling tower loss calculation includes water recycled from other sources. The raw water usage for each power plant can be the determining factor for siting and permitting, as it identifies the impact of the plant on local water availability. Table 4-9 shows the raw water for the plant and the usage through branch streams required to supplement process losses and flue gas losses.
Table 4-9 GE Energy Quench IGCC Raw Water Usage
Water In Water Usage
No Location Flow (gpm)
gal/ MWh No Location Flow
(gpm)gal/
MWh 33 Raw Water 3,823 439.2 4 Makeup to Slurry System 257.3 29.6
5 Makeup water to ash handling 103.7 11.9 10 Makeup to Quench System 56.6 6.4 18 Makeup to Humidifier 368.7 42.4 34 Makeup to Cooling Tower 3,023 347.2 35 Makeup to Condenser 14.5 1.7 3,823 439.2 3,823 439.2

Power Plant Water Usage and Loss Study
41 August 2005
5. WATER LOSS ANALYSIS OF THE SHELL IGCC PLANT
The study design goal was to track the water flows and usages for all the major sections of the plant. Since essentially all fuel-bound hydrogen ends up as water, hydrogen was also tracked for each plant and major process area. An overall water balance and a water balance for each major plant section was then generated.
This IGCC plant design is based on the Shell Global Solutions gasification technology, which utilizes a pressurized entrained-flow dry-feed gasifier to meet the syngas fuel requirements for two General Electric 7FA combustion turbines.
The power generation technology is based on selection of a gas turbine derived from the General Electric 7FA machine. The plant is configured with two gasifiers including processes to progressively cool and clean the gas, making it suitable for combustion in the gas turbines. The resulting plant produces a net output of 537 MWe at a net efficiency of 40.1 percent on an HHV basis. Performance is based on the properties of Pittsburgh No. 8 coal, described in the plant design basis. Overall performance for the entire plant is summarized in Table 5-1, which includes auxiliary power requirements.

Power Plant Water Usage and Loss Study
42 August 2005
Table 5-1 Shell IGCC Plant Performance Summary
100 Percent Load
POWER SUMMARY (Gross Power at Generator Terminals, kWe) Gas Turbine Power Steam Turbine Total
394,000 239,540 633,540
AUXILIARY LOAD SUMMARY, kWe Coal Handling Coal Milling Slag Handling Air Separation Unit Auxiliaries Oxygen Compressor Nitrogen Compressor Syngas Recycle Compressor Incinerator/Coal Dryer Air Compressor HP Boiler Feedwater Pump IP Boiler Feedwater Pump Condensate Pump Circulating Water Pumps Cooling Tower Fans Scrubber Pumps Sulfinol Unit Auxiliaries Gas Turbine Auxiliaries Steam Turbine Auxiliaries Claus Plant/TGTU Auxiliaries Miscellaneous Balance of Plant Transformer Loss
450 940 310
45,990 10,620 23,010 2,110
90 3,200
110 250
2,690 1,640
300 360 800 400 250
1,000 1,550
TOTAL AUXILIARIES, kWe 96,070 Net Power, kWe Net Plant Efficiency, % HHV Net Heat Rate, Btu/kWh (HHV)
537,470 40.1%
8,503 CONDENSER COOLING DUTY, 106 Btu/h 1,332 CONSUMABLES As-Received Coal Feed, lb/h Thermal Input1, kWt Gasifier Oxygen (95% pure), lb/h Claus Plant Oxygen (95% pure), lb/h
366,992 1,339,057
321,918 3,824
1 HHV of as-fed Pittsburgh 6.00% moisture coal is 12,450 Btu/lb

Power Plant Water Usage and Loss Study
43 August 2005
5.1 HEAT AND MATERIAL BALANCE
The heat and material balance for the IGCC plant is based on the syngas fuel requirements for two General Electric 7FA gas turbines. The pressurized entrained flow Shell gasifier uses a dry-coal feed and oxygen to produce a medium heating value fuel gas. The syngas produced in the gasifier at about 2700°F and is quenched to around 1650°F by cooled recycled syngas. The syngas passes through a convective cooler and leaves near 450°F. High-pressure saturated steam is generated in the syngas cooler and is joined with the main steam supply.
The gas goes through a series of additional gas coolers and cleanup processes including a filter, scrubber, COS hydrolysis reactor, and a Sulfinol-M AGR plant. Slag captured by the filter and syngas scrubber is recovered in a slag recovery unit. Regeneration gas from the AGR plant is fed to a Claus plant, where elemental sulfur is recovered.
This plant utilizes a combined cycle for combustion of the syngas from the gasifier to generate electric power. Steam and nitrogen addition to the syngas aids in minimizing formation of NOX during combustion in the gas turbine burner section. A Brayton cycle using air and combustion products as working fluid is used in conjunction with a conventional subcritical steam Rankine cycle. The two cycles are coupled by generation of steam in the heat recovery steam generator (HRSG), by feedwater heating in the HRSG, and by heat recovery from the IGCC process (convective syngas cooler).
Figure 5-1 is a modified block flow diagram for the overall plant with individual streams identified. Table 5-2 follows the figure with detailed composition and state points for the numbered streams.

Power Plant Water Usage and Loss Study
44 August 2005
Figure 5-1 Shell Gasifier-Based IGCC Case – Block Flow Diagram
SHELLGASIFIER
ELEVATEDPRESSURE ASU
RAW GASCOOLER
GAS COOLINGBFW HEATING & KNOCKOUT
TAIL GAS TREATMENT
UNIT
CLAUSPLANT
SCRUBBER& COS
HYDROLYSIS
DRY COAL
7
5GASIFIEROXIDANT
SLAG
AIR TO ASU
VENT GAS
1
2
10
12
9
11
SULFURPRODUCT
HRSG
GE 7FA+GAS TURBINE
1416 17AMBIENT AIR
TURBINE COOLING AIR FLUE GAS STACK GAS
SULFINOLACID GASREMOVAL
SULFURPLANT
OXIDANT
3
GAS TURBINECOMBUSTOR
SYNGAS
13
TAIL GASTO
COAL DRYER
NITROGEN DILUENT
4
8
SYNGASHUMIDIFICATION
& REHEATER
STEAM
6
ACIDGAS
CLEANGAS
15AIR
MERCURYREMOVAL
SYNGAS QUENCHRECYCLE
TO SOUR WATERSTRIPPER
STEAM

Power Plant Water Usage and Loss Study
45 August 2005
Table 5-2 Shell Gasifier-Based Dual-Train IGCC Stream Tables (page 1 of 2)
1 2 3 4 5 6 7 8 9V-L Mole Fraction
Ar 0.0094 0.0258 0.0360 0.0012 0.0360 0.0000 0.0000 0.0113 0.0095CH4 0.0000 0.0000 0.0000 0.0000 0.0000 0.0000 0.0000 0.0002 0.0001CO 0.0000 0.0000 0.0000 0.0000 0.0000 0.0000 0.0000 0.6356 0.5355CO2 0.0003 0.0060 0.0000 0.0000 0.0000 0.0000 0.0000 0.0007 0.0006COS 0.0000 0.0000 0.0000 0.0000 0.0000 0.0000 0.0000 0.0000 0.0000H2 0.0000 0.0000 0.0000 0.0000 0.0000 0.0000 0.0000 0.2949 0.2484H2O 0.0104 0.1907 0.0000 0.0000 0.0000 1.0000 1.0000 0.0020 0.1592H2S 0.0000 0.0000 0.0000 0.0000 0.0000 0.0000 0.0000 0.0000 0.0000N2 0.7722 0.7775 0.0140 0.9987 0.0140 0.0000 0.0000 0.0553 0.0466NH3 0.0000 0.0000 0.0000 0.0000 0.0000 0.0000 0.0000 0.0000 0.0000O2 0.2077 0.0000 0.9500 0.0000 0.9500 0.0000 0.0000 0.0000 0.0000SO2 0.0000 0.0000 0.0000 0.0000 0.0000 0.0000 0.0000 0.0000 0.0000
Total 1.0000 1.0000 1.0000 1.0000 1.0000 1.0000 1.0000 1.0000 1.0000
V-L Flowrate (lbmol/hr) 36,955 2,528 119 32,075 9,988 1,966 391 31,513 37,405V-L Flowrate (lb/hr) 1,066,300 67,017 3,824 898,528 321,918 35,411 7,040 645,065 751,216Solids Flowrate (lb/hr) 0 0 0 0 0 0 344,973 0 0
Temperature (°F) 271 70 90 335 227 450 215 124 400Pressure (psia) 225.0 16.4 56.4 300.0 650.0 500.0 14.4 357.0 345.0Density (lb/ft3) 0.828 0.124 0.308 0.985 2.844 47.395 --- 1.167 0.751Molecular Weight 28.854 24.553 32.184 28.013 32.229 18.015 --- 20.470 20.083

Power Plant Water Usage and Loss Study
46 August 2005
Table 5-2 (cont’d) Shell Gasifier-Based Dual-Train IGCC Stream Tables (page 2 of 2)
10 11 12 13 14 15 16 17V-L Mole Fraction
Ar 0.0003 0.0000 0.0028 0.0037 0.0094 0.0094 0.0088 0.0088CH4 0.0000 0.0000 0.0000 0.0000 0.0000 0.0000 0.0000 0.0000CO 0.0103 0.0000 0.1028 0.0128 0.0000 0.0000 0.0000 0.0000CO2 0.6559 0.0000 0.5715 0.6545 0.0003 0.0003 0.0746 0.0746COS 0.0000 0.0000 0.0003 0.0000 0.0000 0.0000 0.0000 0.0000H2 0.0052 0.0000 0.0140 0.1377 0.0000 0.0000 0.0000 0.0000H2O 0.0054 0.0000 0.2379 0.1009 0.0104 0.0104 0.0695 0.0695H2S 0.2518 0.0000 0.0015 0.0000 0.0000 0.0000 0.0000 0.0000N2 0.0711 0.0000 0.0681 0.0905 0.7722 0.7722 0.7371 0.7371NH3 0.0000 0.0000 0.0000 0.0000 0.0000 0.0000 0.0000 0.0000O2 0.0000 0.0000 0.0000 0.0000 0.2077 0.2077 0.1101 0.1101SO2 0.0000 0.0000 0.0011 0.0000 0.0000 0.0000 0.0000 0.0000
Total 1.0000 0.0000 1.0000 1.0000 1.0000 1.0000 1.0000 1.0000
V-L Flowrate (lbmol/hr) 1,297 0 1,725 1,300 223,032 9,350 269,752 269,752V-L Flowrate (lb/hr) 51,688 0 59,536 44,107 6,435,440 269,800 7,837,930 7,837,930Solids Flowrate (lb/hr) 0 10,572 0 0 0 0 0 0
Temperature (°F) 124 347 280 123 59 220 1,075 245Pressure (psia) 60.0 23.6 23.6 14.9 14.4 193.0 14.8 14.7Density (lb/ft3) 0.382 --- 0.103 0.081 0.075 0.764 0.026 0.056Molecular Weight 39.847 --- 34.508 33.939 28.854 28.854 29.056 29.056
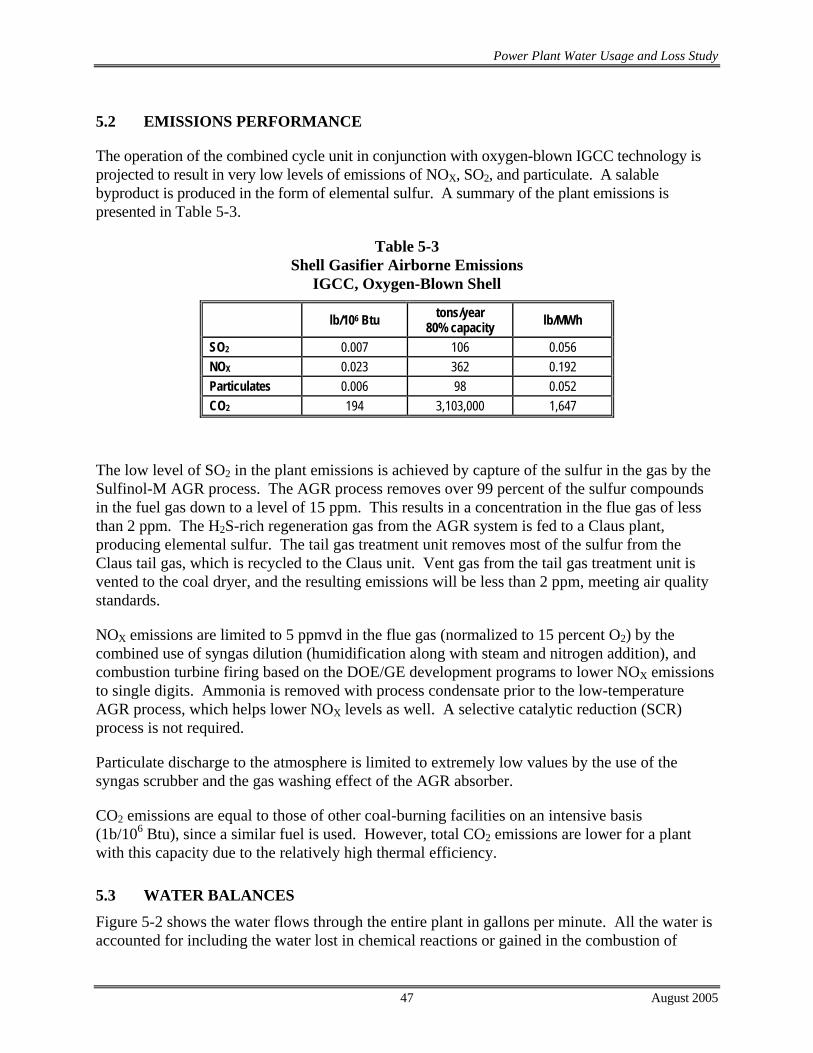
Power Plant Water Usage and Loss Study
47 August 2005
5.2 EMISSIONS PERFORMANCE
The operation of the combined cycle unit in conjunction with oxygen-blown IGCC technology is projected to result in very low levels of emissions of NOX, SO2, and particulate. A salable byproduct is produced in the form of elemental sulfur. A summary of the plant emissions is presented in Table 5-3.
Table 5-3 Shell Gasifier Airborne Emissions
IGCC, Oxygen-Blown Shell
lb/106 Btu tons/year 80% capacity lb/MWh
SO2 0.007 106 0.056 NOX 0.023 362 0.192 Particulates 0.006 98 0.052 CO2 194 3,103,000 1,647
The low level of SO2 in the plant emissions is achieved by capture of the sulfur in the gas by the Sulfinol-M AGR process. The AGR process removes over 99 percent of the sulfur compounds in the fuel gas down to a level of 15 ppm. This results in a concentration in the flue gas of less than 2 ppm. The H2S-rich regeneration gas from the AGR system is fed to a Claus plant, producing elemental sulfur. The tail gas treatment unit removes most of the sulfur from the Claus tail gas, which is recycled to the Claus unit. Vent gas from the tail gas treatment unit is vented to the coal dryer, and the resulting emissions will be less than 2 ppm, meeting air quality standards.
NOX emissions are limited to 5 ppmvd in the flue gas (normalized to 15 percent O2) by the combined use of syngas dilution (humidification along with steam and nitrogen addition), and combustion turbine firing based on the DOE/GE development programs to lower NOX emissions to single digits. Ammonia is removed with process condensate prior to the low-temperature AGR process, which helps lower NOX levels as well. A selective catalytic reduction (SCR) process is not required.
Particulate discharge to the atmosphere is limited to extremely low values by the use of the syngas scrubber and the gas washing effect of the AGR absorber.
CO2 emissions are equal to those of other coal-burning facilities on an intensive basis (1b/106 Btu), since a similar fuel is used. However, total CO2 emissions are lower for a plant with this capacity due to the relatively high thermal efficiency.
5.3 WATER BALANCES
Figure 5-2 shows the water flows through the entire plant in gallons per minute. All the water is accounted for including the water lost in chemical reactions or gained in the combustion of
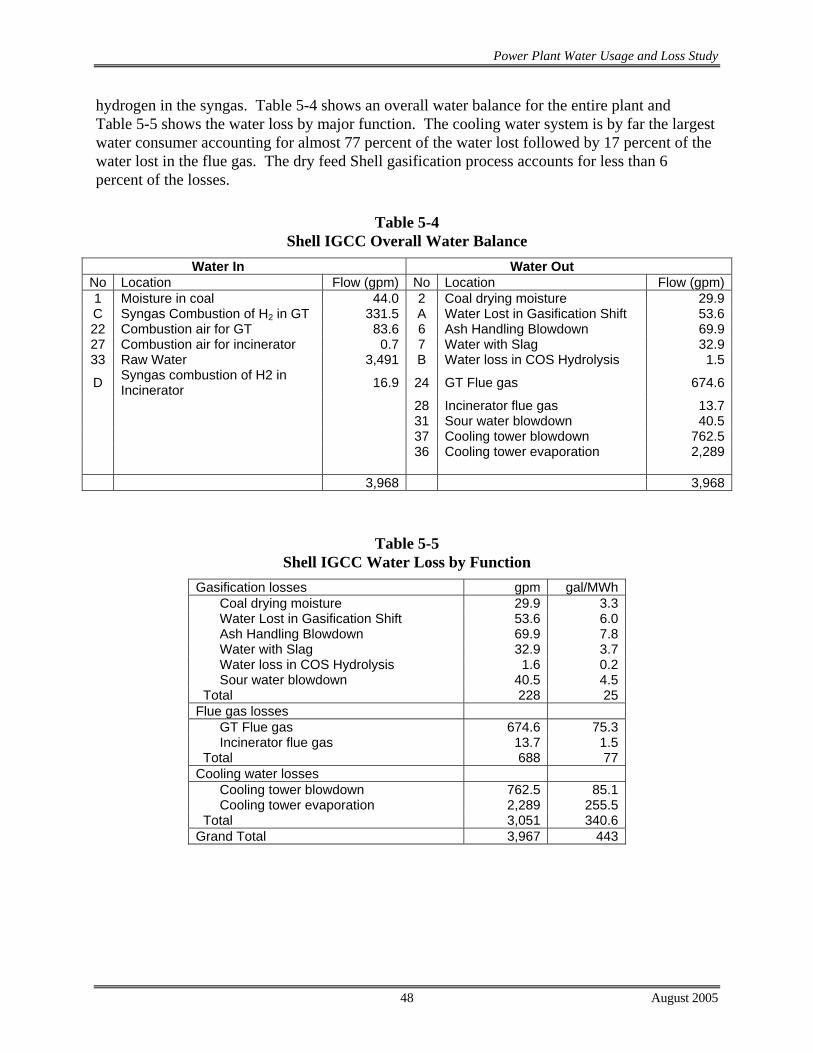
Power Plant Water Usage and Loss Study
48 August 2005
hydrogen in the syngas. Table 5-4 shows an overall water balance for the entire plant and Table 5-5 shows the water loss by major function. The cooling water system is by far the largest water consumer accounting for almost 77 percent of the water lost followed by 17 percent of the water lost in the flue gas. The dry feed Shell gasification process accounts for less than 6 percent of the losses.
Table 5-4 Shell IGCC Overall Water Balance
Water In Water Out No Location Flow (gpm) No Location Flow (gpm)1 Moisture in coal 44.0 2 Coal drying moisture 29.9C Syngas Combustion of H2 in GT 331.5 A Water Lost in Gasification Shift 53.622 Combustion air for GT 83.6 6 Ash Handling Blowdown 69.927 Combustion air for incinerator 0.7 7 Water with Slag 32.933 Raw Water 3,491 B Water loss in COS Hydrolysis 1.5
D Syngas combustion of H2 in Incinerator 16.9 24 GT Flue gas 674.6
28 Incinerator flue gas 13.7 31 Sour water blowdown 40.5 37 Cooling tower blowdown 762.5 36 Cooling tower evaporation 2,289 3,968 3,968
Table 5-5 Shell IGCC Water Loss by Function
Gasification losses gpm gal/MWh Coal drying moisture 29.9 3.3 Water Lost in Gasification Shift 53.6 6.0 Ash Handling Blowdown 69.9 7.8 Water with Slag 32.9 3.7 Water loss in COS Hydrolysis 1.6 0.2 Sour water blowdown 40.5 4.5 Total 228 25 Flue gas losses GT Flue gas 674.6 75.3 Incinerator flue gas 13.7 1.5 Total 688 77 Cooling water losses Cooling tower blowdown 762.5 85.1 Cooling tower evaporation 2,289 255.5 Total 3,051 340.6 Grand Total 3,967 443

Power Plant Water Usage and Loss Study
49 August 2005
Figure 5-2 Shell Gasifier-Based IGCC Case – Block Flow Diagram – Water Flows in Gallons per Minute
COALDRYER
COAL
1 GASIFIER
DRY COAL
3
2
MOISTURE
4
STEAM
ASHHANDLING
MAKE-UPWATER
5
7
SLAG (WET)
WATERWASH8
9
10
MAKE-UPWATER
11
TO SOUR WATER STRIPPER
COSHYDROLYSIS12
GAS COOLING&
KNOCKOUT13
14
SULFINOL-MUNIT15
CLAUSPLANT25
TGTU/INCINERATOR(COAL DRYER)
28
SOUR WATERSTRIPPER 3230
HUMIDIFIER
17
18
MAKE-UPWATER
19
TO SOURWATER
STRIPPER
GASTURBINE20 23
16
21
DILUENTSTEAM
29
31
BLOWDOWN
CONDENSATE&
DEAERATION
WATERTREATING
6BLOWDOWN
AIR(HUMID)
19
HRSG 24
STACK GASSTEAM
TURBINE
COLD REHEAT
HP STEAM
IP STEAM
LP STEAM
SPRAY WATER
STEAMTO GASIFIER(4) & GT(21)
BLOWDOWN
EVAPORATION
BLOWDOWN
COOLINGWATERSYSTEM
MAKEUP WATER
MAKEUP WATER
MAKEUPWATER TO
HUMIDIFIER
MAKEUPWATER TO
ASH HANDLING
RAWWATER
33
34
35
5
37
3639
38
22
27
AIR(HUMID)
SYNGAS TO COAL DRYER26
18
CWS
CWR
AWATER
LOST TOSHIFT
BWATER
LOST TOHYDROLYSIS
H2COMBUSTION
C
H2COMBUSTION
D
CONDENSATE
[Water Flow, gpm]
[44.0]
[29.9] [70.8]
[14.1]
[102.8]
[32.9]
[53.6]
[69.9]
[31.3]
[603.3]
[64.3]
[50.2]
[17.1]
[1.6]
[62.7]
[60.2]
[2.5]
[9.5]
[102.8]
[3492]
[221.7]
[3042]
[763]
[125.2]
[9.2]
[2289]
[3.9]
[90.7]
[50.2]
[40.5]
[0.0]
[0.3]
[2.3]
[0.0]
[1160]
[214.5]
[45.1]
[674.6]
[83.6]
[331.5]
[9.5]
[221.7]
[0.7]
[13.7]
[16.9]
[115.9]
[27.5]
[674.6]
.
.
STACK GAS
BFW
COALDRYER
COAL
1 GASIFIER
DRY COAL
3
2
MOISTURE
4
STEAM
ASHHANDLING
MAKE-UPWATER
5
7
SLAG (WET)
WATERWASH8
9
10
MAKE-UPWATER
11
TO SOUR WATER STRIPPER
COSHYDROLYSIS12
GAS COOLING&
KNOCKOUT13
14
SULFINOL-MUNIT15
CLAUSPLANT25
TGTU/INCINERATOR(COAL DRYER)
28
SOUR WATERSTRIPPER
COALDRYER
COAL
1 GASIFIER
DRY COAL
3
2
MOISTURE
4
STEAM
ASHHANDLING
MAKE-UPWATER
5
7
SLAG (WET)
WATERWASH8
9
10
MAKE-UPWATER
11
TO SOUR WATER STRIPPER
COSHYDROLYSIS12
GAS COOLING&
KNOCKOUT13
14
SULFINOL-MUNIT15
CLAUSPLANT25
TGTU/INCINERATOR(COAL DRYER)
28
SOUR WATERSTRIPPER 3230
HUMIDIFIER
17
18
MAKE-UPWATER
19
TO SOURWATER
STRIPPER
GASTURBINE20 23
16
21
DILUENTSTEAM
29
3230
HUMIDIFIER
17
18
MAKE-UPWATER
19
TO SOURWATER
STRIPPER
GASTURBINE20 23
16
21
DILUENTSTEAM
29
31
BLOWDOWN
CONDENSATE&
DEAERATION
WATERTREATING
6BLOWDOWN
AIR(HUMID)
19
HRSG 24
STACK GASSTEAM
TURBINE
COLD REHEAT
HP STEAM
IP STEAM
LP STEAM
SPRAY WATER
STEAMTO GASIFIER(4) & GT(21)
BLOWDOWN
EVAPORATION
BLOWDOWN
COOLINGWATERSYSTEM
MAKEUP WATER
MAKEUP WATER
MAKEUPWATER TO
HUMIDIFIER
MAKEUPWATER TO
ASH HANDLING
RAWWATER
33
34
35
5
37
3639
38
22
27
AIR(HUMID)
SYNGAS TO COAL DRYER26
18
CWS
CWR
AWATER
LOST TOSHIFT
BWATER
LOST TOHYDROLYSIS
H2COMBUSTION
C
H2COMBUSTION
D
CONDENSATE
[Water Flow, gpm]
[44.0]
[29.9] [70.8]
[14.1]
[102.8]
[32.9]
[53.6]
[69.9]
[31.3]
[603.3]
[64.3]
[50.2]
[17.1]
[1.6]
[62.7]
[60.2]
[2.5]
[9.5]
[102.8]
[3492]
[221.7]
[3042]
[763]
[125.2]
[9.2]
[2289]
[3.9]
[90.7]
[50.2]
[40.5]
[0.0]
[0.3]
[2.3]
[0.0]
[1160]
[214.5]
[45.1]
[674.6]
[83.6]
[331.5]
[9.5]
[221.7]
[0.7]
[13.7]
[16.9]
[115.9]
[27.5]
[674.6]
.
.
STACK GAS
BFW

Power Plant Water Usage and Loss Study
50 August 2005
Table 5-6 shows the water balance around the gasification island.
Table 5-6 Shell IGCC Water Balance Around Gasification Island
Water In Water Out No Location Flow (gpm) No Location Flow (gpm)1 Moisture in coal 44.0 2 Coal drying moisture 29.94 Steam 70.8 A Water Lost in Gasification Shift 53.65 Raw water to ash handling 102.8 6 Ash Handling Blowdown 69.919 From Humidifier Blowdown 9.5 7 Water with Slag 32.9
D Syngas combustion of H2 in Incinerator 16.9 B Water loss in COS Hydrolysis 1.6
27 Combustion air for incinerator 0.7 16 Syngas to Humidification 2.3 27 Incinerator flue gas 13.7 31 Sour water blowdown 40.5 245 245
Table 5-7 shows the water balance around the power island. A major portion of the water in the flue gas is from the combustion of hydrogen in the syngas produced during gasification, shift and COS hydrolysis.
Table 5-7 Shell IGCC Water Balance Around Power Island
Water In Water Out No Location Flow (gpm) No Location Flow (gpm)16 Syngas to Humidification 2.3 19 Humidification blowdown 9.518 Humidifier makeup water 221.7 23 GT Flue gas 674.621 GT Diluent Steam 45.1 C Syngas Combustion of H2 in GT 331.5 22 Combustion air for GT 83.6
684 684
Table 5-8 shows the water balance around the cooling water system. The wet cooling tower accounts for the majority of the water used in this section.
Table 5-8 Shell IGCC Water Balance Around Cooling Water System
Water In Water Out No Location Flow (gpm) No Location Flow (gpm)33 Raw Water 3,491 5 Raw water to ash handling 102.8
4 Steam to Gasifier 70.8 21 GT Diluent Steam 45.1 18 Humidifier makeup water 221.7 37 Cooling tower blowdown 762.5 36 Cooling tower evaporation 2,289 3,491 3,491

Power Plant Water Usage and Loss Study
51 August 2005
5.4 RAW WATER USAGE
The raw water usage as calculated in this study represents the total amount of water to be supplied from local water resources to provide for the needs of the plant. The amount differs from the total water losses, or the totals appearing in the Overall Water Balance. The difference is attributable to water contributed to the balance via humid air intake to the process, water content of the fuel, and water produced in gasification/combustion. For example, the raw water usage to the cooling tower is calculated as the raw water makeup delivered directly to the cooling tower while the cooling tower loss calculation includes water recycled from other sources. The raw water usage for each power plant can be the determining factor for siting and permitting, as it identifies the impact of the plant on local water availability. Table 5-9 shows the raw water for the plant and the usage through branch streams required to supplement process losses and flue gas losses.
Table 5-9 Shell IGCC Raw Water Usage
Water In Water Usage
No Location Flow (gpm)
gal/ MWh No Location Flow
(gpm)gal/
MWh 33 Raw Water 3,492 390 5 Makeup water to ash handling 102.8 11.5
18 Makeup to Humidifier 221.7 24.7 34 Makeup to Cooling Tower 3,042 339.6 35 Makeup to Condenser 125.2 14 3,492 390 3,492 390

Power Plant Water Usage and Loss Study
52 August 2005
6. WATER LOSS ANALYSIS OF A NATURAL GAS COMBINED CYCLE PLANT
The study design goal was to track the water flows and usages for all the major sections of the plant. Since essentially all fuel-bound hydrogen ends up as water, hydrogen was also tracked for each plant and major process area. An overall water balance and a water balance for each major plant section was then generated.
This design is based on the use of two natural gas-fired combustion turbines, each coupled with a heat recovery steam generator (HRSG) to generate steam for a single steam turbine generator. The plant configuration reflects current information and design preferences, the availability of newer combustion and steam turbines, and the relative latitude of a greenfield site.
This rendition of combustion turbine/HRSG technology is based on selection of gas turbines exemplified by the General Electric 7FA machine. This particular machine provides power output, airflow, and exhaust gas temperature that effectively couple with a HRSG to generate steam for the companion steam cycle plant to produce a total net output of approximately 535 MWe, at an efficiency of 55.4 percent (LHV) and 49.9 percent (HHV). For this study, two gas turbines are used in conjunction with one 1800 psig/1050°F/1050°F steam turbine. Overall performance for the entire plant is summarized in Table 6-1, which includes auxiliary power requirements.

Power Plant Water Usage and Loss Study
53 August 2005
Table 6-1 Two 7FA x One NGCC
Plant Performance Summary - 100 Percent Load
STEAM CYCLE Throttle Pressure, psig Throttle Temperature, °F Reheat Outlet Temperature, °F
1,800 1,050 1,050
GROSS POWER SUMMARY, kWe Gas Turbine Power Steam Turbine Power Gross Plant Power (Note 1)
343,400 191,235 534,635
AUXILIARY LOAD SUMMARY, kWe Condensate Pumps High Pressure Boiler Feed Pump Miscellaneous Balance of Plant (Note 2) Gas Turbine Auxiliaries Steam Turbine Auxiliaries Circulating Water Pumps Cooling Tower Fans Transformer Loss Total Auxiliary Power Requirement
330
2,240 500 600 200
2,810 1,600 1,650 9,930
NET PLANT POWER, kWe 524,705 PLANT EFFICIENCY, kWe Net Efficiency, % LHV Net Heat Rate, Btu/kWh (LHV) Net Efficiency, % HHV Net Heat Rate, Btu/kWh (HHV)
55.4
6,165 49.9
6,841 CONDENSER COOLING DUTY, 106 Btu/h 1,060 CONSUMABLES Natural Gas, lb/h (Note 3)
164,488
Note 1 – Loads are presented for two gas turbines, and one steam turbine. Note 2 – Includes plant control systems, lighting, HVAC, etc. Note 3 – Heating value: 19,666 Btu/lb (LHV), 21,824 Btu/lb (HHV).

Power Plant Water Usage and Loss Study
54 August 2005
6.1 HEAT AND MATERIAL BALANCE
The CT, or gas turbine, generator selected for this application is based on the General Electric 7FA model. This machine is an axial flow, constant speed unit, with variable inlet guide vanes. Each CT operates in an open cycle mode. Two 7FAs, each equipped with an individual HRSG, are used to power a single steam turbine in a traditional 2 on 1 arrangement. Pressurized pipeline natural gas is combusted in several parallel dry low- NOX combustors that use staged combustion to limit NOX formation.
High-temperature flue gas exiting the CT is conveyed through a HRSG (one for each turbine) to recover the large quantity of thermal energy that remains. The HRSG is configured with high-pressure (HP), intermediate-pressure (IP), and LP steam drums and circuitry. The HP drum is supplied with feedwater by the HP boiler feed pump while the IP drum is supplied with feedwater from an interstage bleed on the HP boiler feed pump. IP steam from the drum is mixed with cold reheat steam; the combined flow is then passed to the reheat section. The LP drum produces steam for superheat as well as saturated steam for an integral deaerator.
The Rankine cycle used in this case is based on a state-of-the-art 1800 psig/1050°F/1050°F single reheat configuration. The steam turbine is a single machine consisting of tandem high-pressure (HP), intermediate-pressure (IP), and double-flow low-pressure (LP) turbine sections connected via a common shaft and driving a 3600 rpm hydrogen-cooled generator. The HP and IP sections are contained in a single-span, opposed-flow casing, with the double-flow LP section in a separate casing.
Figure 6-1 is a modified block flow diagram for the overall plant with individual streams identified. Table 6-2 follows the figure with detailed composition and state points for the numbered streams.
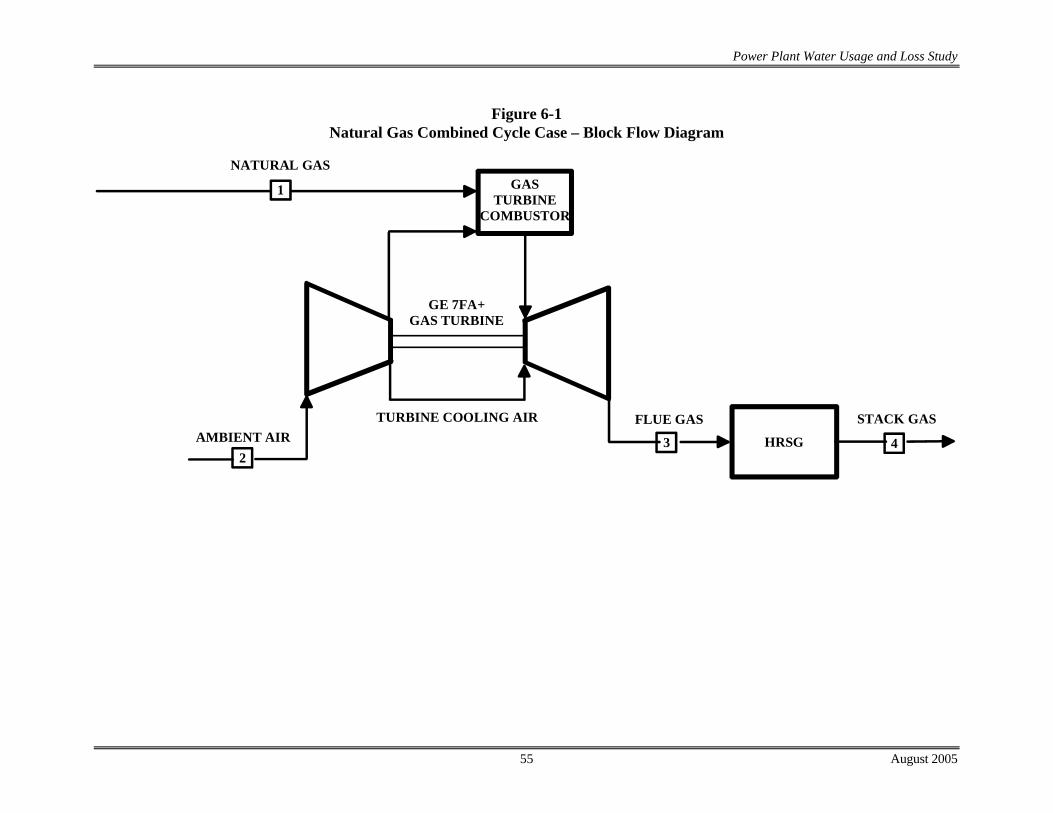
Power Plant Water Usage and Loss Study
55 August 2005
Figure 6-1 Natural Gas Combined Cycle Case – Block Flow Diagram
4HRSG
GE 7FA+GAS TURBINE
AMBIENT AIRTURBINE COOLING AIR FLUE GAS STACK GAS
NATURAL GAS
1
3
GASTURBINE
COMBUSTOR
2

Power Plant Water Usage and Loss Study
56 August 2005
Table 6-2 Natural Gas Combined Cycle Stream Table
1 2 3 4V-L Mole Fraction
Ar 0.0000 0.0094 0.0090 0.0090C2H6 0.0500 0.0000 0.0000 0.0000CH4 0.9000 0.0000 0.0000 0.0000CO 0.0000 0.0000 0.0000 0.0000CO2 0.0000 0.0003 0.0377 0.0377H2O 0.0000 0.0108 0.0834 0.0834N2 0.0500 0.7719 0.7442 0.7442O2 0.0000 0.2076 0.1257 0.1257
Total 1.0000 1.0000 1.0000 1.0000
V-L Flowrate (lbmol/hr) 9,485 243,581 253,303 253,303V-L Flowrate (lb/hr) 164,488 7,027,200 7,191,690 7,191,690
Temperature (°F) 59 59 300 281Pressure (psia) 14.7 14.7 14.1 14.1

Power Plant Water Usage and Loss Study
57 August 2005
6.2 EMISSIONS PERFORMANCE
The operation of the modern, state-of-the-art gas turbine fueled by natural gas, coupled to a HRSG, is projected to result in very low levels of SO2, NOX, and CO2 emissions. A summary of the estimated plant emissions for this case is presented in Table 6-3.
Table 6-3 Airborne Emissions
Two 7FA x One NGCC
lb/106 Btu tons/year 80% capacity lb/MWh
SO2 negligible negligible negligible NOX 0.023 287 0.156 Particulates 0.008 98 0.053 CO2 117 1,472,000 801
As shown in the table, values of SO2 emission are negligible. This is a direct consequence of using natural gas as the plant fuel supply. Pipeline natural gas contains minor amounts of reduced sulfur species that produce negligible SO2 emissions when combusted and diluted with a large amount of air.
As for particulate discharge, when natural gas is properly combusted in a state-of-the-art CT, the amount of solid particulate produced is very small (less than 20 lb/hour for both 7FA machines).
The low level of NOX production is achieved through use of GE’s dry low- NOX (DLN) combustion system. It is assumed that NOX emissions are further limited to 5 ppmvd in the flue gas (normalized to 15 percent O2) by the application of combustion turbine firing based on the DOE/GE development programs to lower NOX emissions to single digits. A selective catalytic reduction (SCR) process is not required.
CO2 emissions are about 60% of the amount from coal-burning facilities on an intensive basis (1b/106 Btu), since natural gas contains about 60% as much carbon as coal on a 1b/106 Btu basis. However, total CO2 emissions are more than 50% lower than those from a coal plant with this capacity due to the relatively high thermal efficiency.
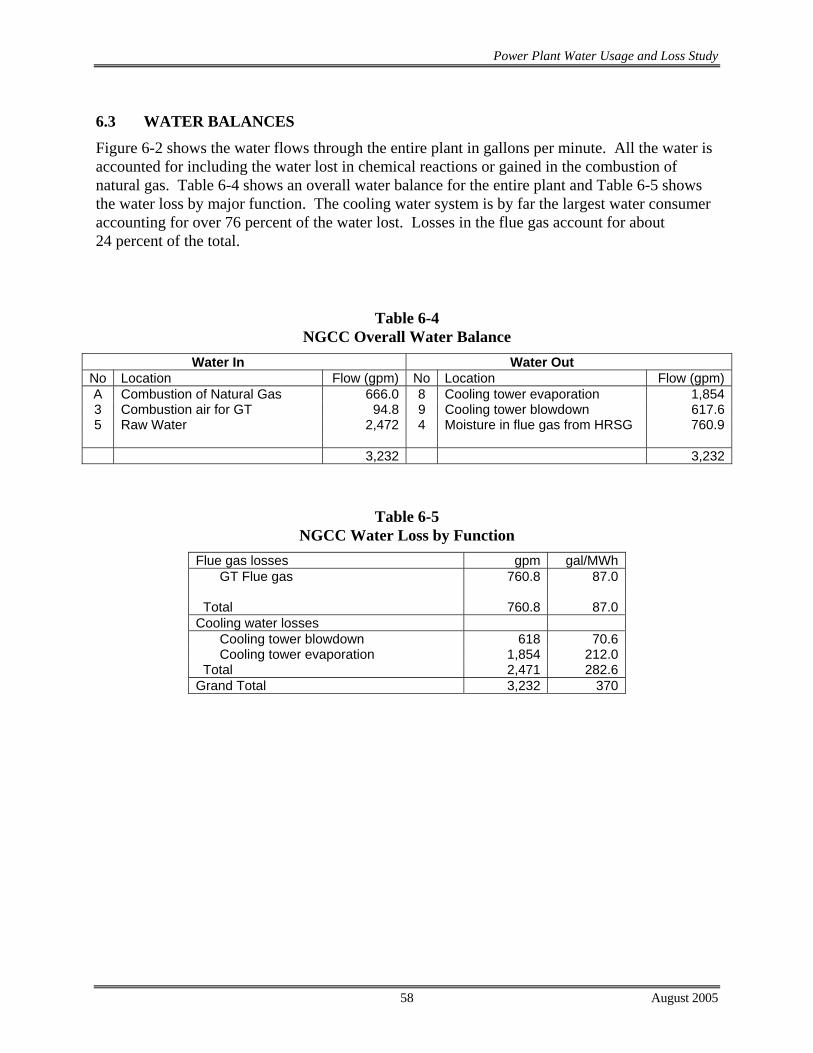
Power Plant Water Usage and Loss Study
58 August 2005
6.3 WATER BALANCES
Figure 6-2 shows the water flows through the entire plant in gallons per minute. All the water is accounted for including the water lost in chemical reactions or gained in the combustion of natural gas. Table 6-4 shows an overall water balance for the entire plant and Table 6-5 shows the water loss by major function. The cooling water system is by far the largest water consumer accounting for over 76 percent of the water lost. Losses in the flue gas account for about 24 percent of the total.
Table 6-4 NGCC Overall Water Balance
Water In Water Out No Location Flow (gpm) No Location Flow (gpm)A Combustion of Natural Gas 666.0 8 Cooling tower evaporation 1,8543 Combustion air for GT 94.8 9 Cooling tower blowdown 617.65 Raw Water 2,472 4 Moisture in flue gas from HRSG 760.9 3,232 3,232
Table 6-5 NGCC Water Loss by Function
Flue gas losses gpm gal/MWh GT Flue gas 760.8 87.0 Total 760.8 87.0 Cooling water losses Cooling tower blowdown 618 70.6 Cooling tower evaporation 1,854 212.0 Total 2,471 282.6 Grand Total 3,232 370

Power Plant Water Usage and Loss Study
59 August 2005
Figure 6-2 NGCC Case – Block Flow Diagram – Water Flows in Gallons per Minute
GASTURBINE1 3
CONDENSATE&
DEAERATION
WATERTREATING
AIR(HUMID)
HRSG 4
STACK GASSTEAM
TURBINE
COLD REHEAT
HP STEAM
IP STEAM
LP STEAM
BLOWDOWN
EVAPORATION
BLOWDOWN
COOLINGWATERSYSTEM
MAKEUP WATER
MAKEUP WATER
RAWWATER
5
6
7
9
8
10
2
CWS
CWR
H2COMBUSTION
A
CONDENSATE
[Water Flow, gpm]
[0.0] [760.8]
[94.8]
[666.0]
.
BFW
[2472]
[2455][1854]
[618]
[16.9]
[760.8]
[16.9]

Power Plant Water Usage and Loss Study
60 August 2005
Table 6-6 shows the water balance around the gas turbine island. A major portion of the water in the flue gas is from the combustion of the natural gas.
Table 6-6 NGCC Water Balance Around Gas Turbine Island
Water In Water Out No Location Flow (gpm) No Location Flow (gpm)A Combustion of Natural Gas 666.0 4 Moisture in flue gas from HRSG 760.93 Combustion air for GT 94.8 761 761
Table 6-7 shows the water balance around the cooling water system. The wet cooling tower accounts for the majority of the water used in this section.
Table 6-7 NGCC Water Balance Around Cooling Water System
Water In Water Out No Location Flow (gpm) No Location Flow (gpm)5 Raw Water 2,472 8 Cooling tower evaporation 1,854 9 Cooling tower blowdown 618 2,472 2,472
6.4 RAW WATER USAGE
The raw water usage as calculated in this study represents the total amount of water to be supplied from local water resources to provide for the needs of the plant. The amount differs from the total water losses, or the totals appearing in the Overall Water Balance. The difference is attributable to water contributed to the balance via humid air intake to the process, water content of the fuel, and water produced in gasification/combustion. For example, the raw water usage to the cooling tower is calculated as the raw water makeup delivered directly to the cooling tower while the cooling tower loss calculation includes water recycled from other sources. The raw water usage for each power plant can be the determining factor for siting and permitting, as it identifies the impact of the plant on local water availability. Table 6-8 shows the raw water for the plant and the usage through branch streams required to supplement process losses and flue gas losses.
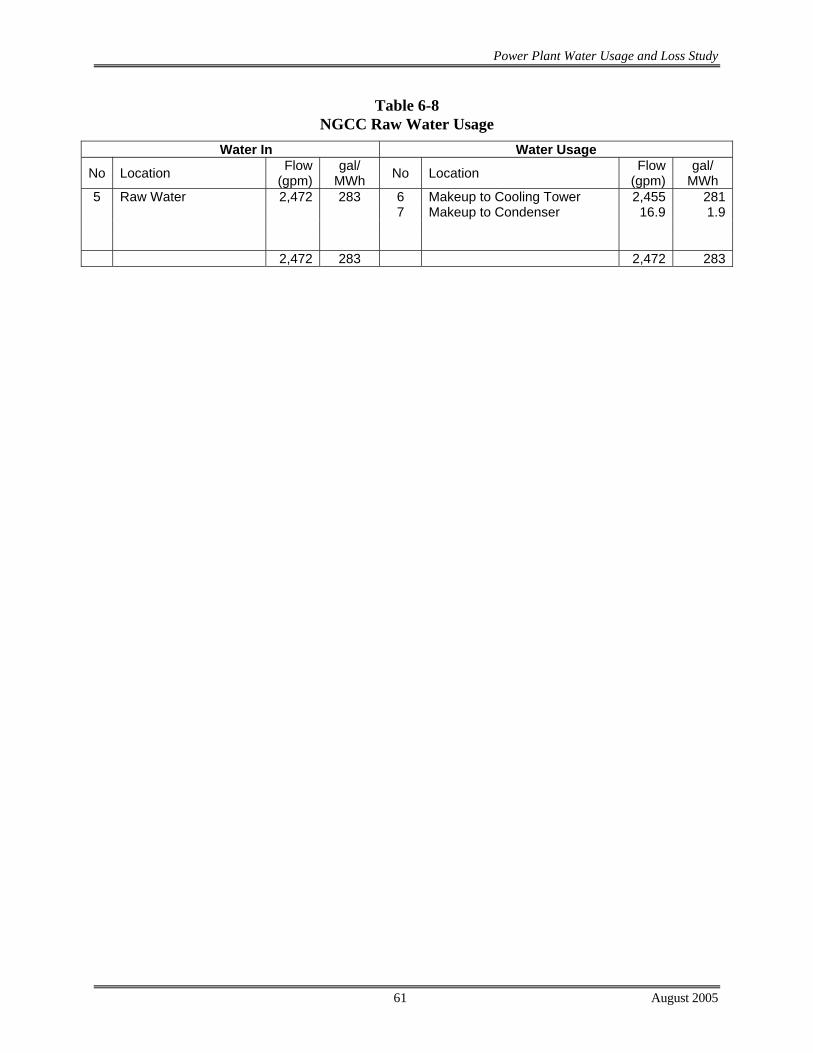
Power Plant Water Usage and Loss Study
61 August 2005
Table 6-8 NGCC Raw Water Usage
Water In Water Usage
No Location Flow (gpm)
gal/ MWh No Location Flow
(gpm)gal/
MWh 5 Raw Water 2,472 283 6 Makeup to Cooling Tower 2,455 281 7 Makeup to Condenser 16.9 1.9 2,472 283 2,472 283

Power Plant Water Usage and Loss Study
62 August 2005
7. WATER LOSS ANALYSIS OF A SUBCRITICAL PULVERIZED COAL PLANT
The study design goal was to track the water flows and usages for all the major sections of the plant. Since essentially all fuel-bound hydrogen ends up as water, hydrogen was also tracked for each plant and major process area. An overall water balance and a water balance for each major plant section was then generated.
The design basis of this pulverized coal plant is a nominal 500 MW subcritical cycle. Support facilities are all encompassing, including rail spur (within the plant fence line), coal handling, (including receiving, crushing, storing, and drying), limestone handling (including receiving, crushing, storing, and feeding), solid waste disposal, flue gas desulfurization, wastewater treatment and equipment necessary for an efficient, available, and completely operable facility. The plant is designed using components suitable for a 30-year life, with provision for periodic maintenance and replacement of critical parts.
The subcritical design uses a 2400 psig/1000°F/1050°F single reheat steam power cycle. The steam generator is a natural circulation, wall-fired, subcritical unit arranged with a water-cooled dry-bottom furnace, superheater, reheater, economizer, and air heater components. There are three rows of six burners per each of two walls.
The resulting plant produces a net output of 521 MWe at a net efficiency of 35.4 percent on an HHV basis. Performance is based on the properties of Pittsburgh No. 8 coal, described in the plant design basis. Overall performance for the entire plant is summarized in Table 7-1, which includes auxiliary power requirements.
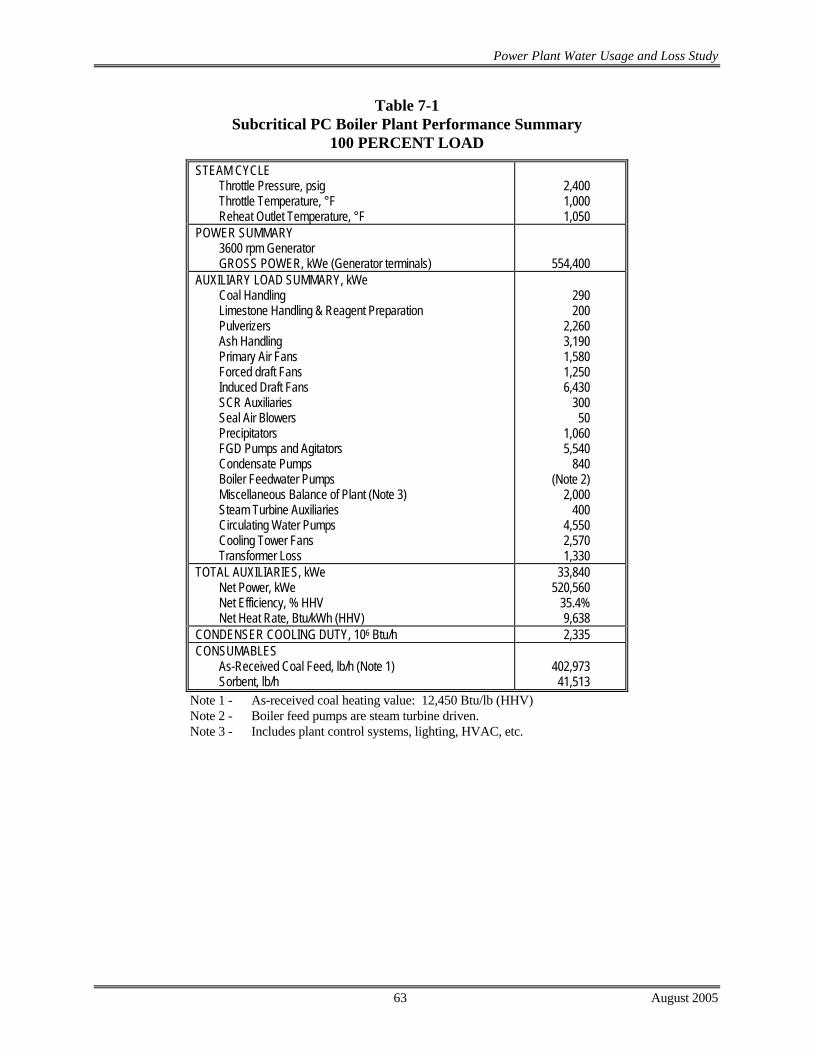
Power Plant Water Usage and Loss Study
63 August 2005
Table 7-1 Subcritical PC Boiler Plant Performance Summary
100 PERCENT LOAD
STEAM CYCLE Throttle Pressure, psig Throttle Temperature, °F Reheat Outlet Temperature, °F
2,400 1,000 1,050
POWER SUMMARY 3600 rpm Generator GROSS POWER, kWe (Generator terminals)
554,400 AUXILIARY LOAD SUMMARY, kWe Coal Handling
Limestone Handling & Reagent Preparation Pulverizers Ash Handling Primary Air Fans Forced draft Fans Induced Draft Fans SCR Auxiliaries Seal Air Blowers Precipitators FGD Pumps and Agitators Condensate Pumps Boiler Feedwater Pumps Miscellaneous Balance of Plant (Note 3)
Steam Turbine Auxiliaries Circulating Water Pumps Cooling Tower Fans Transformer Loss
290 200
2,260 3,190 1,580 1,250 6,430
300 50
1,060 5,540
840 (Note 2)
2,000 400
4,550 2,570 1,330
TOTAL AUXILIARIES, kWe Net Power, kWe Net Efficiency, % HHV Net Heat Rate, Btu/kWh (HHV)
33,840 520,560
35.4% 9,638
CONDENSER COOLING DUTY, 106 Btu/h 2,335 CONSUMABLES As-Received Coal Feed, lb/h (Note 1) Sorbent, lb/h
402,973 41,513
Note 1 - As-received coal heating value: 12,450 Btu/lb (HHV) Note 2 - Boiler feed pumps are steam turbine driven. Note 3 - Includes plant control systems, lighting, HVAC, etc.

Power Plant Water Usage and Loss Study
64 August 2005
7.1 HEAT AND MATERIAL BALANCE
The plant uses a 2400 psig/1000°F/1050°F single reheat steam power cycle. The high-pressure (HP) turbine uses steam at 2415 psia and 1000°F. The cold reheat steam flow is reheated to 1050°F before entering the intermediate-pressure (IP) turbine section. Tandem HP, IP, and low-pressure (LP) turbines drive one 3600 rpm hydrogen-cooled generator. The LP turbines consist of two condensing turbine sections.
The feedwater train consists of six closed feedwater heaters (four LP and two HP), and one open feedwater heater (deaerator). Extractions for feedwater heating, deaerating, and the boiler feed pump are taken from all of the turbine cylinders.
The net plant power output, after plant auxiliary power requirements are deducted, is nominally 521 MWe. The overall plant efficiency is 35.4 percent.
The major features of this plant include the following:
• Boiler feed pumps are steam turbine driven.
• Turbine configuration is a 3600 rpm tandem compound, four-flow exhaust.
• Plant has six stages of closed feedwater heaters plus a deaerator.
Figure 7-1 is a modified block flow diagram for the overall plant with individual streams identified. Table 7-2 follows the figure with detailed composition and state points for the numbered streams.

Power Plant Water Usage and Loss Study
65 August 2005
Figure 7-1 Subcritical PC Boiler Case – Block Flow Diagram
PC BOILER(W/ SCR)
WET LIMESTONE
FGD
ESP &ID FANS
3
4
6
10
1
FLUE GAS TO STACK
ASH
COAL
2
AIR
5
FLY ASH
8AIR 9
SLURRY
GYPSUM
7
WATER

Power Plant Water Usage and Loss Study
66 August 2005
Table 7-2 Subcritical PC Boiler Stream Table
1 2 3 4 5 6 7 8 9 10Mole Frac
Ar 0.0000 0.0094 0.0000 0.0090 0.0000 0.0090 0.0000 0.0094 0.0000 0.0084CO2 0.0000 0.0003 0.0000 0.1320 0.0000 0.1320 0.0000 0.0003 0.0000 0.1238H2O 0.0000 0.0104 0.0000 0.0690 0.0000 0.0690 1.0000 0.0104 1.0000 0.1350O2 0.0000 0.2077 0.0000 0.0445 0.0000 0.0445 0.0000 0.2077 0.0000 0.0414SO2 0.0000 0.0000 0.0000 0.0021 0.0000 0.0021 0.0000 0.0000 0.0000 0.0001N2 0.0000 0.7722 0.0000 0.7433 0.0000 0.7433 0.0000 0.7722 0.0000 0.6913
Total V-L Flow (lbmol/hr) 0 169,157 0 168,160 0 175,959 8,428 1,048 5,377 190,380
Total V-L Flow (lb/hr) 0 4,880,923 0 4,983,410 0 5,242,740 151,831 30,233 96,863 5,504,770
SolidsCoal (lb/hr) 402,973 0 0 0 0 0 0 0 0 0Ash (lb/hr) 0 0 8,231 32,925 32,925 0 0 0 0 0Limestone (lb/hr) 0 0 0 0 0 0 0 0 41,513 0
Temperature (°F) 59 59 300 281 280 343 59 59 100 131Pressure (psia) 14.7 14.7 14.1 14.1 14.1 17.7 20.0 14.7 20.0 14.7

Power Plant Water Usage and Loss Study
67 August 2005
7.2 EMISSIONS PERFORMANCE
The 1990 CAAA imposed a two-phase capping of SO2 emissions on a nationwide basis. For a new greenfield plant, the reduction of SO2 emissions that would be required depends on the availability of SO2 allowances to the utility, and on local site conditions. In many cases, Prevention of Significant Deterioration (PSD) Regulations will apply, requiring that Best Available Control Technology (BACT) be used. BACT is applied separately for each site, and results in different values for varying sites. In general, the emission limits set by BACT will be significantly lower than NSPS limits. The ranges specified in Table 7-3 will cover most cases. For this study, plant emissions are capped at values shown in Table 7-4.
Table 7-3 Emission Limits Set by BACT
SO2 92 to 95 percent removal
NOX 0.1 to 0.45 lb/106 Btu
Particulates 0.015 to 0.03 lb/106 Btu
Opacity 10 to 20 percent
Source: DOE/FE-0400 MARKET-BASED ADVANCED COAL POWER SYSTEMS FINAL REPORT MAY 1999
Table 7-4 Airborne Emissions
Subcritical PC Boiler
lb/106 Btu tons/year 80% capacity lb/MWh
SO2 0.232 4,081 2.240 NOX 0.100 1,758 0.964 Particulates 0.024 421 0.231 CO2 204 3,591,000 1,966
The low level of SO2 in the plant emissions is achieved by capture of the sulfur in the wet limestone forced oxidation FGD system. The nominal overall design basis SO2 removal rate is set at 95 percent.
The minimization of NOX production and subsequent emission is achieved by a combination of low- NOX burners, overfire air staging, and selective catalytic reduction (SCR). The low- NOX burners utilize zoning and staging of combustion. Overfire air staging is employed in the design of this boiler. SCR utilizes the injection of ammonia and a catalyst to reduce the NOX emissions.
Particulate discharge to the atmosphere is reduced by the use of a modern electrostatic precipitator, which provides a particulate removal rate of 99.7 percent.

Power Plant Water Usage and Loss Study
68 August 2005
CO2 emissions are equal to those of other coal-burning facilities on an intensive basis (lb/MMBtu), since a similar fuel is used.
7.3 WATER BALANCES
Figure 7-2 shows the water flows through the entire plant in gallons per minute. All the water is accounted for including the water lost in chemical reactions or gained in the combustion of coal. Table 7-5 shows an overall water balance for the entire plant and Table 7-6 shows the water loss by major function. The cooling water system is by far the largest water consumer accounting for nearly 84 percent of the water lost. Losses in the flue gas and FGD system account for 16 percent of the total.
Table 7-5 Subcritical PC Boiler Overall Water Balance
Water In Water Out No Location Flow (gpm) No Location Flow (gpm)1 Moisture in coal 48.3 11 PC Boiler flue gas 928.42 Coal Combustion of H2 in Boiler 325.5 12 Water with gypsum 80.73 Combustion air for PC Boiler 63.4 17 Cooling tower evaporation 3,8918 Oxidation air for FGD 0.4 18 Cooling tower blowdown 1,29713 Raw Water 5,759
6,197 6,197
Table 7-6 Subcritical PC Boiler Water Loss by Function
FGD losses gpm gal/MWh Water with Gypsum 80.7 9.3 Total 81 9 Flue gas losses PC boiler Flue gas 928.4 107.0 Total 928 107 Cooling water losses Cooling tower blowdown 1,297 149.5 Cooling tower evaporation 3,891 448.5 Total 5,188 598.0 Grand Total 6,197 714.3

Power Plant Water Usage and Loss Study
69 August 2005
Figure 7-2 Subcritical PC Boiler Case – Block Flow Diagram – Water Flows in Gallons per Minute
.
PULVERIZED COAL
BOILER
SCR / AIR HEATER
ESP / ID FANS FGD
GYPSUM DEWATERING
LIMESTONESLURRY
PREPARATION
FGD WATER SYSTEM
STEAM TURBINE /FW HEATING CONDENSER
AIR
COAL
H2
(COMBUSTION)
3
1
2
5 6 7
AIR 8
11
9
WE
T G
YPS
UM
WATERWATERLIMESTONE
12 GYPSUM(30% WATER)
COOLING WATER SYSTEM
WATER TREATING
BO
ILE
R F
EE
DW
AT
ER
TH
RO
TT
LE
ST
EA
M
CO
LD
RE
HE
AT
STE
AM
BL
OW
DO
WN
RE
HE
AT
ST
EA
M4
L/P EXHAUST
CONDENSATE
COOLING WATER
COOLING WATER RETURN
17
EV
APO
RA
TIO
N
18
BL
OW
DO
WN
16
RAW WATER
14
13
COOLING WATER MAKEUP
15
ASH
CONDENSER MAKEUP
10SLURRY
(70% WATER)
[63.4]
[48.3]
[325.5]
[38.2]
[437.2] [437.2]
ASH
[437.2]
[0.4]
[193.6]
[928.4]
MA
KE
UP
[193.6]
[571.1]
[80.7][3891]
[5150]
[5759]
[38.2]
[1297]
[Water Flow, gpm]
.
.
.
PULVERIZED COAL
BOILER
SCR / AIR HEATER
ESP / ID FANS FGD
GYPSUM DEWATERING
LIMESTONESLURRY
PREPARATION
FGD WATER SYSTEM
STEAM TURBINE /FW HEATING CONDENSER
AIR
COAL
H2
(COMBUSTION)
3
1
2
5 6 7
AIR 8
11
9
WE
T G
YPS
UM
WATERWATERLIMESTONE
12 GYPSUM(30% WATER)
COOLING WATER SYSTEM
WATER TREATING
BO
ILE
R F
EE
DW
AT
ER
TH
RO
TT
LE
ST
EA
M
CO
LD
RE
HE
AT
STE
AM
BL
OW
DO
WN
RE
HE
AT
ST
EA
M4
L/P EXHAUST
CONDENSATE
COOLING WATER
COOLING WATER RETURN
17
EV
APO
RA
TIO
N
18
BL
OW
DO
WN
16
RAW WATER
14
13
COOLING WATER MAKEUP
15
ASH
CONDENSER MAKEUP
10SLURRY
(70% WATER)
[63.4]
[48.3]
[325.5]
[38.2]
[437.2] [437.2]
ASH
[437.2]
[0.4]
[193.6]
[928.4]
MA
KE
UP
[193.6]
[571.1]
[80.7][3891]
[5150]
[5759]
[38.2]
[1297]
[Water Flow, gpm]
.
.

Power Plant Water Usage and Loss Study
70 August 2005
Table 7-7 shows the water balance around the FGD island. Over half of the water that ends up in the flue gas is evaporated from the FGD system.
Table 7-7 Subcritical PC Boiler Water Balance Around FGD Island
Water In Water Out No Location Flow (gpm) No Location Flow (gpm)7 Moisture in flue gas 437.2 11 Moisture in flue gas 928.48 Oxidation air for FGD 0.4 12 Water in Gypsum 80.714 Makeup water 571.1
1,009 1,009
Table 7-8 shows the water balance around the cooling water system. Over 90 percent of the plant water losses occur here.
Table 7-8 Subcritical PC Boiler Water Balance Around Cooling Water System
Water In Water Out No Location Flow (gpm) No Location Flow (gpm)4 Steam blowdown 38.2 17 Cooling tower evaporation 3,89115 Cooling water Makeup 5,150 18 Cooling water blowdown 1,297
5,188 5,188
7.4 RAW WATER USAGE
The raw water usage as calculated in this study represents the total amount of water to be supplied from local water resources to provide for the needs of the plant. The amount differs from the total water losses, or the totals appearing in the Overall Water Balance. The difference is attributable to water contributed to the balance via humid air intake to the process, water content of the fuel, and water produced in gasification/combustion. For example, the raw water usage to the cooling tower is calculated as the raw water makeup delivered directly to the cooling tower while the cooling tower loss calculation includes water recycled from other sources. The raw water usage for each power plant can be the determining factor for siting and permitting, as it identifies the impact of the plant on local water availability. Table 7-9 shows the raw water for the plant and the usage through branch streams required to supplement process losses and flue gas losses.
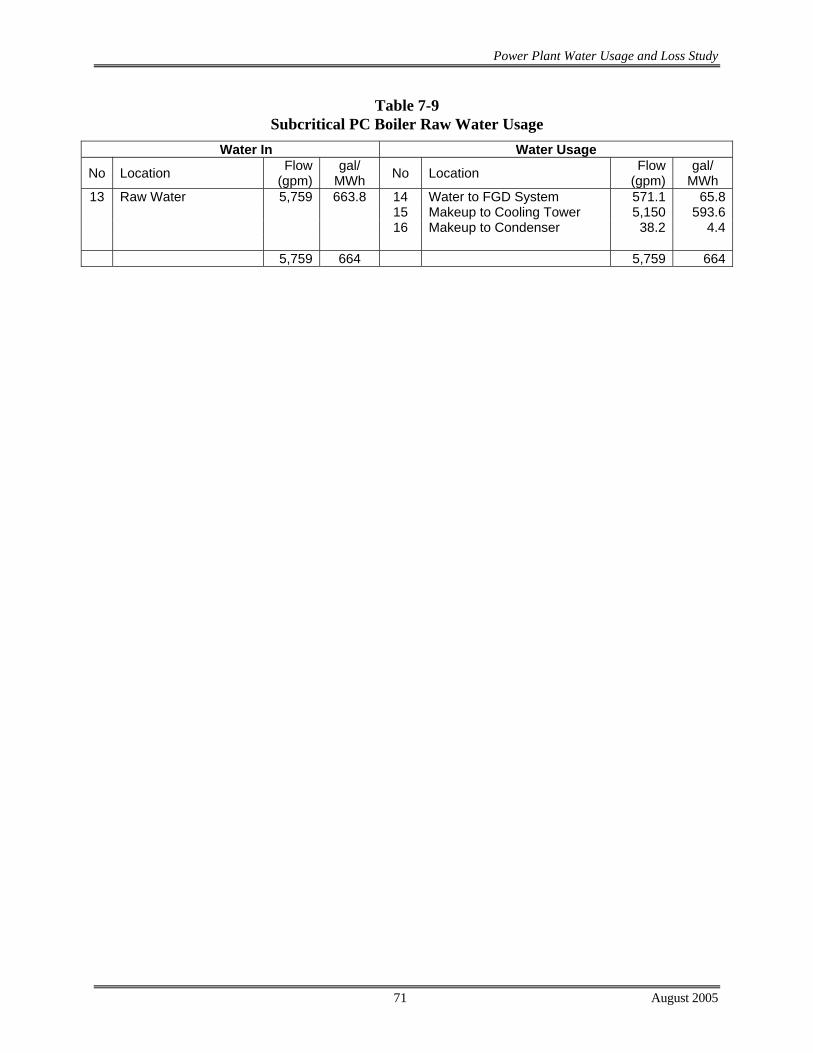
Power Plant Water Usage and Loss Study
71 August 2005
Table 7-9 Subcritical PC Boiler Raw Water Usage
Water In Water Usage
No Location Flow (gpm)
gal/ MWh No Location Flow
(gpm)gal/
MWh 13 Raw Water 5,759 663.8 14 Water to FGD System 571.1 65.8
15 Makeup to Cooling Tower 5,150 593.6 16 Makeup to Condenser 38.2 4.4 5,759 664 5,759 664
Power Plant Water Usage and Loss Study
72 August 2005
8. WATER LOSS ANALYSIS OF A SUPERCRITICAL PULVERIZED COAL PLANT
The study design goal was to track the water flows and usages for all the major sections of the plant. Since essentially all fuel-bound hydrogen ends up as water, hydrogen was also tracked for each plant and major process area. An overall water balance and a water balance for each major plant section was then generated.
The design basis of this pulverized coal plant is a nominal 500 MWe supercritical cycle. Support facilities are all encompassing, including rail spur (within the plant fence line), coal handling, (including receiving, crushing, storing, and drying), limestone handling (including receiving, crushing, storing, and feeding), solid waste disposal, flue gas desulfurization, wastewater treatment and equipment necessary for an efficient, available, and completely operable facility. The plant is designed using components suitable for a 30-year life, with provision for periodic maintenance and replacement of critical parts.
The steam cycle used for this supercritical case is based on a 3500 psig/1050°F/1050°F single reheat configuration. The turbine generator is a single machine comprised of tandem HP, IP, and LP turbines driving one 3,600 rpm hydrogen-cooled generator. The net plant output power, after plant auxiliary power requirements are deducted, is 518 MWe. The overall net plant efficiency is 39.9 percent. Overall performance for the entire plant is summarized in Table 8-1, which includes auxiliary power requirements.

Power Plant Water Usage and Loss Study
73 August 2005
Table 8-1 Supercritical PC Boiler Plant Performance Summary
100 Percent Load
STEAM CYCLE Throttle Pressure, psig Throttle Temperature, °F First Reheat Outlet Temperature, °F Second Reheat Outlet Temperature, °F
3,500 1,050 1,050 1,050
POWER SUMMARY Steam Turbine Power Generator Loss Total, kWe (Generator terminals)
558,190
-8,1900 550,000
AUXILIARY LOAD SUMMARY, kWe Coal Handling
Limestone Handling & Reagent Preparation Pulverizers Ash Handling Primary Air Fans Forced draft Fans Induced Draft Fans SCR Auxiliaries Seal Air Blowers Precipitators FGD Pumps and Agitators Condensate Pumps Boiler Feedwater Booster Pumps High Pressure Boiler Feed Pumps Miscellaneous Balance of Plant (Note 3)
Steam Turbine Auxiliaries Circulating Water Pumps Cooling Tower Fans Transformer Loss
420 180
2,000 1,800 1,380 1,090 3,960
100 50
1,000 4,900
690 3,600
(Note 2) 2,000
400 4,700 2,690 1,260
TOTAL AUXILIARIES, kWe Net Power, kWe Net Efficiency, % HHV Net Heat Rate, Btu/kWh (HHV)
32,220 517,780
39.8% 8,564
CONDENSER COOLING DUTY, 106 Btu/h 2,070 CONSUMABLES As-Received Coal Feed, lb/h (Note 1) Sorbent, lb/h
356,177 36,692
Note 1 - As-received coal heating value: 12,450 Btu/lb (HHV) Note 2 - Boiler feed pumps are steam turbine driven. Note 3 - Includes plant control systems, lighting, HVAC, etc.

Power Plant Water Usage and Loss Study
74 August 2005
8.1 HEAT AND MATERIAL BALANCE
The steam cycle used for this case is based on a 3500 psig/1050°F/1050°F single reheat configuration. The HP turbine uses steam at 3515 psia and 1050°F. The cold reheat flow is reheated to 1050°F before entering the IP turbine section.
The turbine generator is a single machine comprised of tandem HP, IP, and LP turbines driving one 3,600 rpm hydrogen-cooled generator. The feedwater train consists of seven closed feedwater heaters (four low pressure and three high pressure), and one open feedwater heater (deaerator). Extractions for feedwater heating, deaerating, and the boiler feed pump are taken from the HP, IP, and LP turbine cylinders, and from the cold reheat piping.
The net plant output power, after plant auxiliary power requirements are deducted, is nominally 518 MWe. The overall net plant efficiency is 39.8 percent.
The major features of this plant include the following:
• Boiler feed pumps are steam turbine driven.
Turbine configuration is a 3,600 rpm tandem compound, four-flow exhaust.
• Plant has seven stages of closed feedwater heaters plus a deaerator.
Figure 8-1 is a modified block flow diagram for the overall plant with individual streams identified. Table 8-2 follows the figure with detailed composition and state points for the numbered streams.
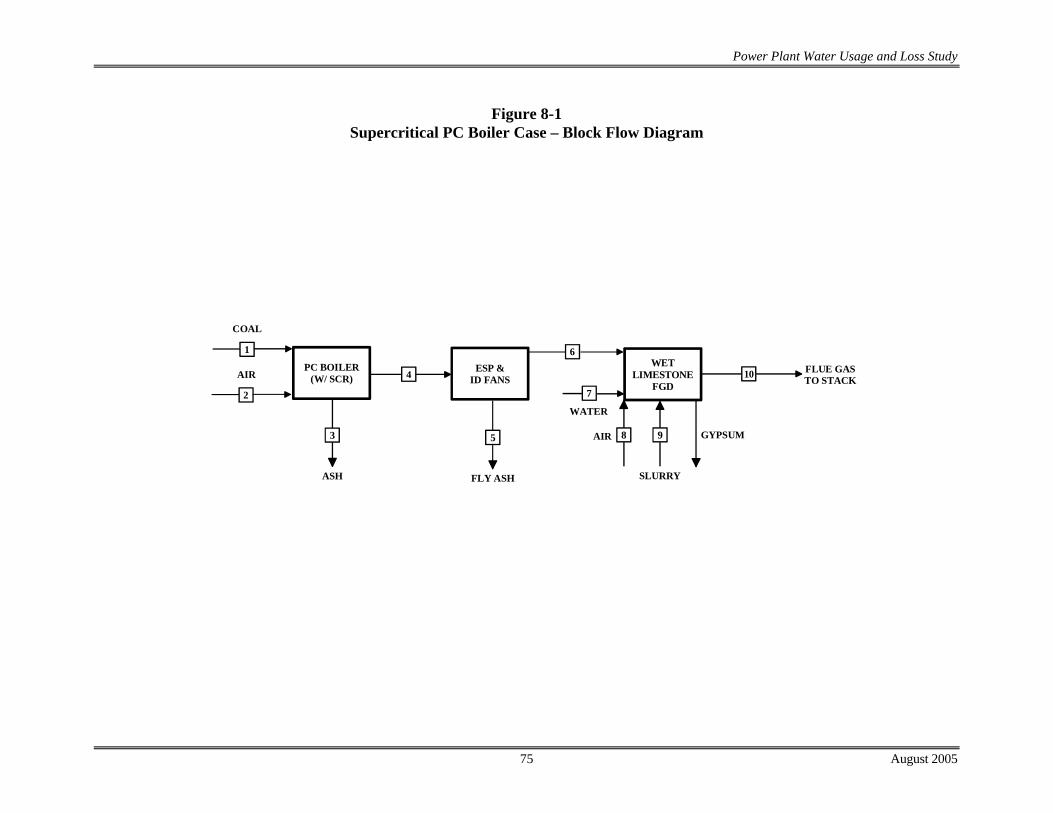
Power Plant Water Usage and Loss Study
75 August 2005
Figure 8-1 Supercritical PC Boiler Case – Block Flow Diagram
PC BOILER(W/ SCR)
WET LIMESTONE
FGD
ESP &ID FANS
3
4
6
10
1
FLUE GAS TO STACK
ASH
COAL
2
AIR
5
FLY ASH
8AIR 9
SLURRY
GYPSUM
7
WATER
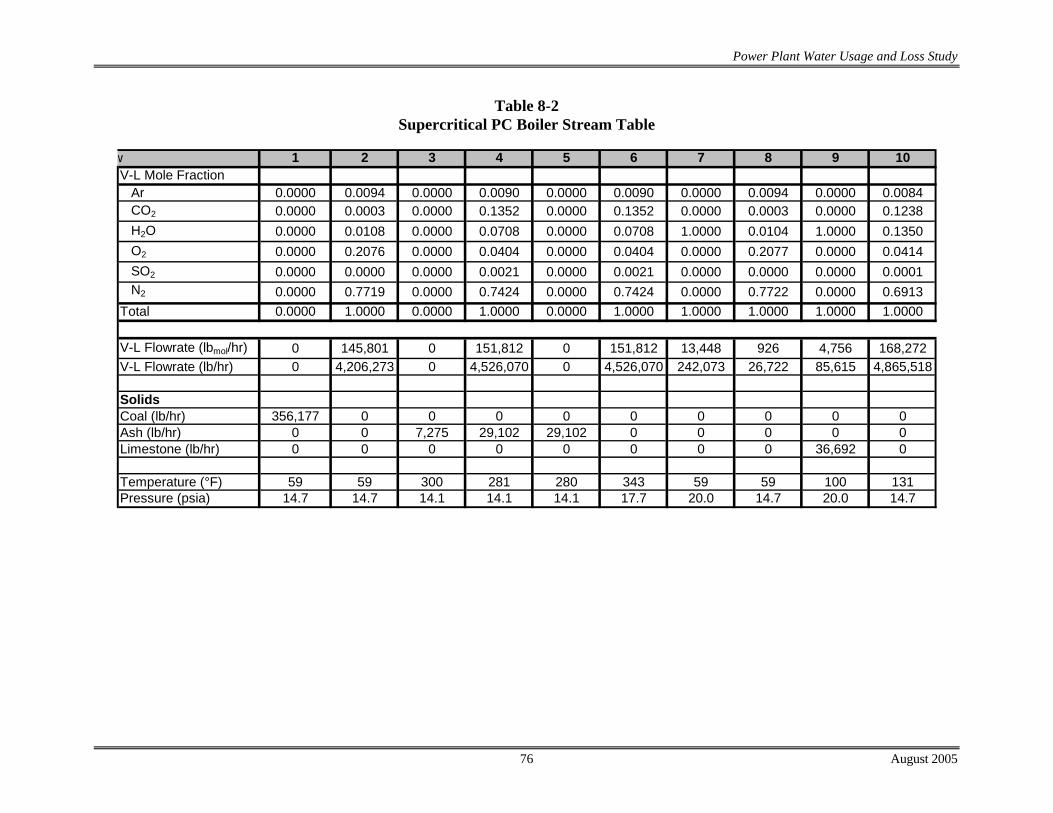
Power Plant Water Usage and Loss Study
76 August 2005
Table 8-2 Supercritical PC Boiler Stream Table
w 1 2 3 4 5 6 7 8 9 10V-L Mole Fraction
Ar 0.0000 0.0094 0.0000 0.0090 0.0000 0.0090 0.0000 0.0094 0.0000 0.0084CO2 0.0000 0.0003 0.0000 0.1352 0.0000 0.1352 0.0000 0.0003 0.0000 0.1238H2O 0.0000 0.0108 0.0000 0.0708 0.0000 0.0708 1.0000 0.0104 1.0000 0.1350O2 0.0000 0.2076 0.0000 0.0404 0.0000 0.0404 0.0000 0.2077 0.0000 0.0414SO2 0.0000 0.0000 0.0000 0.0021 0.0000 0.0021 0.0000 0.0000 0.0000 0.0001N2 0.0000 0.7719 0.0000 0.7424 0.0000 0.7424 0.0000 0.7722 0.0000 0.6913
Total 0.0000 1.0000 0.0000 1.0000 0.0000 1.0000 1.0000 1.0000 1.0000 1.0000
V-L Flowrate (lbmol/hr) 0 145,801 0 151,812 0 151,812 13,448 926 4,756 168,272V-L Flowrate (lb/hr) 0 4,206,273 0 4,526,070 0 4,526,070 242,073 26,722 85,615 4,865,518
SolidsCoal (lb/hr) 356,177 0 0 0 0 0 0 0 0 0Ash (lb/hr) 0 0 7,275 29,102 29,102 0 0 0 0 0Limestone (lb/hr) 0 0 0 0 0 0 0 0 36,692 0
Temperature (°F) 59 59 300 281 280 343 59 59 100 131Pressure (psia) 14.7 14.7 14.1 14.1 14.1 17.7 20.0 14.7 20.0 14.7

Power Plant Water Usage and Loss Study
77 August 2005
8.2 EMISSIONS PERFORMANCE
The 1990 CAAA imposed a two-phase capping of SO2 emissions on a nationwide basis. For a new greenfield plant, the reduction of SO2 emissions that would be required depends on the availability of SO2 allowances to the utility, and on local site conditions. In many cases, Prevention of Significant Deterioration (PSD) Regulations will apply, requiring that Best Available Control Technology (BACT) be used. BACT is applied separately for each site, and results in different values for varying sites. In general, the emission limits set by BACT will be significantly lower than NSPS limits. The ranges specified in Table 8-3 will cover most cases. For this study, plant emissions are capped at values shown in Table 8-4.
Table 8-3 Emission Limits Set by BACT
SOX 92 to 95 percent removal
NOX 0.2 to 0.45 lb/106 Btu
Particulates 0.015 to 0.03 lb/106 Btu
Opacity 10 to 20 percent
Source: DOE/FE-0400 MARKET-BASED ADVANCED COAL POWER SYSTEMS FINAL REPORT MAY 1999
Table 8-4 Airborne Emissions
Subcritical PC
lb/106 Btu tons/year 80% capacity lb/MWh
SO2 0.232 3,607 1.872 NOX 0.100 1,554 0.806 Particulates 0.024 372 0.193 CO2 207 3,212,000 1,667
The low level of SO2 in the plant emissions is achieved by capture of the sulfur in the wet limestone FGD system. The nominal overall design basis SO2 removal rate is set at 95 percent.
The minimization of NOX production and subsequent emission is achieved by a combination of low- NOX burners, overfire air staging, and selective catalytic reduction (SCR). The low- NOX burners utilize zoning and staging of combustion. Overfire air staging is employed in the design of this boiler. SCR utilizes the injection of ammonia and a catalyst to reduce the NOX emissions.
Particulate discharge to the atmosphere is reduced by the use of a modern electrostatic precipitator, which provides a particulate removal rate of 99.7 percent.
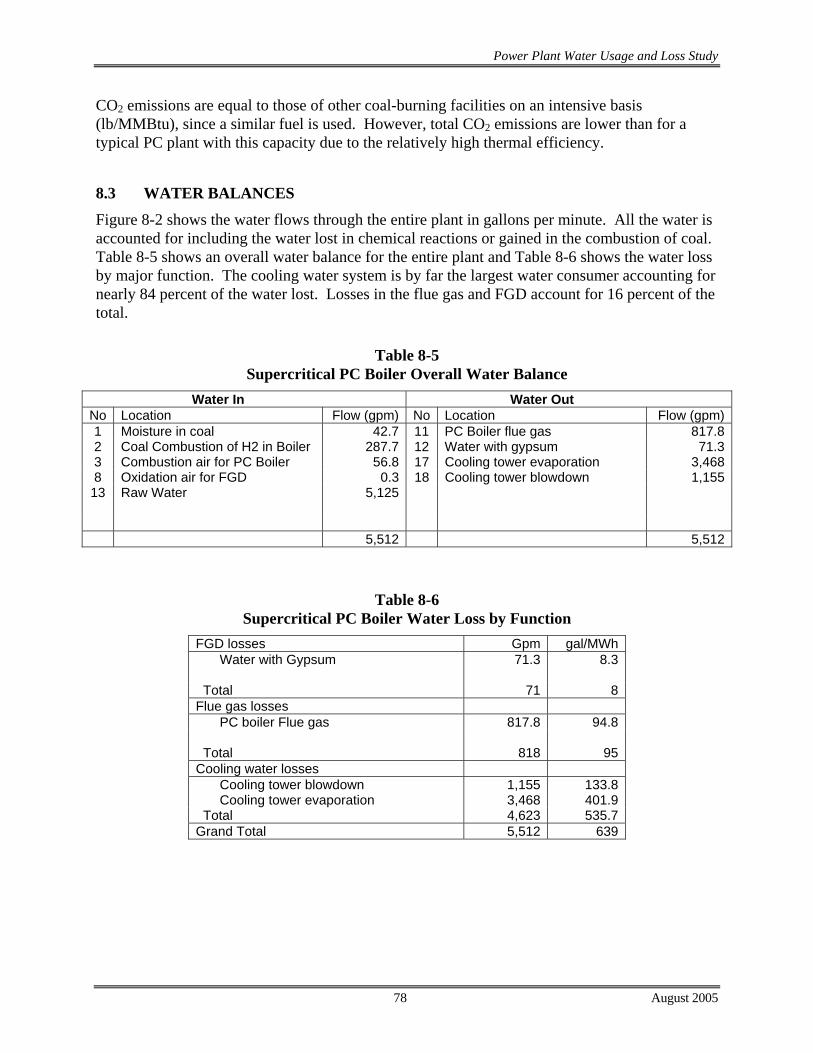
Power Plant Water Usage and Loss Study
78 August 2005
CO2 emissions are equal to those of other coal-burning facilities on an intensive basis (lb/MMBtu), since a similar fuel is used. However, total CO2 emissions are lower than for a typical PC plant with this capacity due to the relatively high thermal efficiency.
8.3 WATER BALANCES
Figure 8-2 shows the water flows through the entire plant in gallons per minute. All the water is accounted for including the water lost in chemical reactions or gained in the combustion of coal. Table 8-5 shows an overall water balance for the entire plant and Table 8-6 shows the water loss by major function. The cooling water system is by far the largest water consumer accounting for nearly 84 percent of the water lost. Losses in the flue gas and FGD account for 16 percent of the total.
Table 8-5 Supercritical PC Boiler Overall Water Balance
Water In Water Out No Location Flow (gpm) No Location Flow (gpm)1 Moisture in coal 42.7 11 PC Boiler flue gas 817.82 Coal Combustion of H2 in Boiler 287.7 12 Water with gypsum 71.33 Combustion air for PC Boiler 56.8 17 Cooling tower evaporation 3,4688 Oxidation air for FGD 0.3 18 Cooling tower blowdown 1,15513 Raw Water 5,125
5,512 5,512
Table 8-6 Supercritical PC Boiler Water Loss by Function
FGD losses Gpm gal/MWh Water with Gypsum 71.3 8.3 Total 71 8 Flue gas losses PC boiler Flue gas 817.8 94.8 Total 818 95 Cooling water losses Cooling tower blowdown 1,155 133.8 Cooling tower evaporation 3,468 401.9 Total 4,623 535.7 Grand Total 5,512 639
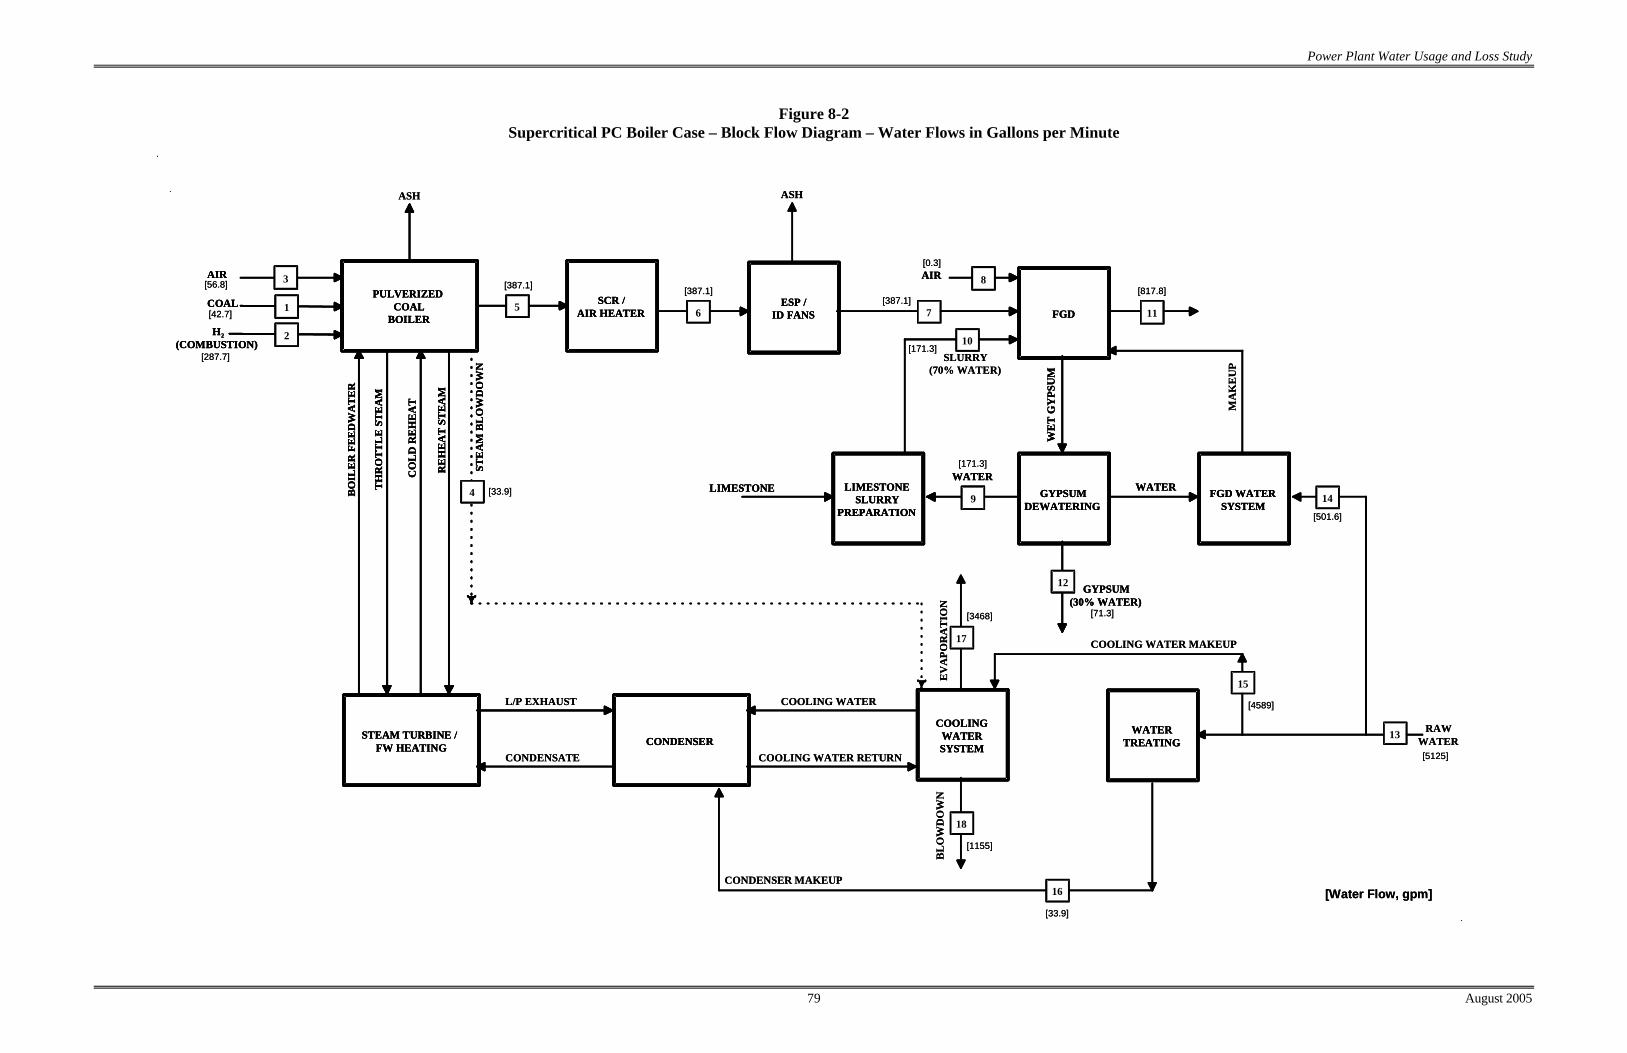
Power Plant Water Usage and Loss Study
79 August 2005
Figure 8-2 Supercritical PC Boiler Case – Block Flow Diagram – Water Flows in Gallons per Minute
.
PULVERIZED COAL
BOILER
SCR / AIR HEATER
ESP / ID FANS FGD
GYPSUM DEWATERING
LIMESTONESLURRY
PREPARATION
FGD WATER SYSTEM
STEAM TURBINE /FW HEATING CONDENSER
AIR
COAL
H2
(COMBUSTION)
3
1
2
5 6 7
AIR 8
11
9
WE
T G
YPS
UM
WATERWATERLIMESTONE
12 GYPSUM(30% WATER)
COOLING WATER SYSTEM
WATER TREATING
BO
ILE
R F
EED
WA
TE
R
TH
RO
TT
LE
ST
EA
M
CO
LD
RE
HE
AT
STE
AM
BL
OW
DO
WN
RE
HE
AT
STEA
M
4
L/P EXHAUST
CONDENSATE
COOLING WATER
COOLING WATER RETURN
17
EV
APO
RA
TIO
N
18
BL
OW
DO
WN
16
RAW WATER
14
13
COOLING WATER MAKEUP
15
ASH
CONDENSER MAKEUP
10SLURRY
(70% WATER)
[56.8]
[42.7]
[287.7]
[33.9]
[387.1] [387.1]
ASH
[387.1]
[0.3]
[171.3]
[817.8]
MA
KE
UP
[171.3]
[501.6]
[71.3][3468]
[4589]
[5125]
[33.9]
[1155]
[Water Flow, gpm]
.
.
.
PULVERIZED COAL
BOILER
SCR / AIR HEATER
ESP / ID FANS FGD
GYPSUM DEWATERING
LIMESTONESLURRY
PREPARATION
FGD WATER SYSTEM
STEAM TURBINE /FW HEATING CONDENSER
AIR
COAL
H2
(COMBUSTION)
3
1
2
5 6 7
AIR 8
11
9
WE
T G
YPS
UM
WATERWATERLIMESTONE
12 GYPSUM(30% WATER)
COOLING WATER SYSTEM
WATER TREATING
BO
ILE
R F
EED
WA
TE
R
TH
RO
TT
LE
ST
EA
M
CO
LD
RE
HE
AT
STE
AM
BL
OW
DO
WN
RE
HE
AT
STEA
M
4
L/P EXHAUST
CONDENSATE
COOLING WATER
COOLING WATER RETURN
17
EV
APO
RA
TIO
N
18
BL
OW
DO
WN
16
RAW WATER
14
13
COOLING WATER MAKEUP
15
ASH
CONDENSER MAKEUP
10SLURRY
(70% WATER)
[56.8]
[42.7]
[287.7]
[33.9]
[387.1] [387.1]
ASH
[387.1]
[0.3]
[171.3]
[817.8]
MA
KE
UP
[171.3]
[501.6]
[71.3][3468]
[4589]
[5125]
[33.9]
[1155]
[Water Flow, gpm]
.
.
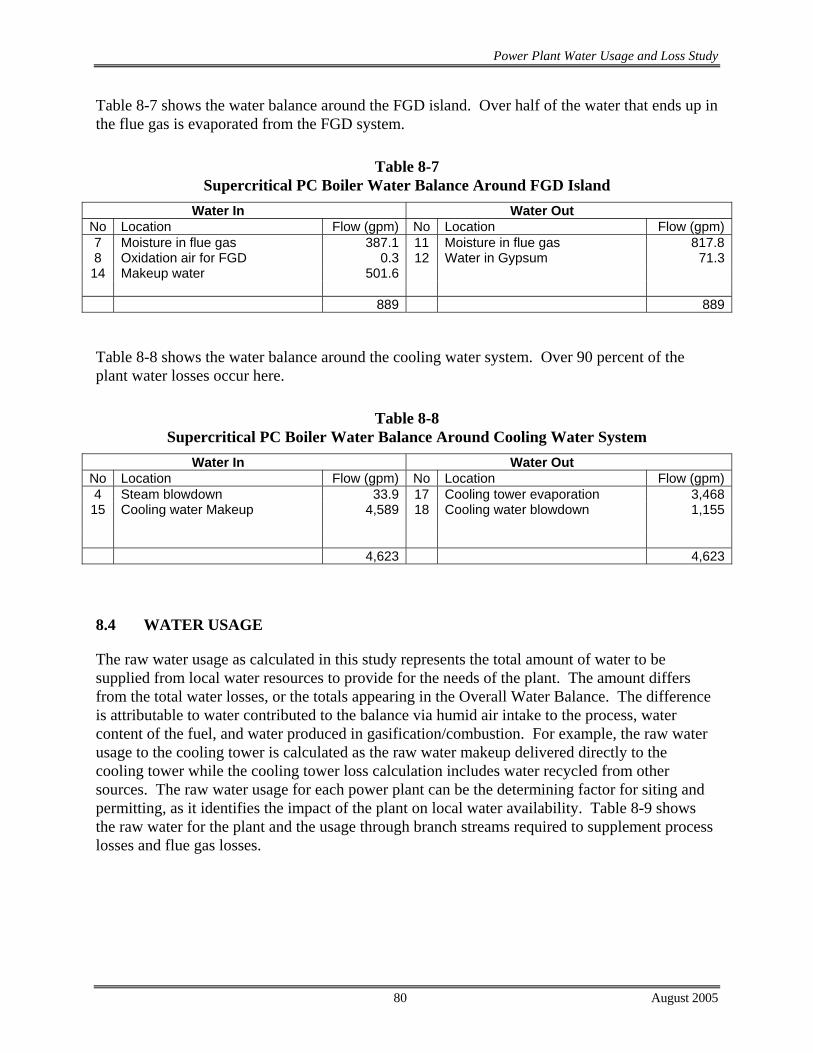
Power Plant Water Usage and Loss Study
80 August 2005
Table 8-7 shows the water balance around the FGD island. Over half of the water that ends up in the flue gas is evaporated from the FGD system.
Table 8-7 Supercritical PC Boiler Water Balance Around FGD Island
Water In Water Out No Location Flow (gpm) No Location Flow (gpm)7 Moisture in flue gas 387.1 11 Moisture in flue gas 817.88 Oxidation air for FGD 0.3 12 Water in Gypsum 71.314 Makeup water 501.6
889 889
Table 8-8 shows the water balance around the cooling water system. Over 90 percent of the plant water losses occur here.
Table 8-8 Supercritical PC Boiler Water Balance Around Cooling Water System
Water In Water Out No Location Flow (gpm) No Location Flow (gpm)4 Steam blowdown 33.9 17 Cooling tower evaporation 3,46815 Cooling water Makeup 4,589 18 Cooling water blowdown 1,155
4,623 4,623
8.4 WATER USAGE
The raw water usage as calculated in this study represents the total amount of water to be supplied from local water resources to provide for the needs of the plant. The amount differs from the total water losses, or the totals appearing in the Overall Water Balance. The difference is attributable to water contributed to the balance via humid air intake to the process, water content of the fuel, and water produced in gasification/combustion. For example, the raw water usage to the cooling tower is calculated as the raw water makeup delivered directly to the cooling tower while the cooling tower loss calculation includes water recycled from other sources. The raw water usage for each power plant can be the determining factor for siting and permitting, as it identifies the impact of the plant on local water availability. Table 8-9 shows the raw water for the plant and the usage through branch streams required to supplement process losses and flue gas losses.

Power Plant Water Usage and Loss Study
81 August 2005
Table 8-9 Supercritical PC Boiler Raw Water Usage
Water In Water Usage
No Location Flow (gpm)
gal/ MWh No Location Flow
(gpm)gal/
MWh 13 Raw Water 5,125 593.8 14 Water to FGD System 501.6 58.1
15 Makeup to Cooling Tower 4,589 531.8 16 Makeup to Condenser 33.9 3.9 5,125 594 5,125 594

Power Plant Water Usage and Loss Study
82 August 2005
9. RESULTS
This study resulted in a series of tables and flow diagrams in each report section which document the water loss in specific areas of the study plants. These areas were divided into process losses, flue gas losses and cooling water losses. Also, the raw water usage was determined for each plant to provide an assessment of the makeup requirement and distribution into the plant. The results of the water utilization and loss study are summarized here in Table 9-1 and Table 9-2, shown in gallons per MWh (net) and MMBtu, respectively. The water balance reported with each technology section provides credible completeness for the accounting of water input, output, and uses. Water loss as a function of heat input (MMBtu) is more consistent among types of power plant than as a function of MWh. This is primarily due to inclusion of heat rate in the water loss calculation based on MWh.
An alternative presentation of the results is in the form of bar graphs as shown in Figure 9-1 to compare various types of gasifier and Figure 9-2 to compare technologies, both shown in gallons per MWh.
The results of the raw water usage are summarized in Table 9-3, shown in gallons per MWh. The results are also shown as a bar graph in Figure 9-3.
9.1 PROCESS LOSSES
Process losses are more pronounced with the IGCC plants due to the need to add water to the gasification reactions and promote shift within the gasifier to hydrogen and carbon dioxide. There are no process losses with the other plants other than the PC plants, which lose water with disposal of the FGD gypsum cake. The process losses in each of the systems are the smallest category of loss.
The Shell IGCC plant loses coal moisture initially as a water loss, due to the requirement to dry the coal prior to feeding to the gasifier. However, because of the dry feed, it uses less water in the gasification reactions, which are indicated as the water lost to shift reaction in the gasifier. Water lost to shift is the reduction of water content in the syngas resulting from the conversion of water present in the gasifier to hydrogen and carbon dioxide. The E-Gas case has less water lost to shift and less water converted to hydrogen and carbon dioxide, as reflected in the syngas composition. The E-Gas syngas contains nearly 20 percent more carbon monoxide and about 15 percent less hydrogen than either of the GE Energy cases.
Water lost with the slag is consistent for each of the IGCC cases, which reflects the dewatering of the slag and the water content in the residual cake. Minor amounts of water are lost in the COS hydrolysis bed, resulting from the hydrolysis of COS to H2S and CO2.
Sour Water Blowdown/Water Treatment Effluent can vary with the IGCC plant. The IGCC plant with the highest blowdown is the GE Energy Quench case due to the large sour water
Power Plant Water Usage and Loss Study
83 August 2005
circulation rate around the gasifier quench tank. Rather than treat and discharge the entire process blowdown stream to the sewer, the stream is treated, 90 percent used as makeup for the cooling tower, with the remainder to the plant sewer.
9.2 FLUE GAS LOSSES
Flue gas losses are a reflection of the type of power plant and the methodology used for conditioning either the syngas or the flue gas. Each of the IGCC plants has syngas humidification for NOx mitigation, but the E-Gas and Shell cases also need additional steam injection to dilute the syngas. The GE Energy cases utilize only nitrogen injection to dilute the syngas. This can be seen in the variations of flue gas losses for the IGCC gas turbines. The NGCC does not utilize natural gas humidification before firing in the GT combustor, however the flue gas losses are indicative of the water produced from the air and fuel.
The PC power plants each have FGD. These wet processes result in significant water losses to the boiler flue gas.
9.3 COOLING WATER LOSSES
Eighty to ninety-nine percent of the power plant raw water usage is through a combination of cooling tower evaporation and blowdown. This water loss is based on a generic site and assumed cooling tower performance characteristics (see Section 1.3.3). Uniformly, cooling tower performance as a function of plant condenser duty (plus 100 MMBtu/h for auxiliary heat loads) was assumed for each power plant. Water loss differences are associated with plant condenser duty which can be traced back to plant efficiency and other uses of condensing steam such as methods of syngas humidification or syngas dilution. The E-Gas condenser duty is lower than the other IGCC cases due to that case utilizing more non-condensing steam for syngas dilution.

Power Plant Water Usage and Loss Study
84 August 2005
Table 9-1 Water Loss Summary, gallons per MWh
E-Gas gal/MWh
Shell gal/MWh
GE R-C gal/MWh
GE Quench gal/MWh
NGCC gal/MWh
PC Sub gal/MWh
PC Supe gal/MWh
Process losses
Coal drying moisture 3.3 Water lost in gasification shift 11.1 6.0 16.7 18.2
Ash quench blowdown 8.7 7.8 8.4 9.3 Water with slag 3.0 3.7 3.3 3.7
Water lost in COS hydrolysis 0.0 0.2 0.0 0.1 Sour water blowdown 3.1 4.5 0.5 2.5 Water with gypsum 9.3 8.3 Total 26 25 29 34 0 9 8
Flue gas losses GT flue gas 105.5 75.3 78.0 104.8 87.0 Incinerator flue gas 1.5 Boiler flue gas 107.0 94.8 Total 106 77 78 105 87 107 95
Cooling water losses Cooling tower blowdown 75.3 85.1 86.1 92.9 70.6 149.4 133.9 Cooling tower evaporation 225.9 255.5 258.5 278.9 212.0 448.5 401.9 Total 301 341 345 372 283 598 536
Grand Total 433 443 452 510 370 714 639
Table 9-2 Water Loss Summary, gallons per MMBtu
E-Gas gal/MMBtu
Shell gal/MMBtu
GE R-C gal/MMBtu
GE Quench gal/MMBtu
NGCC gal/MMBtu
PC Sub gal/MMBtu
PC Supe gal/MMBtu
Process losses
Coal drying moisture 0.4 Water lost in gasification shift 1.3 0.7 1.9 1.9
Ash quench blowdown 1.0 0.9 1.0 1.0 Water with slag 0.3 0.4 0.4 0.4
Water lost in COS hydrolysis 0.0 0.0 0.0 0.0 Sour water blowdown 0.4 0.5 0.1 0.3 Water with gypsum 1.0 1.0 Total 3.0 3.0 3.3 3.5 0 1.0 1.0
Flue gas losses GT flue gas 12.1 8.9 9.0 10.9 12.7 Incinerator flue gas 0.2 Boiler flue gas 11.1 11.1 Total 12.1 9.0 9.0 10.9 12.7 11.1 11.1
Cooling water losses Cooling tower blowdown 8.6 10.0 9.9 9.7 10.3 15.5 15.6 Cooling tower evaporation 25.9 30.1 29.8 29.0 31.0 46.5 46.9 Total 34.6 40.1 39.8 38.6 41.3 62.0 62.6
Grand Total 50 52 52 53 54 74 75

Power Plant Water Usage and Loss Study
85 August 2005
Figure 9-1 IGCC Water Loss Summary for Various Gasifier Types, gallons per MWh
0
100
200
300
400
500
600
Wat
er L
oss,
Gal
/MW
h
E-Gas Shell GE R-C GE Quench
Process Losses Flue Gas Losses Cooling Tower Losses Total
Figure 9-2
Comparison of Water Loss for Various Fossil Plants, gallons per MWh
26106
301
433 gal/MWh
2577
341
443 gal/MWh
2978
345
452 gal/MWh
34105
372
510 gal/MWh
087
283
370 gal/MWh
9107
598
714 gal/MWh
895
536
639 gal/MWh
0
100
200
300
400
500
600
700
800
Wat
er L
oss,
Gal
/MW
h
E-Gas Shell GE R-C GE Quench NGCC PC Sub PC Super
Process Losses Flue Gas losses Cooling Tower Losses Total Losses

Power Plant Water Usage and Loss Study
86 August 2005
9.4 RAW WATER USAGE
The raw water usages as calculated in this study represent the total amounts of water to be supplied from local water resources to provide for the needs of the plants. The amounts differ from the total water losses, or the totals appearing in the Overall Water Balances. The differences are attributable to water contributed to the balance via humid air intake to the process, water content of the fuel, and water produced in gasification/combustion. For example, the raw water usage to the cooling tower is calculated as the raw water makeup delivered directly to the cooling tower while the cooling tower loss calculation includes water recycled from other sources. The raw water usage for each power plant can be the determining factor for siting and permitting, as it identifies the impact of the plant on local water availability. The results show that the volume of raw water for each plant is dominated by the makeup requirement for the cooling tower. The raw water feed stream is also divided into branch streams required to supplement process losses and flue gas losses.
The results of the raw water usage calculations are summarized in Table 9-3, shown in gallons per MWh. The results are also shown as a bar graph in Figure 9-3. The usage is a better measure of the water requirement that would be needed for input to each plant type.
Table 9-3 Raw Water Usage Summary, gallons per MWh
E-Gas Shell GE R-C GE Quench NGCC PC
Sub PC
Super
Raw Water Usage gal/ MWh
gal/ MWh
gal/ MWh
gal/ MWh
gal/ MWh
gal/ MWh
gal/ MWh
Makeup to Slurry System 8.2 15.9 29.6 Makeup to Quench 6.4 Makeup to Ash handling 10.0 11.5 11.6 11.9 Makeup to Humidifier 34.4 24.7 20.0 42.4 Makeup to Cooling Tower 300.1 339.6 339.1 347.2 280.7 593.6 531.8Makeup to Condenser 18.9 14.0 1.0 1.7 1.9 4.4 3.9Water to FGD System 65.8 58.1 371.5 389.8 387.6 439.2 282.6 663.8 593.8

Power Plant Water Usage and Loss Study
87 August 2005
Figure 9-3 Comparison of Raw Water Usage for Various Fossil Plants, gallons per MWh
300
372 gal/MWh
340
390 gal/MWh
339
388 gal/MWh
347
439 gal/MWh
281
283 gal/MWh
594
664 gal/MWh
532
594 gal/MWh
0
100
200
300
400
500
600
700
800
Raw
Wat
er U
sage
, Gal
/MW
h
E-Gas Shell GE R-C GE Quench NGCC PC Sub PC Super
Slurry Quench Ash Handling Humidifier Cooling Tower Condenser FGD Total
Usage

Power Plant Water Usage and Loss Study
88 August 2005
9.5 RECOMMENDATIONS
This study is the initial phase of an effort to thoroughly document the use of water in power plants, particularly in IGCC applications. The plant configurations used here are based on current commercial offerings and on rigorous systems analysis results. The sites are generic middle USA and water for process and cooling makeup is readily available. There were no economic analyses performed.
The plant designs from this study can be used as a baseline for conducting additional systems analysis. Future analysis could be based upon such design changes as location, water use limitations, and plant efficiency. The sensitivity of water loss to changes in process design could also be determined. Following is a list of possible comparisons which could be used to alter the baseline power plant results.
• Arid Region power plant design
• Use of wet-dry cooling or dry cooling
• IGCC in hot, humid Texas climate
• IGCC in hot, dry west Texas or New Mexico climate
• IGCC in cold, dry, high elevation Wyoming
• IGCC with high moisture low rank coals
• IGCC with higher or lower solids loaded bituminous coal slurry feed
• Transport Reactor gasifier
• Different technology application such as H-turbine, or warm-gas cleaning that changes the efficiency and heat rejection, i.e., water needs.
• A power plant with once-through cooling of the steam cycle portion of the plant.
This report should provide some basis for reviewing the design assumptions, technology capabilities, system performance, etc and identify areas where new technology approaches or gasifier designs could lead to substantially lower water requirements. In turn, this can be a tool for planning R&D and gaining acceptance of out-of-the-box proposals for R&D projects. Examples might be:
• Recycle captured CO2 as the transport media for coal into the gasifier eliminating the slurry requirement. Since the slurries use recycled water, is this a real reduction of water loss, or merely a displacement within the total system?

Power Plant Water Usage and Loss Study
89 August 2005
• Higher temperature, non-diluted fuel feed to gas turbine leading to higher GT exit temperature and greater heat recovery in steam cycle – thus different water requirements for cooling. For R&D planning, this identifies high temperature turbine, cleaner syngas for feed to GT, higher temperature and efficiency HRSG, etc.
• Is wet-dry cooling, dry cooling, or once-through cooling more or less attractive from water loss perspective for one technology versus the others?
• This study has evaluated the water usage and loss for each technology at standard design conditions. It would be appropriate to assess the variations in water requirements with external climate and plant utilization schedules to determine both the maximum water requirements and the average resource withdrawal rates that might be needed to support each of these plant types.
It is recommended that this study and report be used to provide baseline cases and methodology for assessing water usage and loss in various power plant technology conceptual designs. By providing the user of this report with a thorough determination of water input, output, and uses, both internal to the plant and with external requirements for makeup and discharge, the study provides the framework needed to assess water loss issues related to technology selection and design.