Power Management for Computer Systems and · PDF filePower Management for Computer Systems and...
76
© 2008 IBM Corporation ISLPED 2008 Power Management for Computer Systems and Datacenters Karthick Rajamani, Charles Lefurgy, Soraya Ghiasi, Juan C Rubio, Heather Hanson, Tom Keller {karthick, lefurgy, sghiasi, rubioj, hlhanson, tkeller}@us.ibm.com IBM Austin Research Labs
Transcript of Power Management for Computer Systems and · PDF filePower Management for Computer Systems and...

© 2008 IBM CorporationISLPED 2008
Power Management for Computer Systems and Datacenters
Karthick Rajamani, Charles Lefurgy, Soraya Ghiasi, Juan C Rubio,Heather Hanson, Tom Keller
{karthick, lefurgy, sghiasi, rubioj, hlhanson, tkeller}@us.ibm.com
IBM Austin Research Labs

© 2008 IBM CorporationISLPED 20082
Overview of Tutorial
1. Introduction and Background• New focus on power management - why, who, what ?• Understanding the problem
Diverse requirementsWHAT is the problem ?Understanding variability
3. Industry solutions• Sample solutions• In-depth solutions
4. Datacenter • Facilities Management
Anatomy of a datacenter Improving efficiency
2. Power Management Concepts• Basic solutions• Advanced solutions
Building blocks - sensors and actuatorsFeedback-driven and model-assisted
solution design

© 2008 IBM CorporationISLPED 20083
Scope of this tutorialPower Management Solutions for Servers and the Data Center
• Problems
• Solution concepts, characteristics and context
• Tools and approaches for developing solutions
• Brief overview of some industrial solutions
Power-efficient microprocessor design, circuit, process technologiesPower-efficient middleware, software, compiler technologiesEmbedded systems
Outside Scope

© 2008 IBM CorporationISLPED 20085
Servers and Storage Heat Density Trends
© 2008 IBM CorporationISLPED 20086
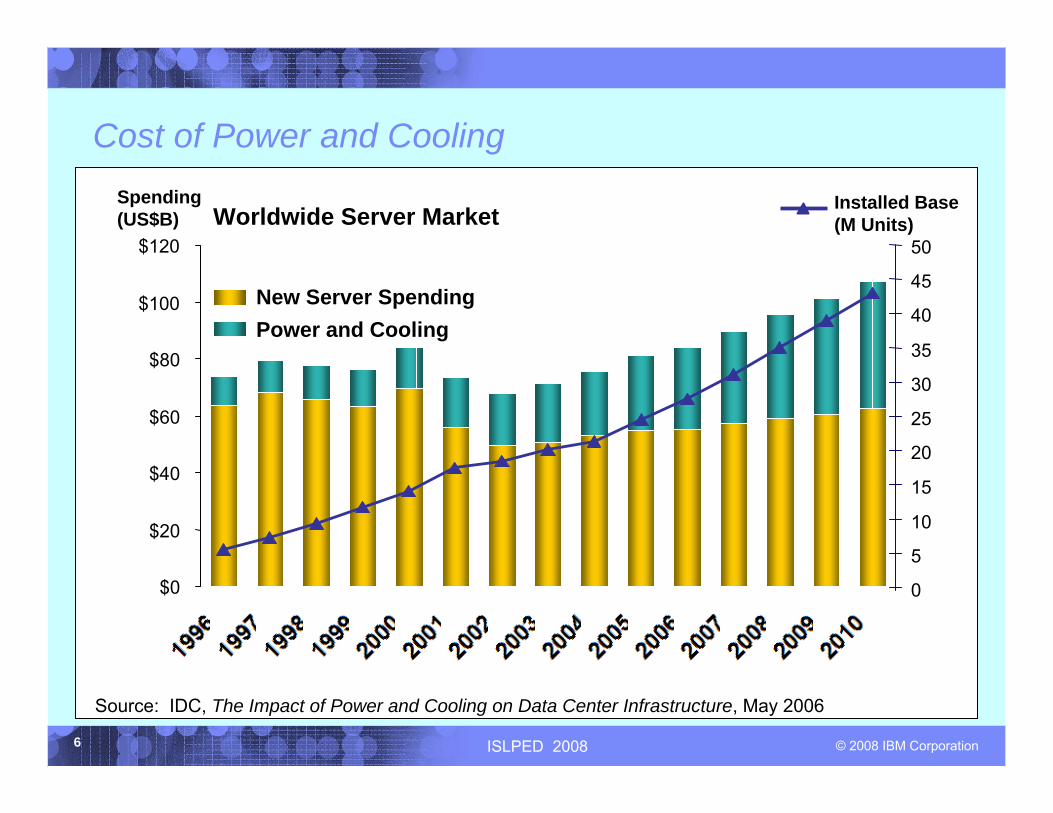
Cost of Power and Cooling
$0
$20
$40
$60
$80
$100
$120
Installed Base(M Units)
Spending(US$B)
New Server SpendingPower and Cooling
0
5
10
15
20
25
30
35
40
45
50Worldwide Server Market
Source: IDC, The Impact of Power and Cooling on Data Center Infrastructure, May 2006

© 2008 IBM CorporationISLPED 20088
Government and Organizations in Action
Regulations and standardization of computer energy efficiency (e.g. Energy Star for computers), because of
• Spiraling energy and cooling costs at data centers• Environmental impact of high energy consumption
Japan, Australia, EU and US EPA working out joint/global regulation efforts
Benchmarks for power and performance• Metrics: GHz, BW, FLOPS → SpecInt, SpecFP, Transactions/sec →
Performance/Power
2005
SPECpower
US Congress HR5646
2006 2007 2008
EPA EnergyStar for Computers
Japan Energy Savings Law
ECMA TC38-TG2
EEP

© 2008 IBM CorporationISLPED 200811
0
10
20
30
40
50
60
70
80
90
100
calib
ratio
n
calib
ratio
n
calib
ratio
n
100% 90
%
80%
70%
60%
50%
40%
30%
20%
10% 0%
SPECPower Load Levels
% L
oad,
Util
izat
ion,
and
Pow
er
Load LevelNormalized PowerAverage Utilization
Benchmarking Power-Performance: SPECPower_ssj_2008
Based on SPECjbb, a java performance benchmark.
Generalization to other workloads, blade/cluster environments underway.
Range of load levels – not just peak
Self-calibration phases determine peak throughput on system-under-test
Benchmark consists of 11 load levels: 100% of peak throughput to idle, in 10% steps
Fixed time interval per load level
Random arrival times for transactions to mimic realistic variations within each load level
Primary benchmark metric
Source: Heather Hanson, IBM
Time
100%
100%idle
idle
Throughput per level
power per level
∑
∑

© 2008 IBM CorporationISLPED 200815
Outline
1. Introduction and Background• New focus on power management - why, who, what ?• Understanding the problem
Diverse requirementsWHAT is the problem? Understanding variability
3. Industry solutions• Sample solutions• In-depth solutions
4. Datacenter • Facilities Management
Anatomy of a datacenter Improving efficiency
2. Power Management Concepts• Basic solutions• Advanced solutions
Building blocks - sensors and actuatorsFeedback-driven and model-assisted
solution design

© 2008 IBM CorporationISLPED 200816
User Requirements
Users desire different goals• High performance
• Safe and reliable operation
• Low operating costs
But solution for one can be potentially contradictory to a different goal
• Increasing frequency for higher performance can lead to unsafe operating temperatures
• Lowering power consumption by operating at lower active states can help safe operation while increasing execution time and potentially total energy costs

© 2008 IBM CorporationISLPED 200818
Is a single sub-system the main problem? No
0%10%20%30%40%50%60%70%80%90%
100%
Nor
mal
ized
Pow
er B
reak
dow
n
MainframeHighendHPC nodeBlade
Processor / CacheMemory subsystemIO and Disk Storage CoolingPower subsystem
Biggest power consumer varies with server classImportant to understand composition of target class for delivering targeted solutionsImportant to address power consumption/efficiencies in all main subsystems
Server power budget breakdown for different classes/types.
Using budget estimates for specific machine configurations, for illustration purposes.

© 2008 IBM CorporationISLPED 200819
Workloads and Configuration Dictate Power Consumption
Big Science System Power Breakdown (HPL)
59%
2%
11%
3%
16%
9%
Processors OpticsMemory DIMMs Package Distribution LossesDC-DC Losses AC-DC Losses
Big Simulation System Power Breakdown (Stream)
24%
4%
48%
1%
14%9%
Processors OpticsMemory DIMMs Package Distribution LossesDC-DC Losses AC-DC Losses
Estimated power breakdown for two Petaflop supercomputer HPC node designs, each configuration tailored to application class
Depending on configuration and usage, processor or memory sub-system turn out to be dominantPower distribution/conversion losses is a significant fraction
Note1: Room A/C energy costs are not captured – significant at the HPC data center level.Note 2: I/O and storage can also be significant power consumers for commercial computing installations
Source: Karthick Rajamani, IBM
© 2008 IBM CorporationISLPED 200821
0
50
100
150
200
250
250 500 750 1000 1250 1500 1750 2000 2250 2500 2750 3000
Processor effective frequency (MHz)
Pow
er (W
)
LINPACK
Swim(SPEC 2000)
Idle
Processor clock modulation Processor voltage/freq scaling
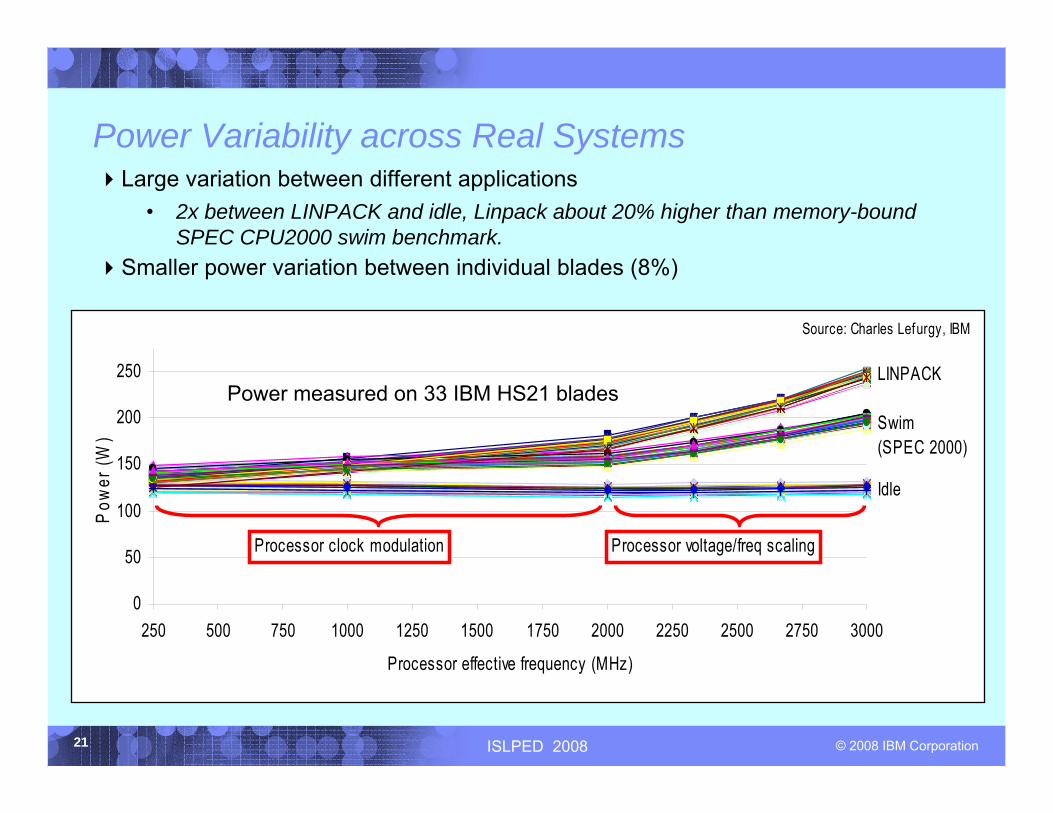
Source: Charles Lefurgy, IBM
Power Variability across Real SystemsLarge variation between different applications
• 2x between LINPACK and idle, Linpack about 20% higher than memory-bound SPEC CPU2000 swim benchmark.
Smaller power variation between individual blades (8%)
Power measured on 33 IBM HS21 blades

© 2008 IBM CorporationISLPED 200823
Impact of Process Variation
10% power variation in random sample of five ‘identical’ Intel PentiumM processor chips running Linpack.
1.10
1.08
1.03
1.08
1.00
0.94
0.96
0.98
1.00
1.02
1.04
1.06
1.08
1.10
1.12
Part 5 Part 4 Part 3 Part 2 Part 1
Nor
mal
ized
Pow
er
Source: Juan Rubio, Karthick Rajamani, IBM

© 2008 IBM CorporationISLPED 200824
Variations from Design
1.00
1.00
1.52
1.16
1.55
1.28
2.07
1.51
1.52
1.51
0.0
0.5
1.0
1.5
2.0
2.5
Max Active (Idd7) Max Idle (Idd3N)
Nor
mal
ized
Cur
rent
/Pow
er
Vendor 1 Vendor 2 Vendor 3 Vendor 4 Vendor 5
Source: Karthick Rajamani, IBM
Memory power specifications for DDR2 parts with identical performance specifications
• 2X difference in active power and 1.5X difference in idle power

© 2008 IBM CorporationISLPED 200825
Environmental Conditions: Ambient Temperature
~5 C drop in ambient temperature
timetime
Frequency
(MHz)
~5 C drop in CPU temperature
Time (hh:mm)
Source: Heather Hanson, Coordinated Power, Energy, and Temperature Management, Dissertation, 2007.

© 2008 IBM CorporationISLPED 200827
Take Away
Power management solutions need to target the computer system as a whole with mechanisms to address all major sub-systems. Further, function-oriented design and workload’s usage of a system can create dramatic differences in the distribution of power by sub-systems.
User requirements impose a diverse set of constraints which can sometimes be contradictory.
There is increasing variability and even unpredictability of power consumption due to manufacturing technologies, incorporation of circuit-level power reduction techniques, workload behavior and environmental effects.
Power management solutions need to be flexible and adaptive to accommodate all of the above.

© 2008 IBM CorporationISLPED 200828
Outline
1. Introduction and Background• New focus on power management - why, who, what ?• Understanding the problem
Diverse requirementsWHAT is the problem ?Understanding variability
3. Industry solutions• Sample solutions• In-depth solutions
4. Datacenter • Facilities Management
Anatomy of a datacenter Improving efficiency
2. Power Management Concepts• Basic solutions• Advanced solutions
Building blocks - sensors and actuatorsFeedback-driven and model-assisted
solution design

© 2008 IBM CorporationISLPED 200829
Basic Solutions – Save EnergyFunction Definition: Reduce power consumption of computer system when not in
active use.
Conventional Implementation:
Exploiting architected idle modes of processor entered by executing special code/instructions with interrupts causing exit.
• Multiple modes with increasing reduction in power consumption usually with increased latency to entry/exit
• Exploit circuit-level clock gating of significant portions of the chip and more recently voltage-frequency reductions for idle states
Exploiting device idle modes through logic in controller or device driver e.g.• standby state for disks
• self-refresh for DRAM in embedded systems

© 2008 IBM CorporationISLPED 200830
Basic Solutions – Avoid System FailureFunction Definition: Maintain continued computer operation in the face of power or
cooling emergencies.
Conventional Implementation
Using redundant components in power distribution and cooling sub-systems• N+M solutions.
Throttling of components under thermal overload.• Employing thermal sensors, components are throttled when temperatures exceed
pre-set thresholds.
Fan speed is adjusted based on heat load detected with thermal sensors – to balance acoustics, power and cooling considerations.

© 2008 IBM CorporationISLPED 200831
Adaptive Solutions: Key to address variability and diverse conditions
Sensors Actuators
Feedback-driven and model-assisted control framework
Provide real-time feedbackPower, temperature, performance
(activity), stabilityWeapon against variability and
unpredictability
Regulate component states e.g. voltage/freq, DRAM
power-down; activity – instruction/request throughput.
Manage CPU, memory, fans, disk.Tune power-performance levels to
environment, workload and constraints.
Feedback-driven control provides 1. capability to adapt to environment,
workload, varying user requirements2. regulate to desired constraints even with
imperfect information
Models provide ability to1. estimate unmeasured quantities2. predict impact for change
© 2008 IBM CorporationISLPED 200832
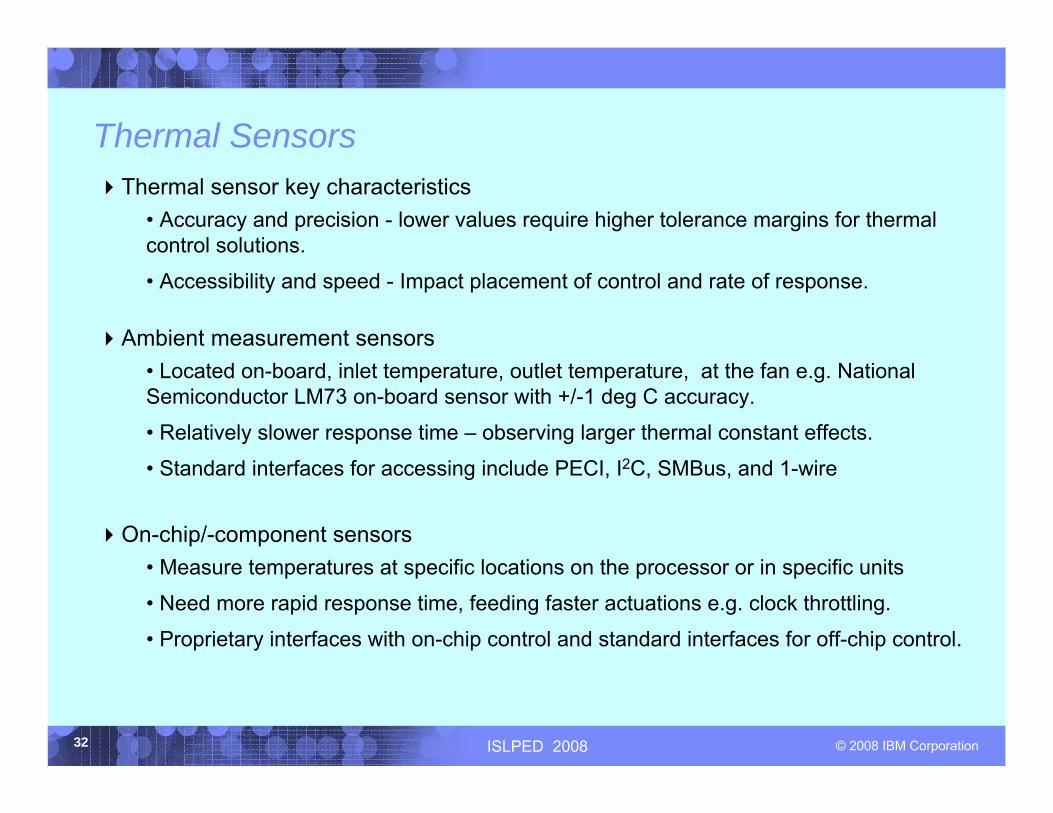
Thermal SensorsThermal sensor key characteristics
• Accuracy and precision - lower values require higher tolerance margins for thermal control solutions.
• Accessibility and speed - Impact placement of control and rate of response.
Ambient measurement sensors • Located on-board, inlet temperature, outlet temperature, at the fan e.g. National Semiconductor LM73 on-board sensor with +/-1 deg C accuracy.
• Relatively slower response time – observing larger thermal constant effects.
• Standard interfaces for accessing include PECI, I2C, SMBus, and 1-wire
On-chip/-component sensors• Measure temperatures at specific locations on the processor or in specific units
• Need more rapid response time, feeding faster actuations e.g. clock throttling.
• Proprietary interfaces with on-chip control and standard interfaces for off-chip control.

© 2008 IBM CorporationISLPED 200833
Power Measurement SensorsAC power
• External components – Intelligent PDU, SmartWatt
• Intelligent power supplies – PSMI standard
• Instrumented power supplies
DC power• Most laptops – battery discharge rate
• IBM Active Energy Manager – system power
• Intel Foxton technology – processor power
Sensor must suit the application:• Access rate (second, ms, us)
• Accuracy
• Precision
• Accessibility (I2C, ethernet, open source driver)
(1) C. Poirier, R. McGowen, C. Bostak, S. Naffziger. “Power and Temperature Control on a 90nm Itanium-Family Processor”, ISSCC 2007
(2) HotChips - http://www.hotchips.org/archives/hc17/3_Tue/HC17.S8/HC17.S8T3.pdf

© 2008 IBM CorporationISLPED 200835
Activity Monitors‘Performance’ Counters
• Traditionally part of processor performance monitoring unit
• Can track microarchitecture and system activity of all kinds
• A fast feedback for activity, have also been shown to serve as potential proxies for power and even thermals
Resource utilization metrics in the operating system• Serve as useful input to resource state scheduling solutions for power reduction
Application performance metrics• Best feedback for assessing power-performance trade-offs
© 2008 IBM CorporationISLPED 200836
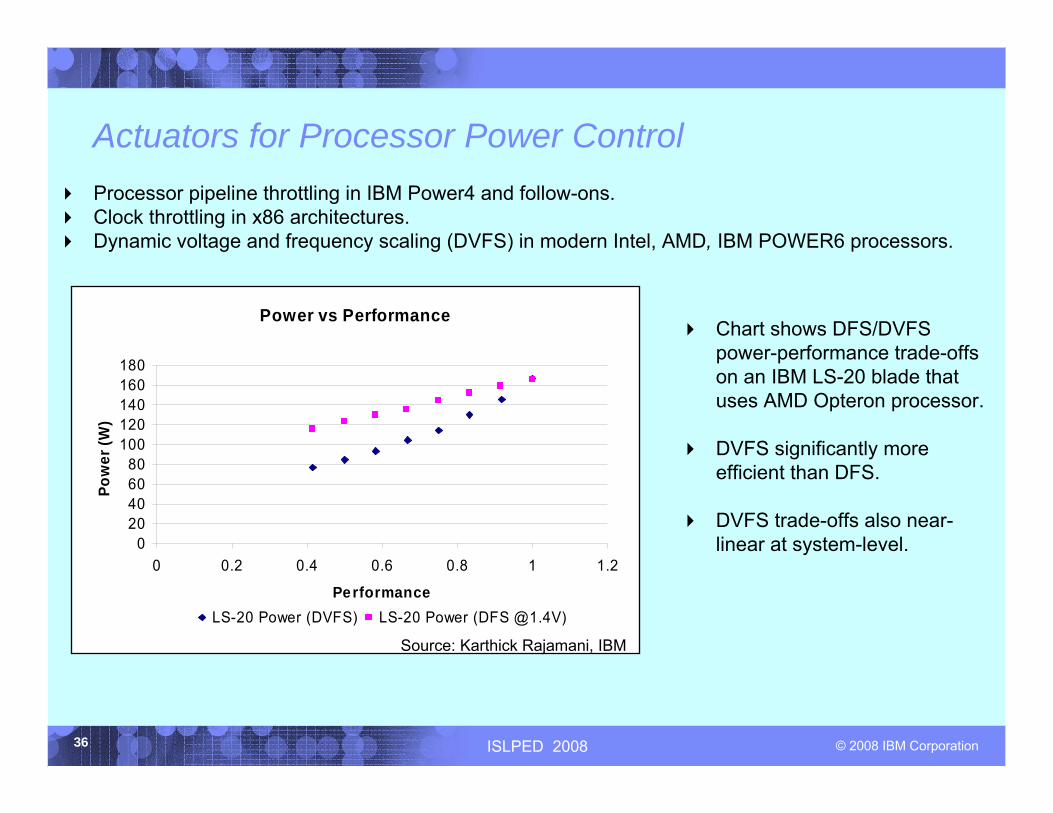
Actuators for Processor Power ControlProcessor pipeline throttling in IBM Power4 and follow-ons.Clock throttling in x86 architectures. Dynamic voltage and frequency scaling (DVFS) in modern Intel, AMD, IBM POWER6 processors.
Power vs Performance
020406080
100120140160180
0 0.2 0.4 0.6 0.8 1 1.2
Performance
Pow
er (W
)
LS-20 Power (DVFS) LS-20 Power (DFS @1.4V)
Chart shows DFS/DVFS power-performance trade-offs on an IBM LS-20 blade that uses AMD Opteron processor.
DVFS significantly more efficient than DFS.
DVFS trade-offs also near-linear at system-level.
Source: Karthick Rajamani, IBM

© 2008 IBM CorporationISLPED 200837
Memory Systems Power Management
DRAM power linearly related to memory bandwidth.• Request throttling an effective means to limit memory
power with linear power-performance trade-offs
Incorporation of DRAM idle power-down modes can significantly lower their power.
• Can be implemented in memory controller
• Can increase performance in power-constrained systems by reducing throttling on active ranks as idle ranks consume less power
Combination of 2-channel grouping and Power-down management attacks both active and idle power consumption yielding the best results.
0.500.39
0.720.63
0.72
0.50
1.00
0.83
00.10.20.30.40.50.60.70.80.9
1
Commercial Best Case Commercial Worst Case Technical Best Case Technical Worst Case
Nor
mal
ized
Bus
Ban
dwid
th Normal With Power Management
MP Stream-Copy Power
1.000.71
0.49 0.57 0.58 0.460.52
0.89
0.40 0.31 0.290.35
00.20.40.60.8
1
16 ranks 8 ranks 4 ranks 16 ranks 8 ranks 4 ranks
Basic With Pow er Management
1 chgrp 2 chgrp
MP Stream-Copy Performance
1.03 1.021.16
1.03 1.05 1.021.00 1.010.780.83
0.991.06
00.20.40.60.8
11.2
16 ranks 8 ranks 4 ranks 16 ranks 8 ranks 4 ranks
Basic With Power Management
1 chgrp 2 chgrp
Source: Karthick Rajamani, IBM
Nor
mal
ized
Pow
erN
orm
aliz
ed P
erfo
rman
ce

© 2008 IBM CorporationISLPED 200838
Low-power Enterprise StorageBetter components
• Use disks with fewer higher capacity spindles
• Flash solid-state drives
• Variable speed disks – with disk power being proportional to rotational speed (squared), tailoring speed to required performance could improve efficiency
Massive Array of Idle Disks (MAID) – turn on only 25% of array at one time• Targets “persistent data” layer between highly available, low latency disk storage
and tape
• May need to tolerate some latency when a disk turns on, keep some always on
• Improve performance by tuning applications to target only 25% of array
‘Virtualization’• “Thin provisioning” or over-subscription of storage can drive utilization toward
100%, delaying purchase of additional storage
• Physical storage is dedicated only when data is actually written

© 2008 IBM CorporationISLPED 200839
Outline
1. Introduction and Background• New focus on power management - why, who, what ?• Understanding the problem
Diverse requirementsWHAT is the problem ?Understanding variability
3. Industry solutions• Sample solutions• In-depth solutions
4. Datacenter • Facilities Management
Anatomy of a datacenter Improving efficiency
2. Power Management Concepts• Basic solutions• Advanced solutions
Building blocks - sensors and actuatorsFeedback-driven and model-assisted
solution design

© 2008 IBM CorporationISLPED 200841
Adaptive Power Management Demo
Power6 blade prototype power capping demo• Demonstrates ability to adapt at runtime to workload changes and user
input (power cap limit) while maintaining blade power below specified value.
Power6 blade power savings demo • Demonstrates ability to adapt to load characteristics to provide increased
power savings by matching power-performance level to load-demand.- Adapting to load level- Adapting to load type

© 2008 IBM CorporationISLPED 200847
Advanced Solutions – Performance MaximizationUsage:
0
10
20
30
40
50
60
0 10 20 30 40 50 60
Memory Power Watts
CPU
Pow
er W
atts
Sta
tic
Dynamic
When cooling or power resources are shared by multiple entities, dynamic partitioning of the resource among the sharing entities can increase utilization of the shared resource enabling higher performance. We term this technique as power shifting.
Figure shows an example of CPU-memory power shifting.
Points show execution intervals of many workloads with no limit on power budget.
‘Static’ dotted rectangle encloses unthrottled intervals for a budget of 40W partitioned statically – 27W CPU, 13W Memory.
‘Dynamic’ dashed triangle encloses unthrottled intervals for power shifting with 40W budget
Better performance as a much larger set of intervals run unthrottled.
© 2008 IBM CorporationISLPED 200848
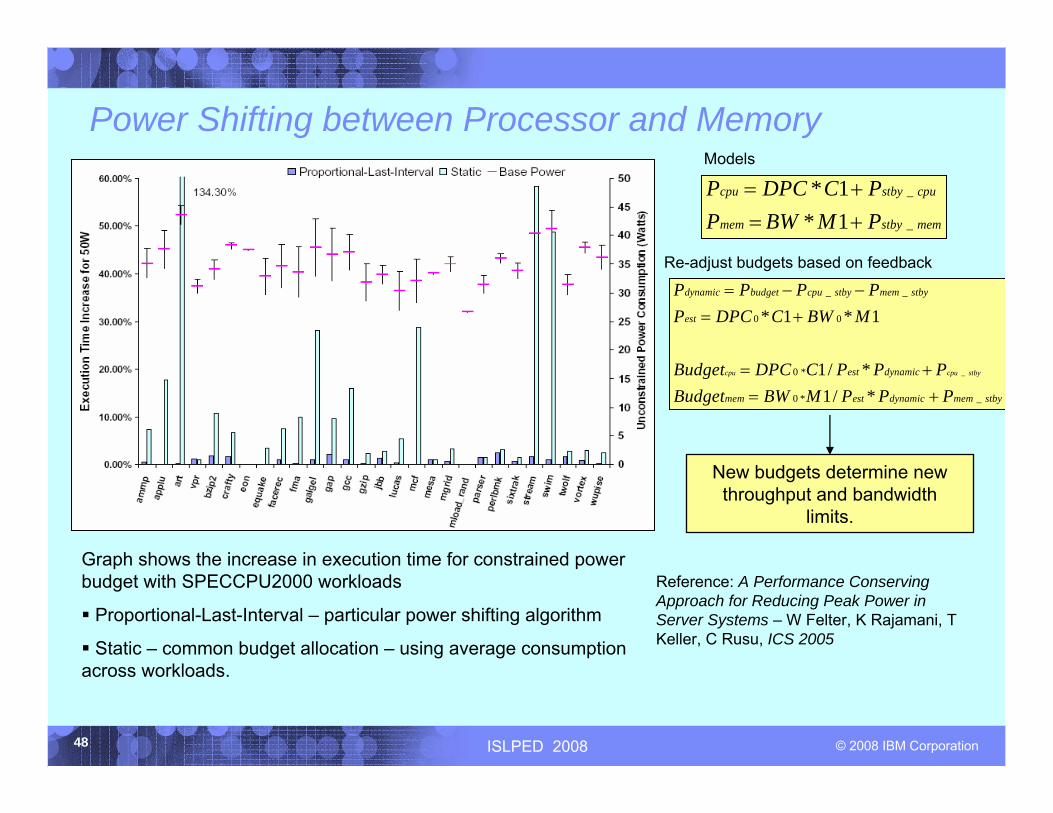
Power Shifting between Processor and Memory
_
_ _
0 0
0 *
0 * _
* 1 * 1
1/ *1/ *
cpu cpu stby
dynamic budget cpu stby mem stby
est
est dynamic
mem est dynamic mem stby
P P P PP DPC C BW M
Budget DPC C P P PBudget BW M P P P
= − −= +
= += +
_
_
* 1* 1
cpu stby cpu
mem stby mem
P DPC C PP BW M P
= += +
Reference: A Performance Conserving Approach for Reducing Peak Power in Server Systems – W Felter, K Rajamani, T Keller, C Rusu, ICS 2005
New budgets determine new throughput and bandwidth
limits.
Graph shows the increase in execution time for constrained powerbudget with SPECCPU2000 workloads
Proportional-Last-Interval – particular power shifting algorithm
Static – common budget allocation – using average consumption across workloads.
Models
Re-adjust budgets based on feedback

© 2008 IBM CorporationISLPED 200853
Take Away
Advanced functions extend basic power management capabilities • Providing adaptive solutions for tackling variability in systems,
environment and requirements, and
• Enabling dynamic power-performance trade-offs.
They can be implemented by methodologies incorporating• Targeted sensors and actuators.
• Feedback-control systems.
• Model-assisted frameworks.

© 2008 IBM CorporationISLPED 200854
Virtualization – Opportunities and Challenges for Power Reduction
Different studies have shown significant under-utilization of compute resources in large data centers.
Virtualization enables multiple low-utilization OS images to occupy a single physical server.• Multi-core processors with virtualization support and large SMP systems provide a growing
infrastructure which facilitates virtualization-based consolidation.
The common expectation is • A net reduction in energy costs.
• Lower infrastructure costs for power delivery and cooling.
However: • Processor capacity is not the only resource workloads need – memory, I/O..
• Workloads on partitions sharing a system might have different power-performance needs.
Isolating and understanding the characteristics and consequent power management needs for each partition is non-trivial, requiring
• Additional instrumentation and monitoring capabilities.
• Augmenting VM managers for coordinating, facilitating or managing power management functions

© 2008 IBM CorporationISLPED 200857
Managing Server Power in a Data Center
http://dilbert.com/strips/comic/2008-02-12http://dilbert.com/strips/comic/2008-02-14

© 2008 IBM CorporationISLPED 200858
Outline
1. Introduction and Background• New focus on power management - why, who, what ?• Understanding the problem
Diverse requirementsWHAT is the problem ?Understanding variability
3. Industry solutions• Sample solutions• In-depth solutions
4. Datacenter • Facilities Management
Anatomy of a datacenter Improving efficiency
2. Power Management Concepts• Basic solutions• Advanced solutions
Building blocks - sensors and actuatorsFeedback-driven and model-assisted
solution design

© 2008 IBM CorporationISLPED 200859
Computer Industry Response
Components
Server
Rack
Data Center
Thermal sensors
Idle modes
DVFS
Liquid cooling
Power measurement
Efficient power supplies
Power capping
Adaptive power savings
Hot-aisle containment
In-rack cooling
Cluster power trending
Virtualization
Efficiency improvements
DC-powered data center
Free cooling
Dynamic Smart Cooling
Mobile data center

© 2008 IBM CorporationISLPED 200860
In-depth Examples
1. Active Energy Manager – for cluster-wide system monitoring and policy management.
2. EnergyScale – for power management of POWER6 systems.

© 2008 IBM CorporationISLPED 200861
IBM Systems Director Active Energy Manager
Provides a single view of the actual power usage across multiple platforms.
Measures, trends, and controls energy usage of all managed systems.
NetworkNetworkService
processor
Rack servers
iPDU
Legacy systems orwithout compatible instrumentation
Management server Blade Enclosures
Management module
X86 bladeCell blade
Power blade
Active Energy Mgr.IBM Systems Director

© 2008 IBM CorporationISLPED 200862
Rack-mount Server Management
Measure and Trend: power, thermals Control: power cap, energy savings

© 2008 IBM CorporationISLPED 200864
Intelligent Power Distribution Unit (iPDU)
User definedreceptacle names
Cumulative use
Current Power
Web interface

© 2008 IBM CorporationISLPED 200865
EnergyScale Elements and Functionality
Thermal / Power measurement
System health monitoring/maintenance
Power/thermal capping
Power saving
Performance-aware power management
Power Modules
Hardware Management
Module
IBM POWER6™
Flexible Service
Processor (FSP)
IBM Director Active Energy Manager
EnergyScale Controller
Power Measurement
Power Measurement
System-level power management
firmware
System-level power management
firmwarePower Modules
EnergyScale

© 2008 IBM CorporationISLPED 200867
EnergyScale Sensors
Reports temperature of air seen by components
System level ambient temperatureDiscrete temperature sensor
Per-controller activity and power management information
DRAM usageDedicated memory controller activity counters
Voltage and current provided for each voltage-rail in the systemTemperature of VRM components
Component/voltage-rail power Voltage Regulation Module (VRM)
Per-core activity informationCore activity and performanceDedicated processor activity counters
Calibrated sensors, accurate, real-time feedback
System and component power On-board power measurement sensors
24 sensors providing real-time timing margin feedback
POWER6 operational stabilityCritical path monitor (internal use)
3 metal thermistors – 1 per core, 1 in nest – analog
POWER6 chip temperatureOn chip analog temperature sensors
24 digital temp. sensitive ring oscillators – 8 per core, 8 in nest
POWER6 chip temperatureOn chip digital temperature sensors (internal use)
DescriptionFeedback OnSensor

© 2008 IBM CorporationISLPED 200868
Temperature Sensors on POWER6
Digital thermal sensors• Quick response time
• Placed in hot-spots identified during simulation and early part characterization
Metal thermistors • Very accurate
• Used in previous designs
• Large area for a 65nm chipCore 1
MC 0 MC 1SMP Coherency
Fabric
Core 0
Source: M. Floyd et al., IBM J. R&D, November 2007

© 2008 IBM CorporationISLPED 200869
EnergyScale Actuators
4 different modes of activity/request throttling
Service processorsMemory Throttling
Based on ambient temperatureService processorsFan Speeds
Per-rank power-down mode enable –FSP/dedicated microcontroller
Memory controllerMemory Standby Modes
Nap/ActiveOS and HypervisorProcessor Standby Modes
6 different modes of pipeline throttling, manageable on a per-core basis
On-chip thermal protection circuitry, service processors
Processor Pipeline Throttling
Variable frequency oscillator control, voltage control for array and logic domains, system-wide
Service processorsDynamic Voltage and Frequency Scaling (DVFS)
DescriptionControlled ByActuator/Mode
Service Processors: FSP and EnergyScale Controller on slide 70

© 2008 IBM CorporationISLPED 200873
Water cooling
41760.6H2O
1.270.0245Air
Volumetric heat capacity[kJ/(m3*K)]
Thermal conductivity[W/(m*K)]
NCAR Bluefire Supercomputer using IBM p575 hydrocluster. Images courtesy of UCAR maintained Bluefire web gallery.
Water-cooled chips

© 2008 IBM CorporationISLPED 200878
Typical Industry Solutions in 2008: Other Related
Neuwing Energy Ventures3rd party verifies energy reduction of facilities.Trade certificates for money on certificate trading market.
Certification for carbon offsets
Amazon: Elastic Compute Cloud (EC2)
Purchase cycles on demand (avoid owning idle resources)On demand
IBM, HP, Sun, and many othersMeasure power/thermal/airflow trends. Use computational fluid dynamics to model data center.
Recommend changes to air flow, equipment placement, etc.
Data center assessment
PG&EEncourage data centers to use less power (e.g. by using virtualization)
Utility rebates
ExampleDescriptionFunction
Solutions shown in example column are representative ones incorporating the specific function/technique. Many of these solutions also provide other functions.
No claim is being made regarding superiority of any example shown over any alternatives.

© 2008 IBM CorporationISLPED 200879
Take Away
There is significant effort from industry on power and temperature management of computer systems
The current intent is not only to make individual components more energy efficient, but:
• Enhance functionality in certain components
• Integrate them into system-level power management solutions

© 2008 IBM CorporationISLPED 200880
Outline
1. Introduction and Background• New focus on power management - why, who, what ?• Understanding the problem
Diverse requirementsWHAT is the problem ?Understanding variability
3. Industry solutions• Sample solutions• In-depth solutions
4. Datacenter • Facilities Management
Anatomy of a datacenterImproving efficiency
2. Power Management Concepts• Basic solutions• Advanced solutions
Building blocks - sensors and actuatorsFeedback-driven and model-assisted
solution design

© 2008 IBM CorporationISLPED 200881
The Data Center Raised Floor
No two are the same

© 2008 IBM CorporationISLPED 200882
A Typical Data Center Raised FloorRacks (computers, storage, tape)
Secured Vault
Fiber Connectivity Terminating on Frame Relay Switch
Network Operating Center
Networking equipment (switches)

© 2008 IBM CorporationISLPED 200883
Power Delivery Infrastructure for a Typical Large Data Center(30K sq ft of raised-floor and above)
Uninterruptible Power Supply (UPS) modules
Transfer panel switch Diesel generators
UPS batteries
Power feed substationDiesel tanks
Several pounds of copper
Power Distribution Unit (PDU)

© 2008 IBM CorporationISLPED 200884
Cooling Infrastructure for a Typical Large Data Center(30K sq ft of raised-floor and above)
Water pumpsComputer Room Air Conditioning (CRAC) units
Cooling towersWater chillers

© 2008 IBM CorporationISLPED 200885
Sample Data Center Energy Consumption Breakdown
Reference: Tschudi, et al., “Data Centers and Energy Use – Let’s Look at the Data”, ACEEE 2003
Fans in the servers already consume 5-20% of the computer load

© 2008 IBM CorporationISLPED 200886
Data Center Efficiency MetricsNeed metrics to indicate energy efficiency of entire facility
• Metrics do not include quality of IT equipment
Most commonly used metrics
powerfacilityTotalpowerequipmentITDCEEfficiencyCenterData
powerequipmentITpowerfacilityTotalPUEessEffectivenUsagePower
=
=
)(
)(
0.00.51.01.52.02.53.0
1 2 3 4 5 6 7 8 9 10 11 12 14 16 17 18 19 20 21 22Data Center number
Pow
er U
sage
Ef
fect
iven
ess
(PU
E)
Reference: Tschudi, et al., “Measuring and Managing Data Center Energy Use”, 2006
Study of 22 sample data centers
Minimum PUE
Fallacy: Cooling power = IT power.
Reality: Data center efficiency varies.

© 2008 IBM CorporationISLPED 200887
Outline
1. Introduction and Background• New focus on power management - why, who, what ?• Understanding the problem
Diverse requirementsWHAT is the problem ?Understanding variability
3. Industry solutions• Sample solutions• In-depth solutions
4. Datacenter • Facilities Management
Anatomy of a datacenterImproving efficiency
2. Power Management Concepts• Basic solutions• Advanced solutions
Building blocks - sensors and actuatorsFeedback-driven and model-assisted
solution design

© 2008 IBM CorporationISLPED 200888
Data Center Power Distribution

© 2008 IBM CorporationISLPED 200889
Maintainability and Availability vs. Energy Efficiency
Distributing power across a large area requires a decentralized/hierarchical architecture
• Power transformers (13.2 kV to 480 V or 600 V)
• Power distribution units (PDU)
• And a few miles of copper
Maintaining the uptime of a data center requires the use of redundant components
• Uninterrupted Power Supplies (UPS)
• Emergency Power Supply (EPS) – e.g. diesel power generators
• Redundant configurations (N+1, 2N, 2(N+1), …) to guarantee power and cooling for IT equipment
Both introduce energy losses
© 2008 IBM CorporationISLPED 200890
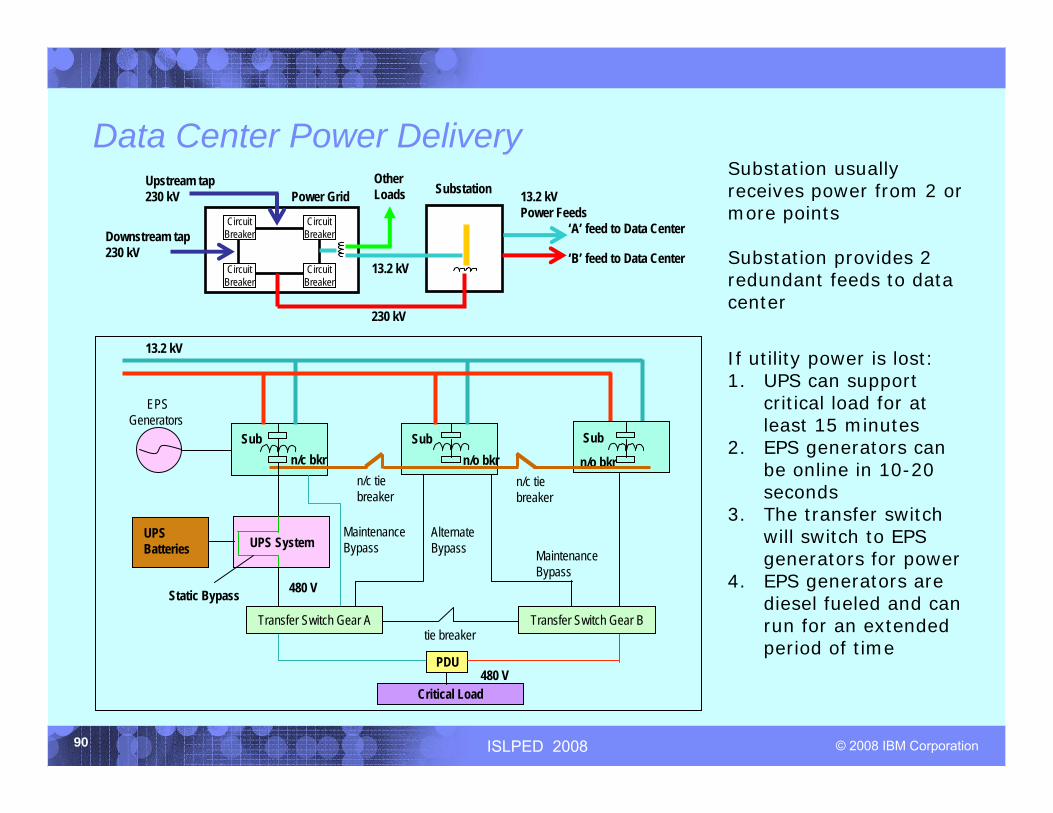
Data Center Power Delivery
If utility power is lost:1. UPS can support
critical load for at least 15 minutes
2. EPS generators can be online in 10-20 seconds
3. The transfer switch will switch to EPS generators for power
4. EPS generators are diesel fueled and can run for an extended period of time
230 kV
CircuitBreaker
Power Grid
Downstream tap230 kV
SubstationOtherLoads
13.2 kV
‘A’ feed to Data Center
‘B’ feed to Data Center
Upstream tap230 kV 13.2 kV
Power Feeds
CircuitBreaker
CircuitBreaker
CircuitBreaker
Substation usually receives power from 2 or more points
Substation provides 2 redundant feeds to data center
Sub Sub Subn/c bkr n/o bkr n/o bkr
n/c tiebreaker
n/c tiebreaker
EPS Generators
UPS SystemUPS Batteries
PDU
Critical Load
AlternateBypass
MaintenanceBypass
tie breaker
MaintenanceBypass
Static Bypass
Transfer Switch Gear A Transfer Switch Gear B
13.2 kV
480 V
480 V

© 2008 IBM CorporationISLPED 200891
Power Distribution(2)
98 - 99%UPS(1)
88 - 92%Power Supply(3,4)
55 - 90% DC/DC(5)
78% - 93%
The heat generated from the losses at each step of power conversion requires additional cooling power
Data Center Power Conversion Efficiencies
(1) http://hightech.lbl.gov/DCTraining/graphics/ups-efficiency.html
(2) N. Rasmussen. “Electrical Efficiency Modeling for Data Centers”, APC White Paper, 2007
(3) http://hightech.lbl.gov/documents/PS/Sample_Server_PSTest.pdf
(4) “ENERGY STAR® Server Specification Discussion Document”, October 31, 2007.
(5) IBM internal sources

© 2008 IBM CorporationISLPED 200893
Stranded power in the data centerData center must wire to nameplate powerHowever, real workloads do not use that much powerResult: available power is stranded and cannot be usedExample: IBM HS20 blade server – nameplate power is 56 W above real workloads.
0
50
100
150
200
250
300
350
idle
gzip
-1vp
r-1
gcc-
1m
cf-1
craf
ty-1
pars
er-1
eon-
1pe
rlbm
k-1
gap-
1vo
rtex-
1bz
ip2-
1tw
olf-1 wup
swim
-1m
grid
-1ap
plu-
1m
esa-
1ga
lgel
-1ar
t-1eq
uake
-1fa
cere
c-1
amm
p-1
luca
s-1
fma3
d-1
sixt
rack
-1ap
si-1
gzip
-2vp
r-2
gcc-
2m
cf-2
craf
ty-2
pars
er-2
eon-
2pe
rlbm
k-2
gap-
2vo
rtex-
2bz
ip2-
2tw
olf-2 wup
swim
-2m
grid
-2ap
plu-
2m
esa-
2ga
lgel
-2ar
t-2eq
uake
-2fa
cere
c-2
amm
p-2
luca
s-2
fma3
d-2
sixt
rack
-2ap
si-2
SPEC
JBB
LIN
PAC
Kna
mep
late
Serv
er P
ower
(W)
Nameplate power: 308 WStranded power: 56 W
Real workload maximum
Source: Lefurgy, IBM

© 2008 IBM CorporationISLPED 200894
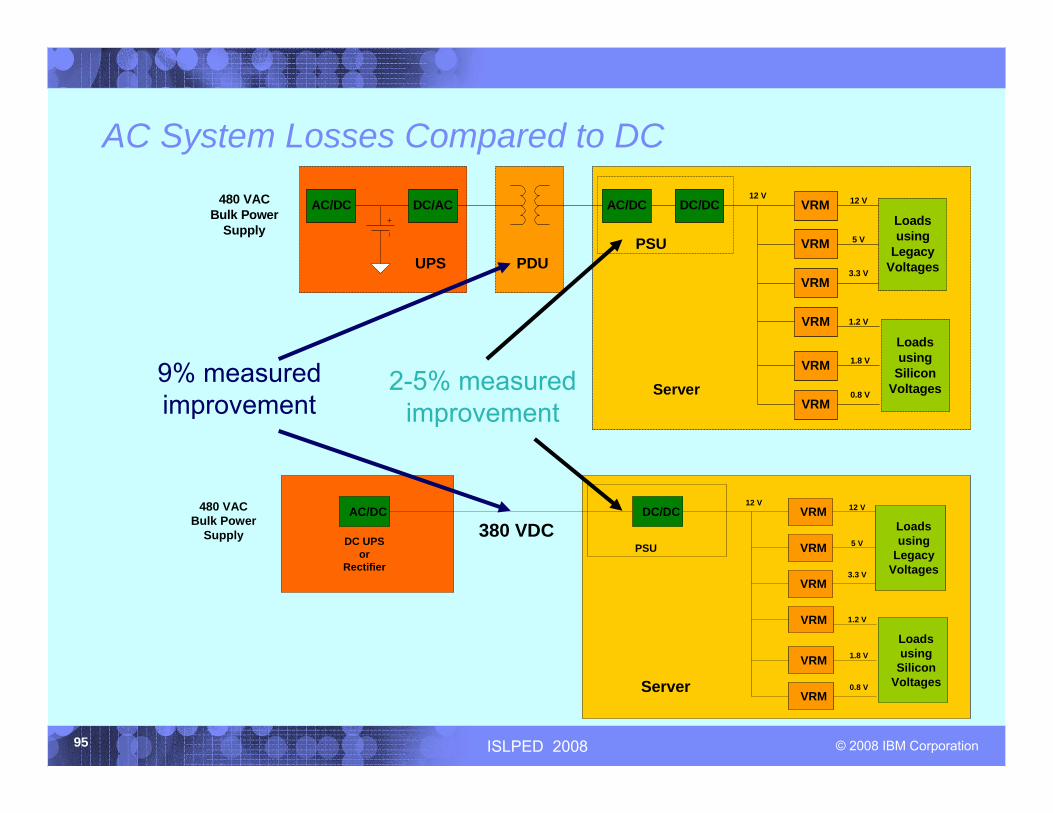
Data Center Direct Current Power Distribution
Goal:• Reduce unnecessary conversion losses
Approach:• Distribute power from the substation to the rack as DC• Distribute at a higher voltage than with AC to address voltage
drops in transmission lines
Challenges:• Requires conductors with very low resistance to reduce losses• Potential changes to server equipment
Prototype:• Sun, Berkeley Labs and other partners.
(1) http://hightech.lbl.gov/dc-powering/
© 2008 IBM CorporationISLPED 200895
AC/DC480 VACBulk Power
Supply DC UPSor
Rectifier
DC/DC VRM
VRM
VRM
VRM
VRM
VRM
12 V
Loadsusing
LegacyVoltages
Loadsusing
SiliconVoltages
12 V
5 V
3.3 V
1.2 V
1.8 V
0.8 VServer
PSU380 VDC
AC System Losses Compared to DC
DC/ACAC/DC480 VACBulk Power
Supply
UPS PDU
AC/DC DC/DC VRM
VRM
VRM
VRM
VRM
VRM
12 V
Loadsusing
LegacyVoltages
Loadsusing
SiliconVoltages
12 V
5 V
3.3 V
1.2 V
1.8 V
0.8 VServer
PSU
9% measured improvement
2-5% measured improvement

© 2008 IBM CorporationISLPED 200896
Typical Industry Solutions in 2008: Power Consumption
Validus DC SystemsUse DC power for equipment and eliminate AC-DC conversion.DC-powered data center
AMD: PowerNow, Intel: Enhanced Speedstep
Enable control of power-performance trade-offs for individual components in the system.
Component-level control
VMware: ESX ServerConsolidate computing resources for increased efficiency and freeing up idle resources to be shutdown or kept in low-power modes.
Virtualization
Cassatt: Active ResponseTurn off servers when idle. Based on user-defined policies (load, time of day, server interrelationships)
Power off
IBM: POWER6 EnergyScalePerformance-aware modeling to enable energy-savings modes with minimal impact on application performance.
Energy savings
IBM: Active Energy ManagerSet power consumption limit for individual servers to meet rack/enclosure constraints.
Power capping
HP: server power supplies that monitor power
Servers with built-in sensors measure power, inlet temperature, outlet temperature.
Measurement
Sun: Sim DatacenterEstimate power/thermal load of system before purchaseConfigurator
ExampleDescriptionFunction
Solutions shown in example column are representative ones incorporating the specific function/technique. Many of these solutions also provide other functions.
No claim is being made regarding superiority of any example shown over any alternatives.

© 2008 IBM CorporationISLPED 200897
Data Center Cooling

© 2008 IBM CorporationISLPED 200899
Thermodynamic part of cooling:Hot spots (high inlet temperatures) impact CRAC efficiency (~ 1.7% per oF)
Transport part of cooling:Low CRAC utilization impacts CRAC blower efficiency (~3 kW/CRAC)
Raised Floor Cooling
Source: Hendrik Hamann, IBM

© 2008 IBM CorporationISLPED 2008100
Impact of Raised Floor Air Flow on Server PowerWhen there is not enough cold air coming from the perforated tiles
• Air pressure drops in front of the machine
• Servers fans need to work harder to get cold air across its components.
• Additionally, hot air can create a high pressure area, and overflow into the cold aisle
Basic experiment• Create enclosed micro-system –rack, 2 perforated tiles and path to CRAC
• Linpack running on single server in bottom half of the rack, other servers idle.
• Adjust air flow from perforated tiles
300305310315320325330335340
0 100 200 300
Air flow at perf tile (CFM)
Syst
em P
ower
(W)
Source: J. Rubio, IBM

© 2008 IBM CorporationISLPED 2008101
Air Flow ManagementEquipment
• Laid out to create hot and cold aisles
Tiles• Standard tiles are 2’ x 2’
• Perforated tiles are placed according to amount of air needed for servers
• Cold aisles usually 2-3 tiles wide
• Hot aisles usually 2 tiles wide
Under-floor• Floor cavity height sets total cooling capability
• 3’ height in new data centers
Reference: R. Schmidt, “Data Center Airflow: A Predictive Model”, 2000
B1x10 tiles
1x10 tiles1x10 tilesA

© 2008 IBM CorporationISLPED 2008105
Modeling the Data CenterComputational Fluid Dynamics (CFD)
•Useful for initial planning phase and what-if scenarios
•Input parameters such as rack flows, etc. are very difficult/expensive to come by (garbage in – garbage out problem).
•Coupled partial differential equations require long-winding CFD calculations
Measurement-based•Find problems in existing data centers
•Measure the temperature and air flow throughout the data center
•Highlights differences between actual data center and the ideal data center modeled by CFD

© 2008 IBM CorporationISLPED 2008106
Analysis for Improving Efficiencies, MMT
12.6oC
36.0oC
-19oC
9oC
(a) CFD model results @ 5.5 feet (b) Experimental data @ 5.5 feet
(c ) Difference between model and data
Temperature legend for model and data
contours
Temperature legend for model and
data contours
12.6oC
36.0oC
-19oC
9oC
(a) CFD model results @ 5.5 feet (b) Experimental data @ 5.5 feet
(c ) Difference between model and data
Temperature legend for model and data
contours
Temperature legend for model and
data contours
Source: Hendrik Hamann, IBM

© 2008 IBM CorporationISLPED 2008107
#1:flow control
min
max
#4:flow control(overprovisoned)
#5: hotair
#6:Hot/cold Aisle problem
#8: intermixing
#10: CRAC layout
#3:leak#2:racklayout
#9:recirculation
#7: layoutProblems !
Source: Hendrik Hamann, IBM
Typical Data Center Raised Floor

© 2008 IBM CorporationISLPED 2008108
HP Dynamic Smart CoolingDeploy air temperature sensor(s) on each rack
Collect temperature readings at centralized location
Apply model to determine setting of CRAC fans to maximize cooling of IT equipment
Challenges:• Difficult to determine impact of particular CRAC(s) on temperature of a given rack –using offline principal component analysis (PCA) and online neural networks to assist logic engine
• Requires CRACs with variable frequency drives (VFD) – not standard in most data centers, but becoming available with time.
(1) C. Bash, C. Patel, R. Sharma, “Dynamic Thermal Management of Air Cooled Data Centers”,HPL-2006-11, 2006
(2) L. Bautista and R. Sharma, “Analysis of Environmental Data in Data Centers”, HPL-2007-98, 2007(3) http://www.hp.com/hpinfo/globalcitizenship/gcreport/energy/casestudies.html
10,5009,1005,300Estimated MWh saved
15%30%40%Energy savings (% of cooling costs)
>35K sq ft30K sq ft10K sq ftTypical size
Large(air and
chilled water cooling)
Medium(air and
chilled water cooling)
Small(air cooling)Category

© 2008 IBM CorporationISLPED 2008109
Commercial Liquid Cooling Solutions for RacksPurpose:
• Localized heat removal – attack it before it reaches the rest of the computer room
• Allows us to install equipment with high power densities in a room not designed for it
Implementation:• Self-contained air cooling solution(water or glycol for taking heat from the air)
• Air movement
Types:• Enclosures – create cool microclimate for selected ‘problem’ equipment
• Sidecar heat exchanger – to address rack-level hotspots without increasing HVAC load
(1) “Liebert XDF™ High Heat-Density Enclosure with Integrated Cooling”,
http://www.liebert.com/product_pages/ProductDocumentation.aspx?id=40
(2) “APC InfraStruXure InRow RP Chilled Water”,
http://www.apcc.com/resource/include/techspec_index.cfm?base_sku=ACRP501
Liebert XDF™Enclosure (1)
APC InfraStruXureInRow RP (2)

© 2008 IBM CorporationISLPED 2008110
Chilled Water System
Two separate water loops
Chilled water (CW) loop• Chiller(s) cool water which is used by CRAC(s) to cool down the air
• Chilled water usually arrives to the CRACs near 45°F-55°F
Condensation water loop• Usually ends in a cooling tower
• Needed to remove heat out of the facilities
CRAC
CW pump
Condensation water pump
Cooling tower
Chiller
Sample chilled water circuit

© 2008 IBM CorporationISLPED 2008111
Air-Side and Water-Side Economizers (a.k.a. Free Cooling)Air-side Economizer (1)
• A control algorithm that brings in outside air when it is cooler than the raised floor return air• Needs to consider air humidity and particles count• One data center showed reduction of ~30% in cooling power
Water-side Economizer (2)
• Circulate chilled water (CW) thru an external cooling tower (bypassing the chiller) when outside air is significantly cold
• Usually suited for climates that have wetbulb temperatures lower than 55°F for 3,000 or more hours per year, and chilled water loops designed for 50°F and above chilled water
Thermal energy storage (TES) (3)
• Create chilled water (or even ice) at night.• Use to assist in generation of CW during day, reducing overall electricity cost for cooling• Reservoir can behave as another chiller, or be part of CW loop
(1) A. Shehabi, et al. “Data Center Economizer Contamination and Humidity Study”, March 13, 2007. http://hightech.lbl.gov/documents/DATA_CENTERS/EconomizerDemoReportMarch13.pdf
(2) Pacific Gas & Electric, “High Performance Data Centers: A Design Guidelines Sourcebook”, January 2006. http://hightech.lbl.gov/documents/DATA_CENTERS/06_DataCenters-PGE.pdf
(3) “Cool Thermal Energy Storage”, ASHRAE Journal, September 2006

© 2008 IBM CorporationISLPED 2008116
Typical Industry Solutions in 2008: Cooling
IBM ice storageGenerate ice or cool fluid with help of external environment, orwhile energy rates are reduced
Cooling storage
Emerson Network Power: Liebert XD products
Sidecar heat exchange uses water/refrigerant to optimize hot/cold aisle air flow. Closed systems re-circulate cooled air in the cabinet, preventing mixing with room air.
Sidecar heat exchange
American Power Conversion Corp.
Close hot aisles to prevent mixing of warm and cool air. Add doors to ends of aisle and ceiling tiles spanning over aisle.
Hot aisle containment
HP: Dynamic Smart CoolingControl inlet/outlet temperature of racks by regulating CRAC airflow. Model relationship between individual CRAC airflow and rack temperature.
Air flow regulation
Wells Fargo & Co. data center in Minneapolis
Use cooling tower to produce chilled water when outside air temperature is favorable. Turn off chiller’s compressors.
Cooling economizers
Sun: Project BlackboxDesign data center for high-density physical requirements. Data center in a shipping container.
Airflow goes rack-to-rack, with heat exchangers in between.
Modular data center
ExampleDescriptionFunction
Solutions shown in example column are representative ones incorporating the specific function/technique. Many of these solutions also provide other functions.
No claim is being made regarding superiority of any example shown over any alternatives.

© 2008 IBM CorporationISLPED 2008125
Next generation solutions – Component to Datacenter
Fine-grained, faster clock scaling
Hardware Acceleration
Enhanced processor idle
states
Power-aware micro-
architecture
On-chip power
measurement
Dynamic and deterministic performance
boost
Enhanced memory power
modes
Power-aware virtualization for
resource and server
consolidation
Integrated fan control for thermal
management
Partition-level power
management
Power-aware workload
management
Datacenter modeling and optimization
Combined firmware-OS
power management
Integrated IT and facilities management
PowerShifting
Process Technologies
© 2008 IBM CorporationISLPED 2008127
ConclusionThere is lot of work going on in the industry and academia to address power and cooling issues – its a very hot topic !
Much of it has been done in the last few years and we’re nowhere near solving all the issues.
Scope of the problem is vast from thermal failures of individual components to efficiency of data centers and beyond.
There is no silver bullet – the problem has to be attacked right from better manufacturing technologies to coordinated facilities and IT management.
Key lies in adaptive solutions that are real-time information driven, and incorporate adequate understanding of the interplay between diverse requirements, workloads and system characteristics.