Power Factor #3. Measuring Leads and Measuring Exhibiting ...
13
ProMat Managing Leads and Measuring Results Webinar Workbook Copyright 2017. Competitive Edge and MHI. All rights reserved. No portion of this workbook may be reproduced without permission of Competitive Edge. For questions or permission call 800-700-6174 or 704-814-7355. Power Factor #3. Measuring Leads and Measuring Exhibiting Results How to Improve Lead Quality, Sales Conversion and Measure Performance and ROI Custom Present Webinar Discussion Points 1. Best practices for lead management 2. Lead management metrics 3. Four generations of lead capture devices 4. Overview of ProMat’s lead retrieval system 5. How to customize your lead capture devise or use a Lead Card 6. Tradeshow performance and financial metrics 7. How to create an Exhibiting Performance & ROI report
Transcript of Power Factor #3. Measuring Leads and Measuring Exhibiting ...

ProMat
Managing Leads and Measuring Results Webinar Workbook
Copyright 2017. Competitive Edge and MHI. All rights reserved.
No portion of this workbook may be reproduced without permission of Competitive Edge.
For questions or permission call 800-700-6174 or 704-814-7355.
Power Factor #3.
Measuring Leads and
Measuring Exhibiting Results
How to Improve Lead Quality,
Sales Conversion and Measure
Performance and ROI
Custom
Present
Webinar Discussion Points
1. Best practices for lead management
2. Lead management metrics 3. Four generations of lead capture devices 4. Overview of ProMat’s lead retrieval system
5. How to customize your lead capture devise or use a Lead Card
6. Tradeshow performance and financial metrics
7. How to create an Exhibiting Performance & ROI report

ProMat
Managing Leads and Measuring Results Webinar Workbook
Copyright 2017. Competitive Edge and MHI. All rights reserved.
No portion of this workbook may be reproduced without permission of Competitive Edge.
For questions or permission call 800-700-6174 or 704-814-7355.
About the Expert Presenter Jefferson Davis, President, Competitive Edge
The Tradeshow Turnaround Artisttm
Jefferson is President of Competitive Edge, a highly-specialized consulting
and training firm on a mission to inspire, lead and direct businesses on
how to more effectively use exhibiting to visibly support core business
objectives and generate measurable financial value, far beyond cost.
His mission is achieved by challenging companies to re-evaluate limiting perspectives about exhibiting and by
getting them focused on precision execution of five critical exhibiting success factors.
Jefferson is a results-focused, process-based, passionate visionary and creator of game changing exposition
industry programs including: the acclaimed Tradeshow Turnaround Program, E3 Exhibiting Effectiveness
Evaluation program, Exhibitor Success & ROI Center program.
His Tradeshow Turnaround philosophy and practices are the exposition industry’s definitive guide to quickly
turning tradeshows from “expensive appearances” to “productive, profitable investments.”
Over the course of 30 years of on the floor exhibiting experience, he’s identified a clear set of empowering
results-focused perspectives, and backed them up with specific, process-based strategic practices, his training
and consulting services have helped clients generate over $750,000,000 in combined results.
No other tradeshow consulting or training firm can speak to results like this.
Jefferson’s client list read like a “who’s, who” list in the exposition industry. Since 1991, he’s been selected as the
tradeshow expert of choice by over 270 Association and for-profit show organizers. He’s a faculty member of
EXHIBITOR Show. He’s delivered over 500 live seminars and workshops, over 700 webinars reaching over
250,000 exhibitors, and his E3 team has evaluated over 18,500 exhibits in action.
Jefferson’s corporate clients span almost every industry and have included industry leaders like Alcoa, AMX,
Aramco Services Company, Assurant Property Services, BOC Gases, Brivo Systems, Corporate Express,
Covidien, Doosan Portable Power, Egemin Automation, Enshu USA, Essilor, Heidelberg, Honeywell, Huber
Technologies, Jungheinrich Lift Trucks/MCFA, McLanahan, McQuay International, Merial, Merz Asthetics,
Nestle-Purina, Ocean Mist Farms, Panasonic, Parker-Hannifin, PCCA, Reichert Ophthalmic, Scholle,
SteelKing, Tennant Company, Tesco, Trelleborg Life Sciences and Wheel Systems, US Surgical, Yale/Hyster
and many, many more.
Jefferson is available on a very limited basis to personally help companies implement the Tradeshow Turnaround philosophy and
practices. Call 800-700-6174 in the US or 704-814-7355

ProMat
Managing Leads and Measuring Results Webinar Workbook
Copyright 2017. Competitive Edge and MHI. All rights reserved.
No portion of this workbook may be reproduced without permission of Competitive Edge.
For questions or permission call 800-700-6174 or 704-814-7355.
1. How important are leads to the success of your exhibit program?
Critical Important Somewhat Important Not Important
2. Do you…
a. Set specific lead goals? Yes No Unsure
b. Have a clear qualification/grading process?Yes No Unsure
c. Capture leads? Yes No Unsure
If yes, how? _____________________
d. Track lead follow-up and sales conversion? Yes No Unsure
CEIR Exhibitor ROI & Performance
Metrics Practices (2015) Lead Management
Leads #1 reason for exhibiting (68%)
Support Top 3 Exhibiting ROI Metrics
Sales Revenue/Exhibiting Cost
Potential Sales Revenue/Exhibiting Cost
Cost Per Lead
Return on Investment
Metric #1. Sales Revenue/Exhibiting Cost
Example Participant
• Traceable Sales Revenue to Show Leads $45,000 $____________
• (/) Exhibiting Investment $15,000 $____________
• Return-on-Investment* $3 to $1 ROI $____________
Return on Investment
Metric #2. Potential Sales Revenue/Exhibiting Cost
• Qualified Leads 20 _____________
• (x) Average Sale Amount $5,000 $____________
• Potential Lead Revenue Value $100,000 $____________
• (/) Exhibiting Investment $15,000 $____________
• Potential ROI from Leads $8 to $1 $____________
*This example calculation is not a promise of a
specific ROI, but simply an illustration of a method
for calculating exhibiting ROI.
ProMat
Managing Leads and Measuring Results Webinar Workbook
Copyright 2017. Competitive Edge and MHI. All rights reserved.
No portion of this workbook may be reproduced without permission of Competitive Edge.
For questions or permission call 800-700-6174 or 704-814-7355.
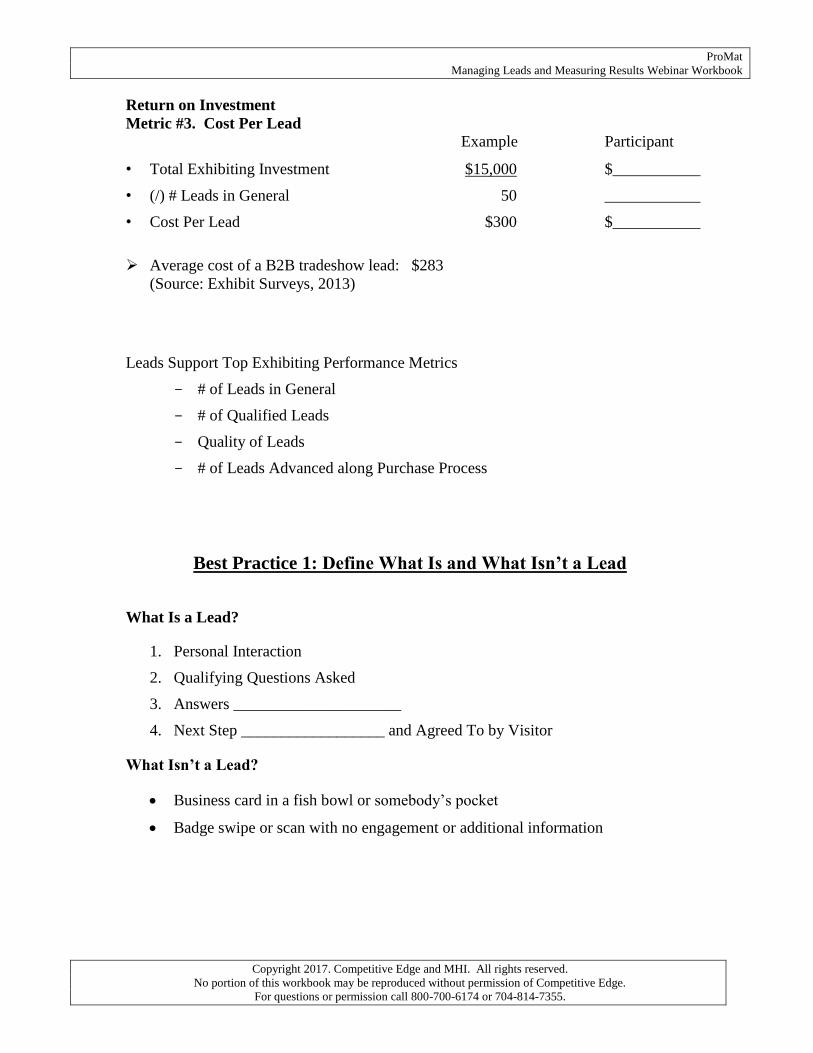
Return on Investment
Metric #3. Cost Per Lead
Example Participant
• Total Exhibiting Investment $15,000 $___________
• (/) # Leads in General 50 ____________
• Cost Per Lead $300 $___________
Average cost of a B2B tradeshow lead: $283
(Source: Exhibit Surveys, 2013)
Leads Support Top Exhibiting Performance Metrics
# of Leads in General
# of Qualified Leads
Quality of Leads
# of Leads Advanced along Purchase Process
Best Practice 1: Define What Is and What Isn’t a Lead
What Is a Lead?
1. Personal Interaction
2. Qualifying Questions Asked
3. Answers _____________________
4. Next Step __________________ and Agreed To by Visitor
What Isn’t a Lead?
Business card in a fish bowl or somebody’s pocket
Badge swipe or scan with no engagement or additional information

ProMat
Managing Leads and Measuring Results Webinar Workbook
Copyright 2017. Competitive Edge and MHI. All rights reserved.
No portion of this workbook may be reproduced without permission of Competitive Edge.
For questions or permission call 800-700-6174 or 704-814-7355.
Best Practice 2: Set Realistic Lead Goals
Exhibit Interaction Capacity formula calculates the number of face-to-face interactions you can execute in your exhibit.
Use Exhibit Interaction Capacity formula to Set Lead Goals:
Example Participant
# of exhibiting hours 26 26
# of booth staff x 3* x_______
Total staff hours 78 ________
Interactions/hr/staffer x 4** x_______
Total target interactions 312 ________
% of visitors to lead x.25 x_______
Lead goal 78 ________
* 50 sq. feet/staffer ** 3/conservative, 4/moderate, 5/aggressive
Performance Metric:
Track Lead Goal/Actual and Quality
Lead Goal 52
Total Leads Captured 50
Achievement 96% of goal
A Leads 45% or 23
B Leads 40% or 20
C Leads 15% or 7

ProMat
Managing Leads and Measuring Results Webinar Workbook
Copyright 2017. Competitive Edge and MHI. All rights reserved.
No portion of this workbook may be reproduced without permission of Competitive Edge.
For questions or permission call 800-700-6174 or 704-814-7355.
Best Practice 3: Track Lead Goal/Actual Daily or End of Shifts
Best Practice 4: Develop & Use a Lead Grading Matrix
CEIR Exhibitor ROI & Performance
Metrics Practices (2015) Lead Management
82% of exhibitors qualify leads
____% at-show
____% post-show
On average, 2 of 5 leads match qualification criteria
60% track lead management and conversion
49% CRM
21% Sales/Lead Tracking systems
17% Spreadsheets
On average, ______ of 5 leads convert to sales

ProMat
Managing Leads and Measuring Results Webinar Workbook
Copyright 2017. Competitive Edge and MHI. All rights reserved.
No portion of this workbook may be reproduced without permission of Competitive Edge.
For questions or permission call 800-700-6174 or 704-814-7355.
Best Practice 5: Determine the Best Information to Capture to Qualify Leads
* Typical information areas might include:
Email Address
Product Interest & Level of Interest
Buying Role and/or Influence
Evaluation and/or Decision Team
Competitors Buying From or Looking At
Purchase Timeframe or Season
Next Action Step
Other?
* Customize your lead capture device to make sure you capture this information!
Four Generations of Lead Capture Devices
1. Collect business cards
2. Use a paper lead form
3. Use show lead capture system
Customize with qualifiers
4. Buy a universal lead capture system
Be sure to discuss with show’s lead capture
company to determine how to capture encrypted data
Official Show Lead Retrieval Vendor
Expo Logic
For Assistance Contact:
[email protected] OR (980) 233-3777
Order ONLINE on or before March 3, 2017 to save!
HTTPS://WWW.TRADESHOWREGISTRAR.COM/LR/?EVENT=PM17LR

ProMat
Managing Leads and Measuring Results Webinar Workbook
Copyright 2017. Competitive Edge and MHI. All rights reserved.
No portion of this workbook may be reproduced without permission of Competitive Edge.
For questions or permission call 800-700-6174 or 704-814-7355.

ProMat
Managing Leads and Measuring Results Webinar Workbook
Copyright 2017. Competitive Edge and MHI. All rights reserved.
No portion of this workbook may be reproduced without permission of Competitive Edge.
For questions or permission call 800-700-6174 or 704-814-7355.
Best Practice 6: Customize Lead Capture Device or Use a Lead Card
Best Practice 7: Get Your Sales Team and/or Distributors
to Support Your Lead Management Process
1. Communicate how you are improving lead ________________
2. Calculate and share your Cost Per Lead
3. Set three firm lead reporting dates
4. Consider contests to build accountability
5. Consider charging for leads to dealers/distributors who don’t follow-up or report
Best Practices for Lead Response Management
1. Speed of response – fast information delivery equals higher conversion rate
2. Best days to make follow-up calls: __________________ and Thursday
3. Best times to make follow-up calls: Between _____ pm and ______ pm
4. Average follow-up stops after two attempts.
5. Persistence – by making a few more call attempts, you can increase contact and conversion
rate by 70%
Source: Harvard Business Review

ProMat
Managing Leads and Measuring Results Webinar Workbook
Copyright 2017. Competitive Edge and MHI. All rights reserved.
No portion of this workbook may be reproduced without permission of Competitive Edge.
For questions or permission call 800-700-6174 or 704-814-7355.
Best Practices for Lead Follow-Up
1. Prepare lead follow-up plan by priority _____________ show.
2. Follow-up FAST or in line with visitor request.
3. Plan for 6 to 12 touches over the next 3 to 6 months.
4. Integrate multiple media:
Telephone
Social media
In-person visits
5. Deliver real value… don’t just sell!
Social media posts and groups
_________________
Checklists
Case Studies
Industry Intelligence Reports
Tradeshow Performance & Financial Metrics
1. Exhibit Interaction Capacity/Utilization
2. Exhibit Attraction Efficiency
3. Cost Per Interaction (CPI)
4. Cost Per Lead (CPL)
5. Lead Goal, Quantity and Quality
6. Potential Value of Leads Captured
7. Hard Dollar ROI
8. Soft Dollar ROI

ProMat
Managing Leads and Measuring Results Webinar Workbook
Copyright 2017. Competitive Edge and MHI. All rights reserved.
No portion of this workbook may be reproduced without permission of Competitive Edge.
For questions or permission call 800-700-6174 or 704-814-7355.
Tradeshow Performance & Financial Metrics
Example Participant
1. Exhibit Interaction Capacity/Utilization
Exhibiting Hours 26 _____________
Times Full-Time Exhibit Staff 3 _____________
Total Staff Hours 78 _____________
Times Interactions per Hour per Staffer 3-5 * _____________
Exhibit Interaction Capacity 234-390 _____________
* 3 conservative/4 moderate/5 aggressive
Actual # of Exhibit Interactions 206
Divide by Exhibit Interaction Capacity 275 _____________
Exhibit Capacity Utilization 75% _____________
Target: 80 to 100%
2. Exhibit Attraction Efficiency
Actual # of Exhibit Interactions 206 _____________
Divide by Profile Matches in
Show Audience 550 _____________
Company Type, Job function/Title, Geography
Exhibit Attraction Efficiency 37% _____________
Benchmark: 45% (Source: Exhibit Surveys)
3. Cost Per Interaction (CPI)
Total Exhibiting Investment $15,000 $____________
Divide by # of Interactions 206 _____________
Cost Per Interaction $73 $____________
Average cost of field sales call: $596 (Source: CEIR, 2009)
Setting Exhibiting ROI Targets
GOOD: 1-1 payback or 100% ROI
BETTER: 3-5 payback or 300-500% ROI
BEST: As high as you can go!

ProMat
Managing Leads and Measuring Results Webinar Workbook
Copyright 2017. Competitive Edge and MHI. All rights reserved.
No portion of this workbook may be reproduced without permission of Competitive Edge.
For questions or permission call 800-700-6174 or 704-814-7355.
Two Types of ROI
Hard Dollar ROI: _______________ received that can be credited in full or in part to the
show, typically in the form of at-show and/or post-show sales.
Can be measured in top line revenue or gross margin.
Soft Dollar ROI: ________________ received that can be quantified/expressed in numeric
terms, typically in the form of money saved.
Cost Per Interaction Soft Dollar ROI Contribution Formula & Example*
Example Participant
Total Exhibiting Investment $ 15,000 $____________
Divide by # of Exhibit Interactions 206 _____________
Cost Per Interaction $73 $____________
Comparative (Field Sales Call) $596 $____________
Less Cost Per Interaction -$ 73 $____________
CPI Savings $523 $____________
Times # of Interactions x 206 _____________
Soft Dollar ROI Contribution $107,738=718%SD/ROI $____________
*These sample calculations are not a promise of a specific ROI, but simply an illustration of a method for calculating exhibiting ROI.

ProMat
Managing Leads and Measuring Results Webinar Workbook
Copyright 2017. Competitive Edge and MHI. All rights reserved.
No portion of this workbook may be reproduced without permission of Competitive Edge.
For questions or permission call 800-700-6174 or 704-814-7355.
Sections to Include In Your Exhibiting Performance & ROI Report
1. General Show Information
2. Exhibiting Objectives Set and Progress Made Toward
3. Exhibit Interaction Capacity/Utilization - Cost Per Interaction
4. Leads: Goal/Actual, Cost Per Lead, Potential Value of Leads
5. Pre & At-Show Marketing: Media, Reach/Response and Effectiveness
6. Public Relations and Media Exposure
7. Exhibit Design and Effectiveness
8. Demonstrations/Presentations
9. Hospitality and Sponsored Events
10. Key Customers and VIPs Met
11. Competitive Summary
12. Show Budget vs Actual w/Benchmarks and R.O.I.
13. Lessons Learned & Recommendations for Next Show
What were the three most important ideas you learned in this webinar?
1. ________________________________________________________
2. ________________________________________________________
3. ________________________________________________________
MHI’s Commitment to Exhibitor Education & Success
ShowPro Pre-show Exhibitor Webinar Series
Fast Track to ProMat Exhibiting Success
Selective Attraction: January 4, 2017
Managing Your Visitor’s Experience: January 24, 2017
Managing Leads & Measuring Results: February 16, 2017
ShowPro Live Exhibitor Workshop
Held in Atlanta, December 7, 2016
To access presenters’ PowerPoint slides, please visit the Show Pro website:
http://www.promatshow.com/showpro/