POWER EFFICIENT HYDRAULIC · PDF fileaircraft performance through the use of power efficient...
240
NADC-88066-60 oU; i; F P" POWER EFFICIENT HYDRAULIC SYSTEMS 00 ~Volume I o STUDY PHASE Rockwell oi' International North American Aircraft 4300 East Fifth Avenue P.O. Box 1259 Columbus, Ohio 43216 JULY 1988 Final Report for Period October 1985-July 1988 OTC Approved for Public Release Distribution Unlimited Prepared For NAVAL AIR DEVELOPMENT CENTER Aircraft and Crew Systems Technology Directorate Warminster, PA 18974 89 1 30 058
Transcript of POWER EFFICIENT HYDRAULIC · PDF fileaircraft performance through the use of power efficient...

NADC-88066-60 oU; i; F P"
POWER EFFICIENTHYDRAULIC SYSTEMS
00 ~Volume I
o STUDY PHASE
Rockwelloi' International
North American Aircraft4300 East Fifth AvenueP.O. Box 1259Columbus, Ohio 43216
JULY 1988
Final Report for Period October 1985-July 1988
OTCApproved for Public Release
Distribution Unlimited
Prepared For
NAVAL AIR DEVELOPMENT CENTERAircraft and Crew Systems Technology Directorate
Warminster, PA 18974
89 1 30 058

UNCLASSIFIEDSECURITY CLASSIFICATION OF THIS PAGE
REPORT DOCUMENTATION PAGE1I. REPORT SECURITY CLASSIFICATION lb. RESTRICTIVE MARKINGS
UNCLASSIFIED N/A2.. SECURITY CLASSIFICATION AUTHORITY 3. DISTRIBUTIONIAVAILABILITY OF REPORT
Approved for Public Release; Distribution2b. DECLASSIFICATIONIDOWNGRADING SCHEDULE Unlimited
4. PERFORMING ORGANIZATION REPORT NUMBER(S) 5. MONITORING ORGANIZATION REPORT NUMBER(S)
NA-88-O001 NADC-88066-60
6. NAME OF PERFORMING ORGANIZATION 6b. OFFICE SYMBOL 7&. NAME OF MONITORING ORGANIZATIONROCKWELL INTERNATIONAL CORP. (Irapplicable)
North American Aircraft Operalions --- Naval Air Development Center 60613
6c. ADDRESS (City. State and ZIP Code) 7b. ADDRESS (City. Stale and ZIP Code)4300 East Fifth AvenueColumbus, OH 43216 Warminster, PA 18974
Be. NAME OF FUNDINGSPONSORING Sb. OFFICE SYMBOL 9. PROCUREMENT INSTRUMENT IDENTIFICATION NUMBERO RGAN IZAT ION fit applicable)
Naval Air Systems Command 930 N62269-85-C-0259
Sc. ADDRESS (City. State and ZIP Code) 10. SOURCE OF FUNDING NOS.Department of the Navy PROGRAM PROJECT TASK WORK UNITWashington, DC 20361 ELEMENT NO. NO. NO. NO.
6224 IN
11. TITLE (include Security Clamsfication)
POWER EFFICIENT HYDRAULIC SYSTEMS12. PERSONAL AUTHOR(S)
Hupp, Richard V. and Haning, Robert K.13. TYPE OF REPORT 13b. TIME COVERED 14. DATE OF REPORT (Yr...Mo., Day) 15. PAGE COUNT
Final FROM 85 Oct TO 88 Jul 1988 July 22016. SUPPLEMENTARY NOTATION
Volume I: Study Phase (this report)Volume II: Hardware Demonstration Phase (separate document)
17. COSATI CODES 18. SUBJECT TERMS (Continue on reuerse if nccesara and identify by block number)
FIELD GROUP SUB. GR. Aircraft Hydraulic Systems01 0 3 __r 07_
' . ABSTRACT (Conlinue on rruerse if neceuary and identify by block number)nergy saving concepts for aircraft hydraulic systems were studied in a two-phase program.
Task I was an investigation of methods and techniques to reduce overall hydraulic systempower requirements by lowering system demands and increasing component efficiencies. TaskII involved hardware demonstration tests on selected concepts.
Task I: Study Phase. A baseline hydraulic system for an advanced aircraft design wasestablished. Twenty energy saving techniques were studied as candidates for application tothe baseline vehicle. A global systems analysis approach was employed. The candidates werEcompared on the basis of total fuel consumption and six qualitative factors. Nine of themost promising techniques were applied to a "Target System". The target system had a 28%reduction in energy consumption and an 868 lb weight reduction over the baseline aircraft.The study made one conclusion clear: Don't add weight to save energy.
Task II: Hardware Demonstration Phase. Two techniques demonstrated for energy savings
20. DISTRIBUTION/AVAILABILITY OF ABSTRACT 21. ABSTRACT SECURITY CLASSIFICATION
UNCLASSIFIEDUNLIMITED 0 SAME AS RPT. 0 DTIC USERS 0 UNCLASSI I ED22&. NAME OF RESPONSIBLE INDIVIDUAL 22b. TELEPHONE NUMBER 22c. OFF ICE SYMBOL
(Include Area Code)
Douglas 0. Bag[well (215) 441-1151 NADC (6061)DD FORM 1473, 83 APR EDITION OF 1 JAN 73 IS OBSOLETE. NCL IF I
SECURITY CLASSIFICATION OF THIS PAGE'

IUNCLASSIFIED
SECURITY CLASSIFICATION OF THIS PAGE
were control valves with overlap and dual pressure level systems. Tests were conducted oncontrol valves, a servo actuator, dual pressure pumps, and a lightweight hydraulic systemsimulator. Valves with 0.002 in. overlap reduced system energy consumption 18% comparedto using valves with zero lap. Operation at 4000 psi reduced system energy consumption53% compared to operation at 8000 psi. Pressure level switching was accomplished withexcellent results.
Accession For
2VTIS GRA&IDIIC TABUnannounced 5Justification
ByDistribution/
Availability CodesjAva i and/or
Dist Special
UNCLASSIFIEDSECURITY CLASSIFICATION OF THIS PA .E

NADC-88066- 60
EXECUTIVE SUMMARY
1.0 PURPOSE OF THE PROGRAM
The power requirements for military aircraft hydraulic systems have risen
steadily from a few horsepower during World War II to over a thousand
horsepower for the B-lB bomber. Significant increases in hydraulic power are
projected for future Naval aircraft due to the growing number of control
functions utilizing hydraulic power and requirements for higher control
surface rates. The addition of engine and vectored thrust controls drives
hydraulic power requirements up by 50 to 100 percent. Reduced static
stability and higher maneuverability requirements of advanced aircraft
necessitate higher surface rates. More efficient hydraulic systems have
become increasingly important. High efficiency hydraulic systems must have
minimum weight and minimum power extraction from the engines. Peak output
power demands must more closely match system load requirements.0The purpose of this program is to investigate methods and techniques to reduce
overall hydraulic system power requirements by lowering system demands and
increasing component efficiencies. Twenty candidate energy saving concepts
were studied for application to Naval aircraft in the 1990's time frame.
2.0 BENEFITS TO THE NAVY
This program was conducted to provide the Navy with a means of improving
aircraft performance through the use of power efficient hydraulic systems.
Smaller, lighterweight, more efficient hydraulic systems require less fuel.
This translates into higher payloads, longer range, and improved aircraft
performance. The program reviewed all known techniques and methods having a
potential for saving energy or reducing power extraction. Concepts with the
0
• nu IIII

NADC-88066- 60
greatest potential have been identified. A basis has therefore been
established for directing future effort into the most promising areas.
3.0 PROGRAM PLAN
An overview of the program is given in Figure 1. The program consisted of two
major tasks:
Task I Study of energy saving techniques.
Task II Hardware demonstration tests on selected techniques.
Task I is reported herein (Volume I). Task II is reported in a separate
document (Volume II).
4.0 STUDY PHASE SUMMARY (TASK I)
A global study approach was adopted which allowed quantitative comparison of
the energy savings of each candidate technique on a total system basis. Fuel
consumption was the common parameter used for comparison. Major subtasks of
the study phase are listed in Figure 2. A baseline vehicle and baseline
hydraulic system. were established upon which the energy saving techniques were
applied. The baseline vehicle is depicted in Figure 3. Results are somewhat
dependant upon the vehicle; for example, weight is more critical in a fighter
aircraft than in a transport. A methodology was then established which
enabled quantitative comparison of changes in the hydraulic system; for
example, leakage in a servo valve, weight of hydraulic tubing, or heat
rejection in a pump. The energy saving techniques listed in Figure 4 were
studied for application to the baseline hydraulic system. Each energy saving
technique was applied to the baseline hydraulic system and total fuel savings
were computed and compared to the baseline. A qualitative assessment of
Reliability and Maintainability, Life Cycle Cost, Development Risk,
Performance and Safety was made by a panel of subject matter experts. The
most promising concepts are listed in Table 1.
ii

NADC-88066- 60
POWER EFFICIENT HYDRAULICS
OBJECTIVES" Reduce Overall Hydraulic System Power Requirements" Increase Efficiency of Hydraulic Power Systems
TASK I-STUDY PHASEa Establish Baseline Hydraulic Systema Analyze Proposed Energy Saving Techniques
- Comparative Analysis* Establish Energy Efficient Target System
TASK Il-HARDWARE DEMONSTRATION PHASE" Design, Manufacture, and Assemble Selected Techiques Into
Simulation System" Demonstrate Selected Energy Efficient Techniques
FIGURE 1. Program overview
ENERGY EFFICIENT STUDY
" Baseline System Definition
" Study Methodology
" Energy Saving Techiques
" Comparative Analysis
" Target System
FIGURE 2. Subtasks of Phase I study
iii

NADC-88066-60
BASELINE VEHICLE
I TZFiftLE SrfamGENERAL DESCRIPTIONGross Weight 64,000 LbSpan 50 FtLength 70 FtTIW 0.9
e*WFuel 21,000 LbTatStar"s 6,400 Lb
Wing Area 675 Fts
PERFORMANCE PARAMETERS CONTROL EFFECTORS* MachMax 1.8 Pitch RON Yaw* NZ 6.5 * Houizontals * Outboard TE 0 Rudders*0 NZULT 9.75 0 inboard TE * Hodizontals 0 Vectored Thrust* VAPP 120 Knots 0 Vectored Thrust * Vectored Thrust" Sink Rate 24 FPS
FIGURE 3. Baseline vehicle
ENERGY SAVING TECHNIQUES
*Pumps and lAPS * Muitipressure System
*Distribution System 0 Hybrid Hyd/Emn
" Accumulators 0 Advanced Materials
" Advanced Actuation 9 Design Margins- Variable Displacement- Slimline *Trs etrn- Pressure Intensifiers -Trst VTrNg
" Control Valves - Hot Gas Diverters- Aiding Load Recovery *VhceCnrlSse- Flow Augment 0VhceCnrlSse- Nonlinear Valves - Command Optimization
- Variable Gain/Bandwidth
FIGURE 4. Energy saving techniques studied
iv

NADC-88066- 60
TABLE 1. Energy saving concepts
CANDIDATE CONCEPTS RAT I NG
Advanced Materials 1.30 (best)Dual-Pressure System 0.41Pumps 0.37Non-Linear Valves 0.36Distribution System 0.34Variable Gain/Bandwidth 0.19Accumulators 0. 14Hybrid Hydraul ics/Electro-mechanical 0.07Flow Augmentation 0/+0.50
A "Target Hydraulic System" was designed using the most promising techniques
and fuel consumption and weight were analyzed. The target hydraulic system
achieved a 28% reduction in energy consumption. This is equivalent to an 868
lb weight savings in the baseline vehicle.
The study made one conclusion clear:
"Don't Add Weight to Save Energy".
Weight is dominate as the largest energy consumer. Even a fraction of a pound
added by an "energy saving" device typically resulted in much greater fuel
consumption than the energy saved by the device.
v

NADC-88066- 60
PREFACE
This report documents an investigative program conducted by Rockwell
International Corporation, North American Aircraft Operations, Columbus, Ohio,
under Contract N62269-85-C-0259 with the Naval Air Development Center,
Warminster, Pennsylvania. Technical direction was administered by
Mr. J. Ohlson and Mr. D. Baqwell, Materials Application Branch, Aircraft andCrew Systems Technology Directorate, Naval Air Development Center (6061).
This report presents the results of a two-phase program to study and
demonstrate methods and techniques to improve the operating efficiency of
hydraulic systems in advanced Naval aircraft. This work is related to tasks
performed under the Lightweight Hydraulic System Development Program, Contract
N62269-80-C-02b1. The report consists of two volumes:
Volume I Study Phase
Volume II Hardware Demonstration Phase
The project engineer for the Power Efficient Hydraulic Systems program was
Mr. W. Bickel . Acknowledgment is given to the following engineers for their
contributions to this report:
W. Andrews Control Systems
J. Denniston Air Vehicle
B. Holland Hydraulic Systems
E. Kauffman Reliability and Maintainability
L. Kohnhorst Control Systems
Appreciation is extended to the many individuals who provided helpful support
and constructive criticism of the program; in particular, Mr. J. Ohlson and
Mr. D. Bagwell of the Naval Air Development Center, and Mr. L. Biafore and
Mr. A. Eckles of Rockwell International.
vi

NADC-88066-60
TABLE OF CONTENTS
Section Title Page
- - - VOLUME I - - STUDY PHASE - - -
EXECUTIVE SUMMARY ....... ... ...................... iPREFACE ........ ... .... ...................... viTABLE OF CONTENTS . ...... ..................... ... viiLIST OF FIGURES ........ .. ....................... xLIST OF TABLES ....... ... ....................... xiv
I.0 INTRODUCTION1.1 BACKGROUND ........ .................... . ... 11.2 PROGRAM OBJECTIVES ..... ................... .. .. 11.3 SCOPE OF WORK ...... ...................... . ... 1
2.0 STUDY PHASE (TASK I)2.1 STUDY METHODOLOGY
2.1.1 Aircraft Mission ........ ................ 62.1.2 Aero/Engine Model
2.1.2.1 Effect of Weight on Fuel Consumption . 112.1.2.2 Shaft Horsepower Extraction ....... ... 14
2.1.3 Usage Functions and Efficiencies ......... ... 192.1.4 Fuel Consumption Calculations
2.1.4.1 Weight and Power Growth Factors ..... ... 212.1.4.2 Work/Cycle . . . . 25
2.1.5 Qualitative Assessment and Comparative'Anaiysis. 292.1.6 Industry Survey ... ..... ................ 32
2.2 BASELINE VEHICLE ........ ... ................ 322.3 BASELINE HYDRAULIC SYSTEM
2.3.1 Hydraulic System Loads .... ............. 402.3.2 Distribution System ................. .. 462.3.3 Actuation System ........ ................ 522.3.4 Power Supply System
2.3.4.1 Engines .. ..... ............... 602.3.4.2 APU's ..... ................. .... 602.3.4.3 AMAD's ..... ................. .... 602.3.4.4 Pumps .... .. ................ .... 612.3.4.5 Accumulators .............. 612.3.4.6 Reservoirs .. .. ........ 61
2.3.5 Baseline System Weight and'Volume. ........ 632.3.6 Fluid Temperature ..... .............. .... 632.3.7 Electrical System Loads
2.3.7.1 Direct Drive Valve Electronics ....... 632.3.7.2 Other Loads .... .............. ... 66
vii

NADC-88066-60
TABLE OF CONTENTS (Continued)
Section Title Page
2.4 ENERGY SAVING TECHNIQUES2.4.1 Pumps and Integrated Actuator Packages
2.4.1.1 Pumps. . . . . .............. 682.4.1.2 Integrated Actuator Package (IAP) . . . 71
2.4.2 Distribution System ...... ............... 782.4.3 Accumulators ..... .. .................. 842.4.4 Advanced Actuation
2.4.4.1 Variable Displacement Actuators ..... ... 872.4.4.2 Slimline Actuators ..... ........... 922.4.4.3 Pressure Intensified Actuators ....... 97
2.4.5 Control Valves2.4.5.1 Internal Leakage .... ........ ... 104
2.4.5.1.1 Dynamic Leakage ... ....... 1082.4.5.1.2 Non-Linear Valves ... ...... 109
2.4.5.2 Aiding Load Recovery Valves ... ..... 1152.4.5.3 Flow Augmentation Control Valves . ... 119
2.4.6 Multi-Pressure Level Systems2.4.6.1 Dual Pressure Level Systems .......... 1262.4.6.2 Multi-Pressure Level Systems ... ...... 130
2.4.7 Hybrid Electro-Mechar.ical/Hydraulic Systems . . . 1312.4.8 Advanced Materials
2.4.8.1 Materials Review2.4.8.1.1 Composites.. ... ........ 1352.4..1.2 Powder Metallurgy ... ...... 1402.4.8.1.3 Superalloys .... ......... 144
2.4.8.2 Tubing ...... .. .............. 1462.4.8.3 Energy Savings ..... ............. 149
2.4.9 Design Margins2.4.9.1 Pressure Safety Margin ... ......... 1532.4.9.2 Pressure Surges ................. 1532.4.9.3 Endurance Strength .... ........... 1542.4.9.4 Plastic Deformation ............... 1562.4.9.5 Energy Savings ... ............. ... 158
2.4.10 Thrust Vectoring2.4.10.1 Hot Gas Diverters .............. .... 1592.4.10.2 Trim Thrust Vectoring .............. 165
2.4.11 Vehicle Control Systems2.4.11.1 Variable Gain/Bandwidth ............. 1672.4.11.2 Command/Control Optimization ... ...... 171
viii

NADC-88066-60
TABLE OF CONTENTS (Continued)
Section Title Page
2.5 COMPARATIVE ANALYSIS .. .. .... . ...... ..... 1762.6 ENERGY 'rFICIENT TARGET SYSTEM. .. .. ... ....... 1782.7 STUDY PHASE CONCLUSIONS. .. . .... . .. ...... 179
REFERENCES. .. . .... . .. .... ... .... ..... 182
ABBREVIATIONS AND SYMBOLS .. .. .... .... ... ..... 184
APPENDICES
A INDUSTRY SURVEY .. .. .... .... ... .... ...... 189
B TRADE STUDY DATA. .. . ..... .. .... ......... 195
ix

NADC-88066-60
LIST OF FIGURES
Figure No. Title Page
1 Analysis approach 4
2 Energy efficiency block diagram 4
3 Baseline vehicle drag polars 8
4 Engine data illustrating effects ofshaft horsepower extraction 15
5 Actuator usage 18
6 Fuel consumption calculations 22
7 Growth factor components 24
8 Derivation of growth factors 24
9 Actuation task 26
l1 Work per cycle 28
11 Comparative analysis 30
12 Baseline aircraft 33
13 Baseline hydraulic system 36
14 Hydraulic power supply 37
15 Primary controls 47
16 Engine controls and utility system 48
17 Distribution system, flight controlsystem No. 1 53
18 Distribution system, flight controlsystem No. 2 54
19 Distribution system, flight controlsystem No. 3 55
20 Distribution system, engine controlsand utility functions, system No. 2 56
x

NADC-88066-60
LIST OF FIGURES (Continued)
Figure No. Title Page
21 Distribution system, engine controls,
systems No. 1 and No. 3 57
22 Fuel consumption, electrical 65
23 VSCF DC link with DC and AC outputs 67
24 Baseline pump performance characteristics 69
25 Predicted HCV pump performance 72
26 Efficiency comparison, IAP vs.conventional actuation 74
27 Control valve load/flow characteristics 88
28 Variable displacement actuator concept 88
29 Variable and fixed displacement motorvalve schematics 89
30 Energy savings, dual actuator by-passmode 92
31 Baseline wing torque box thickness 93
32 Vane actuator internal leakage 93
33 Slimline actuation 95
34 Thin wing fuel space availability 95
35 Pressure intensifier approach 98
36 Pressure intensifier design curves 98
37 Pressure intensifier energy analysis 101
38 Pressure intensifier summary 101
39 Typical control valve leakage 103
40 Control valve throttling 103
41 Control valve leakage vs. size 105
0xi
NADC-88066-60
LIST OF FIGURES (Continued)
Figure No. Ti tle, Page
42 Control valve leakage vs. time 105
43 Control valve dynamic leakage 107
44 Control valve leakage parameters 110
45 Valve leakage vs. orifice shape 112
46 Valve leakage vs. overlap 112
47 Nonlinear control valves 114
48 Aiding load recovery valve concepts 116
49 ALR valve energy saving potential 116
50 ALR valve design results 118
51 Flow augmentation characteristics 120
52 Flow augmentation design points 122
53 Dual pressure level logic diagram 128
54 EM efficiency diagram 132
55 Advanced materials summary 150
56 Advanced materials fuel and weight savings 150
57 Modified Goodman diagram for internalpressurization cycles 155
58 Deflection nozzle 161
59 Bistable fluidic control 161
60 Overexpanded nozzle 161
61 Trim thrust vectoring concept 166
62 Trim thrust vectoring review 166
63 Energy efficient aircraft simulation 168
64 Variable gain approach, disturbances 168
xii

NADC-88066-60
LIST OF FIGURES (Continued)
Figure No. Title Page
65 Variable gain approach, gain levels 170
66 Variable gain approach, energy consumption 170
67 Variable gain/bandwidth, conclusions 171
68 Command optimization, flow requirements 173
69 Command optimization concept 173
70 Command optimization, hydraulicconsiderations 174
71 Command optimization, control effectors 174
72 Observations and conclusion 181
0
0
xiii

NADC-88066-60
LIST OF TABLES
Table No. Title Page
1 Air-to-air missions 7
2 Air-to-surface missions 7
3 Composite mission 8
4 Calculation values 10
5 Aircraft I i ft/drag data 10
6 Fuel usage 12
7 Mission summary 12
8 Fuel usage variations with weight 15
9 Shaft extraction fuel consumption ratevs. thrust level 16
10 Shaft extraction fuel consumption ratevs. mission legs 16
11 Impact of dash leg on composite mission values 18
12 Usage function frequencies 20
13 Baseline aircraft features 34
14 Baseline aircraft systems 34
15 Redundancy and survivability features 41
16 Emergency actuation 41
17 Primary flight control loads 42
18 Engine control loads 42
19 Utility loads 43
20 Hydraulic system flow, F/C and T/V controls 44
21 Hydraulic system flow, engine controls 44
22 Hydraulic system flow, utility functions 44
23 Baseline sizing procedure 49
24 "EVEN" size line flow limits 49
xiv

NADC-88066-60
LIST OF TABLES (Continued)
Table No. Title Page
25 Baseline distribution lines, F/C -idT/V systems 50
26 Baseline distribution lines, engine
and utility systems 51
27 Distribution line pressure drop 58
28 Redundancy requirements 59
29 Baseline system actuator weight and volume 59
30 Fluid volume 62
31 Baseline reservoir data 62
32 Baseline system weight 64
33 Baseline system installation volume 64
34 Average fluid temperature 64
35 Electrical parameters 65
36 Estimated shaft power to electricalsystem in horsepower 67
37 Energy saving techniques 69
38 Conventional pump losses 70
39 Design comparisons 70
4U HCV pump energy savings 72
41 IAP weights 74
42 IAP weight comparisons 77
43 IAP energy analysis 77
44 3A1-2.5V titanium pressure and return lines,EVEN sizes 79
45 3A1-2.5V titanium pressure and return lines,ODD/EVEN sizes 79
46 15-3 titanium pressure and return lines,ODD/EVEN sizes 81
xv

NADC-88066-60
LIST OF TABLES (Continued)
Table No. Title Page
47 15-3 titanium pressure and return lines,
ODD/EVEN sizes, reduced design margin 82
48 Distribution system weight 83
49 Metal bellows accumulators energy savings 86
50 Variable displacement actuation, weightand leakage comparisons 90
51 Variable displacement actuation, fuel
consumption comparisons 90
52 Pod design weight estimate 96
53 Linear vs. rotary energy comparisons 96
54 Fuel consumption due to valve leakage 107
55 Flow augmentation weight change estimate 124
56 Flow augmentation energy analysis 124
57 Design requirement review for mission leg 127
58 Dual pressure level fuel consumption 127
59 Dual pressure level advantages/disadvantages 128
60 EM utility system advantages 132
61 EM utility system fuel consumption 132
62 Physical properties of aerospacehydraulic tubing 147
63 8000 psi tubing design requirements 148
64 Estimated weight, hot gas control 164
65 Hot gas T/V, fuel consumption 164
66 Concept ratings 177
67 Concept rating summary 177
68 Target system weight savings 178
xvi
NADC-88066-60
1.0 INTRODUCTION
1.1 BACKGROUND
The power requirements for hydraulic systems in military aircraft have risen
steadily from a few horsepower during World War II to over 1000 hp in the B-IB
bomber. Significant increases in hydraulic power are projected for future
Naval aircraft due to the growing number of control functions utilizing
hydraulic power and requirements for higher control surface rates. The
addition of engine and vectored thrust controls drives hydraulic power
requirements up by 50 to 100%. Reduced static stability and higher
maneuverability requirements of advanced aircraft necessitate higher surface
rates. More efficient hydraulic system designs which minimize power
consumption, weight, and volume, become increasingly important as power
extraction increases.
1.2 PROGRAO OBJECTIVES0The program objectives were to investigate methods and techniques to reduce
overall hydraulic system power requirements by lowering system demands and
increasing component efficiencies. Results of the study were to be applied to
a baseline advanced Naval aircraft design to establish the total energy saving
potential of a hydraulic system with minimum weight, minimum power extraction
from the engines, and with peak output power demands matched to system load
requirements. Laboratory tests were then to be conducted on specially
designed hardware to demonstrate selected energy saving techniques.
1.3 SCOPE OF WORK
The program was performed in two phases:
Task I Study Phase
Task II Hardware Demonstration Phase
0
• • I a it i 1

NADC-b8066-60
Task I consisted of the following:
o Determination of study methodology
o Definition of baseline vehicle
o Establishment of baseline hydraulic system
o Evaluation of candidate energy saving techniques
PumpsIntegrated actuator packagesDistribution system (5 approaches)AccumulatorsVariable displacement actuatorsSl imli ne actuatorsPressure intensifiersNon-linear control valvesHigh-overlap control valvesAiding load recovery valvesFlow augmentation valvesMultipressure systemsHybrid hydraulic/electro-mechanical systemsAdvanced material sDesign marginsHot gas divertersTrim thrust vectoringVariable gai n/bandwi dthCommand optimization
o Apply most promising techniques to target system
o Detemine weight and energy savings of target system over
the baseline.
Task II consisted of the following:
o Design test parts
Actuator modification
Test fixture modificationo Procure demonstration hardware
Dual pressure pumps
Direct drive control valves and electronicso Conduct demonstration tests
o Analyze test results.
Task I is presented herein (Volume I). Task II is presented in a separate
document (Volume II).
2

NADC-88066-60
2.0 STUDY PHASE (TASK I)
S" 2.1 STUDY METHODOLOGY
The analysis approazh, summarized in Figure 1, was developed around two
fundamental criteria:- 1) evaluation and comparison of energy saving
" techniques must be-based upon total aircraft energy consumption -- not merely
.. upon individual components; and 2) the evaluation and comparison must be based
upon realistic usage,.- not upon maximum or ideal conditions which are seldom
encountered in practice. Therefore, a global or total systems approach is
required. For example, it is not productive to reduce hydraulic system energy
losses by replacing a hydraulic component or subsystem with a non-hydraulic
one that is more efffcient but heavier.
- L The study approach takes into account all energy losses and inefficiencies --
- both direct and "ndict. Direct energy losses are associated with the
. efficiency of s mcomponents. Examples are internal leakage in control
valves and pumps, pressure drop in hydraulic tubing, and friction in
actuators. Indirect energy losses are associated with weight and/or size
effects. If on&-cnonent weighs more than another (which performs the same
function), the -hefier weight results in more energy consumption. To support
the additional mweigkt, aircraft angle-of-attack must be increased which in turn
induces more drag. Additional engine thrust is then necessary to offset the
-T . higher drag arntmaiitin airspeed, thus raising energy consumption. Size can
'l also increase rg-consumption if it requires enlarging the aircraft
moldline which in turn. adds drag.
System element- efficiencies must be accounted-for in comparing one energy
saving techniqme with another. For example, it can be seen from Figure 2 that
the energy los ofza component must be divided by the efficiencies of all
- system elements upstream of the component to obtain the total loss resulting
, from that conqnent_ In order to compare the total impact of changes in
~-3

NADC-88066-60
ANALYSIS APPROACH
STUDY CRITERIA
" Based Upon Total Aircraft Energy Consumption
" Based Upon Usage (Duty Cycles)
GLOBAL APPROACH
" Direct Energy Components
" Indirect Energy Components
" System Efficiencies
ENERGY CONSUMPTION IS COMPARED IN TERMS OFLBS FUEL/AIRCRAFT LIFE
Figure 1. Analysis approach
ENERGY EFFICIENCY BLOCK DIAGRAM
Pow
77E 77 AM 77p 77L. 1C 77A ?7SM
0/ 'vn oa
Figure. 2. Energy efficiency block diagram
4

AADC-88066-60
different areas of the hydraulic system, element efficiencies must be
determined and comparisons made at a common reference point. The common
reference point chosen for this study was aircraft fuel. Fuel is stored
energy and fuel usage rate is the equivalent of power. Total fuelconsumption over the life of the aircraft was therefore established as the
basis for comparing the candidate energy saving techniques and is expressed
in units of M-lb (millions of pounds) of fuel.
Application of this approach requires the following:
1. Definition of the baseline vehicle and hydraulic system in
sufficient detail to perform the required analysis.
2. Definition of a composite mission for the baseline vehicle.
3. Development of an engine/aero model for computing fuel
consumption rate due to primary/secondary flight controls and
utility functions.4. Definition of actuation usage.
5. Establishment of system/component efficiencies.6. Computation of energy consumption and losses for all direct and
indirect components, computation of fuel consumption, and
summation to determine total fuel consumption.
7. Qualitative assessment of the energy saving techniques since
conclusions and recommendations can not be made upon energy
savings alone.
8. Comparative analysis of specific energy savings methods and
techniques.
One purpose of the study was to evaluate and compare many energy savings
techniques, determine those with the most potential, then focus on the most
promising candidates. It was necessary to limit the depth of the study
because of funding constraints.
05
NADC-88066-60
Item 1 above (Baseline Vehicle and Baseline Hydraulic System) is discussed
in sections 2.2 and 2.3; Items 2 through 4 are discussed in this section
(2.1); Items 5 and 6 are discussed in section 2.4; and Items 7 and 8 are
presented in section 2.b.
2.1.1 Aircraft Mission
The multi-mission attack aircraft chosen for this study is typical of
current projections for next generation Naval aircraft. The data base for
this aircraft evolved from ATA and VFMX studies conducted at Rockwell. The
two basic missions, Air-to-Air and Air-to-Surface, are outlined in Tables 1
and 2. From these prior studies a composite mission was established upon
which the analysis was based. The composite mission is shown in Table 3,
and is representative of an attack encounter. The composite mission
duration is 162 minutes and is divided into seven legs. Flight conditions
were established for each leg and, for purposes of this analysis, held
constant throughout the leg.
2.1.2 Aero/Engine Model
An aero/engine model, developed by Rockwell in previous studies, established
the mathematical relationship between fuel consumption, weight, and engine
shaft power extraction. These relationships are expressed in terms of fuel
consumption rate coefficients. The fuel consumption rate per horsepower
coefficient is in units of lb(fuel)/hr/hp and the fuel consumption rate per
pound weight is in units of lb(fuel)/hr/lb(weight).
This approach is generic and can be applied to any vehicle, however
coefficient values are dependent upon the aircraft lift-to-drag ratio,
engine performance, and flight conditions. Lift-to-drag ratio curves were
reviewed for a number of advanced aircraft which fit the multi-mission role
and found to be quite similar. Representative drag polars established for
the baseline vehicle are shown on Figure 3.
6

NADC-88066-60
TABLE 1. Air-to-air missions
S DESIRED PERFORMANCE
I FLEET AIR DEFENSE 1 300 NM CRUISE
a COMBAT AIR PATROL/OAB 100 NM DASH a 1.5 M (ONE WAY)
a DEFENSE AGAINST ESCORTED [ 2-3 HR LOITER
BACKFIRES J 2-JIN. COMBAT 1.5 M a 35,000 FT
* 300 NM DASH a 1.5 MI DECK LAUNCHED INTERCEPT (SECONDARY MISSION)
a 750 NM CRUISE
I FIGHTER ESCORT . 40 NM DASH a 10,000 FT (ONE WAY)
e 10-MIN. COMBAT a 10,000 FT IRT
TABLE 2. Air-to-surface missions
MISSIO DESIRED PERFORMANCE
I INTERDICTION
* SCATTERED TARGETS
* STRONG SCATTERED DEFENSES e 750 NM CRUISE
e 50 NM DASH - 0.9 M a S.L.I SURFACE COMBATANT STRIKE/
SURFACE SURVEILLANCE/TARGETING * 5-MIN. COMBAT a S.L. IRT
* FLEET ATTACK
e LOW LEVEL TACTICS
I DEFENSE SUPPRESSION * 750 NM CRUISE
e HARM ESCORT OF ASUW e 40 NM DASH - 0.9 M a S.L.
a INTERDICTION AIRCRAFT * 8-MIN. COMBAT a S.L. IRT
I LONG RANGE STRIKE 1 .700 NM CRUISE
* LOW LEVEL PENETRATION . 100 NM DASH - 0.9 M a S.L.
* HEAVILY DEFENDED TARGETS J 5-MIN. COMBAT 2 S.L. IRT
I MINE LAYING FALL-OUT PERFORMANCEJ(SECONDARY MISSION)
7

NADC-88066-60
TABLE 3. Composite mission
LEGIO MODE DURATION, PERCENT OF ALTITUDE, MACHLGMIN. MISSION TIME FT. NO.
I Takeoff 3 1.9 S.L. 0.28
2 Climnb and Cruise 48 29.6 35K 0.8
3 Loiter and Descent 36 22.2 30K 0.7
4 Dash 4 2.4 S.L. 1.1
5 Combat 5 3.2 10K 0.6
6 Cruise and Descent 48 29.6 40K 0.8
7 Landing 18 11.1 S.L. 0.28
162 100.0%
-0.8 MachNo.
1 7 ! - -
.j-1 < -7 .... .
0.~i7 OFIIET
Fiue30Bsln.1hcedrgplr
877

NADC-88066-60
Engine performance was based on General Electric Fll0 engine data generated
by computer models employed in advanced studies. Operating conditions for
the composite mission legs are shown in Table 3.
As a starting point in the derivation of the fuel consumption coefficient
for weight, the average aircraft weight was estimated for each mission leg.
Fuel usage was computed from the engine model for the leg conditions and
this average weight. The average mission leg weight was then revised by the
weight of the fuel consumed and the computations were repeated.
Iteratively, fuel consumption was established for each leg in turn. Average
fuel consumption rate coefficients were then calculated for each leg.
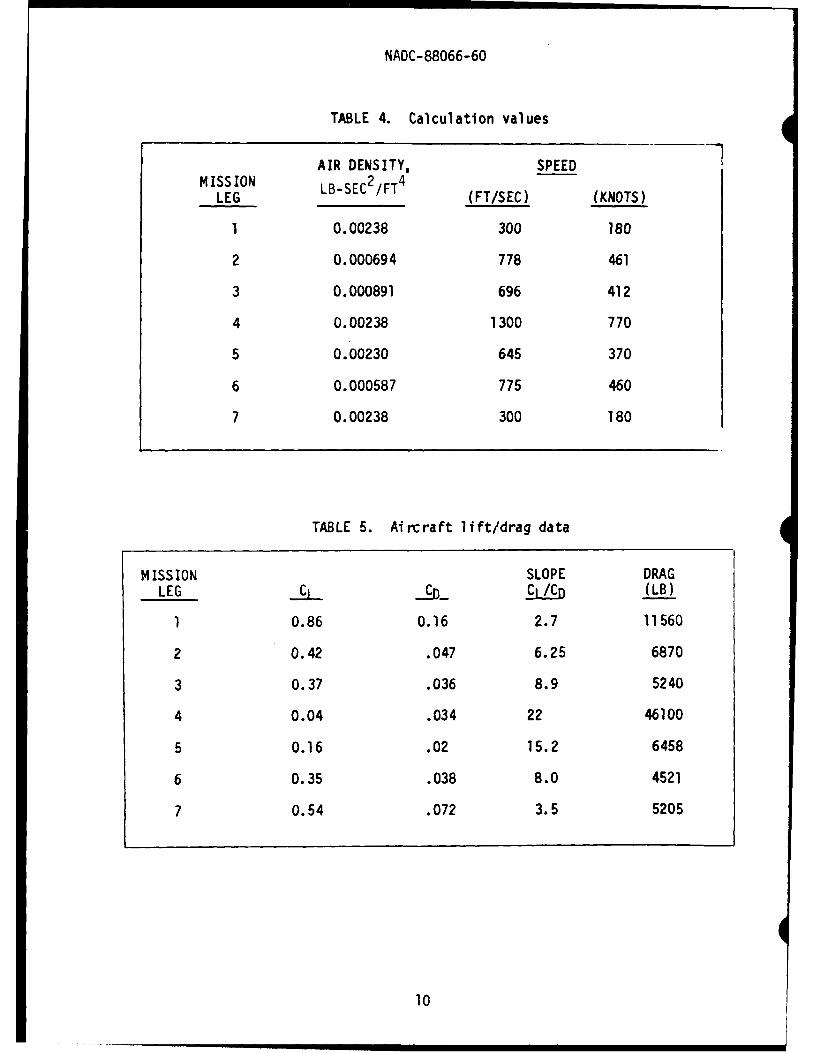
Flight condition data used for the calculations is shown in Tables 4 and 5.
Table 4 defines air density and speed for each mission leg. Table 5 lists
lift and drag data for each leg based upon the drag polars in Figure 3.
Calculations for all mission legs except takeoff were based upon equilibrium
for the average weight during the leg; that is, thrust is equal to drag and
lift is equal to weight. For takeoff, thrust was established at a value
greater than drag to produce the necessary acceleration. Values for drag
coefficient (C0 ) and lift drag slope (CL/CD) were then determined from
Figure 3 and are presented in Table 5. The calculations involved the
following equations:
L = =r 5 CL
or, rL P V2.
CV .f(CL )Mv4)
t) T = y v'-V SCDwhere, U drag coefficient
CL - lift coefficient
D - drag
MW a Mach number
Te - thrust
5 - total wing area
V - velocity
Vr - weight
e - air density
9
NADC-88066-60
TABLE 4. Calculation values
AIR DENSITY, SPEEDMISSION LB-SEC2/FT4
LEG (FT/SEC) (KNOTS).
1 0.00238 300 180
2 0.000694 778 461
3 0.000891 696 412
4 0.00238 1300 770
5 0.00230 645 370
6 0.000587 775 460
7 0.00238 300 180
TABLE 5. Aircraft lift/drag data
MISSION SLOPE DRAG
LEG C _IC_ (LB)
1 0.86 0.16 2.7 11560
2 0.42 .047 6.25 6870
3 0.37 .036 8.9 5240
4 0.04 .034 22 46100
5 0.16 .02 15.2 6458
6 0.35 .038 8.0 4521
7 0.54 .072 3.5 5205
10

NADC-88066-60
*For equilibrium, drag must equal thrust. This thrust value (see Table 5)
was then used in the G.E. FilO engine model to obtain fuel consumption rate
and specific fuel consumption (SFC). Engine performance data, based on the
FIlO engine model is summarized in Table 6. Column 2 of this table shows
the thrust per engine, Column 3 shows fuel usage per engine and Column 4
shows specific fuel consumption per engine. Total fuel consumption for two
engines is given in Column 5 for the mission leg. This is computed by
multiplying mission leg time by the fuel consumption rate for two engines.
A summary is shown in Table 7. The average weights were calculated based on
fuel usage and the dropping of 6400 lb of stores in mission leg 5. Fuel
weight is the average value of fuel onboard at the start and the end of each
leg.
2.1.2.1 Effect of Weight on Fuel Consumption. The variation in fuel usage
caused by changes in aircraft system weight can be derived from the data
established in Tables 5 and 6. This relationship is developed for each
mission leg and the total mission.
The lift-to-drag (L/D) ratio is equal to the CL/CD ratio. This can be
seen from the lift and drag equations, i.e.:
D
_. CC..
Cb
01

NADC-88066-60
TABLE 6. Fuel usage
TOTAL
NET THRUST FUEL USAGE SFC FUELMISSION PER ENGINE PER ENGINE LB(fuel)/Hr USAGE
LEG (LB) (LB/HOUR) LB(thrust) (LB)
1 12000 9000 0.785 900
2 3400 2800 .88 4480
3 2620 1980 .98 2380
4 23000 51000 3.0 6630
5 3200 2800 0.96 470
6 2300 1900 0.90 3040
7 2600 2500 0.98 1500
TABLE 7. Mission summary
FUEL WEIGHT AT AVERAGEMISSION REMAINING END OF LEG WEIGHT
LEG (LB) (LB) (LB)
INITIAL 21000 64000 -
1 20100 63100 63550
2 15620 58620 60860
3 13240 56240 57430
4 6610 49610 52920
5 6140 42740 46170
6 3100 39700 41220
7 1600 38200 39700
12

NADC-88066-60
* For equilibrium, lift must equal weight and drag must equal thrust;
therefore, the incremental change in thrust for an incremental change in
drag can be computed from the slope ( CL/ CD) of the drag polar, i.e.,
Ar A D LX ACi
Specific fuel consumption (SFC) is a performance parameter of jet engines
which relates fuel flow rate to thrust; i.e.,
5FC. FUMEL FLOW RATE. b/R
The relationship between fuel consumption rate and aircraft weight can be
found by combining the two foregoing equations; i.e.,
AT = A TFU a% FLOWJ R EM
OR F-C A v L-a RKI SF-
W T C L
13

NADC-88066-60
The incremental fuel consumption rate per pound (FCRlb) for the average
leg conditions are listed in Table 8. A composite value was computed which
is an average weighted by the percent of time spent in each mission leg.
This was computed by:
Composite Value =- -rcR C.OTL(L)
2.1.2.2 Shaft Horsepower Extraction. The effects of shaft horsepower
extraction on engine performance is more difficult to obtain. It is
affected by a number of variables which include the engine operating point,
flight condition, magnitude of shaft horsepower variation, and effects of
engine bleed air to name a few. The gear box design, including starting and
redundancy features, also affects extraction efficiency. A computer model
of the engine was run which shows the effects of different levels of
horsepower extraction on engine specific fuel consumption (SFC). Since this
was a modification of the normal engine model, the data were only run at one
point having low thrust values and low SFC values so the effects of
horsepower extraction are more apparent. The data are plotted for 125, 300
and 475 horsepower extraction loads on the engine in Figure 4 and tabulated
in Table 9. The SFC shown in Table 9 is the difference between the 475 hp
curve and the 125 hp curve at the specific operating condition. Fuel rate
was calculated from
Fuel Rate = Thrust x SFC
or Fuel Rate = lb x lb/hr = lb/hr
lb
The only difference between the two curves is an additional 350 hp shaft
extraction. If fuel rate is divided by 350 hp, a value of fuel consumption
rate per horsepower is obtained (Column 5).
14

NADC-88066-6O
TABLE 8. Fuel usage variations with weight
1 TIMEMISSION SLOPE, SFC, CL- FCRL RATIO,
LEG CL/CD (LB/IIR I LB\ ((LB ( UL)H TjLBr- -7W7) EFTU WT) k TTT)/
1 2.7 .785 3.44 0.29 0.019
2 6.25 .88 7.1 0.14 0.296
3 8.9 .98 9.08 0.11 0.222
4 22 3.0 7.33 0.14 0.024
5 15.2 .96 15.83 0.06 0.032
6 8.0 .90 8.89 0.11 0.296
7 3.5 .98 3.57 0.28 0.111
COMPOSIT 7.65 0.97 7.89 0.14VALUE_ _ _ _ _ _ _ _ _ _ _ _ _ _ _ _
12 -
'.- 1 12 ___P_
1000 140 1800 etj~220027 2600=-; 3000 --
Figure 4. Enqine data illustrating effects of shaft horsepower extraction
15

NADC-88066-60
TABLE 9. Shaft extraction fuel consumption ravs. thrust level
0OC ot\!!SFC MID SFC FCRHP0 1--LB/HR /LB/HR FUEL RATE LB/HR
S0 C THRUST \(LB/HR)
GC Co c I Z 4 1000 0.122 1.085 122 .35o. C 1400 0.078 .96 109.2 .31
C 0 1800 0.058 .885 104.4 .30
2200 0.044 .850 96.8 .28
2600 0.038 .845 96.8 .28
3000 0.033 .852 99 .28
TABLE 10. Shaft extraction fuel consumption rate vs. mi
SFC FCRHP
MISSION (LB/HR\ (LB/HR'LEG \LBS / HP TIME R
1 0.785 0.26 0.1
O rr - 2 0.88 0.29 0.2C .C . 3 0.98 0.32 0.2o0c 4 4 3.0 0.99 0.0
04"' 5 .96 0.32 0.0C " -4 6 .90 0.30 0.2,
4 0 C 7 .98 0.32 0.1
16

NADC-88066-60
Fuel consumption rate is directly related to engine efficiency which is
*reflected in the SFC number for the specific operating point. This is true
for both shaft extraction and thrust. Engine efficiency can be taken into
account by normalizing fuel consumption rate per horsepower extraction
(FCRhp) to the engine operating point (i.e., MID SFC). Column 6 is
derived by dividing column 5 by column 3 (Table 9). It can be seen that the
normalized values are approximately equal; an average value is 0.33. The
fact that the nomalized values of column 6 approach a common value shows
that fuel consumption rate for horsepower extraction is directly related to
engine efficiency as defined by SFC. The deviations in the values are
within the reading accuracies of the plot in Figure 4. To minimize reading
errors, the column values were averaged to obtain the normalized value (atSFC = 1) of lb/hr per hp. The nomalized FCRhp is 0.33 at an SFC of 1.This value was used to show the effects of horsepower extraction on the
composite mission. This data is developed in Table 10. An overall value
for the composite mission is obtained by multiplying each leg value by the
leg time, summing the components and dividing by the total mission time.
The composite mission value obtained is 0.32 lb/hr/hp at the engine shaft.
The relationship between fuel consumption rate and weight, and the
relationship between fuel consumption rate and shaft power extraction have
thus been developed and are described by two coefficients: Fuel consumptionrate per pound weight and fuel consumption rate per horsepower shaft
extraction. Coefficient values are dependent upon the specific engine,
vehicle, and mission (operating point). This illustrates the necessity of
defining specifically these parameters for the study.
The engines operate very inefficiently in the dash leg of the mission. The
impact of the dash leg on composite mission values was investigated by
eliminating the dash leg and by approximately doubling the dash leg time.
The two fuel consumption coefficients for the modified missions are compared
with the baseline mission in Table 11. The "increased dash" mission raises
the FCRlb coefficient by 14% and the FCRhp coefficient by 9%.
17

NADC -88066-6 U
TABLE 11. Impact of dash leg on composite mission values
BASELINE ZERO DASH INCREASED DASHITEM MISSION MISSION MISSION
Mission Times
Total 2.9 4.16 1.36Cruise 1.6 2.56 0.8Loiter 0.6 1.16Dash 0.065 -0.12
FCRLB 0.14 0.13 0.16
% Change - -71 +14%
FCRHp 0.33 0.30 0.36
1 Change - -91 +91
NOTE: TOTAL FUEL HELD CONSTANT
Usage
TOTAL80 __ ___ ACTUATOR CYCLES
FIC and Engine.........20-M
60___utility- TN and LE Flops ....... 5FIC. TI. Engine Controls ir.......50 .
~40
2
zLE p
20 40 SO 80 100Ampitud - % Stroke
Figure 5. Actuator usage
18

NADC-88066-60
2.1.3 Usage Functions and Efficiencies0To compute the total energy consumed by an actuator during the life of
the aircraft, the total usage of the actuator must be determined. This
involves estimating load, deflection amplitude, rate, and duty cycle
based on mission requirements. The usage function defines the
distribution of cycles in terms of amplitude. This information is
difficult to ascertain for a new aircraft design. One measure that
could be used is the endurance requirements specified in MIL-C-5503C.
Later versions of this specification have deleted specific numeric
requirements, leaving them instead to be detailed in the aircraft
specification. Modern aircraft with control-by-wire (CBW) systems have
significantly increased usage over non-CBW systems. The current design
goal for advanced primary flight controls in reduced stability aircraft
designed for extended life (10,000 hr) is 20 million cycles. The usage
functions employed in this study are shown in Figure 5.
A nigh percentage of the 20 million cycles for flight controls are in
the low amplitude region. Thrust vectoring and LE flap actuators are
employed less frequently but generally experience greater deflection
amplitudes. Thrust vectoring controls are used only when other controls
are inadequate for the commanded maneuver such as during take-off and
landing. Utility actuators are basically two position devices which
operate through one full stroke cycle per flight.
Some energy saving techniques depend upon flow rate. To compute the
energy consumption of these techniques, actuation rate must be known.
This can be determined from the frequency of the usage cycles. Table 12
lists the frequency used in the analysis for each control function.
Flight control in general is in response to vehicle disturbances which
occur at the airframe natural frequency.
019

NADC-88066- bO
Direct lift, thrust control, and utility functions occur at relatively
lower frequencies. For sinusoidal motion, the flow rate is related to
frequency by:
where, = Flow Rate
Actuator displacement
= Actuator rate
A = Amplitude
(W) = Frequency
When amplitude (specified by the usage functions) and frequency
(specified by Table 12) demand flow in excess of the valve design
(no-load flow), frequency will be reduced as a result of rate limiting
(i.e., (A)- Q 14 .--' D X ).
TABLE 12. Usage function frequencies
Control Function Frequency, Hz
Longitudinal 25Lateral 25Directional 12Direct Lift 6Thrust Vectoring 25Thrust Magnitude 6Utility 3
20
NADC-88066-6(
2.1.4 Fuel Consumption Calculations
Fuel (energy) is the common parameter used to compare energy saving
methods and techniques (concepts). The use of this parameter permits
direct numeric comparison of all concepts regardless of the system
element involved, takes into account all system efficiencies, and allows
compar-Ison of direct and indirect energy consumption components.
Figure 6 depicts the calculations necessary to determine the total fuel
consumption over the life of the aircraft due to hydraulic system power
requi rements.
An aircraft mounted accessory drive (AMAD) efficiency ( ' AM) value of
0.9 was chosen as being typical of current equipment, Figure 6. The
power growth factor represents the quantity of fuel necessary to
transport the fuel required to supply the power. In other words, fuel
(which has weight) must be carried to provide power and this results in
an indirect fuel consumption component. (This factor is discussed in
Section 2.1.4.1.) The fuel consumption coefficients (lb-fuel/hr/hp and.lb-fuel/hr/lb-wt) are discussed in Section 2.1.2. Usage functions and
aircraft life are discussed in Section 2.1.3. The weight growth factor
accounts for the increase in aircraft weight (structure and fuel
required to carry the additional structural weight) required by an
increase in hydraulic system weight; this factor is discussed in the
next section. Work/cycle is the work (energy) drawn from the hydraulic
system to move an actuator through one complete cycle. Electrical power
input is the power required by actuator direct drive valve torque motors
and electronic drive units.
2.1.4.1 Weight and Power Growth Factors. The weight growth factor
(WTGF) is defined as the ratio of change in gross take-off weight to
change in equipment weight. The WTGF typically varies from 1.5 to 5 or
6 depending upon conditions established for the study. Previous studies
at Rockwell have resulted in WTGF values of 1.5 to 2.0 when the wing
21

NADC-88066-60
WEIGHT GROWTH LIFERA/
POW' E' E / jRH A/c FUEL
VALVE LEAKAGE-- coH HLIECNUMPTION
WOR/C FUCTIN AM FACTO
ELECTRICA
Fgur 6. Fue cosmto calculations WR #UE/
22 R T

NADC-88066-60
area and engine parameters are held fixed, and values of 4.0 to 5.0 when
wing area and engine parameters are permitted to vary. A weight growth
factor of 2.5 was used in this study. This assumes a fixed engine and a
variable wing area. Increased weight results in indirect fuel
consumption through increased drag. The fuel consumption rate has three
components:
1. Actual hydraulic equipment weight plus mounting
hardware.
2. The increase in structural weight necessary to
support the installed equipment plus the structural
weight to carry the additional fuel.
3. The weight of the fuel. This component varies as a
function of time.
Components of the weight growth factor are depicted in Figure 7 (a).
Power growth factor (PWGF) is defined as the factor by which the shaft
extraction power must be multiplied to account for the indirect components
associated with carrying the fuel to produce the power. The total fuel
consumption rate per horsepower has three components.
1. Direct: shaft power extraction from the engine
2. Indirect-Structural: Shaft power requires a certain
amount of fuel to supply the power over the mission
time. This fuel has weight which must be supported
by the airframe. Thus, the airframe weight
increases by a certain fixed amount. This increment
produces drag which results in a constant fuel rate
i ncrement.
0
23

NADC-88066-60
3 )TWRC(. L 3 W DDRECT (FUEL )
FUEL FUEL
RATE (F.) INDIRECT (STRUCTURE) RATE (2) INDIRECT (STRUCTURE)
i) INDIRECT( FQUIPMENT +MOUNTING) () DIRECT (SHAFT EXTRALTION)
TIME Tm TIME Tm
(a.) WEIGHT (b) POWER
Figure 7. Growth factor components
WEIGHT POWER
(2) Tm (3) (2) Tm ( )T= wCT + (W+ W,)CCT +W C. (t)c + (WF, Cs)CT W+J ) C dt
0 0
WFIt) = WF0 eC ' t However:
f w m F W| = Pe CpTm + WFCS#Tm + WFO e'c'td(c~t) z -W;$e e " 0'
0 Solvin3 for WFO7
WFO (I - e- ,O) Pe (pTmP " C Tm- CS C WT n
Therefore,
Cs- pF CPTm Pw.F
F W,0 We CTM (WI + +W CsCTm + w, ,(I - e - C ' )
CS csc.T -I -e-CT)] Wc. Tm(I +C S) Where, P POWER EX.TRAC.TION hpW" = FC. R */hr/hp
Tm = MI55ON TIME, hrW". (I + -5) C.Tm W-- = INITIAL FUEL WEI61T, lb
(C = 5rRUCTURAL WI6H7 COEFFICIENTw e -CS C*Tm C1 FCR 16 . /hr/Ib
W:(t) z INSTANTANEOUS FUEL
WEiGHT FUNCTION, lb
A WE C*TmWT. F WE= EQUIPMENT + MOUNTING WEI H
F - FUEL WEIGHT t lb
Figure 8. Derivation of growth factors
24

NADC-88056-60
3. Indirect-Fuel: Fuel has weight which results in
drag on the aircraft and, in turn, consumes fuel.
Since fuel weight decreases throughout the flight,
this component decreases with time.
These components are depicted in Figure 7 (b).
Derivations of the growth factors are shown in Figure 8. A weight
growth factor of 2.5 was chosen based on prior Rockwell studies. The
power growth factor was then computed, using the equations in Figure 8,
by adjusting the structural weight growth factor (CS) to produce a
weight growth factor of 2.5. The power growth factor was then
calculated from this value of CS. The ratio of WTGF to PWGF increases
as WTGF increases, thus a larger WTGF would accentuate the importance of
weight relative to extracted power in determining total fuel
consumption. The study showed that weight dominated in total fuel
consumption, thus a larger WTGF would make the dominance even more
*pronounced.
2.1.4.2 Work/Cycle. Most actuation tasks in an airplane involve
positioning a load in accordance with a command. This is depicted in
Figure 9 for a flight control actuator. The load magnitude is of
particular importance since it sizes the actuator and determines the
amount of energy required. The load can be described by inertia (J), an
energy loss (B), and a load spring (K). Inertia is established by the
physics of the control surface. The energy loss term consists of
actuation friction and aerodynamic damping. The spring consists of the
aerodynamic load. The aerodynamic terms vary with flight conditions.
For purposes of this study, the friction term was assumed to be entirely
viscous. The procedure for computing actuation energy consumption
involves determining the energy consumed in one cycle of motion
(work/cycle) and then multiplying this amount by the number of cycles
25

NADC-88066-60
V-/r AC' ,T O z-
Figure 9. Actuation task
26

NADC-88066-60
*experienced during the life of the aircraft. The integral of power is
energy or work. The output work performed by the actuator in moving the
load through one cycle is derived in Figure 10 (a). It can be seen that
actual output work is small and consists of only that required to overcome
the losses (l1eA (A) ). Unfortunately, the conventional actuator control
element is very inefficient and does not recover stored energy. Most of theenergy associated with actuation is consumed in controlling load position --
not in moving the load.
The work per cycle supplied by the hydraulic system is derived in Figure 10
(b) for a conventional balanced actuator. Work is equal to pressure times
volume since 4DmA is the volume of oil displaced in moving through one
full cycle. The energy (work) consumed includes all inefficiencies of the
distribution system, actuation control, and surface mechanism. These
inefficiencies are accounted for in the design when actuator displacement(Dm ) is selected. Efficiency is work out divided by work in and is given
below:
4YABW.0 = 4DMP
427
27

NADC-88066-60
x
x = A Sin wt= At cos wt
R= -Ausinwt
T :P Dm = JX k Bx +KxT = D R
P= P (J '+Bi + K X) Dm i
-(-AWZsInwt 4- BAwc5)t + KAsinwt) AwCcos)t
W= fdt
AY- KJ)Snw + BwCO5 &ij COS Wt dt
0
4 9A [j(K- Ju) 5if'cAt + (u) sntow-0
-A A1 (K- JUP) + Bw()
(a) Output
x =A si (At
T = PDri
W =Tx
W = f;PD mxdu.)t
0 iIrT
= 4PD,,A sin wt dw~t
= 4 PmA
(b) Input (Hydraulic)
Where,
A ArmPlitude Q = FLow8 = Damprm t = Time
Dn = Actuator di pIacement T = ToroueJ = Inertia W = WOrKK 5prrig constant X = Di3PL&CermentP Pressure () = frejuenry
w ~Pouer
Figure 10. Work per cycle
28

NADC-88066-60
2.1.5 Qualitative Assessment and Comparative Analysis
Factors relevant to the candidate energy saving techniques -- but
difficult to quantify -- were qualitatively assessed. These factors are:
Performance
Reliability
Maintainability
Safety
Life cycle cost
Development risk
The assessment procedure employed the use of Subject Matter Experts
(SME). A survey format was developed in which the SME's were asked to
rate each factor for each candidate energy saving technique. The
ratings were then averaged and multiplied by the energy savings estimate
for the concept to produce a Figure of Merit (FOM) rating. The survey
format and rating values are shown in Figure 11.
The committee of SME's consisted of members from the following
disciplines:
Air vehicle
Control systems (2)
Hydraulic systems (2)
Reliability and Maintainability
29

NADC-88066-60
CON C EP T R A T I N FO0R 11
CANDIDATE ENERGY DEVELOPMN
CONCEPTS SAVING a II eCC RI SKN PERFORMANCE SAFETY RATING
A (1) (2) (2) (2) (2) (2)
C
ETC
IENERGY SAVING ESTIMATE
2 QUALITATIVE RATINGS
RATING VALUESRELIABILITY AND
MAINTAINABILITY RATING LIFE-CYCLE COST RATINGLEVELS RATING LEVELS RATINGSignificant Improvement + 2 Major Reduction + 2Improvement + I Significant Reduction + INo Effect 0 Negligible 0Degradation - I Significant incrasse - ISignificant Degradation -2 Major Increase -2
DEVELOPMENT RISK RATING PERFORMANCE RATINGLEVELS RATING LEVELS RATINGAlready Developed 0 Greatly Improved +2Sight Rlak - I Improved + IMajor Risk -2 No Change 0Guestionable possibhilty -3 Degraded -1I
Greatly Degraded -2
SAFETY RATINGLEVELS RATING
*Improvement + INo Change 0
-Degradation -1IUnacceptable -4
*Can Be Dsigned As Safe As You Want"Sie May Be Prohibitive or Con~tains Single-Point Failure
FIGURE 11. Comparative analysis
30

WADC-88066-60
The SME's were chosen for their expertise and extensive background with
similar systems or components and could be expected to reliably assess the
qualitative factors for each candidate. The SME's were given the concept
rating form without energy saving estimates, a description of each candidate,
and instructed to assign a numerical rating for the qualitative factors. The
rating values of the six SME's were averaged for each qualitative factor.
The figure of merit was calculated using the following formula:
FOM = [ES] x [10 + 1/2 (RI+R 2+R3 +R4 +R5)]-lO
where, ES = Energy savings (M-lb fuel)
R = Average R&M rating
R2 = Average LCC rating
R3 = Average development risk rating
R4 = Average performance rating
R5 = Average safety rating
* The FOM is basically the energy savings scaled up or down by the qualitative
factors. As an example, if the SME's evaluated a candidate concept and the
concept received the best possible ratings in all areas, the FOM would be:
FOM = ES [O + 1/2 (2+2+0+2+1)j -10 = 1.35 ES
The lowest F04 rating a concept could receive would be:
FOM = ES L10 + 1/2 (-2-2-3-2-4)] - 10 = 0.35 ES
Provisions were included in the rating system to produce a very low rating
for candidates that were considered a safety risk (-4) or an extreme
development risk (-3), Figure 11. Thus, the "lowest qualitative" system
would require 3 times the energy savings (ES) to have an FOM comparable to a
31

NADC-88066-60
neutral or no-risk system, and the "highest qualitative" system could have
(100/1.35) % less energy savings and still have an FOM comparable to a"neutral" system.
2.1.6 Industry Survey
A survey was conducted to gather information concerning energy saving
approaches to aircraft hydraulic systems that are currently being pursued by
the Aerospace industry. This was done to assure that all viable concepts
were considered in this study. Most of the leading component and system
manufacturers in the United States were contacted either by survey letter, by
telephone, or by a personal visit to the supplier's plant. Some companies
visited the Rockwell Columbus facility to discuss their current products and
research efforts. The information provided was very helpful. Several
companies were visited to solicit their participation in the Hardware
Demonstration phase of this contract. A list of suppliers contacted and the
survey questionnaire used are presented in Appendix A.
2.2 BASELINE VEHICLE
The baseline vehicle utilized is a hypothetical generic aircraft based upon
data developed in the VFMX study effort conducted by Rockwell. A plan view
of the aircraft and specifics are shown in Figure 12. Table 13 lists basic
features of the vehicle. Mission requirements are discussed in Section
2.1.1. Basic aircraft systems are outlined in Table 14. The baseline
hydraulic system is described in Section 2.3.
32

NADC-88066-60
BASELINE VEHICLEOutboard YE Flap Outboard LE &mrfae
kiboad YE Flap kiboad I Smuace GENERAL DESCRIPTIONGross Weight 64.000 LbSpan 50 FtLength 70 FtT/W 0.9
vetclFuel 21.000 LbTab --- Stores 6,400 Lb
Wing Area 675 Ft2
PERFORMANCE PARAMETERS CONTROL EFFECTORS" MachMax 1.8 Pitch Roll Yaw* NZ 6.5 0 Horizontals 0 Outboard TE 0 Rudders* NZULT 9.75 0 Inboard TE 0 Horizontals 0 Vectored Thrust* VAPP 120 Knots 0 Vectored Thrust * Vectored Thrust" Sink Rate 24 FPS
OG 4677C
Figure 12. Baseline aircraft
33

NADC-88066-60
TABLE 13. Baseline aircraft features
o STUDY CRITICAL FEATURES
o MULTI-MISSION DESIGN
o ADVANCED 1990's ENGINES
o 2-D VECTORABLE, REVERSING NOZZLES
o DIGITAL INTEGRATED CONTROL SYSTEM
o RELATED FEATURES
o RCS REDUCTION
o ADVANCED STRUCTURES/MATERIALS
o ADVANCED AVIONICS
o ADVANCED WEAPONS
o MODERN COCKPIT
o ADVANCED AIRCRAFT SUBSYSTEMS
TABLE 14. Baseline aircraft systems
o HYDRAULIC SYSTEM o ELECTRICAL SYSTEM
o 8000 PSI, 3 INDEPENDENT SYSTEMS o HVDC POWER
o APU BACKUP
o FLIGHT CONTROL
o 4 CHANNEL DIGITAL FBW o ENVIRONMENTAL CONTROL SYSTEM
o INTEGRATES WITH PROPULSION AND o CLOSED LOOP
FIRE CONTROL o ELECTRICALLY DRIVEN
o RELAXED STATIC STABILITY DESIGN
o REDUNDANCY FOR SURVIVABILITY
34

NADC-88066-50
2.3 BASELINE HYDRAULIC SYSTEM0The system was configured to maximize combat survivability and operational
readiness. Three 8000 psi hydraulic systems, designed to operate at
temperatures from -40F to +275F using fluid per MIL-H-83282, are employed.
Localized fluid temperatures in the engine area can possibly reach +300°F.
The systems are depicted in Figure 13. Systems 1 and 3 are dedicated to
primary flight controls. System 2 powers both flight controls and utility
functions. The hydraulic power supply is shown in Figure 14. Each supply
feeds two independent circuits immediately downstream of the pressure line
filter.
Each system has two independent circuits monitored by reservoir-level-
sensing (RLS) devices. Output from each pump flows through two RLS shutoff
valves mounted downstream of the pressure line filter. Should a leak
develop such that fluid in the reservoir drops below a normal operating
level, valve "A" closes to isolate circuit "A" (see Figures 13 and 14). If
the leak is not in circuit "A", the fluid level will continue to drop. A-, a
preset lower level, circuit "A" valve reopens and valve "B" closes to
isolate the leaking circuit. RLS operation is not affected by
contamination, temperature variations, pressure fluctuations, or normal
reservoir fluid level changes. RLS operates electrically and requires
redundant electric power for sensing, control and monitoring. Check valves
protect the return system by preventing back flow out of the reservoirs.
Reservoir-level-sensing significantly improves reliability, survivability,
and maintainability. In addition to minimizing the effect of failures and
combat damage, the shutoff feature reduces potential fire effects by
limiting the quantity of fluid available to a leaking circuit. Maintenance
costs associated with loss of fluid are reduced, since the pumps are not run
dry, which would require pump replacement and system flushing.
035

NADC-88066-60
ENGINENo. 1
FOLD
NO.NOS IWHM,STEERINO,
APUTDLEFAP4
START ZNA
LH RUDER
Figur 13. Baseine ydralic y 7teCONEREN F, S ':C7ON36EN

NADC-88066-60
SYSTEM ReuizN4
F ILTER
r - RESER VOI
fA
Figure 14. Hydraulic power supply
37

NADC-88066-60
The reservoirs are located to provide positive pressure head to the pumps
and are installed in different aircraft orientations to preclude
simultaneous pump airlocks if air should enter a suction line from
mis-serviced or improperly bled reservoirs.
Two identical airframe-mounted accessory drives (AMAD), each shaft-driven by
an engine and a common APU, power the hydraulic pumps, Figure 13. The pumps
are conventional in design and built to meet specification LHS-8810A,
reference 14. Maximum flow is 40 gpm at 5700 rpm which is pump speed at
rated engine speed. Fast pump response and quick-acting relief valves limit
pressure overshoot to 8600 psi when flow demand stops suddenly. An
auxiliary power unit (APU) supplies hydraulic power to the AMAD's for engine
start and ground hydraulic power. This eliminates the need for hydraulic
ground support equipment.
Control-by-wire (CBW) is utilized for all flight controls. Four electrical
channels are employed for redundancy. Hydraulic power redundancy is
provided by judicious use of six hydraulic circuits, three hydraulic power
supplies, and shuttle valves. Dual tandem linear actuators drive the
horizontal stabilizers, T/V flaps, and T/R vanes and doors. Dual rotary
hingeline actuators power all other primary flight control surfaces.
Hingeline actuation is necessary due to thin wing sections. Dual tandem
actuators are used in the utility system to provide engine control after one
failure. All other utility operations are powered by single unbalanced
actuators except the gun drive and APU start which use hydraulic motors.
Survivability is maximized by redundancy of the control effectors, as well
as the hydraulic systems/actuation (see Figure 12). For example, roll
control power is provided by both leading and trailing edge surfaces,
differential horizontal stabilizers, and thrust vectoring.
38

NADC-88066-60
*Outboard TE flaps and the horizontal stabilizer operate both symmetrically
and differentially. Inboard trailing edge flaps, leading edge flaps, and
rudders operate symmetrically.
Shuttle valves provide an additional hydraulic power backup to the normal
supply sources for the horizontal stabilizer actuators. The shuttle valves
control both pressure and return flow paths. Normal supply pressure (N)
positions the valve to port the normal supply and return to the actuator.
With loss of normal pressure the valve switches (spring-biased) to a test
position which blocks the normal supply ports and interconnects the two
downstream ports. The backup (B) supply remains blocked. In this position,
a test pressure is generated by a small spring-loaded accumulator (built
into the valve) in the downstream circuit. Should downstream test pressure
decay, the spool remains in the test position, preventing the loss of the
backup system fluid. However, should the loss of test pressure be due to
cavitation in the actuator circuit, a reset feature re-establishes the test
pressure, and the spool shifts to the backup position. Normal spool
*position has priority so that, if the engine supplying the normal flow is
shut down and restarted, the spool returns to the normal position.
Shuttle valves enhance survivability by providing three power supplies for
pitch control. The integral test function in the valves permits maximum use
of available hydraulic circuits as system backup sources.
System 1 is dedicated to primary and secondary flight control functions
only. System 2 provides power for both flight control and utility
functions. Two solenoid operated isolation valves separate all utility
functions from flight control functions. The isolation valves are activated
a few seconds after the landing gear doors are closed and locked, and
de-activated when the landing gear is down. The isolation valves can be
overridden by a switch in the cockpit. Normally, the APU accumulator is
recharged after the left engine has been started.
39

NADC-88066-60
An alternate hydraulic method of engine-starting is provided by using an
accumulator to power the APU. The accumulator is charged through an
isolation valve which is switched open by an aircraft OLEO switch or a
cockpit override switch. The 8000 psi APU accumulator provides energy for
two start attempts. A hand pump is included for self-sufficiency in ground
operations. Hand pumps are also provided to replenish the brake
accumulators, perform the wing fold operation and to raise the arresting
hook for handling and maintenance.
Redundancy and survivability features incorporated in the baseline system
are summarized in Table 15. Emergency actuation of specific functions are
listed in Table 16. All other functions depend upon the reliaoility of the
hydraulic system.
2.3.l Hydraulic System Loads
Hydraulic system loads are listed in Tables 17 through 22. Tables 17
through 19 give actuation functions and their power requirements. Tables 20
through 22 delineate system design, and list the power supplied by the
hydraulic system, flow for each load, total power, and total flow for each
load group. For example, primary flight and thrust vectoring controls would
extract 601 hp (131 gpm) if they were all operating at their respective
design load conditions simultaneously. These loads are nearly evenly
divided between F/C and T/V controls, and are fairly well balanced between
the three hydraulic supplies, as shown by the total flows in Table 20.
40

NADC-88066-60TABLE 15. Redundancy and survivability features
1. Two engines power three independent hydraulic systems.
2. All flight control actuators are either 1) linear dual tandem, withrip-stop design and two stage rod seals or 2) dual rotary vane.
3. All flight control surfaces are dual and powered by three hydraulicsupplies.
4. Each horizontal stabilizer actuator is supplied by three hydraulicsources.
5. An AMAD is utilized to remove pumps, generators, and otheraccessories from the high temperature environment of the enginebay, and to improve maintainability and minimize the fire hazard.Equipment is separated by intervening equipment and structure toincrease combat damage survivability.
6. Each flight control function is supplied by four hydraulic distri-buti on circuits.
7. Reservoir-level-sensing is used to disconnect leaking circuits tomaintain fluid for the alternate circuit and to prevent operatingpumps without fluid.
8. Two-fail-operative FBW system assures control after loss of twoelectronic channels.
9. An onboard AP provides engine start, emergency power, and groundpower for self-sufficiency.
10. Flight controls automatically revert to dampers when hydraulic orelectrical power is lost.
11. Line routings are widely separated to minimize the probability ofcombat damage (single hit) disabling the entire system.
TABLE 16. Emergency actuation
ITEM ACCUMULATOR
NO. FUNCTION METHOD SIZE
1. LANDING GEAR FREE FALL
2. BRAKESA) DIFFERENTIAL (NORMAL) HYD. ACCUM. 100 Iq3 9 1000 psi
8) SUM (EMERGENCY) HYD. ACCUM. 50 IN* 1 7000 psi
3. ARRESTING HOOK HD. ACCUM. 40 IN3 S ?
4. HIGH LIFT PRIMARY FLIGHTCONTROLS
S. APU START H1D. ACCUM. 150 IN3 1 4000 psi
6. CANOPY AIR BOTTLE -----
7. GROUND STEERING RUDOER & DIFF.BRAKES
41

NADC-88066-60
TABLE 17. Primary flight control loads
ACTUATORMAX DESIGN
LOAD CONTROL ACI/ HINGE MOMENT MAX RATE TRAVEL LOAD HP PERNO. SURFACE SURFACE (LB-IN) (DEG/SEC) (DEG) (DEG/SEC @ LB-IN) SURFACE
I OUTBOARD L.E. 2 135,00U 20 + 0. 12 9 54,000 3.43-30-
2 INBOARD L.E. 2 150,000 20 + 0. 12 0 60,000 3.81-30"
3 OUTBOARD I.E. 2 135,00O 50 +30" 30 0 54,000 8.57
4 INBOARD T.E. 2 150,000 50 +30- 30 9 60,000 9.52
5 RUDDER 1 100,000 55 +30* 33 @ 80,000 6.98
6 HORIZONTAL 1 550,000 40 +11* 24 @ 440,000 27.92ALL MOVABLE -25*
TABLE 18. Engine control loads
MAX DESIGNLOAD LONTROL ACt/ FORCE MAX RATE LOAD HP PERNO. SURFACE ENGINE LB (IN/SEC) TRAVEL IN/SEC 9 LB ENGINE
THRUST VECTORING
7 CONVERGENT FLAPS 4 13,125 5.3 6.0 3.2 @ 10,500 20.23
8 TV FLAPS 4 10,500 11.7 15.0 7 9 8,400 35.74(THRUST VECTORING)
9 T/R VANES 2 5,000 14.2 8.5 8.5 @ 4,000 10.3(THRUST REVERSING)
10 T/R DOOR 2 2,500 2.5 1.5 1.5 9 2,000 .9(THRUST REVERSING)
VARIABLE GEOMETRY
I) LPVG (LOW PRESS. 1 750 5.0 3.0 3.0 S 600 .55VAR. GEOMETRY)
12 A94 (BYPASS) 3 1,250 3.3 2.0 2.0 9 1,000 1.82
13 IGV (INLET 2 813 ,.6 3.5 3.5 @ 650 1.38GUIDE VANES)
14 FVABI (FWD VAR. AREA 2 3,125 5.8 3.5 3.5 S 2,500 5.27BYPASS INJECTOR)
15 HPVG (HIGH PRESS. 2 3,125 4.2 2.5 2.5 @ 2,500 3.79VAR. GEOMETRY)
16 AABI (AFT VAR. 1 2,250 4.5 2.7 2.7 0 1.800 1.47AREA BYPASSINbJC OR)
42

NADC-88066-60
TABLE 19. Utility loads
NA DESIGNLOAD Rc1/ FORCE MAX RATE TRAVEL LOAD HP PERNO. FUNCTION AIRCRAFT (LB) (IN/SEC) (IN) IN/SEC 0 LB AIRCRAFT
17 LAUNCH BAR 1 1,000 6.67 8 4 800 .49
18 NOSE WHEEL STEERING 1 4,688 1.65 7.42 1.0 @ 3,750 .56
NOSE GEAR
19 GEAR ACTUATOR 1 9,400 3.0 8.80 1.8 6 7,520 2.05
20 FAIRING DOOR LOCK 1 920 4.8 1.20 2.9 @ 740 0.32
21 FAIRING DOOR 1 4,900 6.4 4.60 3.8 9 3,920 2.28
22 GEAR LOCK CYL. 2 1,800 3.0 .75 .78 @ 1,440 0.79
MAIN GEAR
23 GEAR ACTUATOR 2 13,300 2.92 10.5 1.8 9 10,640 5.65
24 FAIRING DOOR LO0( 2 920 5.0 1.25 3.0 9 740 .67
25 FAIRING DOOR 2 7,200 7.7 7.50 4.6 @ 5,760 8.06
26 GEAR LOCX CYL. 4 1,800 1.3 .75 1.8 @ 1,440 .68
27 APU START 1 5.65
REFUEL
28 AFT DOOR & LOOCK 1 2,000 3.5 2.1 2.1 @ 1,600 .51
29 CTR DOOR 1 920 2.33 1.4 1.4 0 700 .16
30 CTR DOOR LOCK 1 920 5.2 1.3 3.1 @ 700 .35
31 PROs: ACt. 1 1,000 2.00 4.0 1.2 @ 800 .15
GUN
32 DRIVE MOTOR 1 29 GPM @ 2,600 PSI 44.0(.5 SECBURST)
33 PURGE DOOR 1 1,250 16.67 2.5 10. 9 1,000 1.52
34 MAIN BRAKES 2 20,000 .5 0.1 .30 9 16,000 1.45
WING FOLD
35 LOCK PIN 4 2,350 15. 4.5 9. 0 1,880 10.25
36 WING FOLD ACT 2 13,290 .12 4.0 .07 9 10.600 .23
37 ARRESTING HOO 1 19,500 1.5 5.6 .9 9 15,600 2.13
43

NADC-88066-60
TABLE 20. Hydraulic system flow, F/C and T/V controls
LCAO ACT DES 13N 40 TOTAL TOTAL FLOW CGP)iNO. TYPE FACTOR LOADS DESIGN POWER -----------------------........................
C1) PER LOAD SJPPL;ED IA is 2A 29 3A 38A/ (AP/AC)
----- ------. .----- ----- - ------ ---. . --- -- ----. -.--- -- ---- ------.. ...... ......
I D-RV 2.0 2 14.13 20.25 .99 .99 .ee 2.21 2.21 .992 D-RV 2.9 2 15.79 22.59 2.46 .09 2.46 .0 .90 .8e3 D-RV 1.6 2 28.26 49.49 4.42 .98 4.42 .0 .ee .094 O-RV 1.6 2 31.40 44.99 .09 .99 .0 4.91 4.91 .90S D-Rv 1.6 2 23.e3 32.99 .99 1.9 1.90 1.99 .99 1.908 OT-UB 1.6 2 92.11 131.98 .99 7.20 7.20 7.20 .00 7.297 DT-US 1.6 2 64.76 92.73 .9 S.e6 5.96 6.06 .00 5.es8 DT-US 1.6 2 114.36 163.95 .09 8.94 8.94 9.94 .09 8.949 DT-UB 1.6 2 33.05 47.35 .8 2.59 2.56 2.59 .09 2.58
to DT-UB 1.6 2 2.91 4.17 .89 .23 .23 .23 .89 .23
419.7 611.2 6.9 2S.6 32.7 32.0 7.1 2S.6
TABLE 21. Hydraulic system flow, engine controls
LOAD ACT DESIGN NC TC7At. TCTAL FLOW (GPM)NO. TYPE FACTOR LOADS DESION POWER ------------------------------------------------
(z) PER LOAD SUPPLIED IA IS 2A 23 3A 38A/C (NP/AC)
.... . .. ... -- - - --- -.. ..--- -. -- -- ------.. . ------ .--.---- ------ -- -- ------ . ... .. . ...
11 DT-U8 2.9 2 1.99 1.56 .9 .98 .9 .09 .09 .0012 DT-U9 2.8 2 3.68 S.i6 .29 .89 .28 .28 .29 .89
1 3 OT-US 2.9 2 2.74 3.93 .21 .98 .21 .21 .2t .0914 DT-UB 2.3 2 19.55 15.11 .92 .9r .82 .82 .92 .0015 DT-U9 2.9 2 7.64 19.94 .68 .99 .69 .69 .69 .0916 0T-US 2.8 2 2.95 4.22 .23 .99 .23 .23 .23 .99
23.6 46.9 2.2 .6 2.2 2.2 2.2 .9
TABLE 22. Hydraulic system flow, utility functions
LOAD ACT DESGSN NO TOTAL TOTAL FLOW (GP4)NO. TYPE FAC'OR LOADS DESIGN POWER ------------------------------------------------
(IX) PER LOAD SUPPLIED IA is 2A 28 3A 3BA/C (HP/AC)
17 S-Us 1.9 .49 .69 .59 .99 .09 .1 .90 .0919 S-US 1. 1 .S6 .8: .09 .99 .8 .18 .80 .0919 S-US 1.3 1 2.05 2.94 .99 .9S .ee .64 .99 .828 S-US 1.8 I .32 .46 .99 .80 .09 .1e .90 .021 S-US 1.9 1 2.26 3.27 .8 .99 .99 .71 .9 .ee22 S-US 1.0 I .79 1.13 .80 .99 .9e .25 .93 .0923 S-Us 1.9 I 5.6S 9.09 .80 .99 1.77 .99 .89 .0924 S-US 1.9 1 .67 .96 .69 .88 .21 .0 .0 .892S S-US 1.9 1 6.96 11.s5 .99 .90 2.52 .00 .ea .026 S-US 1. 1 .66 .98 .A8 .09 .21 .80 .99 .9927 MOTOR -1.9 1 S.6S 6.48 .89 .0 1.41 .9 .90 .9925 S-US 1.9 1 .51 .73 .89 .8 .89 .16 .98 .8929 S-US 1.9 1 .16 .22 .99 .99 .G .AS .99 .8939 S-US 1.8 I .35 .59 .99 .99 .89 .11 .99 .9931 S-US 1.9 1 IS .21 .99 .98 .99 .95 .99 .9932 MOTOR -1.9 1 44.8 50.43 .89 .99 .99 11.01 .99 .0933 S-Us 1.9 1 I.52 2.17 .9 .90 .99 .47 .98 .9934 S-US 1. 1 .45 2.8 .98 .99 .46 .99 .99 .As35 S-UB 1.0 1 19.2S 14.69 .89 .9 3.21 .9 .99 .9936 S-Us 1.9 1 .23 .33 .98 .89 .97 .09 .99 .9937 S-US 1.9 1 2.13 3.95 .89 .90 .67 .99 .99 .99
67.9 111.0 .6 .0 19.A 13.9 .8 .9
44

NADC-88066-60
Redundancy requirements necessitate oversize actuators to provide
performance capability after system failures. All control functions are
provided by multiple control elements, some to a greater extent than
others. For example, roll control is provided by the outboard trailing edge
flaps (ailerons), differential horizontal stabilizer, and thrust vectoring.Full roll control power is provided after a single hydraulic system failure
by the stabilizer and T/V controls and 80 percent from the outboard trailing
edge flaps. The outboard trailing edge flaps are therefore sized to provide
160 percent of the required power when all systems are operational. The
"design factor" shown in Table 20 accounts for the redundancy requirements
accordingly.
The design load and the total power supplied were determined using the
following relationships:
( Total Actuato No. Actuators No. Loads Design (SurfaceDesign J=Desi gn x Per x Pe r x xFactor x Mechanical)
Load// \ Load Load Group Aircraft \Efficiency
sTotal (Total Distributions Controls
Supplied = Design + System + ( Valve
Power \Load Losses \Losses/
One thousand psi drop in the supply lines and 1370 psi drop in the controlvalve were assumed in the calculations. To compute the power extracted from
the engine, the efficiencies of the AMAD and hydraulic pumps must be
included. Assuming 90% and 66%, respectively, for these elements, the total
extracted power from the engine would be 1012 hp for the F/C and T/V
controls. Fortunately, design load power is not demanded from all controls
simul taneously.
45

NADC-88066-60
2.3.2 Distribution System
The distribution system is shown schematically in Figure 15 for the primary
controls and in Figure 16 for the engine and utility functions. Utility
subsystems which consist of a number of actuation loads that occur
concurrently, such as the landing gear, are shown in block form and treated
as a single load for purposes of this study.
Hydraulic lines were sized using the criteria given in Table 23, and "EVEN"
sizes for both pressure and return lines. The flow limit for each size tube
is listed in Table 24 along with the length, which produces 1000 psi
pressure drop, and the Reynolds number for the limit flow condition at +50°F.
Design data for the distribution system hydraulic lines are summarized in
Table 25 for flight controls, and Table 26 for engine and utility systems.
Combined, the 188 lines have the following totals:
• Length - 1363 feet
• Weight - 364 pounds
* Volume - 4050 cubic inches
. Fluid Volume - 10.11 gallons
Tables 25 and 26 show the pressure drop for the supply lines at the design
load (Rate @ Load) flow value. Flows in branch feed lines (lines which
supply fluid for more than one load) were determined using the following
algorithm:
where, QMX = the maximum load flow of the loads
Qi = load flow for the ith load
QFeed = flow used to size the feed line
46

- ~ -. ------
01 3 S
,-'.'-3
'3!7
47 G

NADC- 88066-60
7'
70
4 \5, m
Z7s
64 6/ P,
47
2/,
m*t0 31 74
4-iso
- '4
/6 - 3
/0190,
5 , 4' ii . - - '
S I~ le
t, "t"
Figure 16. Engine controls and utility system
48

NADC-88066-60
TABLE 23. Baseline sizing procedure
Lines
1. Maximum fluid velocity: 25 ft/sec2. Fluid temperature: +50F3. 1000 psi maximum pressure drop at the design load flow4. 5333 psi maximum pressure drop (2/3 x 8000 psi) at maximum no-load
flow
Valve/Actuator
1. Fluid temperature: +509F2. Size actuator for maximum hinge moment at 6850 psi differential
pressure3. Size valve for the greater of:
A. Maximum no load rate at 2283 psi (1/3 x 6850 psi).B. Rate at the design load point.
TABLE 24. "EVEN" size line flow limits
Flow at 25 ft/sec velocity
Size Flow, gpm Length, ft RN
4 2.70 23.5 315.16 6.87 59.7 502.68 12.84 111.6 687.210 20.09 174.8 859.712 28.97 251.9 1032.314 39.46 343.2 1204.816 51.35 446.6 1374.3
49

NADC-88066-60
TABLE 25. Baseline distribution lines, F/C and T/V systems
NO LENGTH FLOW SIZE-P SIZE-R DELT-P DELT-P DELT-P WT rNsrL REYNFT GPM P R SUM VOL
1 6.28 1.11 6 4 26.44 42.04 69.39 1.25 13.70 94. 432.2 .59 I.11 4 4 12:74 4.09 18.82 .87 .92 142. 432.3 24.26 2.22 6 4 287.69 337.85 545S 4.90 53.59 189. 864.4 47.45 2.22 6 6 486.22 130.53 536.7; 13.14 144.41 189. 576.5 6.28 1.11 6 4 26.44 42.94 69.38 1.25 13.70 94. 432.6 .S9 1.11 4 4 12.74 4.09 6.82 .87 .81 142. 432.7 9.28 6.87 6 6 247.63 167.86 315.68 2.23 26.06 584. 1783.8 19.58 2.45 6 6 104.30 69.27 243.65 4.73 55.23 288. 636.9 2.87 1.24 4 4 49.94 16.63 65.97 .26 2.85 158. 483.
18 5.78 .62 4 4 6,.58 22.31 91.88 .73 7.94 79. 241.11 .59 .62 4 4 7.19 2.28 9.38 .07 .8 79. 241.12 28.85 1.24 6 4 133.69 217.16 358.84 5.66 61.96 105. 483.13 6.68 .62 6 4 15.69 25.47 41.16 1.33 14.58 53. 241.14 .59 .62 4 4 7.18 2.20 9.36 .87 .81 79. 241.15 6.20 1.11 4 4 133.04 42.94 176.78 .78 8.52 142. 432.Is .59 1.11 4 4 12.74 4.09 16.82 .07 .81 142. 432.17 18.15 2.22 6 4 155.30 252.77 498.15 3.66 48.09 189. 864.18 39.68 2.22 6 6 339.82 18.94 447.95 10.96 120.52 189. 576.19 6.28 1.11 6 6 26.44 8.48 34.92 1.72 18.87 94. 288.20 .59 2.21 4 4 12.74 4.89 16.82 .07 .81 142. 432.21 15.60 5.65 8 6 111.84 129.87 240.91 5.32 61.59 362. 1467.22 19.50 2.45 S 6 184.38 59.27 243.65 4.73 55.23 28. 636.23 1.25 2.24 4 4 30.16 9.66 39.84 .16 1.72 158. 483.24 5.78 .52 4 4 69.59 22.31 91.88 .73 7.94 79. 241.25 .59 .62 4 A 7.18 2.28 9.38 .87 .81 79. 241.26 28.05 1.24 6 6 133.68 42.6e 176.57 7.77 85.37 les. 322.27 6.6s .62 6 6 15.69 5.83 2e.72 1.83 20.09 53. t61.28 .5 .62 6 6 1.48 .45 1.85 .16 1.88 63. 161.29 6.28 1.24 4 A 149.58 48.08 197.58 .78 8.52 I5. 483.30 .59 1.24 4 4 14.23 4.57 18.82 .07 .61 18. 483.32 9.88 2.45 6 4 95.96 139.71 225.57 1.83 20.06 209. 954.32 28.85 2.45 6 6 265.22 05.25 350.40 7.77 85.37 288. 636.33 6.20 1.24 4 4 149.59 48.9e 197.58 .78 8.52 18. 483.34 .59 1.24 4 4 14.23 4.57 10.0 .87 .81 15. 483.3S 15.680 6.82 9 6 110.46 145.'7 263.64 5.32 6!.59 386. 563.36 19.50 2.22 6 6 166.;& 53.64 22.538 4.73 55.23 '89. 576.37 21.45 1.- 6 6 9:.47 29.35 12.: 5.;4 65.29 94. 288.38 6.20 .5 4 4 6G.'; 21.22 87.41 .78 8.52 7L. 2'4.39 .60 .55 6 A 1.27 2.05 3.32 .!2 1.33 47. 2'4.40 39.60 1.11 6 6 168.86 54.'8 223.04 0.96 2a.Z P4. 288.41 6.2e .55 4 A 66.'g 21.22 e7.41 .78 8.52 70. 214.42 .9e .55 4 4 6.4, 2.05 6.46 .39 .62 70. 214,43 6.45 1.24 4 4 155.6' 49.4 209.5S .62 .87 f58. 483.44 ,9 '.24 4 4 14.23 4.57 18.80 .07 .82 159. 483.45 5.78 2.22 6 4 49.48 6.sa '29.99 1.17 12.77 189. 864.46 23.93 10.20 a 8 312.26 147.77 '62.04 12.12 '30.9- 654, 1996.47 6.20 1.24 6 6 29.5 9.49 39.e3 1.72 19.87 105. 322.48 .59 1.24 4 4 14.23 4.57 18.80 .07 .81 158. 483.49 17.5 27.47 12 18 131.53 219.30 350.83 15.15 171.45 1I80. 43.3.58 19.58 10.07 8 8 251.18 117.73 368.84 8.57 98.75 646. 1970.52 27.23 1.11 6 6 116.11 37.25 153.37 7.54 82.87 94. 298.52 6.20 .55 6 4 13.97 21.Z2 34.29 1.25 13.70 A7. 214.53 .59 .55 6 6 !.24 .48 1.64 .6 1.80 A7. 143,54 42.90 i.22 G 6 102.93 58.69 241.62 11.89 130.56 94. 288.55 6.20 .55 6 6 13.07 4.19 17.27 1.72 18.87 47. 143.56 .59 .55 6 6 1.24 .48 1.64 .16 1.80 47. 143.57 8.78 21.11 18 8 191.91 194.88 296.79 5.e2 57.22 1086. 4138,5e .98 7.28 6 6 27.68 12.49 48.16 .24 2.78 612. 1869.59 3.90 21.11 28 8 45.27 86.56 131.83 2.22 25.42 1086. 4130.68 .99 1.44 4 4 27.76 8.91 36.67 .11 1.26 184. 551.61 .96 28.48 26 8 10.74 28.86 30.81 .55 6.26 158. 3992.62 12.68 16.8e to 8 115.58 189.32 383.81 7.23 82.64 864. 3287.63 11.70 21.11 28 8 135.88 259.69 395.49 6.67 76.25 10886. 413e.64 3.90 1.44 4 4 109.34 35.10 144.44 .43 4.95 184. 56l.65 5.95 7.20 6 6 165.21 74.55 239.76 1.42 16.57 612. 1869.66 2.95 7.91 6 6 68.65 29.31 89.96 .47 5.52 673. 2653.67 5.85 16.80 18 6 53.28 330.20 393.56 2.76 31.60 864. 4361.68 11.7e 21.11 10 8 135.88 259.69 395.49 6.67 76.25 1086. 4138.69 2.95 7.91 8 6 19.58 29.31 48.89 .67 7.70 507. 2853.78 5.85 16.80 Is 8 63.28 96.88 140.17 3.34 38.13 864. 3297.71 11.70 7.20 a 9 196.69 39.17 145.86 5.14 59.25 462. 1409.72 1.95 1.44 4 4 54.67 17.55 72.22 .21 2.47 124. 561.73 5.85 7.28 8 6 53.34 74.55 127.99 2.86 23.18 462. 1869.74 8.85 21.11 19 8 102.72 196.43 299.16 5.05 57.68 1886. 4'30.75 .98 7.20 I a 3.71 3.28 6.99 .56 6.39 370. 1409.76 3.90 21.11 1 8 46.27 06.56 131.83 2.22 25.42 1086. 4130.77 .98 1.44 4 4 27.48 B.82 36.30 .I1 1.24 184. 56'.78 .98 20.4e 28 S 18.97 20.40 31.45 .56 6.39 1958. 3992.79 12.68 16.88 18 1.Se 19.32 383.01 7.23 92.64 064. 3287.90 11.78 7.20 18 8 44.24 39.17 83.40 6.67 76.25 378. 2489.81 11.70 7.28 6 6 339.42 149.09 479.52 2.94 33.14 612. 1869.82 1.0 24.51 18 9 24.52 51.96 76.49 1.03 11.73 1261. 4796.83 1.58 25.71 18 8 23.24 47.1a 70.34 .96 9.79 1323. 5831.
783.33 240.5t 2708.22
50

NADC-88066-60
TABLE 26. Baseline distribution lines, engine and utility systems
NO LENGTH FLOW SIZE-P SIZE-R DELT-P DELT-P DELT-P WT INS-L REYNFT GPM P R SUM VOL
1 1.85 3.29 6 6 13.90 4.19 17.18 .29 3.20 272. 831.2 3.38 3.28 6 6 41.95 13.47 55.32 .94 19.29 272. 831.3 10.35 1.53 4 4 3a.41 99.01 4e7.42 2.31 14.23 :95. 596.4 1.98 .33 4 4 115.2 3.59 15.21 .23 2.47 42. 128.S 4.95 .28 4 4 26.66 6.61 35.49 .63 6.86 36. ;og.6 1.85 .89 4 4 1.93 .59 2.42 .13 1.44 11. 35.7 5.25 2.34 4 4 136.92 43.94 190.87 .66 7.22 171. 522.9 1.89 .72 4 4 2S.17 9.07 33.24 .23 2.47 92. 280.9 4.95 .92 4 4 79.96 25.29 194.15 .63 6.80 185. 310.
1a 2.9s .21 4 4 4.27 1.37 6.64 .13 1.44 27. 82.1 7.35 .72 4 4 102.78 32.96 135.74 .93 18.16 92. 280.12 4.95 .23 4 4 22.07 7.97 29.1S .63 6.88 29. 98.13 2.85 .so 4 4 12.23 3.02 16.1 .13 1.44 77. 234.14 1.58 3.20 6 6 12.57 5.99 24.55 .42 4.57 272. 831.IS 2.40 3.20 6 6 29.72 9.56 39.28 .66 7.30 272. 931.is 15.68 1.41 6 4 04.59 137.45 222.83 3.15 34.46 12. 649.17 1.50 1.41 4 4 41.10 13.22 54.39 .19 2.06 180. s49.i9 5.78 1.41 4 4 256.47 58.22 2096.69 .72 7.93 18. 549.19 6.75 1.41 4 4 125.29 59.47 244.76 .85 9.28 186. 549.28 3.63 1.41 4 4 99.02 31.72 130.54 .49 4.95 180. 549.21 18.15 .67 4 4 236.14 75.71 311.85 2.30 24.95 85. 261.22 4.28 .10 4 4 9.14 2.61 10.75 .53 5.77 13. 39.23 1.65 .67 4 4 21.47 6.88 29.35 .21 2.27 8S. 261.24 .15 .67 4 4 2.95 .63 2.58 .02 .21 8. 261.25 13.85 1.60 6 6 90.35 25.90 106.14 3.61 39.72 136. 415.26 15.88 I.66 6 4 92.35 158.11 242.46 3.63 33.13 136. 623.27 7.35 .86 4 4 114.23 36.63 158.86 .93 !6.I8 182. 311.28 20.85 .80 4 4 324.94 2e3.92 427.96 2.64 28.66 282. 322.29 6.7S .26 4 4 13.98 4.19 17.27 .05 9.28 23. 39.30 9.25 3.21 6 6 102.47 32.97 135.45 2.28 25.'! 273. 833.31 3.60 .18 4 4 6.98 2.24 9.21 .46 4.95 13. 39.32 5.25 .10 4 4 11.17 3.26 13.43 .66 7.22 13. 39.33 2.55 .38 4 A 14.94 4.75 19.59 .32 3.58 38. 117.34 7.860 .23 4 A 34.78 11.15 45.93 .99 12.72 29. g.35 2.55 .23 4 4 11.37 3.64 '5.02 .32 3.58 29. 96.36 7.86 .23 4 4 34.79 11.15 45.93 .99 10.72 29. 98.37 4.65 .I6 4 4 8.eI 2.09 .9 .59 6.39 13. 39.38 27.e8 1.66 6 A '66.24 272.IG 436.43 4.75 55.3- -.5. 623.39 2.22 .Be 4 4.55 5.98 24.63 .13 1.52 126 . 3;1.40 6.!5 .Be 4 4 ;5.58 32.65 "26.23 .6" '.62 126. 3*'.4- 1.22 ,25 4 A . 2 .86 .68 .93 1.2 32. ),..42 7.95 .82 4 4 '23.56 3;.62 163.e .8' ' ." 12. 3''43 26.40 2.62 6 4 !62.54 264.29 426,3 4.6 . 6'344 1.26 .82 A 4 8.65 5.98 24.63 3 .2 102. 3''.45 6.5 .8, 4 4 95.58 32.65 '26.23 . 36 2. ".46 1.20 .25 4 4 5.82 .86 -.68 ..3 .; 3: . 9?.47 7.95 .86 4 4 t23.56 3;.62 263.98 .87 . "2. 3'1.48 5.85 22.66 8 8 222.94 IAS.4! 3'9.34 2.96 3232 2449. 4422.49 5.85 22.66 8 8 2Z2.94 145.4' 349.34 2 96 32.82 '449. 442258 2.85 11.80 to 8 17.93 22.74 4e.07 " 88 22.16 637. 23C9.S1 7.8e 53 4 4 232.43 74.62 3e7.34 99 10.72 195. 599.52 1.80 .33 4 4 22.52 3.69 15.2" 23 2.47 42. 128.
.83 .es . g 4 4 1.83 .S; 2.42 is 1.44 '1. 37,S4 4.95 .28 4 4 26.88 8.61 35.49 63 6.82 36. I(,55 5.25 1.34 4 A 136.92 43.94 290.97 66 7.22 27. 5,56 1.86 .72 4 4 25.17 8.e7 33.24 .23 2.47 92. [email protected] 2.85 2' 4 4 4.27 1.37 5.64 .13 I.A4 27. 92.58 4.95 82 4 4 78.86 25.29 184.15 .63 6.80 265. 31 .59 7.35 .72 4 4 182.78 32.96 235.74 .93 10.18 92. 28.68 2.65 .60 4 4 12.23 3.92 26.15 .13 1.44 -7. 234.61 4.g5 23 4 4 22.87 7.7 29.15 .63 6.82 26. 66.62 27.8 11228 1 8 257.06 192.48 348.37 17.85 19'.7 566. 2152.63 4.20 .12 4 4 8.14 i.61 10.75 .53 S.77 13. 35.64 1.50 .46 4 4 13.39 4.29 17.68 .!9 2.C6 59. 179.65 2.58 .46 4 4 13.39 4.29 17.68 .t9 2.6 59. 179.66 2.58 11.8 8 8 21.17 10.58 31.74 .76 8.21 765. 2152.67 4.65 .23 4 4 20.74 6.64 27.38 .59 6.39 29. 90.68 6.30 23 4 4 26,99 9.8 37.1 .88 8.66 29. G6.69 6.38 .23 4 4 28.89 9.0 37.2 .8 8.66 29. 92.78 20.25 11.28 8 9 285.73 142.80 429.53 28.25 22e.83 705. 2152.7 1.5 1.80 8 9 6 21.17 48.24 61.48 .59 6.39 785. 28,5.72 5.25 .64 4 4 65.24 20.92 86.16 .66 7.22 82. 245.73 2.58 .47 4 4 13.68 4.39 18.61 .19 2.6 62. 183.74 2.18 :64 4 4 26.19 6.37 34.46 .27 2.89 82. 246.7S 8. .64 4 4 138.48 41.83 272.3 12.33 24.43 82. 249.76 1.32 20 4 4 . 2.63 6.71 .17 i.8e 26. 78,77 1.31 28 4 4 5.08 1.63 6.71 .t7 1.86 26. 78.78 5,78 .64 4 4 78.93 22.7' 93.54 .72 7.83 82. 249.79 2.S .64 4 4 13.85 4.19 17.23 .13 2.44 82. 249.88 6.75 .18 4 4 23.55 7.55 31.19 .A5 9.28 23. 7092 1 ,3: .19 4 4 4.57 !.46 6.84 .17 1.8 23. 70.82 7.35 .1 4 4 2'.37 6.95 29.22 .93 26.18 '2. se.10 16.50 2.s3 6 6 97.12 31.18 128.30 4.57 5e.22 130. 397.102 1.88 .33 4 4 11.S2 3.69 15.2" .23 2.47 42. 128.193 2.9 .28 A 4 S.78 '.93 7.53 .3 1.44 36. 19.184 4.95 .89 4 4 0.63 2.77 11.4 .63 6.8a It. 35.l2g 5.70 1.34 4 4 48.66 47.71 96.37 .72 7.83 171. 522.186 1.8 .92 4 4 32.10 18.32 42.51 .23 2.47 117. 358.187 1.05 .82 4 4 16.73 5.36 22.09 .13 1.44 195. 329.l89 4.95 .21 4 4 20.iS 6.46 26.61 .63 6.88 27. 82.to9 7.35 .72 4 4 ,12.79 32.96 1935.74 .93 2.10 92. 286.222 2.85 .23 4 4 4.61 12. 6.1 .13 1.44 29. 96.1;2 4.95 .6o 4 4 57.66 29.49 76.74 .93 6.89 77. 234.113 26.S 1.53 6 A 97.12 157.84 2S4.26 3.33 36.45 139. 596.114 1.88 .33 4 A ''.52 3.69 5.21 .23 2.4' 42. 18.
2.85 .28 4 4 5.78 .83 7.53 .13 .44 36. 22g. 2229 4.5 .6 4 4 8.63 2.77 21.46 63 6.86 '7 35.117 S.70 1.34 6 429.3, 7 7 77.es 1.,5 2.59 ,4 52'.I i.80 .92 • 4 32.18 :8.32 42.5' .23 2.4' 17. 3SB." 2.85 .82 4 4 '6.73 5.36 22.C. .23 7.44 85. 3!9.12 4.95 .2' 4 4 22.15 6.46 26.6 .63 6.80 27. 82.121 7.35 .72 4 4 282.78 32.96 "3.7 .93 16.26 92. 280.122 2.65 .23 4 4 ,68 7.SO 6.s .'3 2.44 29. 9L.123 4.9S .S6 4 4 57.66 !j.49 76.4 .63 6.8c 77. 234.
S79.71 15.42 1262.2

NADC-88066-60
In other words, the feed lines were sized to supply the maximum load flow
plus half of the remaining load flows. In situations where the demand of
various loads are known to occur simultaneously, they were added together
and treated as a single load.
The distribution networks shown schematically in Figures 17 through 21 were
used to establish line pressure drops. The total pressure drop was computed
for each load by summing the drop in each leg of the circuit. Table 27
lists the supply line pressure drop for each load.
2.3.3 Actuation System
Actuation system load requirements are listed in Tables 17 through 19.
Redundancy requirements and actuator type are given in Table 28. Weight and
volume information for the baseline system actuators is presented in Table
29 and is based on trade study data in Appendix B and Reference 1. Total
weight of all actuators, including actuator control valves is 1926.5 lb;3
total installation volume is 11,158 in3.
2.3.4 Power Supply System
The power supply, by definition, includes all equipment between the aircraft
fuel tanks and the main pump discharge ports, and consists of the following:
1) Engines
2) APU's
3) AMAD's
4) Pumps
5) Accumulators
6) Reservoirs
7) Heat Exchangers
8) Filters
9) Miscellaneous lines and valves
52

NADC -88066-60
7 8
(6.88~0.6 gpm)2.6 p
(20.4 gpm) (21.1 gpm)
62 61 59 57
63 58 (21.1 gpm)
B 60 Nsv sv
(7)()T/V VA(16.8 80 (S)RUD (1.44 81
(9) gprn) gpm)(10) (72 1
(6)HORIZ (7.2 (6)HORIZ (7.2
gpm) gm
Figure 17. Distribution system, flight control system No. 1
53
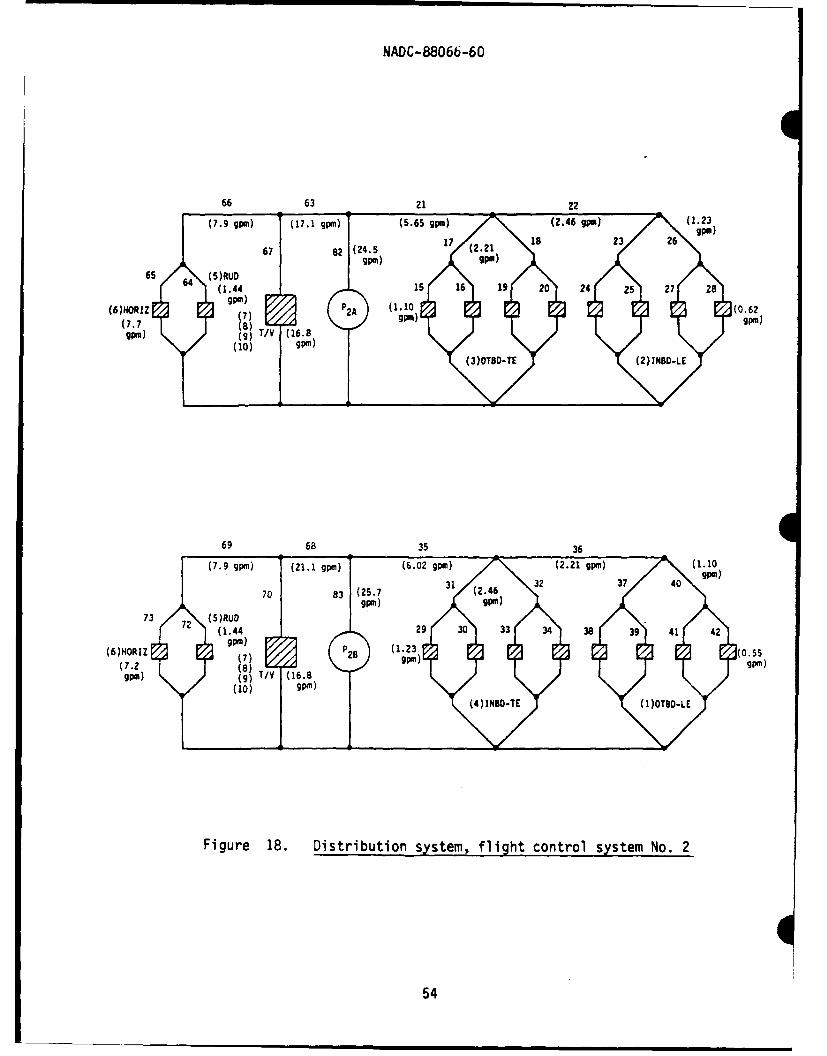
NADC-88066-60
66 63 21 2
(7.9 gpm) (17.1 9Pm) (5.65 gpm) - -(.69M 12
65 /4(S)RUD64 (1.44 is 16 19 20 24 25 27 28
WRORIZ ~~gpm) 2 (10(.6(6NRZ(7) gp)gpm)
(7.70 (8)qpm) (9) T/V (16.8
(10) gpm)
69 68 35 3
(7.9 gpm) (21.1 gpm) (6.02 gpin) (.19 11
73 (5)RU072 (1.4 29 30 33 34 38 39 41 42
(6)HORIZ (7)-3(05(7.2 (8)
gpm) (9) T/V (16.8(10) 9p')
Figure 18. Distribution system, flight control system No. 2
54

NADC-88066-60
49 s
(7.12~0.5 9p) 2.1 )
(4) INBD-TE ()TOL
(20.4 gpm) (21.1 gpm)79 78 76 74
71 75 (21.1 gpm)
B N7
sv Sv(7) V7(8) T/V (16.8 58 (5)RUO (1.44(9) gpm) qpm) s
(1)(6)HQRIZ (7.2 (6)HORIz (7.2 3
qpm) l gpm)
Figure 19. Distribution system, flight control system No. 3
55

___2__ NADC-88066-60
37 HOO0K
27 A~ 21 17 2
START 16 AVABI 61
16 5 5B
21 H P G 6
7 52
55
13 5!
14 6
7I _
36 6 OL 45077 - 14 ~5 32GU
IS V 4L 72 SO VL6
35 LOCK - -, 8 6
40ORK 7044
*- 35 LOCK 33REUL7~ 73F* ~ ~ ~ ~ ~ DO 7S4A ~ ij ORH:cv
35 LOCK 26488
2347 "EA 2EA
Fi ur 20. Di t ib t o CsKstem, 81in co t ol:n
utilit funcionssysteENI.G
7iur 0. Pressur dop t 1.35 Pm ,P huhe e arger l s aner
small.56

NADC-88066-60
10952
107 101
14 (F/cI 154 48P F/A #4)
Figure 211itiui18ytm niecot~,sses o n o
-13 GV 10 13 IV 57

NADC-88066-60
TABLE 27. Distribution line pressure drop
F/C AND T/V SYSTEMS
LOAD FEED LINES 3ta6 LINE DROP
1 7 3 1 7.7 3 2 9 6 9 a a osa2 7 4 5 a a 9 62.7
1~~~~~~~ 1 6.9 674.6
7 6 a2 r36 6 S 6 9.1 7 8 12 1 a901.2I2 S7 5: 9 ,.2 7 5, 60 6 , a a a a ai6.52 57 59 6i S 6 465.32 S7 S0 61 63 a 6 936.32 57 SO 62 62 a a a 763.23 92 21 17 15 6 6 6 6 9 a 92.33 82 22 17 16 S S S 742.43 92 21 10 16 6 6 6 6 6 669.33 62 21 10 20 6 a U 9 762.23 62 21 22 21 24 6 6 a a a 692.63 62 21 22 23 26 6 6 61G.33 82 21 22 26 27 6 a 6 6 756.33 2 22 22 26 26 6 * a 6 ; 739.1
02 633 13 6 6 9 62.6
4 93 35 32 34 6 6 6 W6.2 63 3 9 762.9
S63 3 361 20 6 6 6 6 676.32 S7 00.3
S63 35 V6 49 41 6 6 6 6 0 6.6S 03 35 36 46 42 6 6 S 6 6 766.2
6 63 6 76 6 6 6 6 S 6 6 696.6SS 3 6 60 72 6 0 0 6 6 166.0
6 03 66 60 71 6 6 6 6 6 6 642.67 '0 45 43 0 6 6 60 6 6686.47 40 45 44 6 6 6 0 6 3 6 '90.67 49 46 47 0 9 0 6 S S 4907 40 46 46 0 a 6 a 0 6620.77 40 50 1 72 6 6 6 0 6 6 goa.!7 40 56 6 53 8 9 0 6 674.77 49 SO 64 55 6 6 8 0 a 07.67 4 59 54 56 6 9 6 6 9 6 062.0
74 75 86 6 6 6 0 6 S 369.5
a 74 76 77 6 6 6 9 9 6 6 '67.39 74 76 79 71 S5 0 0 a 6 46.16 74 76 76 70 6 0 0 1 6 0 766.2
ENGINE AND UTILITY SYSTEMS
LOAD EED ..INES ... A. . L DROP
49 il 192 263 6 8 9 0 s Ae.,1 40 e ta4 e a 9 It a s4.3
48 ie 265 296 17 S 0 6 9 739.46 292 26 296 2968 6 S S S 743.1
49 01 29S SO 1I 6 a a a a 0 1S.91 48 201 165 100 112 6 0 8 6 3 858.02 40 13 224 225 6 6 0 6 f 6 627.92 40 113 114 !I6 6 1 S 0 a 630.o2 49 1!3 117 118 119 6 6 e 6 a 746.A2 49 113 117 119 129 a a * a 0 7SO.S2 49 113 117 121 122 a a S I 6 621.32 40 113 117 121 123 6 6 6 9 603.331 4 12 26 27 6 6 6 65.3 2 14 IS 25 26 29 6 1 6 012.03 2 2 14 30 go 39 6 S I 6 603.63 2 2 14 38 16 40 41 6 6 6 662.63 1 2 14 36 36 46 42 6 6 1 09.33 2 2 14 1: 43 44 0 6 6 6 66.03 1 2 24 36 41 41 46 a 2 0 793.13 2 2 14 36 43 45 47 0 9 0 046.64 2 2 14 16 16 17 26 6 6 1 S43.34 1 2 14 IS 16 21 21 6 6 699.64 2 3 4 1 6 6 a 6 475.14 3 4 6 6 6 2 6 442.24 1 0 6 6 742.04 I 3 7 : 16 6 6 a 6 644.44 2 3 7 I1 12 6 6 6 6 779.44 2 3 71 1i 2 7S7.4
1 SO 62 66 6o 6 6 6 9 6 467.05 56 62 66 67 66 6 0 6 461.35 S! 62 66 76 71 6 6 6 6 0 01.7S72 73 0 8 6 6 S 6 164.2
72 74 7S 76 77 6 6 0 6 9 16.36 72 74 7S 76 79 6 6 6 6 43.7S 72 74 75 7 66 62 6 6 6 429.65 72 74 7S 76 6 62 6 0 6 445.66 SO S S2 139 6 6 6 6 6 365.36 50 6. 52 14 0 6 6 : 66 SO S! SS 6 57 6 a 1 6 67.S6G 58 52 55 16 16 6 0 6 6 666.96 S6 St SS S6 6 S 6 6 8 666.1
6 s6 $1 SS so 61 6 9 6 6 6 609.S
58

NADC-88066-60
TABLE 28. Redundancy requirements
0 SINGLE DUAL DUALSURFACE ELECTRICAL HYDRAULIC HYD SUPPLY HYD SUPPLY ELECTRICALACTUATOR CHANNELS SUPPLIES FAILURE FAILURE FAILURE*
L.E. Flap 4 2 CaabLoad Up Lock No ChangeL.E.Flap 4 2 Capability
1/2 Load Trail TrailT.E. Flap 2 2 Capability Damped Damped
Rudder 2 2 No Change Trail TrailDamped Damped
Horizontal 4 2 With 1/2 Load 1/2 LoadBackup Capability** Capability No Change
*No change for single electrical failure. If all electric off,
horizontal goes to neutral lock, L.E. flaps go to up position,all other actuators go to trail damped.
**No change if single failure is in backed up system.
TABLE 29. Baseline system actuator weight and volume
LOAD DM STRCKE SwEP" Wd/A' TOTAL TOTAL "OTALVOL %,T INS-L C LID
Vo. VCL
1 20.32 -30.9 10.64 43.74 17A.94 665.07 42.S52 22.58 -30.ee 11.82 45.53 182.13 696.14 47.283 16.25 -se.ee 17.82 46.13 184.54 592.48 68.84 19.86 -Ge.ee 18.91 49.77 :99.89 743.74 75.645 24.88 -68.88 25.21 57.71 115.43 446.32 58.436 132.44 -36.98 93.21 52.74 :05.48 789.73 166.427 3.07 6.88 18.39 22.93 183.43 1398.17 147.158 2.4s 15.88 36.79 32.17 257.34 1966.02 294.319 1.17 8.58 9.93 17.92 71.67 538.71 39.711 .S8 1.58 .88 4.34 4.34 34.76 3.5811 .22 3.88 .66 6.62 12.04 6S.91 1.3112 .36 2.88 .73 3.99 3.98 31.82 4.3913 .24 3.58 .93 6.48 25.93 186.68 3.3214 .91 3.59 3.19 10.53 42.11 314.75 12.7715 .91 2.58 2.29 9.25 36.99 274.24 0.1216 .66 2.79 1.77 8.42 16.84 124.85 3.5517 .15 9.00 1.17 6.51 6.61 49.44 1.1718 .68 7.42 6.88 12.12 12.12 94.33 5.9619 1.37 6.99 12.00 19.03 19.83 141.39 12.0828 .13 1.20 .16 3.19 3.19 22.99 .1621 .72 4.69 3.29 10.15 18.15 78.27 3.2922 .26 .75 .20 3.49 6.09 49.20 .3923 1.94 18.58 20.39 23.94 46.08 362.65 40.7724 13 1.25 .17 3.23 6.46 46.44 .342S 1.85 7.58 7.88 15.46 38.93 238.87 15.7726 .26 .75 .20 3.39 13.54 99.84 .7927 .88 -360.00 .91 21.88 21.08 73.74 .ei2e .20 2.10 .61 5.87 S.97 37.93 .6129 .13 1.40 .19 3.33 3.33 24.10 .1938 .13 1.38 .17 3.27 3.27 23.55 .;731 .1s 4.88 .58 4.95 4.95 37.es .So32 .ei -368.98 .04 35.18 35.16 !50.59 .0433 .18 2.59 .46 4.62 4.62 34.14 .4634 2.92 .13 .29 3.90 7.90 57.97 .S83S .34 4.58 .S4 7.43 29.73 225.99 6.1836 1.94 4.09 7.76 14.62 29.24 228.91 15.5237 2.85 5.69 I1.04 28.50 20.58 161.12 15.94
3)8.0 1926.5 11158.2 1891.9
59
NADC-8806b-60
Items 1 through 6 are discussed in the following subparagraphs of this
section. Interest in this equipment, for purposes of this study, is limited
to their weight and efficiency as they affect calculation of energy savings
and power losses.
2.3.4.1 Engines. The engine selected for the baseline aircraft is in the
3UO00 lb class and incorporates thrust vectoring in the exhaust nozzles.
Thrust vectoring actuation is considered part of the primary flight controls
and is included in the baseline hydraulic system. Variable geometry engine
controls are powered by the aircraft hydraulic system.
The efficiency with which the engine converts fuel into shaft horsepower and
thrust is dependent upon flight conditions. Specific fuel consumption data
is presented in Section 2.1.2 along with aerodynamics for the vehicle. Fuel
consumption in terms of shaft horsepower extraction and equipment weight is
shown in Tables 8 and 1U for various flight modes. This data is the basis
for calculating fuel consumption (total energy usage).
2.3.4.2 APU's. The APU supplies power for emergency flight conditions and
ground operations. Emergency flight conditions occur so infrequently they
have negligible effect on total energy usage. Ground operations were not
considered as part of the study mission. Therefore, examination of the APU
was limited to sizing the accumulator for starting (see section 2.3.4.5).
2.3.4.3 AMAD's. The AMAD's have an overall efficiency typical of gear
boxes, and for purposes of this study, was assumed to be a constant value of
90%. AMAD's are normally designed to specific aircraft requirements, thus
their weight and volume is dependant upon the power extracted. Data
presented in Appendix B was used to estimate weight for computing total
energy consumption.
6U
NADC-88066-6U
2.3.4.4 Pumps. The baseline pumps are a conventional pressure compensated,
variable delivery, axial piston design. Displacement is changed by angular
movement of a trunnion mounted yoke on which the piston shoes slide as the
cylinder barrel rotates. The barrel houses nine pistons. Yoke position is
based on discharge pressure which drives the yoke piston through a servo
controlled valve (compensator). Internal leakage is used to lubricate and
cool the pump. Kidney shaped holes in a port plate time the entrance/exit
of fluid into/from the nine piston chambers in the barrel.
Pump dynamic response will meet the transient and stability time
requirements specified in LHS-8810A, reference 14. Pump discharge pressure
will reach 90% of steady-state full flow pressure within 0.050 sec following
a flow demand. Fast response limits discharge overshoot to 8600 psi when
flow demand drops suddenly from full to quiescent flow. The pumps were
sized in accordance with LHS-8810A; 1.7 in 3/rev was selected.
2.3.4.5 Accumulators. Control functions in the baseline aircraft that
require emergency back-up and the method of emergency actuation are listed
in Table 16. Four hydraulic accumulators are used. Accumulator size data
is given in Table 16. Metal bellows type accumulators are employed to
reduce maintenance costs.
2.3.4.6 Reservoirs. The total fluid volume and differential fluid volume
for the three systems in the baseline vehicle are shown in Table 30.
Differential volume is the maximum unbalanced volume resulting from full
displacement of accumulators, unbalanced actuators and bootstrap
reservoirs. The reservoirs were sized in accordance with MIL-R-5520C and
the need for a minimum fluid rest volume. Systems No. 1 and No. 3 have a
total fluid volume of 4.6 gal; system No. 2 has a total volume of 15.5 gal.
The total baseline system fluid volume is 24.7 gal. Estimated reservoir
weight and installation volumes shown in Table 31 were based upon the trade
data in Appendix B.
61

NADC-88066-60
TABLE 30. Fluid volume
COMPONENT SYS. NO. 1 SYS. NO. 2 SYS. NO. 3
Total Diff. Total Diff Total Diff.
(in 3 ) (in 3 ) (in ) (in 3 (in ) (in 3
Actuators 283 91.5 605 338 285 91.5
Accumulators 0 0 222 222 0 0
Lines & Fittings 405 - 1526 - 405 -
Reservoir 332.9 6.2 1165 21.8 332.9 6.2
Pump 1.7 - 3.4 - 1.7 -
Heat Exchanger 10 - 20 - 10 -
Filters, Valves, Misc. 35 - 35 - 35 -
TOTAL 1067.6 97.7 3576.4 581.8 1069.6 91.5
Total Fluid Volume = 5713.6 in = 24.73 gal
TABLE 31. Baseline reservoir data
INSTL FLUID
RESERVOIR WEIGHT VOLUME VOLUME
(Ib) (in 3 ) (gal)
SYS. 1 17.25 442.4 1.44
SYS. 2 36.0 1579.2 5.04
SYS. 3 17.25 442.4 1.44
TOTAL 70.5 lb 2464.0 in3 7.92 gal
62

NADC-88066-60
2.3.5 Baseline System Weight and Volume
Weight and volume data for the baseline system is presented in Tables 32 and
3., respectively. This da-a is based on information contained in Appendix
B. Weight data includes weight of the MIL-H-83282 hydraulic fluid.
2.3.6 Fluid Temperature
The baseline system employs heat exchangers to keep maximum fluid
temperatures below +275°F. Maximum fluid temperature occurs during
operation in an ambient air temperature of +110'F. Fluid temperatures used
in the study for leakage, density, etc., calculations are listed in
Table 34. This data corresponds to the composite study mission (average)
and standard day conditions. The mission average ambient temperature is
-39F.
2.3 7 Electrical System Loads
2.3.7.1 Direct Drive Valve Electronics. Operation of direct drive valves
requires the use of electronic drive units (EDU) which consume electrical
power. The weight of the EDU's and their power requirements both affect
fuel consumption. The incremental weight increases required in the
generator and electrical distribution system were not included in the
analysis. Weight and power estimates for EDU's were excerpted from previous
Rockwell studies, and are shown on Table 35. Data for the conventional
electro-hydraulic servo valve (EHV) design is given for comparison.
Fuel consumption resulting from use of the EDU's is shown on Figure 22.
Each of the 56 dual direct drive valve (DDV) electronic packages is
estimated to extract, on average, 20 watts of power. With an electrical
system efficiency of 85% the power extraction will result in consumption of
24,600 lb of fuel over the life of the aircraft. The EDU's for the 56 dual
valves will weigh 336 lb, and result in fuel consumption of 1.18 M-lb.
63

NADC-88066-60
TABLE 32. Baseline system weight
ITM WTJITEq NO. WT/AIRCRAFT
1. Pump 26.0 4 104.0
2. Reservoir 3 70.53. heat Cxchanger 3 24. 0
4. FIlters 2.0 9 18.0
5. Rel2ef valve 0.5 6 .06. Check Valves 0.353 17 5.0 13.9%
7. Shuttle salves 3.i 2 7.0
S. Shutoff Valves 2.0 11 22.0
9. P pessure Re5ucer 1. 4 1 1510. eselators 95.811. lnd Pteps 1.8 3 5.4
12. L nses 0and F1 1ng
8. F/C S set 248.5 4..-Utility and Engine I set I1S.4
13. ktuation 1 Set 1926.5 72.41
TOTAL 2647.6 Lb
TABLE 33. Baseline system installation volume
VOLUME/
T1 2!OLI0/ITE0 !I. AIRCRAF
1. PLOP 385 4 1543
2. Reservoir 3 2020
3. heat Exchanger 3 685
4. F ilters 23 9 209
5. Relief valve 5 6 306. Check Valves 0.8 17 14 r
7. Suttle Valves 35 2 70
8. Sh~utoff Valves 14.6 11 160
9. Prssure educer 5 1 s
10. *cumlators 4 1011. Hnd Puips 22 3 6
12. Lnes nd Fittings I Set
6F/C 2788*Utility and Engine 1262
13. AcUtuaton I simt
-F/C 7972
-Ut1ly and Engine 3186
T07AL 21010 id3
TABLE 34. Average fluid temperature
ACTUATION LOCA-TION TEMPR. *F
WING AND) VERTICAL TAIL go
MDRIZONTAL TAIL mo0
TIV AND ENGINE CONT. 2350
FUSELAGE 1300
NOTE :
The average ambient tewweratu, v for the wission, asi$UlnS a standard
day. is -390F. The averalge fluid talllwrlatun for leakage[ calculations q.as -130°F.
64

NADC-88066-60
0TABLE 35. ELECTRICAL PARAMETERS
" Direct Drive
" Two Torque Motor-Four Coils Each" 26 Watt/Coil Maximum" Pulse-Width Modulated" Quiescent Amplifier Current 1 Watt" Amplifier Weight (Est) 3 Pounds
" Electro-Hydraulic Valve
* Four Valvese 0.064 Watt/Valvea Push-Pull Operation@ Quiescent Amplifier Current 0.25 Watt• Amplifier Weight (Est) 0.25 Pound
ELECTRICAL I I Power LB-Fuel/HR A/C
POWER 7 AMAD Tlect FctrH
1/.90 1/.83 1.83 0.33 10,000
* Electrical Distribution System Efficiency 83%
0 Fuel Consumption Per Aircraft LifeFuel,
Nlb
+ Electrical Power 0.025
+ Weight 1.18
Total 1.20
Figure 22. Fuel consumption, electrical
065

NADC-88066-60
It should be noted that DDV FBW actuators are much lighter (45%) than
conventional 2-stage EHV actuator designs such as used for the F-18
horizontal stabilizer. This weight saving totally overshadows the increase
in electrical power caused by the EDU's. Use of direct drive valves in the
baseline system was specified by the contract.
2.3.7.2 Other Loads. Estimated loads for aircraft systems other than
hydraulics are presented in Table 36. Extracted horsepower from the AMAD is
presented for each flight mode used in the study. This data was developed
in previous Rockwell studies conducted for VFMX and ATA aircraft designs.
Electrically driven fuel pumps and closed cycle ECS were assumed.
Miscellaneous loads include items such as heaters, lighting, anti-ice,
instruments, etc.
A typical electrical system for advanced aircraft, shown in Figure 23, was
assumed for the baseline vehicle. The system has an overall operating
efficiency of 77%.
66

NADC-88066-60
TABLE 36. Estimated shaft power to electrical system in horsepower
MISSION PHASE
TAKESYSTEM OFF CRUISE LOITER DASH COMBAT RETURN LAND
Avionics 105 105 117 117 129 94 44
ECS 106 87 125 125 147 70 63
Fuel 84 42 42 84 84 42 78
Misc. 32 25 23 32 40 25 23
TOTAL 327 259 307 358 400 231 208
0270 VDC LINE
97% 212 KW
AMDGENERATOR FILTER/ FILTER43KCONTROL • 97%
7( z 90% 90% 90%
AIRCRAFT SYSTEMS TOTAL LOADING - 255 KW (342 HP)
LOSSES - 76 KW (101 HP)
TOTAL - 331 KW (443 HP)
OPERATING EFFICIENCY . 2 K 77%
Figure 23. VSCF DC link with DC and AC outputs
67

NADC-8066-60
2.4 ENERGY SAVING TECHNIQUES
A wide variety of energy saving techniques were investigated. They are
categorized into two groups; those associated with components and those
associated with systems. The techniques investigated are listed in
Table 37. The following paragraphs of this section discuss the various
techniques and their potential for energy savings.
2.4.1 Pumps and Integrated Actuator Packages
2.4.1.1 Pumps. The baseline hydraulic system has four 40 gpm pumps.
Performance characteristics of these pumps are shown in Figure 24.
Quiescent pump flow in aircraft hydraulic systems normally runs in the 10 to
20% flow range for most flight modes. Quiescent flow in the cruise mode,
which dominates the baseline study mission, is particularly low. Therefore,
a pump design which improves efficiency in the low flow operating range is
very desirdble. Efficiency at high flow is not as important since little
time is spent at this operating condition. Table 38 lists the power loss
areas for conventional aircraft type in-line piston pumps, and the typical
percentage loss in each area at 0, 20 and 100% of rated flow. Internal
leakage is the major contrioutor and accounts for 60 to 70% of the total
losses.
Check valve pumps are widely used in industrial applications because of
their ruggedness and lower cost. Use of this type of pump in aircraft has
been limited, however, because of their heavier weight and relatively high
pressure ripple. Advantages of the check valve pump design include a
stationary non-rotating piston block, low force for variable volume control,
and the ability to withstand cavitation at the inlet. A hybrid pump which
capitalizes on the advantages of the in-line piston and check valve pump
design features and minimizes or eliminates their respective disadvantages
would be desirable.
68

NADC-88U66-60
TABLE 37. ENERGY SAVING TECHNIQUES
* Pumps and lAPS 0 Multipressure System
" Distribution System o Hybrid HydIEm
" Accumulators * Advanced Materials
" Advanced Actuation * Design Margins-Variable Displacement-Silmline 9 Thrust Vectoring-Pressure Intensifiers - Trim TIV
* Conrol Vlves- Hot Gas Diverters- Aiding Load Recovery * Vehicle Control -System- Flow Augmentl - Command Optimization- Nonlinear Valves - Variable Gain/Bandwidth
0 8000- 100. DISCHAREPESR
7 900-
7800 80
-140
r ~60- 120 '
ce ~100 6
zz'65 440
HORSEPOWER LOSS 20
0 0
020 40 60 80 100
OISC4ARGE FLOW, PERCENT MXX
Figure 24. Baseline pump performance characteristics
69

NADC-88066-60
TABLE 38. Conventional pump losses
Percentage Losses
Loss Area 0% Flow 20% Flow 100% Flow
Internal Friction 7 8 10
Internal Leakage 71 68 64Fluid Losses 4 5 6
Fluid Compression 11 12 13
Fluid Windage 7 7 7
TABLE 39. Design comparisons
CONVENTIONAL HYBRID CHECKIN-LINE PUMP VALVE PUMP
Rotating Barrel Nonrotating BarrelHigh Compensator Forces (No Windage Losses or Centrifugal
(Pintle Bearings Highly Loaded) Forces)Low Compensator ForcesPrincipal Leakage Paths: (Pintle Bearings Not Reqd)
- Barrel/Port Plate Interface- Piston ShoelCam Interface Principal Leakage Path:- Compensator Control Circuit - Piston Shoe/Cam Interface
Pump Cooled by Fluid Throttled From (Low Pressure Leakage)
8000 PSI Pump Cooled by Low Pressure Inlet Fluid
70

NADC-88066-60
A Hybrid Check Valve (HCV) pump has the potential to reduce losses in the
low flow operating range. A design comparison of the HCV pump concept with
the conventional inline pump is given in Table 39. Predicted performance
for the HCV pump is compared to the conventional in-line pump in Figure 25.
A significant reduction in losses is projected in the low flow region.
Translating these savings to the 40 GPM baseline pumps results in a
substantial decrease in pump losses (18 hp/pump) and a minor weight
reduction. Table 40 lists the potential weight and fuel savings which would
accrue by using HCV pumps in the baseline system. These savings would
produce a 4.1% reduction in hydraulic system energy consumption which is
equivalent to a 74 lb weight reduction.
2.4.1.2 Integrated Actuator Package (IAP). IAP's are a general class of
flight control actuator which are electrically powered and have
self-contained hydraulic power supplies. The IAP consists of an electric
motor driven pump, reservoir, check valves, filter, relief valves,
associated plumbing and hydraulic actuator. Power is supplied by the
aircraft electrical system. A comparison of IAP's with conventional
actuation is shown in Figure 26. The IAP can be used in place of an
actuator powered by a centralized hydraulic system, or as a back-up unit in
case of central hydraulic system failure. The output can be controlled
mechanically, electrically (fly-by-wire), or both. Principal reasons for
using IAP's are applications where 1) centralized hydraulic systems are not
employed, 2) survivability is critical, 3) vulnerability to hostile ground
and air fire must be reduced, and 4) small loads are located long distances
from the central hydraulic power supply.
071

NAC-88066-60
PREDICTED HCV PUMP PERFORMANCE
8000 Lbri Pump7500 - Discharge Pressure----SdPm
DischargetdPm
-Prsur 7pee0 5900 RPM- PSIInlet Fluid Temp___001 _ _____ ____ ____ __ _+ 2009F
sofficienIcyy 4
- -- --- 20~ - 4PRatd)
40 - __i
Flow - (QRat )
Figure 25. Predicted HCV pump performance
TABLE 40. HCV pump energy savings
" A Losses -18 Hp/Pump
" A Weight" Pump (+ 6%) + 6.20 Lb" Heat Exchanger - 13.00 Lb
*AFuel per A/C Life+i Losses - 0.43 M-Lb+ Weight - 0.02 M-Lb
Total - 0.45 M-Lb (.%
,'2
NADC-88066-60
.There are three basic types of IAP's:
Simplex The simplex IAP contains a single non-redundant
actuator and a single motor/pump unit.
Duplex The duplex IAP has two independent electric motor
driven hydraulic power supplies, each providing
hydraulic power for one-half of a dual tandem
actuator.
Triplex The triplex IAP contains three independent
electro-hydraulic power supplies. Two full-time
power supplies provide primary hydraulic power
for a dual tandem actuator, and a third unit
provides emergency power in the event of a
primary system failure.
IAP's have been used in many applications beginning in the 1940's. The
challenge of designing IAP's for high performance military aircraft lies in
dealing with severe weight and envelope penalities and in overcoming the
localized heat generation/dissipation problems.
73

NADC-8806( -60
Design Load Point-80% Hm, 60% 6mx
lAce
Covetina -73
Porscr p ly Weiht lb Sple0eeec
(3000 ~ ~ 00 psdu stndi irrf
Simplex lP 71r(2)micseionIon
Duplx ZP 16n (4 V6
(1)ur 26. p ficauienum cmaion s cnetoa actuatoroody
(2) Strbippedown A ctuator bo8 Serv pMpoered on 4ys
(3)0Tw piec suel cta to boy.Stnd rda fwthsfcu-f
(4) ~~8 Does not 2nld etxhnes
74 G

NADC-88066-60
Several IAP development programs were conducted during the Southeast Asia
conflict period of 1968 through 1971, references 2 through 6. The goal of
these programs was to improve aircraft survivability from ground fire. Major
participants in the programs included McDonnell Aircraft, LTV Electrosystems,
Sperry-Vickers, and General Electric. Prototype simplex and duplex IAP's
were built to meet the requirements of the F-4 aircraft horizontal
stabilator. Laboratory and flight tests were conducted. The programs
demonstrated that although performance requirements were generally met, IAP
weight and volume were areas of concern. Weights of the various units are
given on Table 41.
Government sponsored development of IAP's ceased after completion of the
above referenced programs. A literature search covering 1972 to 1985 has
disclosed no further development effort.
The application of IAP's to energy efficient hydraulic systems must consider
IAP weight as a primary factor since component weight and the accompanying
growth factor are directly related to aircraft fuel consumption. IAP weight,
however, is partially offset by some weight savings that occur when IAP's are
employed. The net change determines whether a weight advantage or penalty
occurs by using IAP's.
Components Added Components Eliminatedor Re-sized or Re-sized
IAP Servo actuatorPower wiring/control Hydraulic transmission LinesElectrical generator (larger) System reservoir (smaller)
Filters and valves (smaller)
075

NADC-88066-60
Other 1-ctors such as IAP size (installability), redundancy, reliability,
complhxity, logistics, maintainability, survivability, vulnerability and
cost should also be considered. However, the fundamental factor to be
considered for energy savings is weight.
The net weight differentials between 1) power wiring and hydraulic
transmission lines, and 2) electrical generator (larger) and hydraulic
system pump (smaller) are considered minor. Reductions in reservoir,
filter, and valve sizes are also considered minor. The principal weight
difference occurs between the IAP and the servo actuator that it replaces.
IAP's developed in the early 1970's were 2 to 4 times heavier than the
original actuator. This is obviously a severe weight penalty for the
benefits realized.
As a result of recent technological advances, a second look at IAP's is
currently being taken. The new package is termed an electro-hydrostatic
actuator (EHA). Severdl suppliers have built and tested state-of-the art
EHA's that employ rare earth magnetic materials, electronic power switching,
and microprocessof- control. Design details are considered proprietary. Onesuch unit is a 3000 psi simplex design with 9700 lb maximum output, a swept
volume of 15 in3 , and a weight of 38 lb.
A direct comparison of this state-of-the-art unit with the 1970 simplex
IAP's cannot be made because the 1970 IAP's had maximum outputs and strokes
more than twice those of this new EHA. The weight ratio can be computed
however, and compared with the earlier units, Table 42. It would appear
that changes in the state-of-the-art have had little effect upon weight.The weight ratio of the 1985 unit falls within the range of the 1970 units.Results of an energy analysis applied to IAP's are summarized in Table 43.A servo pump design such as that used in the Vickers Simplex package was
assumed for a duplex IAP and substituted for the baseline horizontal
actuators. This unit would have a weight ratio of 3.6. As shown in Table
43, fuel consumption, due to package weight, increased significantly.
76

NADC-88066-60
TABLE 42. IAP weight comparisons
WEIGHTCONVENTIONAL lAP IGRT RATIO
(LBS) (LBS) (IAP/CONV)(LBS)
SIMPLEXVickers 1970 33 71 38 2.2LTV 1970 33 88 55 2.7GE 1970 33 102 69 3.0EHA* 1985 14 38 24 2.7
DUPLEXLTV 1970 38 167 129 4.4GE 1970 38 174 136 4.6
TRIPLEXLTV 1970 38 246 (est) 208 6.5GE 1970 38 225 (est) 187 5.9
' Electro-Hydrostatic Actuator
TABLE 43. IAP energy analysis
M-LBS FUEL
BASELINE lAP
WeightActuation (53 Lbs) .37 1.33Lines .11 0.06
Leakage .04 0.04*
Usage .08 0.02Generator n, .00 0.00Pump A .00 0.00
Total .60 1.45
lAP for Horizontal Actuation Increases EnergyConsumption 8% and Increases Weight 260 Lbs
* Assumed
77

NADC-88066-60
There was a minor reduction due to replacement of 30.2 lbs of hydraulic
lines with 16.4 lbs of wire and contactors and a slight reduction due to a
higher overall efficiency (usage) of the IAP approach. The net result,
however, is an increase from 0.6 to 1.45 M-lb of fuel which constitutes an
8% fuel consumption increase. System weight of the IAP configuration
increased 366 lb.
IAP's and EHA's offer advantages in redundancy, survivability, and reduced
vulnerability, but initial costs of ownership are high and they do not
improve overall aircraft operating efficiency. IAP's are therefore not
recommended for high efficiency hydraulic systems because of the weight
penalty that accompanies their use.
2.4.2 Distribution System
The distribution system was designed using 5 different approaches. In
design No. 1 (or baseline), the system was configured in accordance with
procedures discussed in section 2.3.2 using 3Al-2.5V titanium material, and
EVEN dash number tube sizes; tube data is presented in Table 44. A total
distribution system weight of 364 Ib, which includes fittings, clamps, and
fluid was established for the baseline.
Design No. 2 utilized ODD/EVEN tube sizes: ODD for pressure lines (thick
wall) and EVEN for return lines (thin wall), Table 45. This is a design
method to provide a "Murphy Proof" way of using thin wall tubes for return
lines. All other aspects of design No. 2 were the same as design No. 1. A
total weight of 332 lb was established for design No. 2; this is a 32 lb
weight savings over design No. 1.
78
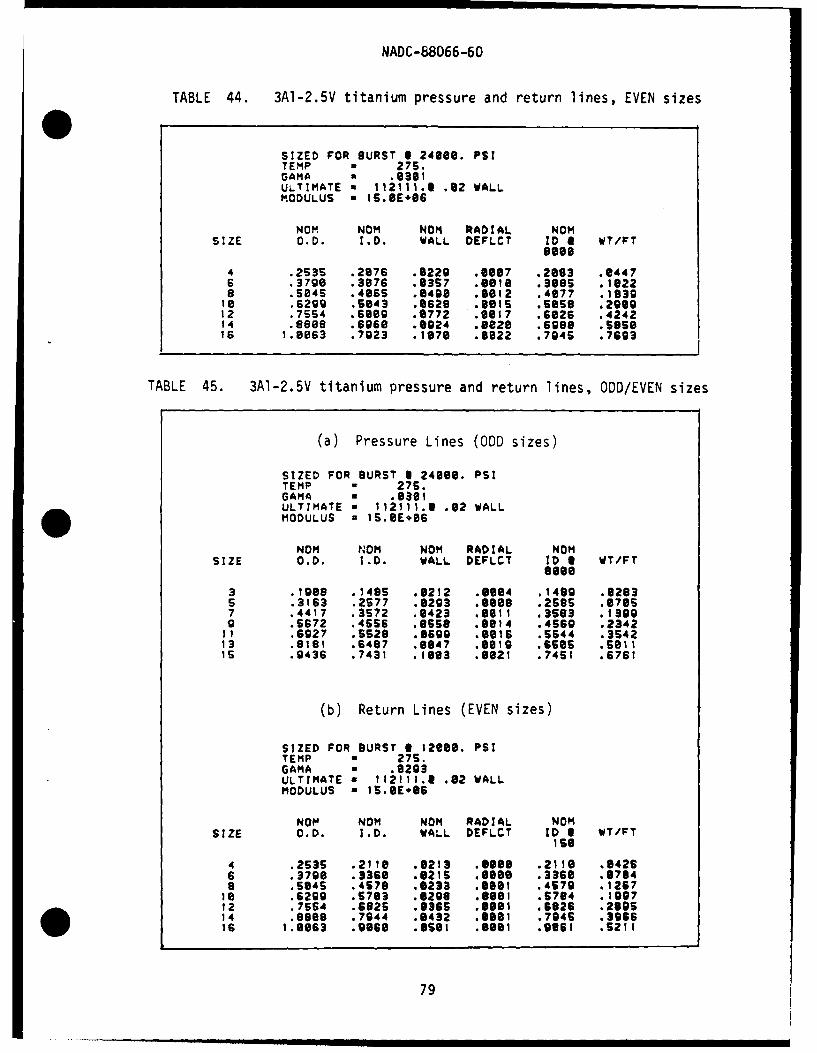
NADC-88066-60
TABLE 44. 3A1-2.5V titanium pressure and return lines, EVEN sizes
SIZED FOR BURST 6 24000. PSITEMP a 27S.GAMA a .6361ULTIMATE a 112111.1 .92 WALLMODULUS a I5.GE6
NOM NOM NOM RADtAL NOMSIZE O.D. 1.0. WALL OEFLCT ID 8 WT/FT
9ee6
4 .2S3S .2076 .6229 .00917 .263 .e4476 .3790 .3076 .93S7 .601s .985 .1022a .5045 .4065 .6409 .6612 .4677 .193910 .6299 .5643 .962 .e6ls .SOSO .29912 .7SS4 .6609 .0772 .0017 .6026 .424214 .8993 .6960 .0924 .8e20 .6986 .S85eis 1.9963 .7923 .1970 .6622 .7945 .7693
TABLE 45. 3A1-2.5V titanium pressure and return lines, ODD/EVEN sizes
(a) Pressure Lines (ODD sizes)
SIZED FOR BURST 1 24666. PSITEMP 275.GAMA * .9391ULTIMATE w 112111.1 .62 WALLMODULUS x IS.SE6
NOM NO0M NOM RADIAL NOMSIZE O.D. 1.0. WALL DEFLCT t1D I WT/FT
Sso3 .1908 .1405 .6212 .6904 .1409 .62835 .3163 .2S77 .0293 .908 .259S .67es7 .4417 .3S72 .9423 .1611 S3603 .19999 .5672 .4566 .6g58 .9014 .4569 .234211 .6927 .S528 .9699 .6616 .5S44 .354213 .9181 .64817 .11947 .0919 .b565 .50111s .9436 .7431 .193 .6621 .74St .6761
(b) Return Lines (EVEN sizes)
SIZED FOR BURST 6 121100. PSITEMP a 275.GAMA a .0293ULTIMATE a 112111.0 .02 WALLMODULUS aIS-6E+06
NOM NOM NOM RADIAL NONSIZE O.D. I.0. WALL DEFLCT ID I WT/FT
ISO
4 .253S .2110 .0213 .0009 .2110 .94266 .3790 .3369 .021S .6666 .33603 .6704a .594S .4578 .0233 .666? .4S79 .126716 .6299 .5763 .0296 .600 .6764 .109712 .7554 .6825 .0365 .091 .6926 .295S14 sees8 .7944 .0432 .9961 .7946 .396616 1.9663 .9660 O69O? .6661 .0361 S521f
79

NADC-88066-60
Design No. 3 involved the use of localized velocity control to reduce water-
hammer transients. A short length of larger tube size is used adjacent to
fast acting valves. This reduces local fluid velocity and therefore the
transient magnitude. All other aspects of design No. 3 were the same as
design No. 2. This approach was found to have negligible effect on weight
because 1) nearly all the tubes were sized by pressure drop requirements
rather than transient requirements, and 2) the individual velocity reduction
tubes (not feed lines) were fairly short in length.
Design No. 4 utilized 15-3 titanium material. A discussion of this new alloy
is contained in section 2.4.8.2. Tubing wall thickness was sized for 12,000
and 24,000 psi burst pressures for return and pressure lines, respectively.
Table 46 lists tube wall thickness values. The total weight for design No. 4
was established as 265 lb -- a 67 lb reduction over designs No. 2 and No. 3.
Design No. 5 utilized 15-3 titanium and reduced tube design margins. Return
and pressure lines were sized for 10,000 and 20,000 psi burst pressures,
respectively. The distribution system was then designed using this new size
tubing, Table 47. All other aspects were kept the same as design No. 4.
Only a minor weight savings of 3 lb was achieved by the use of reduced design
margins. This was principally due to the requirement for a 0.020 in. minimum
wall thickness to prevent denting and handling damage. Most of the return
lines and a large percentage of the pressure lines were not affected by the
lower design margins. Reduced margins would have a more pronounced effect on
the 3AI - 2.5V titanium tubing design. Since the savings were so small,
reduced safety margins are not recommended.
Fuel consumption was computed for each of the five distribution system design
approaches. Since the usage fuel consumption component is small in relation
to the weight fuel consumption component, and since the line loss component
would be only a small fraction of the usage component, the line loss
component was neglected. Fuel consumption for the distribution system
designs was therefore based solely upon weight. Table 48 summarizes the 5
design approaches and lists the associated fuel consumption in terms of M-lb
80

NADC-88066-60
TABLE 46. 15-3 titanium pressure and return lines, ODD/EVEN sizes
(a) Pressure Lines (ODD sizes)
SIZED FOR BURST f 24088. PSITEMP a 275.GAMA v .031ULTIMATE a 172467.0 .e2 WALLMODULUS = 1S.9E+O9
NOM NOM NOM RADIAL NOMSIZE C.D. I.D. WALL DEFLCT ID 2 WT/FT
6886
3 .1988 .1485 .9212 .9984 .1499 .82935 .3163 .2735 .0214 .8012 .2747 .06167 .4417 .3897 .026S .8818 .aes .11349 ,5672 .4981 .8345 .B823 .804 .1892
tt .6927 .6076 .6425 .8929 .6184 .291913 .8181 .7170 .8685 .8833 .7203 .3943is .9436 .82S .8ses .e938 .9303 .5257
0 (b) Return Lines (EVEN sizes)
SIZED FOR BURST e 12880. PSITEMP a 275.GAMA v .0293ULTIMATE - 172487.2 .92 WALLMODULUS a IS.SE+96
NOM NOM NOM RADIAL NOMSIZE O.D. I.D. WALL DEFLCT ID 9 WT/FT
158
4 .2535 .2110 .8213 .988 .2118 .04396 .3790 .3368 .9215 .889e .3368 .084a .5045 .4610 .8217 .98) .4611 .1259IS .6299 .Ses .8220 .981 .6961 .19312 .75S4 .71s .0224 .9881 .7107 .244614 .eeo8 .6298 .0264 .8801 .8281 .3339i6 1.0963 .94S4 .8304 .892 .9456 .4378
81

NADC-88066-60
TABLE 47. 15-3 titanium pressure and return lines,ODD/EVEN sizes, reduced design margin
(a) Pressure Lir, s (ODD sizes)
SIZED FOR BURST 1 29000. PSITEMP a 27S.GAMA w .9391ULTIMATE a 172407.3 .02 WALLMODUL.US a 1S.OE+96
NOM NOM NOM RADIAL NOMSIZE C.D. I.D. WALL DEFLCT ID a WT/FT
3 .1908 .149S .9212 .6694 .1499 .0293S .3163 .2735 .0214 .0912 .2747 .96167 .441.7 .3g7g ,tWO .6023 .4902 .10389 .5672 .S19o .0296 .8028 .5128 .1725
11 .6927 .6221 .9383 .0034 .6265 .258413 .181 .7341 .9429 .0940 .7991 .3616IS .9436 .8462 .6467 .646 .8698 .4822
(b) Return Lines (EVEN sizes)
SIZED FOR BURST 1 19999. PSITEMP a 275.GAMA - .0293ULTIMATE a 172487.1 .92 WALLMODULUS 9 15.6E*96G
NOM NOM NOM RADIAL NOMSIZE O.D. I.D. WALL DEFLCT ID I WT/FT189
4 .2S38 .2110 .6213 .99 .2116 .04396 .3790 .3369 .6215 .0060 .3360 .88048 .5045 .4610 .6217 .01 .4611 .1259
19 .6299 .S96 .6220 .6001 .S861 .189312 .78S4 .7119 .6222 .6601 .7111 .243014 .9998 .6360 .0224 .6062 .0362 .3162Is 1.0963 .SGS .6240 .6082 .9567 .4991
82
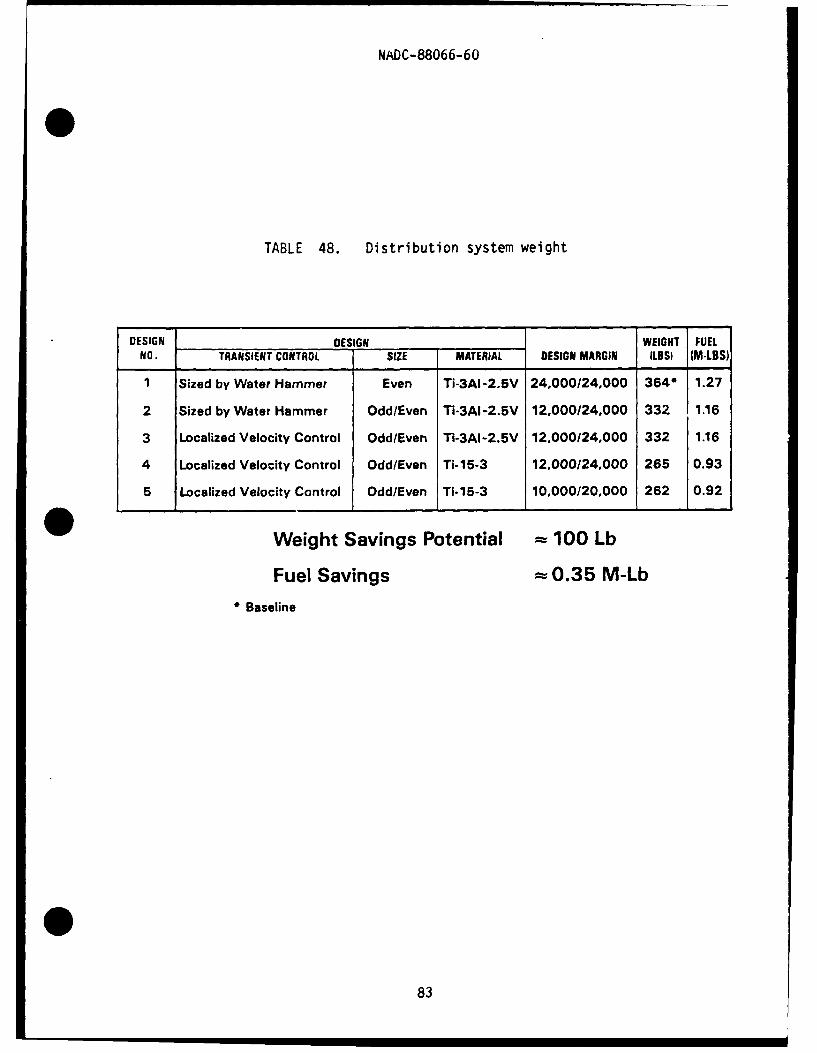
NADC-88066-60
TABLE 48. Distribution system weight
DESIGN DESIGN WEIGHT FUEL
NO. TRANSIENT CONTROL SIZE MATERIAL DESIGN MARGIN ILBS) (M-LBS)
1 Sized by Water Hammer Even Ti-3A1-2.5V 24,000/24,000 364* 1.27
2 Sized by Water Hammer Odd/Even Ti-3AI-2.5V 12,000/24,000 332 1.16
3 Localized Velocity Control Odd/Even Ti-3AI-2.5V 12,000124,000 332 1.16
4 Localized Velocity Control Odd/Even Ti-15-3 12,000/24,000 265 0.93
5 Localized Velocity Control Odd/Even Ti-15-3 10,000/20,000 262 0.92
Weight Savings Potential 100 Lb
Fuel Savings 0.35 M-Lb
Baseline
83

NADC-88066-60
of fuel per aircraft per life. The analysis shows that the distribution
system weight can be reduced 100 lb by using 15-3 titanium tubing and
ODD/EVEN line sizing. Considering the weight growth factor, this would lower
the GTOW by 250 lb and save 0.35 M-lb of fuel during the life of the aircraft.
2.4.3 Accumul ators
IR&D efforts at Rockwell have shown that helium gas has an appreciably higher
energy storage capability than nitrogen (which is commonly used to charge
accumulators) and is significantly higher at temperatures below O°F.
However, the low atomic weight of helium causes sealing problems. Helium gas
will permeate conventional seals used in accumulators causing loss of
precharge. Rockwell and Metal Bellows Corporation (recently merged with
Parker Hannifin) have jointly developed an 8000 psi helium charged.
accumulator that successfully contains helium gas. Two units have been built
and tested: an 8000 psi laboratory unit (60 cubic inches) and a larger 8000
psi unit (125 cubic inches) for an Air Force application. The advantage of
helium accumulators is reduction in size and weight which translates into
overall fuel savings. Less maintenance is needed since the units are
hermetically sealed and do not require service during their life.
The baseline aircraft employs four accumulators; two brake accumulators, one
APU start accumulator and one arresting hook accumulator. The brake and APU
start accumulators are conventional stand-alone piston type accumulators and
are directly replaceable with metal bellows type accumulators. The arresting
hook accumulator is typically integral with the actuator. Time did not
permit a design study to determine if the Metal Bellows design would be
compatible with arresting hook requirements, therefore this analysis was
based upon replacing only the first three accumulators. Figures B-8 and B-9
84

NADC-88066-60
* (in Appendix B) present energy storage and weight data as a function of
accumulator volume. Data is given for both nitrogen and helium charged
accumulators. Studies indicate nitrogen accumulators are heavier and larger
than helium accumulators.
Data from Figures B-8 and B-9 were used to estimate the weight and volume of
nitrogen and helium accumulators for the baseline vehicle requirements.
These estimates indicate a weight reduction of 33.2 lb and a volume reduction
of 138 in3 can be achieved by using helium accumulators. This weight
reduction equates to a fuel savings of 0.12 M-lb per aircraft per life.
Weight, volume and energy estimates are summarized in Table 49.
2.4.4 Advanced Actuation
Four advanced hydraulic actuation concepts were investigated: rotary vane,
variable displacement, slimline, and pressure intensified actuators. Rotary
vane hingeline actuation was chosen for the baseline vehicle due to moldline
constraints imposed by advanced aircraft, that is, very thin wings with
full-time variable camber control. Trade data developed for rotary actuation
in prior Rockwell studies was used as the basis for weight, volume and
performance estimates presented in this section. The remaining three
actuation concepts were investigated and compared against the baseline
concept. The following subparagraphs discuss these concepts and their impact
upon energy consumption.
85

NADC-88066-60
TABLE 49. Metal bellows accumulators energy savings
ENERGY STORAGE NITROGEN HELIUMITEM (FTILBSJ WT VOL WT VOL
(LBS) (11) (LBS) (IN)APU Start 6000 52.8 370 28.9 280
Brake
Ground (Diff) 1689 18.0 190 12.0 155
Emergency 844 12.3 150 9.0 137
9422 83.1 710 49.9 572
Weight Reduction-33.2 Lb
Energy Savings/Aircraft-0.12 M-Lb Fuel1%)
86

NADC-88066-60
2.4.4.1 Variable Displacement Actuators. Conventional fixed displacement
actuators are sized for the stall load, and its control valve is designed for
the maximum no-load rate. Once the actuator and valve sizes are established
(by flight envelope requirements), power consumption of the actuator/valve
assembly is also established. Valve losses increase as actuator load (hinge
moment) decreases, reaching a maximum at no-load where nearly all power is
consumed by fluid throttling across the valve, Figure 27.
One method for reducing throttling losses is to match the power capability of
the actuator to the power demand of the load. This must be done on a
continuous basis and requires a variable displacement actuator. One variable
displacement actuator concept consists of a variable displacement hydraulic
motor driving a rotary mechanical actuator. A small servo controls motor
displacement (cam plate angle) as a function of load and position commands.
The load sensing servo-mechanism is similar in complexity to those used in
variable displacement pumps. The motor provides only sufficient torque to
drive the load at the demanded rate, thus minimizing throttling losses.
Figure 28 depicts a variable displacement actuator concept. This concept has
been investigated in detail by Sundstrand Corporation, reference 7. The
variable displacement motor approach depicted in Figure 29(a) was compared
with the fixed displacement motor design shown in Figure 29(b). It was
established that the variable displacement concept could save from 50 to 80%
in average power consumption for specific duty cycles. Control schemes were
developed and shown to provide good actuation bandwidth.
The variable displacement concept was applied to the baseline vehicle flight
controls. Rotary mechanical actuators such as shown in Figure 28 were used
in wing and rudder applications; a variable displacement motor driving a
ballscrew actuator was used to power the horizontal tail surfaces. Leakage
and weight data are compared to the baseline in Table 50. This data is based
upon trade study information contained in Appendix B. Weight data for the
rotary mechanical actuation concept was projected from actual values used on
87

NADC-88066-60
Ac~~~u~~c~ WC IL ~ ~)
Figure 27. Control valve load/flow characteristics
Variable Displacement Actuators
IHydraulic AtIFi cI otr TorqueDo
Hydraulic Gear Ga
Ioqu I
P~.ower Drive Unit (PDU_
Figure 28. Variable displacement actuator concept
88

NADC-88066-6U
ISOLATIONSEVVAESOLENOIDVALVE
ELECTROVEYLRAULY
SER VAV
RETUNLESUPPLY HVOu!ULIC
REUROMTROLUC(b) Fxed isplaemen
Figue 29 Vaiabl andfixd diplacmen motr vaveOchemtic
SHUT-OF

NADC-88066-60
TABLE 50. Variable displacement actuation, weight and leakage comparisons
SURFACE ACTUATION BASELINE VARIABLE DISPLACEMENTTYPE LEAKAGEJACT WEIGHT LEAKAGEIACT WEIGHT
(GPM) (LBS) (GPM) ILBS)1 LE Outbd Rotary 0.078 181 0.203 247
2 LE Inbd Rotary 0.083 188 0.226 240
3 TE Outbd Rotary 0.120 184 0.405 243
4 TE Inbd Rotary 0.129 199 0.450 235
5 Rudder Rotary 0.145 103 0.267 153
6 Horiz. Linear 0.586 106 1.330 147
3.1 961 8.3 1265
Weight - + 304 LbLeakage = + 5.2 GPM
TABLE 51. Variable displacement actuation, fuel consumption comparisons
Fuel - M-Lb
BASELINE VARIABLEDISPLACEMENT
Usage .4784 .2545Leakage .2268 .3928Pump .7015 .7015Weight 9.4690 10.4800
10.880 11.8300 (+8.7%)
90

NADC-88066-60
the B-lB aircraft rudder and wing leading edge actuation systems. Leakage
O for the variable displacement approach is higher than the baseline because
hydraulic motors have more internal leakage than spool/sleeve type control
valves.
Energy consumption was computed and is compared to the baseline in Table
51. The usage component for the variable displacement concept is reduced to
about half the baseline; the leakage component is nearly double; the pump
component is the same since the same size pump is required; and the weight
component increased significantly. The net result is an increase in fuel
consumption of 0.95 M-lb fuel per aircraft life or 8.7% higher total
hydraulic system energy consumption than the baseline. The added weight of
the variable displacement design completely dominates net fuel consumption.
Even if the pump component could be reduced 200, the concept would still
increase fuel consumption 0.81 M-lb or 7.4%.
A second method for achieving variable displacement involves the use of a
dual tandem hydraulic actuator. Displacement is changed by placing one side
of the actuator in a by-pass mode. The unit would perform as a single
actuator under normal operating conditions. When full hinge moment is
required, both halves of the actuator would be powered. This is similar to
the dual pressure level system approach except its on an actuator basis.
Energy savings were computed to be 0.23 H-lb of fuel per aircraft life,
Figure :sU. Tnis is 2.1% of the total hydraulic system fuel consumption.
The principal disadvantage of this approach is the additional hardware and
complexity required to switch from one mode to the other. The dual pressure
level system concept provides comparable savings and is simpler.
9191
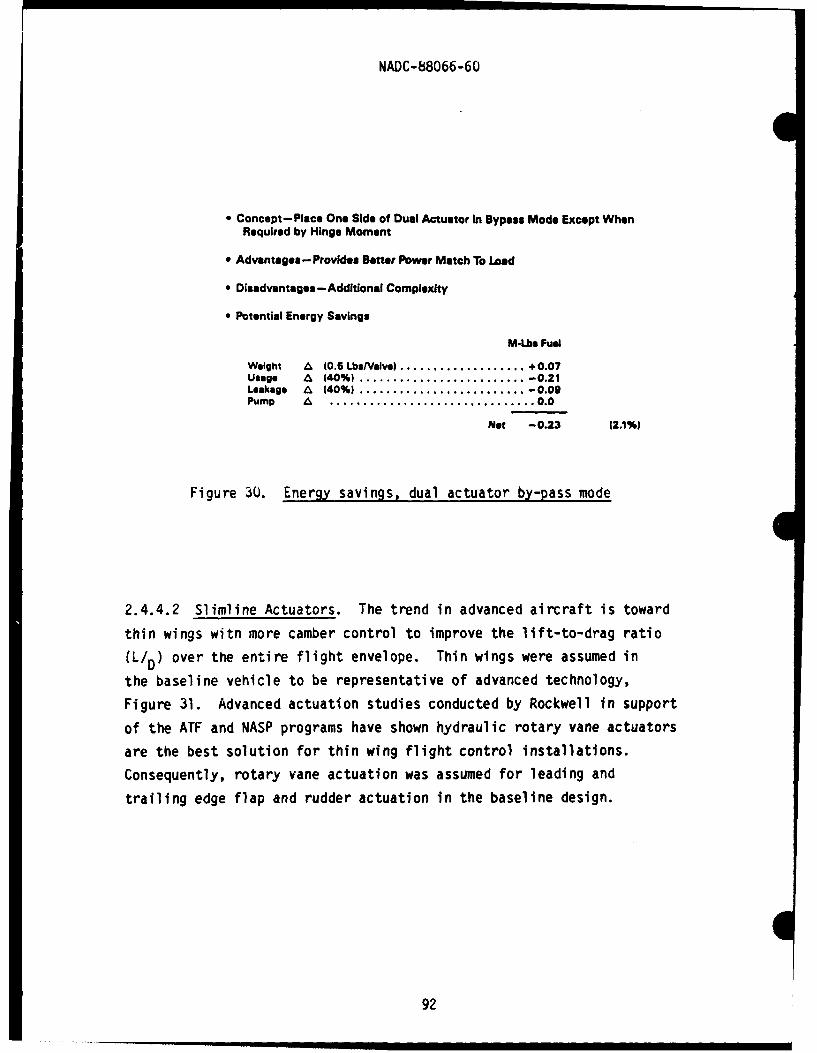
NADC-b8066-60
* Concept-Place One Side of Dual Actuator In Bypass Mode Except WhenRequired by Hinge Moment
" Advantages-Provides Better Power Match To Lad
" Disadvantages-Additional Complexity
" Potential Energy Savings
M-Lbs Fuel
Weight & (0.5 Lbs/Vive) ................... +0.07Usage & (40%) ......................... -0.21Leakage A (40%) ......................... -0.09Pump A ............................... 0.0
Not -0.23 (2.1%)
Figure 30. Energy savings, dual actuator by-pass mode
2.4.4.2 Slimline Actuators. The trend in advanced aircraft is toward
thin wings witn more camber control to improve the lift-to-drag ratio
(L/D) over the entire flight envelope. Thin wings were assumed in
the baseline vehicle to be representative of advanced technology,
Figure 31. Advanced actuation studies conducted by Rockwell in support
of the ATF and NASP programs have shown hydraulic rotary vane actuators
are the best solution for thin wing flight control installations.
Consequently, rotary vane actuation was assumed for leading and
trailing edge flap and rudder actuation in the baseline design.
92

NADC-88066-60
Figure 31. Baseline wing torque box thickness
0.16.
'2 ___
............... ....... . . . .
I+UiJ.~
70i 480. STL HIG .OET 100 .I. ....0L 7 _ _ _ _ _ _ _Figur 32- Van acutr-nenl-ekg
fl L 93

NADC-88066-60
"Slimline" is a term coined by Rockwell to describe a class of advanced,
low-profile, 8000 psi flight control linear actuator which has the control
valve mounted in an axial location rather than on the side. Two
configurations were evaluated for the trailing edge flap application in the
baseline aircraft: 1) a conventional bellcrank arrangement which requires
wing pods to house the actuators; and 2) a hingeline installation which
uses a mechanism to convert linear piston motion to angular control surface
motion. These installations are depicted in Figures 33 and 34. Preliminary
designs were conceived for both installations to establish the kinematics,
size and weight of each.
The pod installation has a bellcrank am length of 4.4 inches. This was
found to be the best compromise between size, weight and hinge free-play
(resolution). Pod envelope dimensions to accommodate this design are given
in Table 52. Eight pods are required. Energy consumption for the pod
installation was computed and is compared with the baseline in Table 53.
Weight of the pod design was estimated to be 76 lb less than the baseline.
A weight estimate breakdown is given in Table 52. Linear actuator weight
alone is considerably less than the rotary vane actuator, however, when
actuator supports, bellcranks and pods are included, the difference is
reduced. Weight reduction saves energy. Linear actuators do not have as
much internal leakage as rotary vane actuators; this also saves energy.
A limited amount of data is available on vane actuator seal leakage.
Several suppliers are developing rotary actuation for thrust vectoring on
engines and for vane actuation. Based upon limited data from such programs,
actuator leakage at stall versus stall hinge moment (actuator size) was
estimated and is presented in Figure 32. This data was used to compute the
fuel consumption due to leakage for dynamic loading and found to be
insignificant because the average differential pressure is quite low.
Steady state loads result from trim conditions. Longitudinal trim is
accomplished by the horizontal stabilizer which utilizes a linear actuator.
94

NADC-88066-60
Trailing Edge Flap Application
BASEUNE-ROTARY VANE
Rotor Vans a WT - 0
UNEAR-PODS 4POD INSTALLATION
CD C- 1% to 3%WT - -76 LbsLinear
LINEAR-HiNGELINE
" CD - 0.1%
A WT - 0 HINGEUNE INSTALLATION
Figure 33. Slimline actuation
LINEAR-HINGELINEROTARY VANE R.!-
-. 50K ML14.2T -4 HL
Wt -20 Lb HM 9 0K 1.
Wt - 2 Lb HM - 6OK to 70.8KR. F.S. R.S. P.S.
Fuel$osFeSpc
o - .040 Ve ,.0439
St..Fue SA e 1. pse v 42 Ave
Cose I Case It
Baseline Thin Wing Pianform Fuel Space Thin Wing Planform Fuel Space AvailableAvailable With Rotary Actuators With a Unsur Actuator MountedMounted on the Hingeilne Parallel to the Raar Spar and Wing
Thickness Increased To Maintain theSame Fuel Volume As Case I
Estimated Aircraft A Drag Between Case I (Baseline-Rotary) and Case II (UncarlACO a +.I% for Case II
Figure 34. Thin wing fuel space availability
95
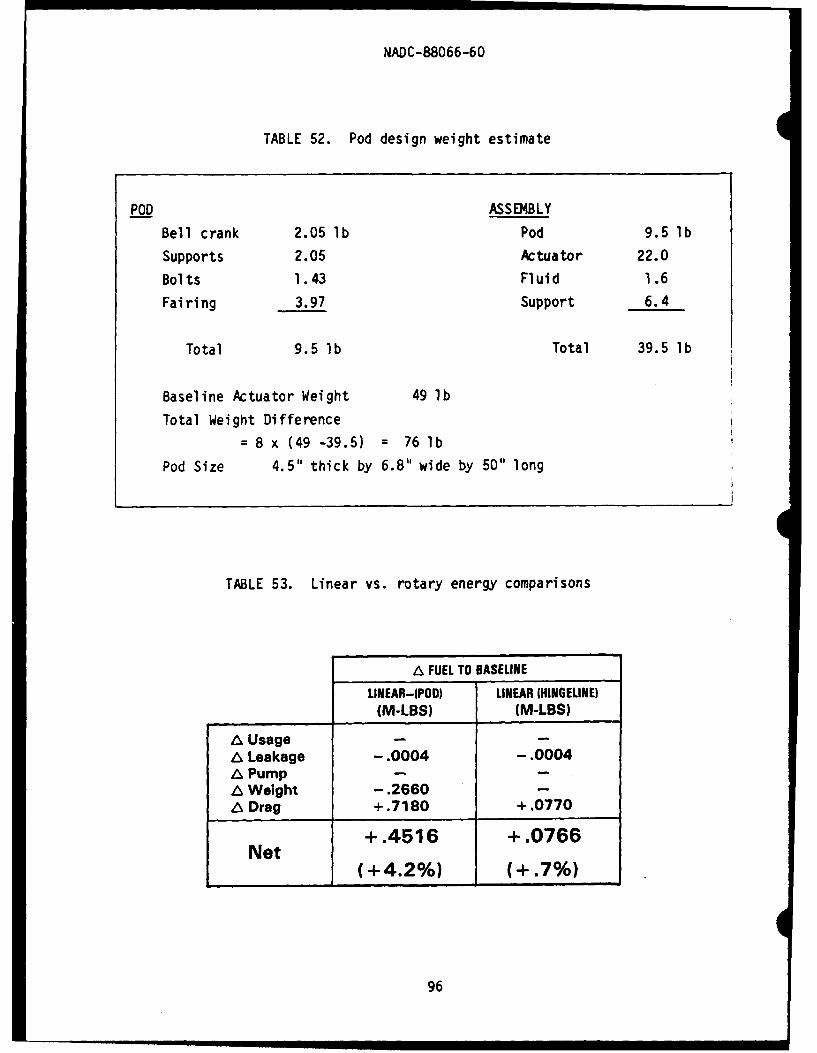
NADC-88066-60
TABLE 52. Pod design weight estimate
POD ASSEMBLY
Bell crank 2.05 lb Pod 9.5 lb
Supports 2.05 Actuator 22.0
Bolts 1.43 Fluid 1.6
Fairing 3.97 Support 6.4
Total 9.5 lb Total 39.5 lb
Baseline Pctuator Weight 49 lb
Total Weight Difference
- 8 x (49 -39.5) = 76 lb
Pod Size 4.5" thick by 6.8" wide by 50" long
TABLE 53. Linear vs. rotary energy comparisons
A FUEL TO BASELINE
LINEAR-IPOD) LINEAR (HINGELINE)(M-LBS) (M-LBS)
A UsageA Leakage -. 0004 -. 0004A PumpA Weight -. 2660ADrag +.7180 +.0770
+.4516 +.0766Net
(+4.2%) (+.7%)
96

NADC-88066-60
Lateral and directional trim conditions are minimal except for asymmetric
stores conditions which, on a percentage basis over the life of the aircraft,
occur infrequently and do not produce significant energy losses. The leading
edge flap actuators carry a steady state load which varies as a function of
Mach number. An estimated mission average load for the leading edge flaps is
10% of stall. Based upon this load and the leakage characteristics in
Figure 32, 3130 pounds of fuel will be consumed by the leading edge
actuators; 150,000 pounds of fuel consumption results from servo valve
leakage.
2.4.4.3 Pressure Intensified Actuators. The pressure intensifier actuation
concept is compared with a conventional design in Figure 35. In essence, a
pressure intensifier is placed upstream of the control valve. During low
hinge moment load conditions the intensifier is "off"; at high loads the
intensifier is "on" and pressure to the control valve is boosted 150%. In an
80UU psi system, the actuator/valve would be designed to operate at 12,000
psi. The higher pressure is employed only to meet the stall hinge moment
requirement. Smaller actuators require less flow to produce the same surface
rate. Thus, during low load conditions (which occur during the majority of
flight time), less power would be extracted from the engines than with
conventional actuation. The system should be more efficient because the
actuator/valve design more closely matches the load over the operating
envelope and less power is wasted in the control valve.
An actuation system must be designed to meet all requirements, thus in the
conventional system, actuator displacement would be based on stall hinge
moment and supply pressure, and the valve would be sized by the maximum
no-load rate requirement(6I,)" The operating envelope of this approach is
labeled "Conventional Design," Figure 35. The design-load point is met since
it is within the envelope. The three design points can also be met with the
Pressure Intensifier (PI) approach. Sizing the actuator to provide 2/3 stall
hinge moment at supply pressure results in a smaller actuator which requires
only 2/3 of the flow to meet the no-load rate requirement. This approach
97

NADC-88066-60
Rate
Pressure Intensifier Design
Conventional Design
D esign Load
oHinge Moment-102/ .
PS 3 /2 PSPS _E c T PS SIt H Ak AT
CONVENTIONAL DESIGN PRESSURE INTENSIFIER DESIGN
Figure 35. Pressure intensifier approach
RATE
Max rate capability
Curve B
Cross-over
A Curve A
8Max reqm't ,,..- Design load point
-T HINGE MOM~ENT
-H Mstal 0 2/3H MStall HMMax
Figure 36. Pressure intensifier design curves
98

NADC-88066-60
also provides greater rate capability in the negative load region (aiding
loads). The stall hinge moment requirement(HtA, 5 () is met by the boost
pressure supplied by the pressure intensifier. The control valve is sized
by the nc load rate requirement.
Baseline system requirements are such that the valve is sized by the
design-load point rather than the no-load rate requirement, as depicted by
curve 'A' in Figure 36. The pressure intensifier concept can still be
employed to save "usage" energy. The valve/actuator/PI would be sized to
provide the performance indicated by curve B. At pressures below the
crossover point the rate capability is higher than necessary and could be
limited by a restrictor or other means.
The energy per cycle extracted from the hydraulic system for a periodic
command has been shown to be equal to
Wl = 4 PS Dm A
and is linearly dependent upon actuator displacement. The PI design reduces
actuator displacement and, therefore, reduces the extracted energy/cycle.
For the 2/3 reduction in Dm design considered previously, the energy per
cycle is decreased by 1/3 when operating below the crossover point. The
total energy savings must include the efficiency of the PI and its
incremental weight change.
99

NAD-88066-60
The total energy savings afforded by the PI approach was estimated based upon
the following:
1. 2/3 reduction in 0m
2. Actuator weight vs pressure data in Appendix B
3. Pressure intensifier weight data in Appendix B
4. Replace F/C, convergent flap, and T/V flap actuators
with the PI design equivalent. Engine and utility
actuators were the same as the baseline design.
Weight and energy estimates are presented in Figure 37. Actuator weight
increases nearly 15% or 178 lb. The design utilizes 24 pressure intensifiers
which increases weight by an estimated 215 lb. Hydraulic distribution lines
and pumps were assumed to be the same as the baseline since the design load
point flow requirements are the same. A net increase in fuel consumption of
1.17 14-lb or 11% was computed for the PI design; weight increased 393 lb. If
the baseline design load eoint requirements were lowered such that maximum
power demand was set by G a reduction in pump size and lines would be
possible which would reduce consumption. This, however, could never overcome
the increase due to actuator and PI weight.
Results of the study are summarized in Figure 38. The concept has no energy
saving potential, requires 12,00U psi technology development, and increases
complexity. Finally, the dual pressure level system is a better approach to
load matching.
100

NADC-88066-60
PRESSURE INTENSIFIER-ENERGY ANALYSISApplication: Primary Controls
WeightActuation A 178 Lb 1.0
Intensifier A 215 Lb Weight O TRatio _
L in e A 0 R a io 0 .
Pump A 0Total 393 Lb 4,000 8.000 12,000
Energy M-IbUsage & -0.15
Valve Leakage A -0.06Pump a 0.00Weight A + 1.38
Net + 1.17
Pressure Intensifiers Increase Energy Consumption11% and Increases Weight 393 Lbs
Figure 37. Pressure intensifier energy analysis
0
PRESSURE INTENSIFIER SUMMARY
ENERGY SAVINGS POTENTIAL MINIMAL* (Lb-Fuel/Lb-Wt) Dominates
REQUIRES 12,000 PSI TECHNOLOGY DEVELOPMENT• Seals
" Intensifiers
" Actuators and Valves
ADDED COMPLEXITY
* 24 Intensifiers
* Actuation Control
DUAL PRESSURE LEVEL SYSTEM IS BETTERAPPROACH TO LOAD MATCHING
Figure 38. Pressure intensifier summary
l01

NADC-88066-60
2.4.5 Control Valves
A major portion of the energy consumed in operating primary flight control
actuators is in control; very little energy is expended in performing actual
work. The potential for saving energy is, therefore, high in the control
element, i.e., the valve. Power loss in spool/sleeve type valves can be
divided into two categories: 1) quiescent or leakage losses and 2) operating
or throttling losses.
Quiescent losses for a typical control valve are depicted in Figure 39.
Losses are highest at null and decrease as the spool moves away from null.
Although leakage is relatively small in direct drive valves, it is
continuous regardless of whether or not the actuator is used. In fact,
internal leakage is highest when the actuator is not being used. Quiescent
leakage, therefore, causes appreciable power loss. Operating losses increase
further due to the need for servo control of actuator position.
The spool/sleeve valve "throttles" fluid when controlling actuator rate.
This is depicted in Figure 40. For example, to move the load (PL) at a
given rate (QL) the valve must provide a pressure drop of (Ps-PL) to
reduce the supply pressure (PS) to the required load pressure. This
pressure drop (throttling) is a power loss, i.e.,
'lIIH p= 1"114
Techniques to reduce the power loss in both categories are listed below and
discussed in the following subparagraphs of this section.
Technique Category
Non-Linear Valves QuiescentAiding Load Recovery Valves OperatingFlow Augmentation Valves Operating
102

NADC-68066-60
Cc
LLi
___ __ __b___ _________ time
NULL
SPOOL POSITION AGE
Figure 39. Typical control valve leakage
PSActuator Throttling
Load LossValve_ __ ___
P L
Pump Q
~-Load
PR
PRESSURE
Figure 40. Control valve throttling
103

NADC-88066-60
2.4.5.1 Internal Leakage. The baseline system has 56 dual direct drive
servo valves with spool/sleeve type control elements. The valves were sized
based on criteria given in Table 23. Internal leakage is a function of spool
position as shown in Figure 39. Null leakage is a function of valve size
(no-load flow), internal clearances, orifice design (shape, overlap, etc),
and wear. The average leakage flow for a valve over the aircraft life was
determined by:
QAve QNul I x Cwear x CDynamic
Where, CNull = Null leakage of valve in new condition
Cwear = Factor to account for wear during valve life
CDynamic Factor to account for the fact the spool moves
dynamically and is not always at the null
position.
Null leakage in new valves was estimated from the "average quality" trend
line shown in Figure 41 and is based on empirical data acquired in the LHS
and VHP test programs. Specific data points are plotted. Wear data was
obtained from endurance tests conducted in the same programs and is presented
in Figure 42. Available data was limited to 1200 hours of usage. It was
necessary to extrapolate the curve to the 10,000 hour baseline vehicle design
life. Each point in Figure 42 represents the average of 12 valves. The
accuracy of this extrapolation of leakage as a function of time is uncertain.
Energy loss due to leakage was based upon this trend and, therefore, has this
uncertainty.
104

NAUD-88066-60
DAT SORE: LSPRGA
MECHANICA INPUT ~ -- ~ VRGEQAIT RNDLN
200 9 5__ _ __ __ _ __ _ __ __ _ __ _
0 1 2 3 4 5 6 7 8
VALVE MAX FLOW RATE, GPM
Figure 41. Control valve leakage vs. size
_______ ~NOTES___________________
50DATA SOURCE: LHS PROGRAM (12 VALVES) -
_________ ______________ *8000 PSI VALVES __________
* SINGLE STAGE SPOOL/SLEEVE0 MECHANICAL INPUT4 INLET FLUID TEMP. : +1301F_______________* DATA FOR NULL POSITION--
4 * AVERAGE LEAKAGE 0 L 39.3 CC/MIN @ t =0
0 DATA BEYOND 1200 HR IS ESTIMATED
07 3 . .
2:
1-=. -m r7 7: = . 7 -z -=' =7 -
01 2 3 4 5 6 780 USAGE TIME, 1000 HR
Figure 42. Control valve leakage vs. time

NADC-88066-60
An average wear factor (Cwear) of 2.16 was assumed for this data. A
dynamic factor (C ynamic ) of 0.54 was established by computing the leakage
per cycle, summing over the total number of cycles per A/C life, and
combining this loss with the leakage that occurs during idle time. Details
of these calculations are presented in section 2.4.5.1.1.
Fuel consumption per aircraft life due to valve leakage was computed for each
valve based upon the average leakage (QAve) value. This data is contained
in Table 54. Power extracted from the hydraulic system was computed by:
HP - EPs171+
Shaft extraction power was then calculated by dividing by the AMAD efficiency
(Yi = .9). (See Figure 22)
Pump efficiency is highly dependent upon its operating point, and varies from
0 at no flow to 85% at full output flow. Data from the LHS program indicates
that quiescent pump output typically ranges from 20 to 30% with transient
demands to 100%. A quiescent flow of 25% was selected; average pump
efficiency would, therefore, be 64%. Pump losses are relatively independent
of the power extraction level, Figure 24. Losses range from 12 to 18 percent
of rated output as output varies from 0 to 100%. At the selected quiescent
point, pump losses are 14 percent of rated output. Pump inefficiencies could
be handled in the calculations by an efficiency number or as a separate loss
component. Since pump losses are essentially constant, the separate loss
component method was used. Fuel consumption resulting from valve leakage,
Table 54, therefore, excludes pump efficiency. This is also true for all
data presented elsewhere in this report.
106 J

NADC-88066-60
TABLE 54. Fuel consumption due to valve leakage
o AIRCRAFT LIFE 10,000 HOURS
LOAD* LB FUEL/AIRCRAFT-LIFE
1 281102 312403 324104 360105 240106 792207 700508 1401009 18900
10 166811 62512 208513 158214 608115 434316 1689
226800 LB
*See Tables 17 and 18
FWW
QAVg/CyCI fi flA sin t) d ,t
CAVg/Uf. - [aAVOCY0 TCYC. +
OO(Tife - TCYC)] r54 OWuJI
EHVlI t Stag.................528 GPM2nd Stage.................070 GPM
.596 G3PM
DDV
0Spool/Sleeve .211 GPM
Figure 43. Control valve dynamic leakage
107

NADC-88066-60
2.4.5.1.1 Dynamic Leakage. - Valve leakage is maximum at null and decreases
as the spool is displaced from null, Figure 43. The average leakage during
an actuation cycle was estimated by dividing the volume of fluid leaked by
the time period.
0 = f (X)
0o.Y A sivi w
PA / C Jf (A sin t)cit-0
(A Si w) ofwt
The average leakage per cycle is thus a function of spool displacement,
amplitude, and frequency. The actuator usage function defines the amplitude
and number of cycles for each actuator. Frequencies used are given in
Table 12. Spool displacement was determined by solving the following set of
equations
-- (3 ,._+
DrA=
A W cswt
and integrating over the time period to obtain average leakage.
108

NA.DC-88066-60
The total leakage volume is the sum of the dynamic leakage while the
* actuator is cycling plus the null leakage while the actuator is stationary.
The frequency assumed in the calculation was the aircraft natural frequency
for the particular control axis. Cycle time (T cy c ) is then the product of
the total number of cycles and the cycle period. This computation is
illustrated in Figure 43.
2.4.5.1.2 Non-Linear Valves. Non-linear control valves were studied to
determine their potential for reducing quiescent leakage losses and thereby
save energy. Two types of valves - - high overlap and "V" shaped orifice - -
were investigated. Their potential for saving fuel was assessed and found to
be significant; however, the non-linearity introduced in the control loop is
undesirable and requires special compensation. (Valves are termed linear or
non-linear based on their no-load flow characteristics.) Details of this
study are presented in the following paragraphs.
Radial clearance between the valve spool and sleeve is typically held to 100
to 125 micro inches to minimize leakage and to prevent silting. Orifice
width is based on flow requirements and spool stroke. Valve overlap is
determined by 1) the importance of minimizing null leakage, and 2) the
accuracy with which the orifices can be located during manufacture.
Leakage flow in spool/sleeve valves consists of two components: 1) flow in
the annulus (clearance) between the spool and sleeve, and 2) leakage in the
orifice area. Valve geometry and leakage components are illustrated in
Figure 44. Typically, the orifice component is one to two orders of
magnitude larger than the annulus component and determines valve null
leakage. Equations for computing the leakage components are presented in
Figure 44. Valve parameters which determine leakage are radial clearance,
orifice width and shape, and valve overlap. Too little clearance can cause
spool "sticking" due to "silting". During periods of low activity, fluid
particulate contaminants (silt) wash into and remain In the annulus between
109

NADC-88066-60
CR
QS L
(A) General Configuration O \C
~C K
(B) High Shapea Non-linear Orifice
FWC.~ AC AA% L7-it GC I
3
Figure 44. Control valve leakage parameters
110

NADC-88066-60
the spool and sleeve. This "silt" builds up with time and can cause the
spool to stick in the null position after a period of idleness. Spool/sleeve
clearance in the 100 to 125 micro inch range is a good compromise between
minimizing leakage and avoiding silting.
Orifice leakage is a linear function of orifice width. Reducing orifice
width reduces leakage, however, the width parameter in rectangular orifice
design is limited to a minimum value which provides the required valve
no-load flow at full spool displacement. Valve overlap is very effective in
reducing leakage but introduces deadband in the control loop which is
undesi rabl e.
V-Shaped Orifice
The orifice leakage equation (Figure 44) gives the laminar flow through a
sharp edge rectangular slit (zero overlap) which is the flow passage area
between the orifice and the spool land edge. Leakage is directly
proportional to the orifice width (W). Reducing W reduces leakage and when
carried to the limit, results in a V-shaped orifice. The orifice leakage
component becomes quite small but not zero as implied by the equation. In
the vicinity' of the V apex, flow is better described by the equation for flow
through a short tube orifice. Further from the apex, the rectangular
passage-way equation better describes the flow. The average orifice width is
an inverse function of valve stroke (SV). Valve stroke should , therefore,
be as long as possible to minimize leakage. DDV strokes typically range from
0.005 to .030 in.
Annulus and orifice leakage components were computed for two 5 gpm critical
center valves which were identical except for the orifice shape; one was
rectangular and one was a "V" shape. This data is presented in Figure 45.
The "V" shape reduces leakage by 89%. A reduction of this magnitude in the
baseline valve leakage fuel component would amount to a savings of .373 M-lb
or 3.3% of the total hydraulic system fuel consumption.
0
111

NADC-88066-60
Orifice-rOifc
LEAKAGE RECTANGULAR V.SNAPE
COMPONENT (CCIMJ ICCIMI
Annulus 5.4 5.4
Orifice 409.1 41.1.
Total 414.5 46.5
Energy Consumption/Aircraft Baseline V-Shape
.42 M-Lb .047 M-Lb(3.3%)
Figure 45. Valve leakage vs. orifice shape
Energy Consumption
M-Lb Per A/C Life1.0
Baseline High Overlap Savings(Fuel) (Fuel) (Fuel)
0.8- .42 .11 .31
06-1(26%) (74%)
*CR 60 6to 160p Inches
0.4 LHS Valve*
0.2- \ ~ High Overlap Volves
0.0 10 2. .0.0 .0 20 30 4.0 5.0 6.0
Overlap - In. x 10-3
Figure 46. Valve leakage vs. overlap
112

NADC-88066-60
High Overlap Valves
Valve overlap, depicted in Figure 44(c), is commonly used to minimize
leakage. Leakage as a function of overlap and clearance is shown in Figure
46. It can be seen that a few thousandths overlap significantly reduces
leakage. The valve design used in the LHS test program incorporates about
0.001 inch overlap. If overlap were increased to 0.004 inch, leakage could
be reduced 26%. This would decrease the valve leakage fuel consumption
component 74% - a savings of 0.31 M-lb of fuel over the aircraft life. This
is 2.8% of the hydraulic system fuel consumption.
Non-Linear Valve Operating Characteristics
High overlap and "V" shape orifice valves have non-linear flow
characteristics. By substituting the area functions (Area = F(xv)) into
the valve flow equation, "V' shape orifices produce parabolic flow
characteristics, rectangular orifices produce linear flow characteristics,
and rectangular orifices with overlap produce linear flow characteristics
*with a deadband, Figure 47.
The non-linear characteristics can be compensated for in the electronic
amplifiers used to drive the valve torque motor. If amplifier gain was the
inverse of the valve gain, the combined gain (flow vs. electrical command)
would be linear. For the "V" shape orifice, an infinite gain would be
required at null, thus a simple gain schedule would not suffice. A semi-"V"
which produces a higher flow gain in the null region (with some additional
leakage) would be a good trade-off. An "intelligent" valve amplifier with a
micro-processor using digital techniques would provide a better means of
compensating for valve non-linearities.
113

NADC-88066-60
NONLINEAR CONTROL VALVES
Flow
V-Shape
High Overlap
Zero Overlap
Spool Displacement
ADVANTAGES* Reduced Leakages (Potential)
DISADVANTAGESe Added Complexity In Control Loop
QUESTION* Will Loop Stabilization and Control
Nullify Reduced Leakage?
Figure 47. Nonlinear control valves
114

NADC-88066-60
Overlap significantly reduces leakage but introduces deadband in the control
loop. Dead band is undesirable in high performance flight control servo
systems since it produces "back-lash" in closed loop performance and backlash
is destabilizing in the outer loop control. Classical design of high
performance systems generally demands zero overlap or critical center servo
valves to eliminate all deadband. Thus overlap produces conflicting results;
on the one hand it reduces leakage and saves energy while on the other hand
it degrades dynamic performance. The conventional approach to eliminate
deadband is the use of "dither". A dither signal is introduced which causes
the spool to oscillate at relatively high frequency across the deadband. The
effect of the command signal is then immediate or nearly immediate; the
deadband is essentially removed. This technique has been proven effective
with compensation, however, valve leakage resulting from the dither may
become equal to higher than a valve with zero overlap. Again, an intelligent
amplifier, using digital techniques, should provide acceptable performance
and still retain the leakage advantage of overlap.
2.4.5.2 Aiding Load Recovery Valves. The conventional servo valve/actuator
consumes the same amount of energy regardless of whether the piston load is
aiding or opposing. A pump must deliver the same volume of fluid to move the
actuator piston an incremental amount regardless of the direction of the load
force or even if the load is zero. Energy consumption could be reduced if
aiding load forces could be employed effectively.
Aiding load recovery (ALR) concepts are illustrated by the hydraulic circuits
in Figure 48. Assume the control valve in Figure 48(a) commdnds the piston
to move toward the right and the load force is pushing Loward the right. If
the load force is of sufficient magnitude to raise the pressure In the right
hand cylinder chamber above the supply pressure, check valve #2 will open.
This allows fluid to flow from the RH cylinder chamber to the LH chamber via
the check valve and servo valve without drawing fluid from the pump, thereby
reducing extracted energy.
115

NADC-88066-60
RP Pp R PIPl ibtal ine Drop
100 OOpsi 0 O1670 psi 0 CINL
#1 #2 2360 Psi 0 -PDSN
(a) (b)" Actuators Are Sized for 160% x HmMaM)
" Aiding Loads Are Never High Enough To Generate Cylinder PressureGreater Than PS
" No Energy Sewing Potential for Baseline Design Procedure
Figure 48. Aiding load recovery valve concepts
RR Pp
" Assuming Valve Works Perfectly and No Energy " 0
Is Extracted for Return Cycle --
+ Limit Saving Potential 0.23 M-Lb Ext Volvo
" Realistic Potential 10% to 20% a+ Break Even Weight0.8LMev+ Requires 36 Return Valves
" Disadvantages36Vle+ Complexity + Maintenance+ Reiabilty + Cost+ Dynamic Response+ Incompatible With Dual Pressure Systemns
Figure 49. ALR valve energy saving potential
116

NADC-88066-60
The concept shown in Figure 48 would be impractical for use in the baseline
*system because the load force must be very high for the cylinder chamber
pressure to exceed system supply pressure. Flight control actuators are
sized to handle the maximum expected hinge moment (load force). There is
rarely, if ever, a flight condition which will "back down" the actuator, and
conversely an aiding load which will generate a chamber pressure greater than
supply pressure. The baseline F/C actuators were sized for 160 to 200% of
maximum hinge moment due to redundancy considerations. An aiding load would
have to be more than 160% of the maximum design load to make the cylinder
pressure exceed system supply pressure.
The ALR concept can be implemented by resizing the hydraulic lines to induce
larger pressure drops and increasing the valve size to maintain the same
maximum no-load rate capability. Figure 50(a) and (b) show the theoretical
(normalized) results of two preliminary designs. Greater rates under aiding
load conditions were achieved with decreased pump flow for circuit (a) and
constant pump flow for circuit (b). However, pump size cannot be reduced due
to the maximum design load rate requirement. Distribution line weight can
only be decreased by a small amount since actuators are supplied from a
network and only the final line branch size could be reduced. Valve size
must be increased to offset the increase in supply line pressure drop; this
increases valve weight and internal leakage.
Applying the aiding load recovery concepts illustrated in Figure 48 to the
baseline by re-sizing the supply lines would require increasing the servo
valve size by 85%. Leakage losses increase by 0.17 M-lb; usage losses were
assumed to decrease by 50% or 0.23 M-lb. Weight losses are unchanged, since
the larger valve size plus check valves offset the reduced supply line
weight. The net result is a fuel savings of 0.06 M-lb.
117

NADC-88066-60
a
Load flow
r. a. -- -up
f o
Pump flow lodfo\sd
-t.00 -0.7 -0:60 -O~ a .= 0.35 0.10 0.71
LORDO - H/HDI-IIX
(a) Return-to-cylinder flow
* Load flow
:05,Pump and load fo sd
Pflow (stow
-1.0c -0.7s -0.50 -0.35 O. C.25 0.10 0.71LOAD - ?1!/HM-M- X
(b) Cylinder-to-pressure flow
Figure 50. ALR valve design results
118

NAC-88066-60
The energy saving potential of the aiding load recovery concept was
investigated by applying it to the baseline primary F/C and T/V actuation.An "ideal" extend/retract valve was assumed. (An "ideal"valve saves all
aiding load energy.) The usage component of fuel consumption would,
therefore, be reduced 50% or 0.23 M-lb. The weight which the "ideal valves"
could add to the system and just break even on total fuel consumption is 1.49
lb (each). Since most operation is small amplitude displacement about the
null position, a more realistic savings is 10 to 20% of the usage component.
This would allow a break even weight of about 0.36 lb per valve. The
potential of this concept is summarized in Figure 49.
The aiding load recovery valve does not appear to have much potential for
saving energy. If the design requirements could be changed to allow a
reduction in maximum opposing load rate requirements, this would permit a
decrease in pump size. In this case, the concept would have some potential.
2.4.5.3 Flow Augmentation Control Valves. The Flow Augmentation Control
*(FAC) valve concept is depicted in Figure 51(a). A jet pump is incorporated
upstream of the control valve in conjunction with the aiding load recovery
check valves which, under certain operating conditions, pumps fluid from thereturn line to the valve supply line. This reduces flow drawn from the pump
and decreases shaft power extraction. Typical flow augmentation
characteristics are shown in Figure 51(b). During high flow conditions,
fluid from one side of the actuator is pumped directly to the other side
through the flow augmentor and check valve; pressure and return line flows
are reduced. The servo valve still controls actuator position. As flowdecreases, due to load conditions or valve throttling, Jet pumping action
decreases until the jet velocity can no longer reduce the nozzle downstreampressure sufficiently below the return line pressure to open the check
valve. At flows below this point, the jet pump ceases to function and thevalve/actuator operates in the normal manner. As in the ALR concept, the
distribution lines are reduced in size to provide large pressure drops and
the valve size is increased to maintain the required no-load rate capability.
119

,nr-8O66-60
a) FP r, vale concept
Actr q~t ta
tu to
80% 4c1a rateitreb)' design ad
lowr
Desig 10ui en a~ ~ ch r c

NADC-88066-60
The flow augmentation concept was applied to the baseline system and found to
provide no potential energy savings due to the baseline design requirements.
Potential savings would occur, however, if the design requirements were such
that the advantage of flow augmentation could be utilized . The energy
saving potential was, therefore, estimated on the basis of "modified" design
requirements. The requirements in question are discussed in the following
paragraphs along with estimated energy savings.
Conventional Design Requirements. Design requirements typically specifiedfor F/C actuation consist of maximum hinge moment (HM ,K,), no-load rate
*(e,,L)and a design load pon"M. 4,) These points are depicted inFigure 52(a). Many designs could satisfy these requirements, however, to
minimize weight, the actuator is sized to just meet the M.r* point (i.e.,
stall). With the actuator size established, the valve is then sized so that
the load-rate capability encompasses both the design load point and the
no-load rate point. The load-rate curve for a conventional servo valve/
actuator design is also shown in Figure 52(a).
The design load point for the baseline system is at 80% ofI"vk and 60%
of i"U. These values were established by studies conducted at Rockwell on
advanced reduced stability aircraft. The design load point, therefore, sizes
the control valve, and the no-load rate capability is 34% greater than the
no-load rate requirement, Figure 52(a). The FAC valve operating
characteristics are shown for these design requirements in Figure 52(b).
Flow, plotted on the ordinate axis, is normalized to the no-load rate
capability. An alternate scale, on the right, shows flow normalized to the
no-load rate requirement(BNL)t . The design load point flow is at 0.45.
Flow augmentation begins operating at 0.55 and provides greater rate
capability with less pump flow than the conventional design. However, the
additional rate is not required and, if the design requirements are correct,
would not be used. Flow augmentation valves under these conditions would
provide no real benefit.
121

NADC-88066-60
Design load point,
1- N.-.eNL. iMX reqmt N
S 04-0.60 1 7 0
(a) Baein design
1..0 0.3
Figure ~ (b 52Flwaugett design pit
Load 122

NADC-88066-60
Modified Design Requirements. If the design load point was on or within the
performance boundary (solid curve) shown in Figure 52c, flow augmentation
could be employed to save energy. To assess the potential, it was assumed
that the design load point was located within the boundary. Estimates were
then made for the energy consumption components: usage,leakage and weight.
The configuration studied consisted of the baseline system modified by
substituting FAC valves for all servo valves in the F/C and T/V actuation
systems (40 dual valves).
The FAC valve characteristics shown in Figure 51(b) were used to estimate
the reduction in pump flow and, therefore, work per cycle. These
characteristics were based on an extrapolation of data presented in
references 8 and 9. Flow depends not only upon amplitude and actuator
displacement but also upon cycle frequency. The frequency used is dependent
upon the actuator and is given in Table 12. Flow augmentation reduces flow
at maximum no-load rate conditions by 45%. Maximum rate is not always
required during the cycle. Using the characteristics of Figure 51(b) and the
same approach employed in the baseline calculations, a reduction in usage
energy consumption of 0.02 M-lb per A/C life was computed.
A weight estimate was made for the FAC configuration. Results are summarized
in Table 55. The incremental valve weight increase was conservatively
estimated as 0.5 lb/valve; this includes the jet pump, manifold, control
valve size increase, and check valve components. The bases for the weight
change in pumps, heat exchangers and reservoirs are also listed in Table 55.
Weight trade data in Appendix B was used to establish the weight changes.
The distribution system was re-sized for a 45% flow reduction and higher
branch line pressure drops. A total weight reduction of 25.7 lb was realized
by the FAC configuration.
123

NADC-b8066-60
TABLE 55. Flow augmentation weight change estimate
ELEMENT WEIGHT
VALVES + 40 lb(40 dual x 1.0 lb/valve)
PUMP - 15. lb(45% reduction in capacity)
HEAT EXCHANGER - 6.6 lb(45% flow reduction x 2/3 in lines)
RESERVOIR - 4.7 lb(29% tube volume reduction, 30% reservoirsize for thermal expansion)
TUBING - 39.1 lb(141.1 lb baseline - 102.0 lb (FAC)]
Total Wt. Reduction - 25.7 lb
TABLE 56. Flow augmentation energy analysis
o Assume Actuation Requirements Allow Taking Advantage of FAC Valve
ENERGYELEMENT WEIGHT, LB COMPONENTS FUEL, M-LB
Valves + 40 Weight - .09Pump - 15.3 Usage - .02Tubing - 39.1 Leakage + .20System - 11.3 Pump - .32
Net - 25.7 Net - .22
124

NADC-88066-60
Pump losses average 14% of rated pump output (see Figure 24). Assuming pump
sizes can be reduced by the full amount of the flow augmentation (45%), then
the pump loss fuel component would be reduced by 0.31 M-lb. Valve internal
leakage was assumed to increase by 45% since larger control valves are
required to compensate for the jet pump and associated circuit modifications
necessary to make the concept work. This amounts to an increase of 0.2 M-lb
of fuel.
The FAC configuration provided a net saving of 0.2 M-lb of fuel per aircraft
life compared to the baseline. The incremental changes in the energy
consumption components are summarized in Table 56. The additional weight of
the valves is more than offset by the decrease in weight of other
components. If system design requirements permit, the FAC valve has the
potential for reducing energy consumption 2% and decreasing weight 26 lb.
2.4.6 Multi-Pressure Level Systems
One fail operative/two fail safe requirements imposed on current military
aircraft necessitate using over-size flight control actuators. Each section
of a dual actuator is typically sized to provide full hinge moment in order
to meet the specified performance requirements after a single hydraulic
system failure. Some of the baseline aircraft flight control actuators are
oversized by only 60% due to control effector redundancy; others are
oversized by 100%. Tables 20 and 21 list the design factors (hinge moment
capability divided by hinge moment required) required for each of the control
functions. Figure 12 shows the baseline vehicle control effectors. When
125

NADC-88066-60
both sections of a dual actuator are operating at system pressure, the
actuator has excess hinge moment capability. Under this condition, system
pressure could be reduced significantly and still meet full actuator hinge
moment requirements.
2.4.6.1 Dual Pressure Level Systems. A 4000/8000 psi pressure level system
was conceptually designed using a hinge moment design factor of 2.0 for all
F/C and T/V actuators. As a first trial, the baseline power supplies and
distribution system designs were used, and the total fuel consumption per
aircraft was calculated. Fuel usage increased due to larger actuatorsrequired for control functions 3 through 10, Table 20. It was thus concluded
that increasing actuator size to take advantage of the 4000 psi pressure
level is not profitable from an energy standpoint.
A second design approach was investigated: Use the baseline actuators and
reduce the supply pressure to 4000 psi during flight modes which do not
require full hinge moment capability. Basic design requirements are reviewed
in Table 57. From system considerations, it would appear that reduced
pressure should only be allowed in mission legs 2, 3 and 6, (reference
Table 3) since these legs do not require high hinge moments.
A dual pressure level system was conceptually designed where 4000 psi system
pressure is used for mission legs 2, 3 and 6 and 8000 psi for legs 1, 4, 5
and 7. Switching logic for this system is shown in Figure 53. This logic
could be mechanized in the F/C computer; some additional sensors/signals
would be required. Safety dictates that any failure should cause the system
to revert to full pressure. Using the baseline hydraulic system supplies and
distribution system, fuel savings were computed for this approach (Design No.
2), and the results are presented in Table 58. A reduction in fuel
consumption of 0.44 M-lb per aircraft life was achieved. This amounts to a
4% savings in the total fuel consumption of the baseline.
126

NADC-88066-60
TABLE 57. Design requirement review for mission leg
*MISSION LEG REVIEW COMMENTS
1 and 7 o Must use utility actuators. Since it wouldnot be efficient to size these actuators for
reduced pressure, system pressure must be
8000 psi.
2, 3 and 6 o Low to moderate hinge moments are required.
Eighty percent of max hinge moment issufficient; system pressure can be 4000 psi.
4 and 5 o The risk associated with these legs is high,
therefore, full 8000 psi capability should
be provided for survivability/reliability
considerations.
*See Table 3
TABLE 58. Dual pressure level fuel consumption
DESIGN I DESIGN IEASEUNE ALL MODES MODES 2 3. AND I
(11 S) M-S)IM4IS) (M.I.S)
Usage 0.48 0.29 0.30
Valve Leakage 0.23 0.16 0.17
Pump 0.70 0.42 0.47
Weight 9.47 10.32 9.50
Total 10.88 11.18 10.44
A Basis +.30 -. 44
1+2.8%) (-4.0%)
127

NADC-88066-60
Hydraulic Pressure Level
ye Reduce Neo eection
-~ ~ Addtina Sesr
TABLE~~~~ Mo ua resre Clee adovaCntrols/dadvntge
ADVANT128

NADC-88U66-60
In addition to saving energy, lower system pressure offers the advantage of
reduced pump leakage, decreased power consumption and less pump wear.
Control valve throttling losses are less because of better matching between
the actuator output force capability and the load.
The dual pressure concept was initially investigated by Rockwell for the ATF
program, and found to have considerable merit for reasons other than energy
savings. Some of the projected advantages and disadvantages excerpted from
these studies are listed in Table 59. The ATF vehicle was entirely FBW in
design. As such, it had the capability to handle valve flow gain changes in
actuation control loops.
Control valve characteristics, in particular flow and pressure gain (Kq and
K p), are functions of the supply pressure. If supply pressure is reduced
one half, flow gain is reduced 30%. Gains in the F/C computer must,
therefore, be increased to maintain comparable loop performance. Valve
pressure gain is also reduced which affects stiffness, resolution, and
deadband. These chunges must be accommodated by F/C computer changes or by
accepting a reduction in actuation performance.
Additional sensors are required to provide the information necessary for
pressure level selection. These sensors must be failsafe or redundant. The
increase in complexity due to pressure level logic, actuation loop gain
changes, and sensor redundancy mean more complicated control laws in the F/C
computer which increases the computational load and necessitates additional
capacity.
129

NADC-88066-60
2.4.6.2 Multi-Pressure Level Systems. More than two operating pressure
levels could be used to further optimize efficiency. An algorithm must be
developed which would set system pressure to the minimum necessary for
particular flight conditions. The effort required to quantify the advantages
of such a system is inordinately large; the multi-pressure level concept was,
therefore, not pursued. Practically, it would appear that the bulk of the
energy savings is provided by the two level system. Gains for a 3, 4 and 5
level system diminish while complexity increases. The concept could be
carried to the limit where system pressure is continuously adjusted to meet
load demand. Again, considerable study would be necessary to prove the
additional complexity is justified.
130

NADC-88066-60
2.4.7 Hybrid Electro-Mechanical/Hydraulic System
Utility actuators are generally not well suited for use in 8000 psi hydraulic
systems because of their relatively low force output requirements. For
example, an 800 lb output actuator has only 1/10 of a square inch of working
piston area. Small sizes such as this are not efficient weight-wise.
Advances in electro-mechanical (EM) technology during the past decade make EM
a viable alternative to hydraulics for many applications, particularly in low
usage applications which do not require servo control. EM actuation was
investigated to identify possible advantages in energy consumption, Table 60.
To determine the energy savings potential of this approach, utility actuators
in the baseline vehicle were replaced with an equivalent set (on the basis of
load, stroke and rate) of electro-mechanical actuators. This was done
without regard for any special design features of the actuators. Fuel
consumption was then computed. Table 61 compares the fuel consumption
components with the baseline system. The EM usage component is lower than
the baseline, however the magnitude of both values are relatively
insignificant compared to primary controls usage. Leakage or quiescent
losses for both were assumed zero or negligibly small. The weight fuel
consumption component is lower for the EM design due to a minor weight
reduction. In summary, the EM utility system approach saves 0.07 M-lb of
fuel and reduces weight 18.5 lb. The basis of this estimate is presented in
the following paragraphs.
The three components of fuel consumption (usage, quiescent losses, and
weight) were computed as follows:
Usage Component. The design load point power is listed in Table 22. This
power is multiplied by the cycle time to obtain energy consumption per
cycle. Cycle time is, by definition, equal to the time required for the
131

NADC-88066- 60
TABLE 60. EM utility system advantages
REPLACE UTILITY ACTUATORS WITH EM TYPE
ADVANTAGES
" Elimnates Ilydraulos In No@* of Aircraft
* More Efficient for Small. Low Daty-cycie Actuators
" Reduce No. 2 Reserwol and System She.
TABLE 61. EM utility system fuel consumption
M~AL AIC LAIEN? MRE cIN.UM"M A19 LM m "9&COPOUNFlTS "H*ung In
P,*-"r .4781 .4781
Udlty .00034. AM-0
Pump .7015 .7015
*g Wegt I .43 a.0
Total1 10.86 - 10.81
EM Uttky System Sawes
0.07 M.4J. Fuel (A%I10.6 Lb Wih
EH W.1 Aw Pw
HP 17AMg '?a VIi. 77C10
.60 .90 .97 .5 .77
NVOC ULk*e~
Figure 54. EM efficiency diagram
132

NADC-88066-60
actuator to move from one extreme to the other and back at the design load
rate. The energy thereby used is multiplied by the number of cycles per
aircraft life and by the number of actuators per aircraft. The extracted
energy is then computed by multiplying by the system efficiencies shown in
Figure 54. In mathematical form:
- 61O
- (~TU
Actuation control power losses consist of contactor (relay) coil power and
actuator brake coil power. Coil power is about 3 watts for small contactors
and 25 watts for large contactors. Typical power for actuator brakes is 25
watts. A value of 30 watts per actuator was used as an average control
power loss. Usage fuel consumption was then calculated by multiplying by
the fuel consumption coefficient.
Quiescent Component. There is no quiescent loss associated with EM design.
Weight Component. The weight of each EM utility actuator for the baseline
system was estimated using the trade data given in Figure B-4 for ballscrew
actuators and motors. The actuation controller consists of a 270 VDC
contactor; these devices weigh an average 2.5 lb and are nearly independent
of the load current. Distribution system weight was determined by
establishing an electrical wiring design of equivalent length, number of
133
NADC-88066-60
distribution points, etc. as used in the baseline hydraulic system. The
generator weight increment was taken from Figure B-11. This data is a
composite estimate based upon IDG used in current aircraft, i.e., the Bendix270 VDC Link system for the Gulfstream, and other generator data.- Hydraulic
pump weight was not reduced because the pumps are sized by F/C and T/Vrequirements. Reservoir weight was reduced by the fluid volume increment
required for the utility system.
134

NADC-88066-60
2.4.8 Advanced Materials
2.4.8.1 Materials Review. New aircraft concepts invariably demand
increased speed, range, payload, and performance which in turn require
advanced materials with higher strength, stiffness, toughness, and service
temperatures. New materials suitable for use in future aircraft are being
developed at an accelerating pace, particularly in the areas of composites
and powder metallurgy. Current research is the result of intense
competition. Companies that provide the highest, strongest, and lowest cost
materials will serve not only the aerospace industry, but will also meet new
demands in the automotive industry.
A large amount of published information is available covering recent
developments in advanced materials. Information presented in this section
is the result of a literature search covering composites, powder metallurgy,
and supermetals. Tne applicability of these new materials to hydraulic
systems is presented.
W2.4.8.1.1 Composites. Composites are a combination of at least two
different materials bonded together with an adhesive, and are designed to
have properties not possible with any one material acting alone. Composites
consist of any combination of fibers, whiskers, and particles in a common
matrix and may be classified as:
Fibrous Composite Fibers in a matrix
Laminated Composite Fibers in a metal sandwich
Particulate Composite Particles in a matrix
Hybrid Composite Several types of reinforcement
materials in a common matrix
135

NADC-88066-60
Outstanding features of cowposites include high strength-to-weight/
modulus-to-weight ratios, and their ability to be tailored to meet individual
load requirements.
Glass fiber/resin composites have been used for thirty years in commercial
and aerospace applications. Advanced composites used today in high
performance parts are made with fibers such as graphite, boron, or aramid,
and matrix materials such as epoxy or PEEK. Advanced composites can have,
for their weight, greater tensile strength than aluminum, titanium or steel.
There are, of course, many factors to consider in deciding whether a
composite would be suitable for a specific application. For example, fibrous
and laminated composites are generally limited to relatively simple two
dimensional structural parts with little thickness. Particulate composites
can be used for complex three dimensional parts. In any case, components
made of advanced composites are very expensive to fabricate compared to parts
made with conventional metal alloys.
Reinforcement Materials. High strength, high elastic modulus fibers are the
key to producing high performance composites. Graphite is one important
material. More than 20 different types of graphite fibers are currently
available with strengths ranging from 250,000 to 650,000 psi and elastic
moduli ranging from 28 to 75 million psi. Fiber processing determines the
tensile strength. Future tensile strengths may reach 800,000 psi. Graphite
is available in continuous or chopped fibers pre-impregnated in resin tapes
of various sizes or in sheet form. The density of graphite composites is
about half that of aluminum and a sixth that of steel.
Aramid fibers were introduced by DuPont in 1971 under the trade name
"Kevlar". A notable characteristic of the as-spun fibers is the
extraordinary level of crystallinity and orientation which results in tensile
strengths five times higher than steel -- on a weight basis. Kevlar is about
136

NADC-88066-60
40% lighter than fiberglass, 18% lighter than graphite, and has better
toughness and ductility than graphite. Both Kevlar and graphite have
essentially no dimensional change with temperature.
Metal matrix composites (MMC) are metals reinforced with fibers, whiskers,
or particulates. The matrix is generally aluminum, titanium, or steel.
Fibers employed include boron, graphite, and tungsten; particulates are
mainly silicon carbide. The volume fraction of the reinforcement material
varies from 10 to 60% producing strengths from 2 to 10 times that of
aluminum and stiffness values of 1/2 to 2 times that of steel. Weight
savings, compared to monolithic aluminum alloys, range from 20 to 70%.
The manufacture of metal matrix composites is unconventional. Whisker or
particulate reinforced metals are fabricated by mixing reinforcement and
matrix powders, cold pressing, followed by hot vacuum pressing. Billets
thus formed can be machined, rolled or extruded. Machining takes 2 to 4
times longer than for conventional aluminum because of tool wear, reduced
feed rate, and the need for a high surface finish (because of notch
sensitivity).
The development of resin composites is about 15 years ahead of metal matrix
composites (MMC). MMC's are currently the subject of intense research and
many technical problems remain to be solved. Two such problems are the
mechanics of fracture and the reinforcement/matrix interface behavior.
Current theories of fracture do not apply because of the complex behavior of
MMC's during crack propagation. MMC's are costly at present. For example,
if hot rolled steel costs a unit price, then monolithic aluminum is 1 to 4
units, SiC/Al is about 600, B/Al is about 1800, and Gr/Al is 4800 to 20,000
units.
Matrix Materials. Two basic types of matrix resins used are thermosets and
thennoplastics. Themosets cure chemically with the application of heat.
They have excellent adhesion to reinforcements, superior chemical
resistance, and high mechanical properties. Epoxies are a thermoset widely
137

NADC-88066-60
used in advanced composites but they are brittle, have poor damage
resistance, and high fabrication costs. Themoplastics cure with the
application of heat and can be re-heated and cooled repeatedly (Epoxies
cannot). Newly developed thermoplastics such as polyetheretherketone (PEEK)
are damage tolerant, do not require refrigeration, and have lower
fabrication costs than epoxies. One major advantage is that thermoplastics
can be welded by numerous plastic welding processes while thermosets must be
mechanically fastened or adhesive bonded.
Composite Properties. Since composites are engineered materials, it is
difficult to generalize their physical properties. Parts can be designed to
have different properties in different directions. The myriad combinations
of reinforcement materials and matrixes obviously affect tensile strengths
and elastic moduli. Processing differences can create large variations inproperties. Wide differences in longitudinal, transverse, and shear
strengths are normal; temperature also affects performance. With this in
mind, the following data should be considered as representative and widevariations are possible.
Representative Room Temperature Values
Tensile Tensile
Composite Densi ty Strength, ElasticReinforcement Matrix lb/inJ psi Modulus, psi
Boron Epoxy .072 230,000 30,000,000
Kevlar Epoxy .050 200,000 11,000,000
Graphite PEEK .070 230,000 17,000,000
Boron Aluminum .097 216,000 20,000,000
Graphite Aluminum .096 150,000 45,000,000
138

NADC-88066-60
Composite Information Sources. An area located in northern Delaware is a
major center of composite research. Principal contributors include the
University of Delaware, DuPont, ICI Americas, and Hercules.
The U.S. Air Force has begun work on an integrated composites center aimed
at reducing costs and increasing the quality of manufactured parts. The
center will be established at McDonnell Douglas in St. Louis, Missouri.
Battelle Columbus Laboratories has an IR&D program to assess the
international business climate through 1995 for reinforcing materials as
well as a technical evaluation of the field. Products being evaluated
include graphite, silicon carbide, aramid, organic fibers, and ceramics.
DOD funding is currently the major driving force in metal matrix composite
research. A key source on MMC development is the Metal Matrix CompositesInformation Analysis Center in Santa Barbara, California.
The single greatest source of information on fibers and resins are meetings
staged by the Society for the Advancement of Materials and Process
Engineering (SAMPE) headquartered in Covina, California.
Updates on progress in the composites field are covered by many
periodicals. Principal magazines include "Metals Engineering", "Ironage",
"Machine Design", "Journal of Metals", and "Aerospace Engineering". These
periodicals are also excellent sources of information for powder metallurgy
and supermetals (see following sections).
139

NADC-88066-60
Applications. First generation composite actuators are currently being
developed by several companies including National Waterlift, HR Textron, and
Structural Composites Industries. The state-of-the-art is young and many
problems remain to be solved such as porosity, surface finish, and cost.
Principal goals are 25% weight savings (over steel), improved fatigue life,
and ballistic survivability. Pressure vessels such as accumulators,
reservoirs and tubing are also possible candidates for composite
fabrication. Tube fittings and valve housings are not likely to be made
with composites; other advanced technologies such as powder metallurgy and
superalloys are more suitable for these components.
2.4.8.1.2 Powder Metallurgy. Powder metallurgy (PM) is the formation,
processing, and consolidation of fine particles to make a solid metal. Two
advantages of PM are: 1) the production of alloys with compositions
unobtainable by other methods, and 2) the production of finished or nearly
finished parts (near net shape manufacturing).
PM products are usually made from commercially available powders that are
relatively coarse (particle size larger than 10 microns). The advantages of
using finer particles has only recently become known. Very small particles,
with diameters less than 10 microns, have unique microstructures and
properties unattainable in the larger size ranges. Rapid metal
solidification processes are used to make these very fine powders.
Rapid solidification is accomplished by spraying atomized molten metal onto
a chilled surface where it is cooled at rates as high as 106 °C/sec.
Cooling the metal this rapidly makes it possible to retain high temperature
crystal structures. Use of rapidly solidified powders results in the finalPM product having a uniformly fine microstructure, smaller constituent
particle size, and increased alloy strengthening. The net result is
improved physical properties.
140

NADC-88066-60
This new PM technology has opened the door to the manufacture of
superalloys. The alloying elements in superalloys tend to segregate during
the solidification phase if conventional melt processing is used; this
degrades physical properties. Compaction of the same alloys in powder form
results in a uniform material which is superior to the wrought metal.
Powder metallurgy processes currently used include:
Forging
Injection molding
Cold isostatic pressing
Hot isostatic pressing
* Powder forging employs a powder preform as a billet for forging. The
forging operation deforms the blank sufficiently to eliminate porosity and
work harden the metal to a degree comparable to conventional forgings.
PM injection molding is similar to the process used for plastic injection
molding. The procedure is expensive because it requires the use of metal
powders one-tenth the size of conventional powders, and long processing
times due to the need to remove a thermoplastic binder. Part sizes are
limited to a maximum of 0.25 in. wall thickness.
Cold Isostatic pressing is also a slow process but new equipment has
recently been developed that shortens cycle times. The principal advantage
of this process is the ability to produce intricate, high quality parts.
141

NADC-88066-60
Hot isostatic pressing (HIP) is the method commonly used to manufacture
superalloys for aerospace applications. The process derives its name from
the high pressure gas which applies a force uniformly in all directions
(isostatically) over the entire surface of the compact in a heated oven.
HIP is expensive due to the need for expendable tooling and long cycle times
(4 to 16 hours).
PM Alloys. Aluminum PM technology permits the development of new alloy
families not possible with ingot metallurgy. Conventional aluminum alloys
lose their strength above +300F. Powder metallurgy offers a means of
providing significant strength up to +6500F. The high temperature PM alloys
offer such an improvement over aluminum ingot metallurgy that they are
competitive with titanium in both airframe components and in high
performance gas turbine engines. This is perhaps the most promising area of
P14 alloy development in the near future. Titanium PM has typically been
used to reduce fabrication costs. Recent developments in rapid
solidification metallurgy have shown that some of the same advantages
obtained in aluminum PM also apply to titanium PM. New titanium alloy
families are currently being explored and problem areas addressed.
4etal matrix composites offer extremely fertile ground for future research.
One recently developed PM composite, tungsten-carbide grains held together
by a cobalt matrix, has revolutionized the tool cutting industry with its
high wear resistance. This field obviously overlaps composites discussed in
section 2.4.12.1.
PM Properties. Typical properties of aluminum and titanium PM alloys are
compared below to conventional ingot alloys.
142

NADC-88066-60
Typical Room Temperature Values
Ultimate TensileDensity, Strength, Elastic
Alloy lb/in psi Modulus, psi
7075 AluminumIngot Alloy .101 72,000 10,300,000
7090 AluminumPM extrusion .100 90,000 10,500,000
7090 Matrix25% SiC Particulate .102 98,000 17,000,000
Al-Fe-C AluminumPM Alloy
Room Temp 0.107 82,000 13,000,000+300°F 70,000 12,000,000+450° 61,000 11,500,000+600" 39,000 11,000,000
6Al - 4V Titanium 0.160 142,000 16,000,000Ingot Alloy
6A1 - 4V Titanium - 133,000PM A11oy
Fatigue properties of both aluminum and titanium PM alloys need additional
testing to fimly establish design values. It should be noted that none of
the high strength alloys discussed have been produced on a large scale; the
reproducibility of their properties in production quantities is not clear at
this time. Although parts made by powder metallurgy are nearly 100% dense,
some microscopic porosity may be present. The effect of this porosity in
hydraulic components is not known.
Applications. Although selected PM alloys could be used to replace most
metals used in hydraulic systems, tests are needed to demonstrate their
suitability. Hydraulic actuators, in particular should be examined, since
neither aluminum nor titanium provide good wear surfaces. Hydraulic
fittings and valve bodies appear to be excellent candidates for PM
technology. Reservoirs and accumulators are probably better suited for
*filament composites. PM tubing is not currently feasible.
143

NADC-88066-60
2.4.8.1.3 Superalloys. Recently developed ingot metals with physical
properties superior to conventional alloys have been characterized as
superalloys. Iron, aluminum, and titanium base superalloys will be
discussed.
Iron. Iron-based superalloys contain significant amounts of several
alloying elements including cobalt, chromium, nickel, and titanium. The
major end-use of these superalloys is in gas turbine engine hot sections
which dictate performance requirements of the alloys. Principal
applications are in aircraft jet engines and turbine-driven electric
generators. The gas turbine vane, blade, and disc materials are
superalloys. Although iron-based superalloys could be used in hydraulic
systems, lighter weight materials such as metal matrix composites and
titanium alloys would provide better strength-to-weight ratios.
Aluminum. Composites have outstanding strength-to-weight ratios and fatigue
properties; titanium has excellent high temperature strength and corrosion
resistance. The aluminum industry was thus challenged to produce an
improved product or face inroads into their share of the aerospace market.
One of the aluminum alloys developed to meet this challenge contains the
lightest of all metals -- lithium (specific gravity = 0.534). Use of this
superalloy saves half the weight that graphite/epoxy composites save, but is
one-tenth as expensive. The first Al-Li alloy, 2020, was developed in the
1950's, and was successfully used on the RA-5C Vigilante. Because of low
fracture toughness and fabrication difficulties, it was withdrawn from
production in 1974. Second generation aluminum-lithium alloys became
commercially available in 1986, and currently cost 2 to 3 times more thanconventional aluminum alloys.
Al-Li alloys contain 2 to 3 percent lithium; this reduces the density 7 to
10% over current aluminum alloys. When increased strength and stiffness are
included, weight savings reach 12 to 15%. Principal use for the new alloys
will be in aircraft structural applications; use in aircraft hydraulic
systems is not likely (titanium is more suitable). Properties of Al-Li
alloys being developed by Alcoa are:
144

NADC-88066-60
Alloy/ Replacement Ultimate Elastic Densi yCharacteristic For Strength, psi Modulus, psi 1b/inly
8090A 2024-T3 65,000 11,400,000 0.092(Damage Tolerant)
2090 7075-T6 86,000 11,400,000 0.094(High Strength)
8192 - 64,000 11,900,000 0.091(Minimum Density)
8092 7075-T73 71,000 11,700,000 0.093(Corrosion Resistant)
Titanium. Titanium 6A1-4V is the most widely used titanium alloy in the
aerospace industry. It has excellent stiffness, corrosion resistance, and
is useful from -320 to +7500F. 6A1-4V is a medium-to-high strength heat
treatable alloy that surpasses most steels on a strength-to-weight basis.
Drawbacks include relatively high material and manufacturing costs, and
susceptibility to galling which limits its usefulness in threaded and
sliding contact applications. 6AI-4V is not used for hydraulic tubing
because of poor formability.
Titanium 3Al- 2.5V alloy tubing is widely used in commercial and military
aircraft 3000 psi hydraulic systems. The advent of 8000 psi hydraulic
systems will require thicker wall and/or higher strength tubing. Two
characteristics of Ti 3-2.5 tubing make it less desirable for high pressure
applications: 1) thicker tube walls will reduce achievable material
strength levels; and 2) Ti 3-2.5 tubing cannot be heat treated to improve
its strength.
A new titanium alloy, 15V-3Cr-3Sn-3AI, was recently developed with
mechanical properties superior to both 6AI-4V and 3AI-2.5V. 15-3 has
excellent formability and is heat treatable. 15-3 is particularly well
suited for hydraulic tubing. A discussion of this application is presented
in the next section.
145

NADC-88066-60
2.4.8.2 Tubing. Titanium 3AI-2.5V tubing has been widely used in both
commercial and military aircraft hydraulic systems for over ten years. This
alloy has been broadly accepted because of its high strength-to-weight ratio
and reliability. Ti-3AI-2.5V is an alloy which obtains its high strength
through work hardening. This is accomplished during the tube drawing
process. Difficulty has been experienced in maintaining high strength (125
ksi) properties in thick wall (4000 psi) tubing such as 1-1/4 in x .102.
This tubing may have to be designed using a lower ultimate strength (such as
110 ksi) which results in thicker tube walls.
A new titanium alloy, Ti-15V-3Cr-3Sn-3A (Ti-15-3), is in advanced
development for the seamless hydraulic tubing market. Ti-15-3 is
substantially stronger and more ductile than Ti-3AI-2.5V. It is a beta
alloy which can be age hardened to obtain high strength (181 ksi).
Properties of Ti-15-3 are compared with Ti-3A1-2.5V and other tubing
materials in Table 62. The strength-to-density ratio of Ti-15-3 is 1.37
times that of Ti-3AI-2.5V at room temperature (1064 vs. 812) and 1.47 times
at +45LJF.
8000 psi tubing used for this study was designed using both titanium
alloys. Design requirements were established in the LHS program and are
outlined on Table 63. Tube design is based upon the material ultimate
strength at +275°F, bur-* pressure, and typical manufacturing tolerances.
Tables 45 and 46 contain data for pressure and return lines made of the
3A1-2.5V and 15-3 titanium alloys. The weight per foot of tubing filled
with fluid per MIL-H-83282 is also given.
146

NADC-88066-60
be 0 uto 0 0o 0 wU' 0 o c0 I
-a
Ln )- i
V I.-
0 0 Y 0 Un 0 0
In% 4U cw
00c~O N 0~
w~ -
~O ~O % ~O # NC7% LO 0
S-l LA-'
La..to-
IftOc (n.q 0 ~U O , U
LA U,
S-N 0 fl U, .
C-w n r W n m
I-a fl q. w 0 PU, U, 4 W Ui N U N
P- IL119
___ ___ CL4 U6 # 1L Y %Ln o p- e
co V
V a#
4 . v v 4'10 V 0Vw ! '
Z 0 0,9 toKV
La47a

NADC-88066-60
TABLE 63. 8000 psi tubing design requirements
PRESSURE RETURN
LINES LINES
Operating Pressure 8,000 psi 200 psi
Peak Transient Pressure 9,600 psi 4,000 psi
Proof Pressure 16,000 psi 8,000 psi
Burst Pressure 24,000 psi 12,000 psi
Maximum Fluid Temp. +2750 +2750
Murphy Prevention ODD Sizes EVEN Sizes
148

NADC-88066-60
The use of reduced wall thickness return line tubing requires a foolproof
method of preventing mis-installation of return lines in high pressure
locations. A current trend within the industry is to use ODD number sizes
for pressure lines and EVEN number sizes for return lines. This arrangement
was used in distribution system designs 2 through 5 (see Table 48). The
design requirements selected for baseline hydraulic system tubing are
summarized in Tables 23 and 24.
The average weight per foot for pressure and return lines made of the two
alloys indicates a weight reduction of 22% could be obtained by using
Ti-15-3 material instead of Ti-3-2.5. However, since the smaller sizes are
more frequently used than the larger sizes, actual weight savings will be
less. To obtain a more accurate estimate, the baseline system tubing
(Ti-3AI-2.5V) was replaced on a size for size basis. Tubing weight using
Ti-15-3 is 303.2 lb compared to 332.5 lb for Ti-3AI-2.5V Tubing -- an 8.8%
reduction. This weight reduction translates into an energy savings of
41,000 lb of fuel per aircraft life.
2.4.8.3 Energy Savings. Results of the materials review discussed in
section 2.4.8.1 are summarized in Figure 55. Composites show considerable
potential for reducing weight, however, the state-of-the-art has not yet
matured; full development should be attained by 1995. Powder metallurgy is
limited in its application and potential savings. The PM state-of-the-art
is not currently at a level necessary for near-term consideration.
0
149

NADC-88066-60
TYPE APPLICATIONS ADVANTAGES DISADVANTAGES
Composites - Actuator Cylinders - Up to 25% Weight - High Cost(Filament Wound) - Reservoirs Savings Over Steel - Development Still In Early
- Accumulators - Superior Fatigue Stages- Hydraulic Tubing Properties
- Ballistic Survivability
Powder Metallurgy - Valve Housing - Up to 10% Weight - High Cost(Aluminum and - Manifolds Savings Over Steel - Suitability for HydraulicTitanium) - Fittings - Near Not Shape Components To Be Proved
Manufacturing - Reproducibility of- High Temperature Properties In Production
Capabilities Quantities Is Uncertain
Superalloys - Hydraulic Tubing - Up to 50% Weight - Time of Fitting Attachment( Titanium) - Actuator Bodies Savings Over Steel ys. Time of Heat
and 25% Over Treatment To Be ResolvedT1-3AL-2.5V - Heat Treatment May Cause
- Excellent Formability Tube Bend Warpage- Heat Treatable
Figure 55. Advanced materials surmmary
3.5- 1000
-900.0 3.0-
* -800
2.5- 700 .
8600S 2.0-
CL, 400 "
T 1.53
1.0-30
0-0
0
Weight Reduction -%
Figure 56. Advanced materials fuel and weight savings
150

NADC-88066-60
*Super alloys have great potential. One improved alloy which currently
appears ready for use in aircraft hydraulic systems is Ti-15-3. (See
section 2.4.8.1.4.) The energy savings potential of using Ti-15-3 was
assessed by comparing it with Ti-2.5V-3A in the baseline design. A 25%
reduction in tubing weight and 15 to 18% reduction in actuator weight was
projected. Weight and fuel savings-per-aircraft-life as a function of
baseline weight reduction is shown in Figure 56. Assuming a 25% decrease in
tubing weight and 16.5% reduction in actuator weight by using Ti-15-3, an
energy savings of 1.43 M-lb in fuel and a weight reduction of 408 lb can be
achieved. Advanced materials have the greatest potential for saving energy
and reducing weight of all the concepts investigated.
2.4.9 Design Margins
Design margins used in aircraft hydraulic systems are more conservative than
those used for other areas as shown below.
DESIGN
AREA MARGIN
o Structures 150%
o F/C Mechanical 150%
o Electrical 150%
o Hydraulic ComponentsProof 150%Burst 200%
o 8000 Psi Hydraulic TubingProof 200%Burst 300%
151

NADC-88066-60
Factors influencing tubing design margins are listed below. Also listed are
qualitative comments for each factor which reflect the current
state-of-the-art relative to when the margins were originally established.
CURRENT
FACTOR STATE-OF-THE-ART
o Material Property Consistency Better (Ti-15-3)
o Manufacturing tolerances Better
o Handling Damage, Scratches,Dents and Etc. Same
o Actual Surge Pressure Better test techniquesSurges lower in 8000 psi
systems
o Bends (ovality) Autofrettage
o Safety Hydraulic fusesReservoir level sensingMul ti pl e control s
o Fitting Stress Concentration Better fitting designs
Design margins for tubing are significantly higher than any other safety
margins used in aircraft design. Burst pressure requirements for 3000 psi
tubing and fittings were established over 50 years ago at 400%. It is still
the same today even though many advances have been made in fittings, tube
manufacturing, materials, inspection, and quality control.
Burst pressure used in the design of 8000 psi tubing is currently 3 x 8000 =
24000 psi. This value is based on a pressure surge allowable of 120% or
9600 psi maximum. If the tubing burst pressure requirement was lowered to
20,000 psi, tubing weight could be reduced. The rationale for lowering the
design margin to ?0,000 psi involves tubing pressure safety margin, maximum
allowable pressure surge, endurance strength, and plastic deformation.
152

NADC-88066-60
2.4.9.1 Pressure Safety Margin. Safety margins for 3000 psi and 8000 psi
tubing are compared below:
3000 psi Tubing (Current)
Burst Pressure - Maximum Allowable Pressure Surge = 12000 - 4050- 7950 psi
8000 psi Tubing (Revised Margin)
Burst Pressure - Maximum Allowable Pressure Surge = 20000 - 9600= 10400 psi
Using a burst pressure of 20,000 psi, the pressure safety margin for 8000
psi tubing is approximately 20% greater than for 3000 psi tubing.
2.4.9.2 Pressure Surges. A reduction in the maximum allowable pressure
surge from 120% to 115% would permit lowering the burst pressure to 20,000
psi as follows:
Burst Factor - Surge Factor = 7.5*Surge Factor I00%
*Value for 3000 psi systems, reference 12.
B.F. - 1.15 =7.51.15 - l.M
B.F. = 2.275
Burst Pressure = 2.275 X 8000 = 18,200 psi
Methods to reduce pressure surges are available and include local fluid
velocity control, properly sized restrictors, low surge solenoid valves, and
actuator end-of-stroke snubbing. Faster pump response also reduces pressure
transients. The amount of pressure surge reduction required -- from 9600
psi to 9200 psi -- is relatively small (4%) and should be achievable with
careful hydraulic system design. The allowable overshoot for 8000 psi
systems would then be 1200 psi versus 1050 psi for 3000 psi systems.
153
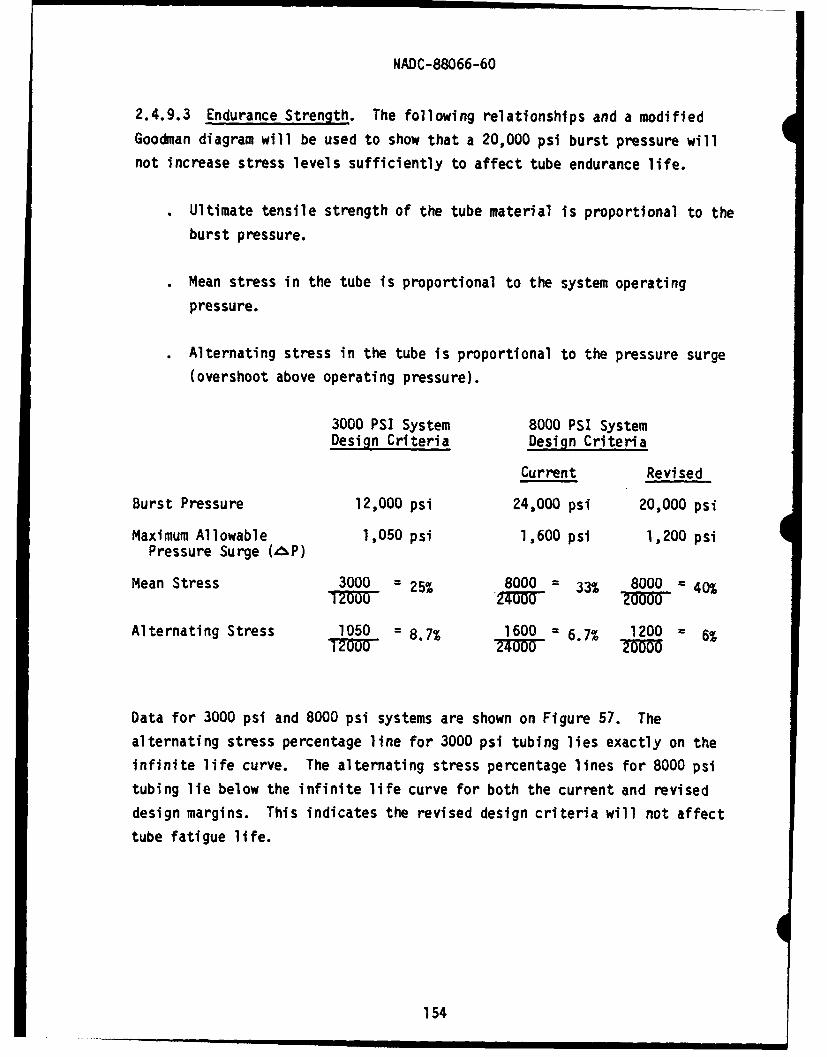
NADC-88066-60
2.4.9.3 Endurance Strength. The following relationships and a modifiedGoodman diagram will be used to show that a 20,000 psi burst pressure willnot increase stress levels sufficiently to affect tube endurance life.
" Ultimate tensile strength of the tube material is proportional to theburst pressure.
. Mean stress in the tube is proportional to the system operating
pressure.
. Alternating stress in the tube is proportional to the pressure surge
(overshoot above operating pressure).
3000 PSI System 8000 PSI System
Design Criteria Design Criteria
Current Revised
Burst Pressure 12,000 psi 24,000 psi 20,000 psi
Maximum Allowable 1,050 psi 1,600 psi 1,200 psiPressure Surge (P)
Mean Stress 3000 = 25% 8000 = 33% 8000 = 40%
Alternating Stress 1050 = 8.7% 1600 = 6.7% 1200 = 6%
Data for 3000 psi and 8000 psi systems are shown on Figure 57. The
alternating stress percentage line for 3000 psi tubing lies exactly on the
infinite life curve. The alternating stress percentage lines for 8000 psi
tubing lie below the infinite life curve for both the current and reviseddesign margins. This indicates the revised design criteria will not affect
tube fatigue life.
154

NADC-88066-60
060
0
0- 0
4, 4
*1*1
I- EU
I >
41.
CD 0 0co c-
o C3
155 E

NADC-88066-60
2.4.9.4 Plastic Deformation. When tubing is designed to withstand
low-to-moderate pressures and the tube wall is thin, the tensile stress is
nearly constant throughout the wall thickness. Under those conditions,
stress in the tube wall is related to internal pressure by,
__I_ Eq. I
Zt
where, S = tensile hoop stress
P = internal pressure
d = tube I.D.
t = tube wall thickness
As wall thickness is increased to withstand higher pressures, the
distribution of tensile stress across the wall becomes non-uniform and
Equation 1 no longer applies. Tubing is considered to be thick wall when
the mean radius-to-wall thickness is less than 10 (LHS tubing has a ratio
less than 5). Stress in thick wall tubing is usually calculated by,
p(~2w &..)Eq. 2
where, S = tensile hoop stress
P = internal pressure
D = tube O.D.
d = tube I.D.
Equation 2 is based on elastic theory, and produces conservative designs
since it does not account for the fact that thick wall tubing has
considerable strength beyond the on-set of yielding. Thick wall tubing is
more highly stressed at its inner surface than its outer surface. Tubing
designed to account for this condition will more efficiently utilize the
156

NADC-88066-60
strength of the material and will have thinner walls than tubes designed
using conventional methods. An equation for determining burst pressure with
the tube I.D. in the plastic state (beyond the elastic limit) is given
below: (Reference 13).
Eq. 3
where, Pb = tube burst pressure
Sy = yield strength of tube materialSu = ultimate strength of tube material
D = tube O.D.
d = tube I.D.
Wall thickness based on 24,000 psi and 20,000 psi burst pressures applied to
*0.5 in. O.D. 3Al-2.5V titanium tubing are compared below. Weight savings
are also shown.
Wall Thickness, in. Weight Savings, %
Elastic State Plastic State Elastic State Plastic StateDesig n Desig9n Design Desig9n
24,000 psi 0.051 0.045 0 10Burst Pressure
20,000 psi U.043 0.039 13 20Burst Pressure
Weight savings obtained for 0.5 in. O.D. tubing would not apply to system
savings since a significant percentage of the transmission lines have a
minimum wall thickness of 0.020 in. (for handling purposes).
157
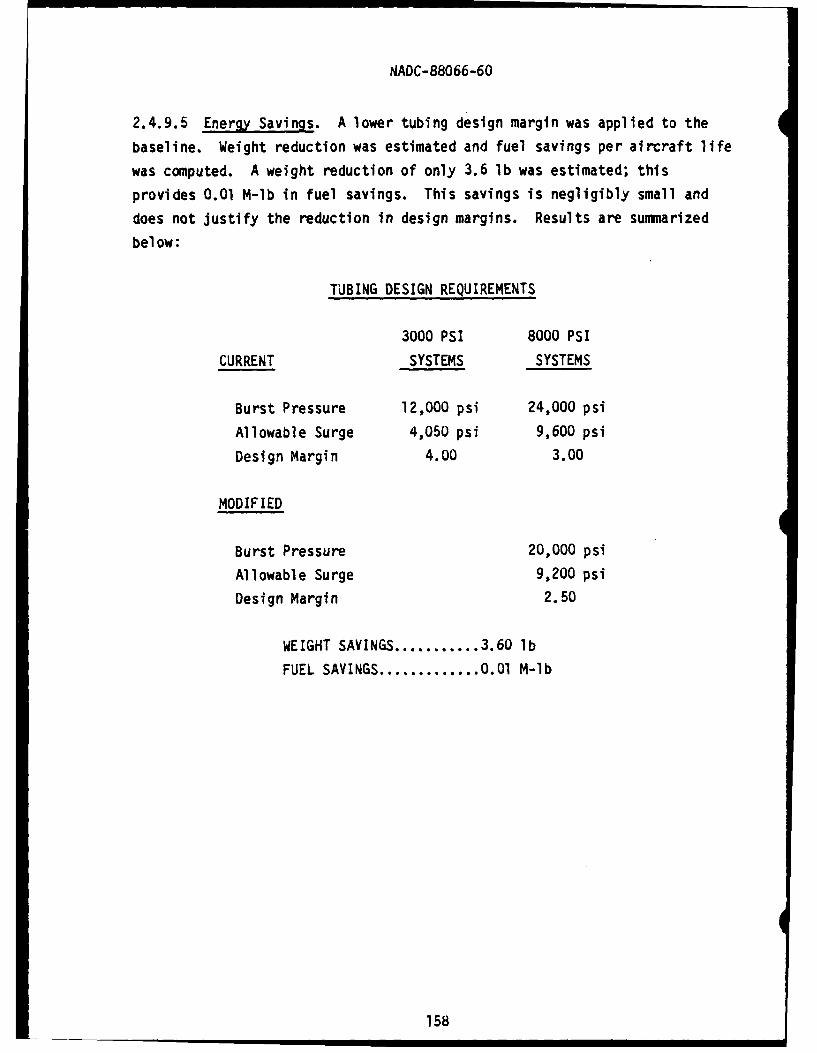
NADC-88066-60
2.4.9.5 Energy Savings. A lower tubing design margin was applied to the
baseline. Weight reduction was estimated and fuel savings per aircraft life
was computed. A weight reduction of only 3.6 lb was estimated; this
provides 0.01 M-lb in fuel savings. This savings is negligibly small and
does not justify the reduction in design margins. Results are summarized
below:
TUBING DESIGN REQUIREMENTS
3000 PSI 8000 PSI
CURRENT SYSTEMS SYSTEMS
Burst Pressure 12,000 psi 24,000 psi
Allowable Surge 4,050 psi 9,600 psi
Design Margin 4.O0 3.00
MODIFIED
Burst Pressure 20,000 psi
Allowable Surge 9,200 psi
Design Margin 2.50
WEIGHT SAVINGS ........... 3.60 lb
FUEL SAVINGS ............. 0.0l M-lb
158

NADC-88066-60
2.4.10 Thrust Vectoring
The need for short takeoff and landing (STOL) and post stall maneuvering
t.apabilities will likely become requirements for the next generation
tactical fighter. Utilization of innovative and conventional thrust
vectoring techniques are being examined to enhance the moment balance and
control limitation associated with these flight modes. The actuation of
thrust vectoring nozzles typically requires large amounts of hydraulic
power. This would seemingly preclude the off-loading of control moment
generation from aerodynamic surfaces to the T/V nozzles for the sake ofimproving hydraulic system efficiencies. However, if thrust could bevectored by some other means, hydraulic actuation would not be required.
One innovative approach for generating control moments with less control
power is the use of hot gas powered thrust diverters. Fluidic control
technology has matured to the extent where fluidic devices have been
integrated into total systems having capabilities for sensing,
stabilization, control, and actuation. This concept is discussed in section
2.4.10.1.
Another possibility is the diversion of hot engine gas to trim nozzles
located at the nose and tail of the aircraft. The nozzles direct a small
amount of thrust vertically downward at a large moment arm to develop trim
moments without using T/V actuators or aerodynamic surfaces. This concept
is discussed in section 2.4.10.2.
2.4.10.1 Hot Gas Diverters. Thrust vector control is commonly employed to
provide larger magnitude steering moments during low speed flight than can
be obtained with aerodynamic surfaces. A number of methods are currently
being explored to vector the hot gas of a turbine engine. Actuators can be
used to swivel movable nozzles, but this requires elaborately sealed movable
joints. Tabs can be inserted to block part of the nozzle exhaust, or vanes
can be moved to deflect the exhaust. The injection of a fluid into thenozzle will also vector thrust. The fluid injection technique has the
159

NADC-88066-60
advantage of simplicity and fast response, but typically produces small
deflections and exhibits a low primary-flow-to-secondary injection ratio.
Other potential problem areas are reduced nozzle and engine efficiency
resulting in decreased thrust and increased energy consumption. This is
partially offset by less complexity which results in lower weight.
There are many variations of fluidic injection vectoring available. For
this study three typical types are examined to show the concepts and define
typical weights and energy requirements of fluidic thrust vectoring.
Figure 58 illustrates a deflection nozzle in which hot gas is used to
deflect the main flow. Control ports are used on opposite sides to modulate
the main flow. At zero deflection the control jet flow is equal and
opposite. At full control one port is off and the other full on. The
control flow can require up to 10% of the main flow. Flow can be controlled
in two axes by adding a second set of control ports. This requires
increased control flow.
The bistable control of Figure 59 operates with low pressure bypass air or
ram air. The main flow is deflected by the pressure difference between the
two control ports. With no control flow, a low pressure area is created
which pulls the main jet to the straight wall where the flow is bounded.
Deflections up to 30 degrees are possible. While this concept is bistable,
it can be made to work proportionally by pulse duration modulation (PDM).
Multiple control ports can be used to obtain multi-axis control. Simple
electrically operated solenoid valves can be used in this application
Another control method that does not require high pressure control gas is
the overexpanded nozzle shown in Figure 60. If thrust is to be maximized, a
nozzle is normally terminated where nozzle pressure matches the ambient
pressure. If the nozzle extends beyond this length, flow becomes
over-exposed and subambient in pressure. The prevail ng ambient pressure
has a boundary layer effect on the man stream. At some point the momentum
160

NADC-88066- 60
Control On
ControlFlow I ,-,Output OffHigh
Main Fow =10. 4off Main Flow001
CoContro OffA
Nozzle Cross SectionCotlOf
6% Thrust Loss When Used 6% Constant Thrust Loss
Figure 58. Deflection nozzle Figure 59. Bistable fluidic control
0O RESRLLOW PRESSURE
SEPARATION
ATMOSPHERICIDEAL PRESSURE
ATM4OSPHERIC LOW PRESSUREPRESSURE
S. CONTROL OF OVEREXPANSIONA. OVEREXPANDED NOZZLE WITH AMBIENT AIR PORTS
C. THRUST VECTOR DEFLECTION 0. THRUST VECTOR CONTROLRESULTING FROM B.
Figure 60. Overexpanded nozzle
161

NADC-88066- 60
in the boundary layer can no longer overcome the higher downstream pressure
and the flow separates from the nozzle walls. This free separated flow now
entrains ambient air. Since the nozzle extends beyond the separation point
the entrainment needs within the nozzle create a counter-flow condition.
This lowers the pressure on both sides of the separated flow.
By adding control ports, ambient air can enter through the open control port
and partially satisfy the entrainment needs; this causes the local pressure
to increase. Since the opposite side port is closed, pressure is lower and
flow is deflected. Deflections of up to 15 degrees are possible. To
produce axial thrust with no deflection, all control ports are left open to
minimize thrust loss due to the ove'expanded nozzle. The overexpanded
nozzle has a thrust loss of typically 6 to 8%. The basic advantages are:
1) control ports are not exposed to nozzle hot gas flow; and 2) no external
secondary supply subsystem is needed. By installing multiple ports on the
nozzle, multi-axis control can be obtained.
The hot gas deflection nozzle was selected for the energy efficiency study
because; 1) the overexpanded nozzle is limited to +15 degrees of thrust
deflection which will not supply the desired amounts of control power; and
2) bistable control requires a series of valves and nozzles which adds to
system complexity and weight, and as portions of the thrust are always
deflected, there is an inherent loss of thrust even when thrust vectoring is
not required.
For the purpose of an energy usage evaluation a design concept and
application were developed. The comparisons use deflected angles up to 30
degrees. This is not necessarily a design limit. It was estimated that a
maximum thrust loss of 6% would result from thrust vectoring control. While
the design concept requires approximately 10% of the main stream flow for
deflection, this energy is not all lost as it re-enters the main stream at
an angle. There are additional losses in the ducting, control and the
re-mixing of th- hot gases which make the 6% loss a reasonable estimate.
162

NADC-88066-60
*Total fuel consumed by the baseline hydraulic system during the 2.7 hour
mission is 19,400 lb. Fuel required for the T/V actuators (8) is 497 lb.
The hot gas deflection nozzle concept was estimated to use 6% of the thrust
for control, or 1164 lb of fuel per mission. This is 667 lb greater than
the baseline. The deflection nozzle approach has continuous "direct" fuel
consumption whether thrust is being deflected or not, whereas in the
baseline hydraulic system, fuel is consumed primarily by actuator movement
and secondarily by leakage. Indirect fuel consumption by the hot gas system
is less than the baseline because of a projected weight savings. The weight
reduction necessary to save 667 lo of fuel/flight is:
WT = 667 = 705.8 lb" 2.7 x .14 x 2.5
where, 2.7 = mission time
.14 = fuel consumption rate per pound coefficient
2.5 = weight growth factor
*The total equipment weight of the baseline T/V actuation is:
Actuation 257.5 lb
Hydraulic System 84.7 lb
Total 342.2 lb
The equipment weight estimate for the hot gas thrust vectoring concept is
shown in Table 64. Since 166.2 lb (baseline T/V weight - hot gas control
weight) is less than the required 705.8 lb weight reduction to break even, a
sizable energy loss will result from using hot gas thrust vectoring. However,
if the main purpose of thrust vectoring is to provide control at low speeds,
it would be reasonable to assume that thrust vectoring will only be used for
landing, takeoff and combat. It can also be assumed that the thrust vectoring
ports can be turned off with no thrust losses in the off position.
163

NADC-88066- 60
TABLE 64. Estimated weight, hot gas control
4 Ducts 4 lb ea. 16 lb
4 Control Valves 8 lb ea. 32 lb(Modulate)
4 Control Nozzles 6 lb ea. 24 lb(On-Off)
4 Misc Hardware 4 lb (lot) 16 lb
Total per Engine 88 lb
Total per Aircraft 176 lb
TABLE 65. Hot gas T/V, fuel consumption
Fuel Consumption (Full Time T/V)
Elimination of T/V Actuation -1.09 M-lb
Hot Gas System Weight +0.62 M-lb
Thrust Loss (6%) +4.31 M-lb
NET +3.84 M-lb
Fuel Consumption (Part Time T/V*)
Elimination of T/V Actuation -1.09 M-lb
Hot Gas System Weight +0.62 M-lb
Thrust Loss Reduced to +0.69 M-lb
NET +0.22 M-lb
*T/V used in takeoff, landing and combat phases.Assumes no loss when turned off.
164

NADC-88066-60
*Total fuel consumption was computed for both full time T/V and part time T/V
(take-off, landing and combat modes). Table 65 shows the difference between
these operating modes and the baseline. The full time mode increases total
fuel consumption by 3.84 M-lb; the part time concept increases that
consumption by 0.22 M-lb.
(nis cursory look at the use of hot gas for thrust vectoring does not
indicate an energy savings. A detailed study would be required, including
redesign of the engines, to determine if potential energy benefits exist.
The most apparent advantage of some form of fluidic thrust vectoring is the
potential for continued control of the aircraft after the loss of all
hydraulic power. The application of fluidics or hot gas control for thrust
vectoring is still in the early stages of development. While this study did
not show an energy saving, the continued development of this technology may
provide significant benefits including energy savings.
2.4.10.2 Trim Thrust Vectoring. A trim thrust vectoring concept is
*illustrated on Figure 61. Engine bleed air is diverted and ducted to the
front and rear of the vehicle where it is exhausted through small nozzles
orientated along vertical axes. The pitch trim moment is controlled by
varying the ratio of air diverted to fore and aft nozzles. A brief review
of the concept is presented in Figure 62. Although some benefits may be
derived from this concept, its impact on the hydraulic system is negligible;
all the baseline actuation systems and control surfaces are still required.
Since trim thrust vectoring has negligible impact upon the hydraulic system,
and since an aero/propulsion study would be required to ascertain the
potential benefits -- which is beyond the scope of effort of the current
contract -- investigation of the concept was discontinued.
165

NADC-88066-60
EngineAir Thrust
Thrust
Nozzle Nozzle
Figure 61. Trim thrust vectoring concept
OBSERVATIONS* Long Moment Arm Produce Large Moments With Small Thrust
* Eliminates Surface Trim Drag
* Eliminates Down-Loaded SurfaceEquivalent to Weight Savings
NEGLIGIBLE IMPACT UPON HYDRAULIC SYSTEM" Still Need Same Control Surface
" Still Need Thrust Vectoring Control
CONCLUSIONS" No Significant Impact Upon Hydraulic Energy Consumption
" Requires Aero/Propuision Study To Assess Advantages
Figure 62. Trim thrust vectoring review
166

NADC-88066-6'
.2.4.11 Vehicle Control Systems
Control system design has a major influence upon power and energy
requirements. It brings together advanced technology concepts in control
configured vehicles such as optimization of surface commands and adaptive
gain capabilities of microprocessor based control systems, direct-drive
actuation, alternate control moment generation, and pulse modulated
valves. Two control concepts were investigated to determine their
potential for energy savings: 1) variable gain/bandwidth and 2)
command/control optimization. These concepts are discussed in the following
subsections.
A five degree digital computer simulation, illustrated in Figure 63, was
used in the investigation. A three axis flight control system, flight
control actuation, and atmospheric turbulence were modeled. Baseline gains
and bandwidths were established to provide MIL-F-8785C performance.
O2.4.11.1 Variable Gain/Bandwidth. Variable gain control systems is an
energy savings concept based on the fact that a significant part of an
aircraft's total mission time consists of non-critical, low rate maneuvering
flight. The versatility and power of the microprocessor can be effectively
used to alter system gain and bandwidth to match the lower control system
demand while maintaining Level 1 flying qualities. The ultimate effect is
to minimize excessive control surface rate demands, overshoots, and
reversals that would otherwise occur with the higher gain required for
critical, maneuvering flight. The change in gain/bandwidth sensitivity may
be a continuous or discrete function of control force, aircraft angular
rates, and/or accelerations. The study explored the application of this
concept to an advanced multi-mission baseline vehicle having three-axis
stability augmentation and autopilot functions. The energy saving benefits
derived from demand induced gain/bandwidth variations were parametrically
evaluated.
167

NAD C- 88066-60
System Variables [Turbulence* Gait~sndldthModels 1
" Gai/Bandidth(MIL-F-8785C1* Distributed Controls g
ag. Pg,g Pg. rg
3-Axis Actuator Models Sufc 5 DOF Aircraft MotionsFlihtCotrls+ ostins Equations of eAcclerations
a, q Ouput Aero Data5 Missions
LEnergy UsageControl Surface Travels Vs. Frequency
Figure 63. Energy efficient aircraft simulation
CONTROL SYSTEM CONFIGURATION:*Pitch Attitude Command/Attitude Hold
*Pitch Rate Damping
SYSTEM DISTURBANCES*Discrete Attitude Commands; Two per Minute
40Up 20Do"n
0 030 40 s
Time - Seconds
*Angle-of-Attack and Pitch Rate Gusts per Turbulence Models ofMIL-F-8785C Flying Qualities Specification
Figure 64. Variable gain approach, disturbances
168

NADC-88066- 60
*The pitch axis control system was investigated for two flight conditions:
0.8 Mn at 40,000 feet and 0.27 Mn at sea level. Disturbances to the
system consisted of discrete attitude commands and gust inputs, Figure 64.
The horizontal surface actuator average displacement as a function of
frequence was determined by sampling surface position periodically . Data
were collected for nominal, twice (+6db) and half (-6db) control system
gains, Figure 65. The energy consumed by the horizontal surface actuators
was also computed for each flight condition and gain, Figure 66.
Energy consumption for the cruise flight mode is strongly dependent upon
control system gain. Energy consumption in the landing mode increases with
gain but at a lower dependency.
A variable gain/bandwidth control system was conceived wherein the gains
were reduced by 6db in the cruise and loiter mission modes only. This was
done because the savings potential in the take-off and landing modes is
minimal and maximum performance is needed principally in the dash and combat
mission legs. Based upon the data shown in Figure 66, and the methods of
computing fuel consumption developed in Section 2.1, fuel consumption would
be reduced by 0.21 M-lb over the life of the aircraft. These energy savings
can be accomplished with minimal impact upon hardware and consequently,
weight.
Another advantage of the variable gain/bandwidth concept is a reduction in
actuator cycles which in turn reduces maintenance and improves actuator
life. It is recommended that energy consumption and actuator life be a
consideration in the flight control law development for new advanced
aircraft. Results of this investigation are summarized in Figure 67.
0
169

NADC-88066-60
Mach 0.8 at 40K Mach 0.27 at Sea Level(96 Minutes) 4.0- (5-Minute Landing)
1.16 +.12 d* Gsi
1.30 0.72
3 1 2 3 4 102. miiGb
1.06 1.4 0 +5 0.66 .0
1 0.22 0.1
1.0 ko l.00i 10.56na Gan0 2 3 4 10
030 0 4.0-
j1 2 3 4 10
1.0-Sb~ln202.060 - 6 dOGIn
02" 0.22 06 060.676 0.50,0.071 0.049
0.0 1 2 3 4 10 0- 2 3 4 10F quw is Sands - Hz Fmpouney Sands - Nz
Figure 65. Variable gain approach, gain levels
Hydraulic System Energy Usage Versus System Gain
96-Minute Cruise
20 0.8 at 40K
Horizontal Stabilizer 1Energy Usage
(Two Sides) - 104 Ft-Lb 12 -- -
8 -
5-Minute Approach/Landing4-
- 6db Nom + 6db + 12 dbPitch Autopilot Loop Gain
Figure 66. Variable gain approach, energy consumption
170

NADC-88066-60
ENERGY SAVINGS .21 M-LB (1.9%)
(Applying Savings to FIC and TV Actuatorsin Cruise and Loiter Modes)
CONCLUSIONS
Energy Savings Can Be Obtained With Minimal Impact on Hardware
Flight Control Law Development Should Include Consideration ofEnergy and Actuator Life
Figure 67. Variable gain/bandwidth, conclusions
2.4.11.2 Command/Control Optimization. Movement of control surfaces
extracts energy from the hydraulic system regardless of the aerodynamic
effect upon the aircraft. The effectiveness of control surfaces varies with
airspeed, altitude, and vehicle configuration. For instance, outboard
ailerons are generally more effective than inboard ailerons due to the rollmoment arm (distance of the surface from the centerline of the aircraft).
It may be better to utilize only the outboard ailerons until reaching their
efficiency limit before deflecting inboard ailerons. Further, it may be
more efficient to increase the number of ailerons so that only the most
effective areas are utilized. This would also provide advantages in
survivability. Some control surfaces, such as leading edge flaps in
flexible wing aircraft, become totally ineffective in certain portions of
the flight regime and could be shut off to conserve energy. Other controlseven become counter-effective, that is, produce the opposite effect desired
in specific flight conditions. The classic example of this control reversal
is at high "q". The use of thrust vectoring provides additional options for* flight control optimization. In some portions of tne flight envelope
control by thrust vectoring is more effective and perhaps more efficient
than control by aerodynamic control surfaces.
17l

NADC-88066-60
With the computational capability now available for fly-by-wire control
systems, it is possible to optimize control moment generation for
efficiency. As part of this study effort, the energy savings potential for
command and control optimization was evaluated from an overall standpoint.
Even though a concept saves hydraulic energy, it would not be energy
efficient if it increased aerodynamic drag or introduced undesirable control
cross-coupling effects that could produce energy losses.
In general, control surface effectiveness increases with airspeed (dynamic
pressure), i.e. smaller surface deflections are required to produce the
necessary moment. Since the control surface moves a smaller distance in a
given time period, the surface actuator flow rate is lower. This
relationship is illustrated in Figure 68. Thrust vectoring effectiveness
decreases with increasing dynamic pressure -- the opposite of control
surface effectiveness. A control system which optimizes control at each
dynamic pressure operating point will be the most energy efficient and will
minimize hydraulic flow requirements.
The command optimization concept is depicted in Figure 69. Hydraulic flow
requirements for combined control, that is thrust vectoring and aerodynamic
surfaces, is reauced from the requirements of aerodynamic control alone.
Reducing peak flow requirements is essential to minimizing the size and
weight of the hydraulic system (see Section 2.3.2). The effects of combined
control were considered in developing the baseline concept.
It became apparent during the study that command optimization would save
energy. However, command optimization is more an effect of aerodynamic
control system design than hydraulic system design. Hydraulic requirements
must be evaluated during the command optimization process, with special
emphasis on reducing peak flow requirements. Hydraulic considerations are
summarized in Figure 70.
172

NADC-88066-60
0 * Aerodynamic Control Surfaces
Rate (Flow) Control MomentRequirement Effectiveness
; - Dynamic Pressure
Figure 68. Command optimization, flow requirements
0
* Combined Thrust-Vectoring/Control Surfaces
Control SurfaceEffectiveness
Combined Effectiveness /
S.-- Thrust-Vectoring* Eirectiveness
C
Combined Flow
Requirement
-Dynamic Pressure -
Figure 69. Command optimization concept
173

NADC-88066- 60
HYDRAULIC SYSTEM DESIGNFOR COMMAND OPTIMIZATION
" Hydraulic System Design Requirements Must Influence Control LawDevelopment
" Hydraulic Designer Must Develop Trade Data To Demonstrate Effects ofRequirements
" Increase of I GPM Is Equivalent to 7.6 Pounds of Fuel Per Flight forBaseline Aircraft
Figure 70. Command optimization, hydraulic considerations
COMMAND OPTIMIZATION
CONTROL EFFECTORS
PITCH ROLL YAW* Horizontals * Outboard TE * Rudders* Inboard TE 9 Horizontals * Vectored Thrust* Vectored Thrust * Vectored Thrust
* Effectors Sized for Worse Case* System Sized for Control Requirements* Reconfigurable Controls Used To Select Required
Combination of Effectors* Control Law Development Must Consider Impact Upon
Hydraulic System Energy Consumption
Figure 71. Command optimization, control effectors
174

NADC-88066-60
The control effectors and system considerations for command optimization are
listed in Figure 71. The control effectors must be sized for "worst case"
which means command optimization will not reduce actuator size; pump and
line size may be reduced. Command optimization will reduce energy usage by
reducing control commands.
The investigation shows that command optimization mainly affects aerodynamic
and flight controls with very little affect on hydraulic design. Command
optimization will not result in new design techniques or concepts for
hydraulic systems. Command optimization is basically an aerodynamic and
control concept for saving energy and not a hydraulic concept. Therefore,
it was not pursued in greater detail.
175

NADC-88066-60
2.5 COMPARATIVE ANALYSIS
The energy saving concepts investigated were rated comparatively. As
discussed in Section 2.1, total fuel consumption over the life of the
aircraft was selected as the common basis for comparing all concepts. The
difference between fuel consumed in the baseline system and fuel consumed
when applying the concept to the baseline was computed and referred to as
energy savings. This data is summarized in column two of Table 66.
Qualitative ratings were established by the procedure discussed in Section
2.1.5; this data is contained in columns 3 through 7 of Table 66. A figure
of merit (FOM) was computed for each concept by the procedure outlined in
Section 2.1.5.; this data is presented in column 8 of Table 66.
FOM is a parameter by which the concepts were ranked in order of their
energy saving potential. Those concepts which had negative savings
(actually consume more energy than the baseline) were removed from
consideration. The remaining concepts are listed in Table 67. Flow
augmentation had zero energy saving potential when applied to the baseline.
When applied to the target system it was found to have good potential and
was therefore included in the listing.
176

NADC-88066-60
TABLE 66. Concept ratings
AVERAGE RATINGS
CANDIDATE ENERGY - FONCONCEPTS SAVINGS.
M-LB R&I, LCC DEVELOPMENT PERFORMANCE SAFETY RATING
RISK
PUIPS +.45 +.01 -. 25 -1.43 0 0 .37ZAPS -1.45 -. 76 -. 75 -. 28 0 +.29 --
DISTRIBUTION SYSTEM +.35 +.01 0 -. 43 0 *.03 .34ACCUMULATORS +.12 *1.46 +1.0 -. 01 *.05 0 .14ROTARY VANE BASIS .1.25 +1.0 -. 37 +.63 0 ---VARIABLE DISPLACEMENT -. 95 -. 9 -1.0 -. 70 -. 2S -. 64 ---SLINLINE - (POD) -.45 -.45 -.82 .37 -.55 0SLII.INE - (NINGLrLINE) -. 08 -1.07 -. 90 +.20 -. 88 0 ---PRESSURE INTENSIFIERS -1.17 -. 9 -. 9 -. 63 -. 38 -. 75AIDING LOAD RECOVERY 0 -. 44 -. 20 -. 77 0 -. 30 ---FLOW AUGMENT 0/*.5 -. 28 -. 20 -. 45 4.11 -. 22 0/.47NONLINEAR VALVES .37 -. 14 -. 03 -. 28 0 0 .36DUAL PRESSURE SYSTEM +.44 0 -. 52 -. 50 0 -. 11 .41HYBRID HYD/EM +.07 +.15 +.18 -.15 0 +.02 .07ADVANCED MATERIALS +1.43 -. 22 -. 75 -. 75 +.05 -. 10 1.30DESIGN MARGINS 0 -.04 -.03 -.6 +.03 -.06 ---
TRIM THRUST VECTORING ? -. 28 -. 72 -1.10 *.11 -. 44 ?NOT GAS THRUST VECTORING -. 22 -. 12 -. 17 -. 97 -. 12 +.09 --
VARIABLE GAIN/IIANDVIDTH .21 -. 62 -. 41 -. 15 -. 55 +.01 .19COMAN OPTIMIZATION ? -. 08 -. 37 -. 67 -. 73 0 ?
TABLE 67. Concept rating summary
CANDIDATE ENERGY AVERAGE RATINGS FOM HARDWARECONCEPTS SAYING R& IC DEVELOPMENTM-LBS RIS M ;C EEPN PERFORMANCE SAFETY RATING DEMO
Advanced Materials +1.43 -0.22 -0.75 -0.75 +0.05 -0.10 1.30
Dual-Pressure System + 0.44 0 -0.52 -0.50 0 -0.11 0.41 4Pumps +0.45 +0.01 -0.25 -1.43 0 0 0.37 4Nonlinear Valves +0.37 -0.14 -0.03 -0.28 0 0 0.36
Distribution System + 0.35 + 0.01 0 -0.43 0 + 0.03 0.34
Variable Gain/Bandwidth +0.21 -0.62 -0.41 -0.15 -0.55 +0.01 0.19
Accumulators +0,12 + 1.46 + 1.00 -0.01 +0.05 0 0.14
Hybrld Hyd/Em +0.07 +0.15 +0.18 -0.15 0 +0.02 0.07
Flow Augment 0/+0.50 -0.28 -0.20 -0.45 +0.11 -0.22 010.47
177

NADC-88066-60
2.6 ENERGY EFFICIENT TARGET SYSTEM
An energy efficient system, entitled Target System, was created by
incorporating the concepts having the highest energy savings potential into
the baseline system. Weight and energy savings gained by employing these
concepts are listed in Table 68. Combined, they provide a fuel savings of
3.06 M-lb per aircraft over its life. This represents a savings of 28% over
the baseline. A major portion of this gain is the result of weight
reduction. The target system equipment weight is 384 lb less than the
baseline -- a reduction of 14.5%. As discussed in Section 2.1, there is a
relationship between weight and energy (fuel). Using fuel consumption
coefficients, an equivalent weight of 868 lb was computed. This value
includes equipment weight plus growth factor, and fuel weight savings due to
the weight reduction and lower power usage. Eight hundred sixty-tight
pounds represents 32.3% of the baseline hydraulic system weight. This
significant weight reduction could be used to increase aircraft performance,
either dynamically or in endurance, or in heavier weapon stores which would
reduce the number of aircraft required.
TABLE 68. Target system weight savings
WEIGHT REDUCTION ENERGY REDUCTION(LB) (M-LB FUEL)
HCV Pump 6 0.450
Distribution System 35 0.022
Metal Bellows Accumulator 33 0.120
Nonlinear Valves 0 0.373
Dual Pressure Level System -8 0.460
Control System 0 0.210
Advanced Materials 318 1.430
Total 384 LB 3.065 M-LB(14.5-0) (28%)
EQUIVALENT WEIGHT REDUCTION 868 LB
(32.3%)
178

NADC-88066-60
2.7 STUDY PHASE CONCLUSIONS
The most promising energy savings techniques, based upon total energy
consumption and using the Figure of Merit rating method, are listed below in
descending order of potential.
CANDIDATE FOM
CONCEPTS RATING
Advanced Materials 1.30
Dual -Pressure System 0.41
Pumps 0.37
Non-Linear Valves 0.36
Distribution System 0.34
Variable Gain/Bandwidth 0.19
Accumulators 0.14
Hybrid Hyd/EM 0.07
Flow Augmentation 0/+0.50
The best approach, by far, is utilization of advanced materials to reduce
weight and fuel consumption. Dual-pressure systems were next best.
Application of all these concepts to the baseline vehicle produces appreciable
savings: weight is reduced 14%, fuel consumption is decreased 28%. These
savings are equivalent to 868 lb in weight.
The study demonstrates the necessity of considering the aircraft and hydraulic
system on a global basis. Weight was shown to dominate the factors affecting
total fuel consumption. Energy savings achieved by using a more efficient
component can easily be negated if the component increases total weight --
even a few pounds. Control laws used to design the flight control system
impact the power requirements of the hydraulic system. Control law
development for new aircraft must, therefore, consider this impact on
nydraulic system life and energy consumption; the design must be on a total
systems basis.
179

NADC-8866-60
After weight, hydraulic pumps are the next largest consumer of power. Pump
losses are relatively constant and essentially independent of pump output.
Losses are generally 12% to 18% of the peak output power. Peak power is
determined by the peak load demand; reduction of peak load demand reduces pump
size (weight) and losses, both of which decrease energy consumption. Any
energy reduction concept which lowers the peak demand also effects savings in
the hydraulic distribution system -- direct and indirect savings.
Energy savings translate into cost savings. Assuming a fuel cost of l0 per
pound, the target system would use $236,000 less fuel per aircraft life than
the baseline vehicle. Assuming a fleet of 500 aircraft, the dollar savings
would be $118,000,000. This represents a 3.3% cost savings over a fleet of
baseline aircraft. The "real" savings, however, lie in the equivalent weight
savings of 868 lb/aircraft. This translates into a heavier stores capability,
increased performance, and extended missions. Considering stores, the
baseline load was 6,400 lb; the target system aircraft could carry 7369 lb, an
increase of 15%. For an air-to-ground attack mission, 15% fewer aircraft
could deliver the same amount of stores. This represents savings in human
life, equipment life and operational costs. The effects of weight reduction
are, therefore, even more important than fuel cost savings.
Observations reached in this study, are summarized in Figure 72. The final
conclusion was clear:
"Don't add weight to save energy"
I
1 8U

NADC-88066-60
OBSERVATIONS
" Weight Dominates
" Pumps Next Largest Consumer
" Electrical Is Minor
" System Components Are Sized by Peak Loads.Reduction in Peaks Reduces System Weightand Save Energy
" Target System Saves $236K Over Life of Air-craft (@ 10¢/Lb Fuel Cost)
" Real Savings in Energy Lies in the EquivalentWeight It Saves. (i.e. Increases Performance,Extended Mission, Etc)
CONCLUSION
Don't Add Weight toSave Energy
Figure 72. Observations and conclusion
181

NADC-88066-60
REFERENCES
Reference
No.
1 Helsley, C.W., Airplane Actuation Trade Study, AFWAL-TR-82-3108,
Rockwell International Corporation, Concract F33615-79-C-3615,
January 1983, Unclassified.
2 Koch, W.G., Research and Development of an Integrated Servo
Actuator Package for Fighter Aircraft, AFFDL-TR-69-109, LTV
Electrosystems, Inc., Contract F33615-68-C-1387, November 1968,
Uncl assi fied.
3 Loppola, P.S., Rinde, J.E., Stalcup, D.H., Research and Development
of a Servo Actuator Package for a Tactical Fighter Aircraft,
AFFDL-TR-69-129, General Electric Company, Contract
F33615-68-C-1729, February 1970, Unclassified.
4 Hooker, D.S., Kissinger, R.L., Smyth, M.S., Survivable Flight
Control System Program, Simplex Actuator Package, AFFDL-TR-70-135,
McDonnell Aircraft Co., Contract F33615-69-C-1827, November 1970,
Uncl assi fi ed.
5 Becker, K.F., Pedersen, N.F., Research and Feasibility of an
Integrated Servo Pump Actuator Package for Aircraft,
AFFDL-TR-71-19, Vickers Aerospace Division, Sperry Rand Corp.,
Contract F361b-70-C-l088, January 1971, Unclassified.
6 Ainies, G.E., Clark, C., Jones, C.L., Smyth, M.S., Survivable Flight
Control System Studies, Analyses and Approach, AFFDL-TR-71-20,
McDonnell Aircraft Co., Contract F33615-69-C-1827, May 1971,
Uncl assi fied.
182

NADC-88066-60
ReferenceNo.
7 Linton, D. J., Energy Efficient Actuation Using Variable
Displacement Hydraulic Control, SAE Technical Paper 851757,
Sundstrand Corporation, October 1985.
8 Jeffery, J. R., Merrell, R. B., Pierce, N. J., Steven, N. J., and
Young, R. E., Flight Worthiness of Fire Resistant Hydraulic
Systems, AFWAL-TR-84-2085, McDonnell Douglas Co., Contract
F33bl5-80-C-2074, December 1984, Unclassified.
9 Binns, K. E., Campbell, W. B., Pierce, N. J., and Young, R. E.,
Nonflammable Fluid and 8000 psi Technology for Future Aircraft
Hydraulic Systems, SAE Technical Paper 851909, Wright-Patterson Air
Force Base and McDonnell Aircraft Co., October 1985.
l1 ARP-994, Recommended Practice for the Design of Tubing
Installations for Aerospace Fluid Power Systems, Society of
Automotive Engineers, April 1976.
11 Mayer, M. L. and Heslop, J., Manufacture and Properties of Ti-15V-3
Cr-3 Sn-3 Al Alloy Seamless Tubing, Cabot Wrought Products
Division, 1986.
12 oemarchi, J. N. and Haning, R. K., Application of Very High
Pressure Hydraulics Systems to Aircraft, NR72H-20, Columbus
Aircraft Division, North American Rockwell Corporation, Contract
N62269-71-L-0147, March 1972, Unclassified.
13 Comings, E. A., High Pressure Technology, McGraw-Hill Book Co., 1956.
14 LHS-8810A, Pumps, Hydraulic, Variable Delivery, 8000 psi, General
Specification For, Rockwell International, North American Aircraft
Operations, 15 August 1985.
0183

NADC-88066-60
ABBREVIATIONS AND SYMBOLS
Abbreviationsor
Symbol DEFINITION
A piston net area
A/C aircraft
ACC accumulator
ACT. actuator
AFCS automatic flight control system
A14AD, AM4 aircraft mounted accessory drive
APU auxiliary power unit
ASUW air-to-surface warfare
ATA Advanced Tactical Aircraft (Navy)
ATF Advanc.d Tactical Fighter (Air Force)
B backup
CBW control -by-wi re
cc/m cubic centimeters per minute
CD drag coefficient
CL lift coefficient
db decibel
DDV direct drive valve
DEG degree
DL design load
D m actuator displacement, inches
DSN design
ECS environmental control system
EDU electronic drive unit
EHA electro-hydrostatic actuator
EHV electro-hydraulic servo valve
EM electro-mechanical
184

NADC-88066-60
Abbreviationsor
Symbol UEFINITION
ES energy savings
FBW fly-by-wi reF/C flight control
FCRHP fuel consumption rate per horsepower coefficient
FCRLB fuel consumption rate per pound of equipment weight
coefficient
FOM figure of merit
ft feet
g gust
gal gallon
HCV hybrid check valve (pump)HM hinge moment
hp horsepower
hr hour
HVDC high voltage direct current
Hz Hertz (cycles per second)
IAP integrated actuator package
I.D. inside diameter
inj cubic inches
INBD inboard
IRT intermediate rated thrust
K thousand
K valve pressure gain coefficientPKq valve flow gain coefficientKW kilowatts
lb pound
L/D lift-to-drag ratio
LE leading edge
LH left hand (side)
LHS lightweight hydraulic system
185

NADC-68066-60
Abbreviationsor
Symbol DEFINITION
M, MN mach number
MIN minimum or minute (time)
M-lb 106 x poundsMTBF mean-time-between failures
MX maximum
N normal
NL no-load
NM nautical mile
NO. number (quantity)
NOM nominal
OAB outer air battle
O.D. outside diameter
OTBD outboard
P pressure
PI pressure intensifier
PM powder metal I urgy
psi pounds per square inch
PWGF power growth factor
Q flowRCS radar cross-section
rev revolution
RH right hand (side)
RN Reynold's number
RVDT rotary variable differential transformer
SAS stability augmentation system
sec second (time)
SFC specific fuel consumption
ShV shuttle valve
S.L. sea level
186

NADC-88066-60
Abbreviationsor
S __bol DEFINITION
SME subject matter experts
STAB horizontal stabilizer
t time
T torque or time
t/c wing thickness-to-cord ratio
TE trailing edge
T/R thrust reverser
T/V thrust vectoring
VF14X Advanced Multimission Fighter/Attack (Navy)
VHP very high pressure
VOL volume
W work
WT weight
WTGF weight growth factor
A delta
efficiency
control surface angular rate
micro (10 - 6)
w3 frequency (radians per second)
187

NADC-88066-60
THIS PAGE LEFT BLANK INTENTIONALLY
188

NADC-88066-60
APPENDIX A
INDUSTRY SURVEY
Contents
1. SURVEY QUESTIONNAIRE
02. COMPANIES SURVEYED
0189

NADC-88066-60
SURVEY QUESTIONNAIRE
Yes No 1. Could heat rejection in your pumps be reduced if special effortwere applied in this area? If so, please outline possibleapproaches and estimate their potential energy savings.
Yes No 2. Are you developing computer-controlled pumps to provide thecapability of power matching? If so, please outline your designapproaches.
Yes No 3. Are you developing energy efficient components suitable for use inintegrated actuator packages, such as servo pumps and variabledisplacement hydraulic motors, etc.? If so, please explain basicdesign features of your hardware.
Yes No 4. Are you pursuing development of other components or systemconcepts which either reduce power consumption, reduce weight, orimprove performance of aircraft hydraulic systems? If so, pleaseprovide details.
190

NADC-8806b-60
SURVEY QUEST I ON N A IRE
Yes No 1. Are you developing direct drive servo salves or other actuationcontrols which have the potential of teducing -nergy consumption,reducing weight or improving performance? If so, please providedetails.
Yes No 2. Are you applying developing computer controlled servo valves toreduce leakage, improve performance or manufactorability? If so,please describe.
Yes No 3. Are you applying advanced materials to actuators or othercomponents to reduce weight or improve performance? If so, pleasedescribe approach.
Yes No 4. Are you developing rotary hingeline actuation compatible withflight control requirements of advanced aircraft? If so, pleaseprovide details.
Yes No 5. Are you pursuing development of other components or systemconcepts which either reduce power consumption, reduce weight, orimprove performance of aircraft hydraulic systems? If so, pleaseprovide details.
0
191

NADC-88066-60
COMPANIES SURVEYED
COMPANY TELEPHONE NUMBER
Abex Corporation (805) 985-0217
Aerospace Division
151 West 5th Street
Oxnard, CA 93030
Allied Bendix Aerospace (315) 797-2500
Bendix Fluid Power Division
211 Seward Avenue
Utica, NY 13503
Allied Bendix Aerospace (213) 877-2881
Bendix Electrodynamics Division (818) 765-1010
11600 Sherman WayNorth Hollywood, CA 91605
Crane Company (21-) 849-1331
Hydro-Air Division (213) 842-6121
30U0 Winona Avenue
Burbank, CA 91b10
E-Systems, Inc. (801) 484-8661
Montek Division2268 South 3270 West
Salt Lake City, UT 84119
192

NADC-88066-60
COMPANIES TELEPHONE NUMBER
Garrett Corporation (305) 772-8080
Aero Hydraulics, Inc.
5841 North West 9th Avenue
Fort Lauderdale, FL 33309
General Signal Corporation (315) 782-7000
New York Airbrake
Starbuck Avenue
Watertown, NY 13601
HR Textron, Inc. (805) 259-4030
25200 West Rye Canyon Road
Valencia, CA 91355
Hydraulic Units, Inc. (818) 359-9211
1700 Business Center Drive
Duarte, CA 91010
(601) 981-2811
Vickers, Inc.
5353 Highland Drive
Jackson, MS 39206
National Waterlift Division (616) 384-3400
Pneumo Corporation
2220 Palmer Avenue
Kalamazoo, MI 49001
0
1 93

NADC-88066-60
COMPANIES TELEPHONE NUMBER
Parker Hannifin Corporation (714) 833-3000
Parker Bertea Aerospace Group
Control Systems Division
14300 Alton Parkway
Irvine, CA 92718
Parker Hannifin Corporation (714) 851-3302
Aerospace Hydraulic Division
184 21 Jamboree Blvd
Irvine, CA 92715
Parker Hannifin Corporation (616) 694-9411
Fluid Power Pump Division
Tsego, MI 49078
Rexroth (216) 263-3300
Mobile Hydraulics Division
Wooster, OH 44691
Sterer Engineering & Manufacturing Co. (213) 245-7161
4690 Colorado Blvd
Los Angeles, CA 90039
Sundstrand Corporation (815) 226-6000
Sundstrand Aviation
747 Harrison Avenue
Rockford, IL 61125
Teledyne - Sprague Engineering (213) 327-1610
9300 South Vermont Avenue
Gardena, CA 90247
194

NADC-8806b-bD
APPENDIX .B
TRADE STUDY DATA
Figure Title Page
B-i Ballscrew actuator assembly weight 196
B-2 Ballscrew weight vs. work 197
B-3 Ballscrew motor weight vs. power 198
B-4 Electric motor weight vs. power 199
B-5 Linear actuator weight 200
B-6 Rotary actuator weight, 3 vane 201
B-7 Rotary actuator weight, 4 vane 202
B-8 Metal bellows accumulator, stored energy vs. volume 203
B-9 Metal bellows accumulator, weight and volume vs. 204
swept volume
B-10 AM4AD weight vs. power 205
B-11 Electrical power system weight vs. KVA 206
B-1h inverter weight vs. power 207
B-Ii 270 volt brushless DC motor weight vs. power 208
B-14 Hydraulic vs. electrical power transmission 209
B-15 Heat exchanger weight vs. power 210
B-lb Hydraulic pump/motor weight vs. displacement 211
B-17 Pressure intensifier weight vs. displacement 212
B-18 Direct drive valve weight and volume vs. flow 213
B-1 Vane actuator leakage vs. hinge moment 214
B-20 Valve null leakage vs. no-load rate 215
B-21 Valve leakage vs. age 215
0-22 Baseline pump performance Lharacteristics 216
B-23 Reservoir weight 217
B-24 Average fitting weight per foot 218
B-25 Actuator weight vs. system pressure 219
B-26 Density, MIL-H-83282 hydraulic fluid 220
B-27 Viscosity, MIL-H-83282 hydraulic fluid 220
195

NADC-8806b-60
*INCLUDES BALL SCREW, HOUSING, ROD ENDS,REDUCTION GEARS, CLUTCHES, BRAKES AND
1.0- 20 - LIMIT SWITCHES
0.9-
0.8,
co ~ 15
o 0.7
-J 0.6 C
0.5 ~10
0.4
0.3 REPRESENTATIVE INPUT/OUTPUT, RATIOS FOR
A MOTOR-BALLSCREWS:5 15,000 RPM/2.0 +1.0 IN/SEC
0 .2 -
0.1 0
01 I I I 1 I I I
1 2 3 4 5 6 7 B 9 10 11 12
STALL LOAD, 1000 LB
Figure B-I. Ballscrew actuator *assembly weight
196
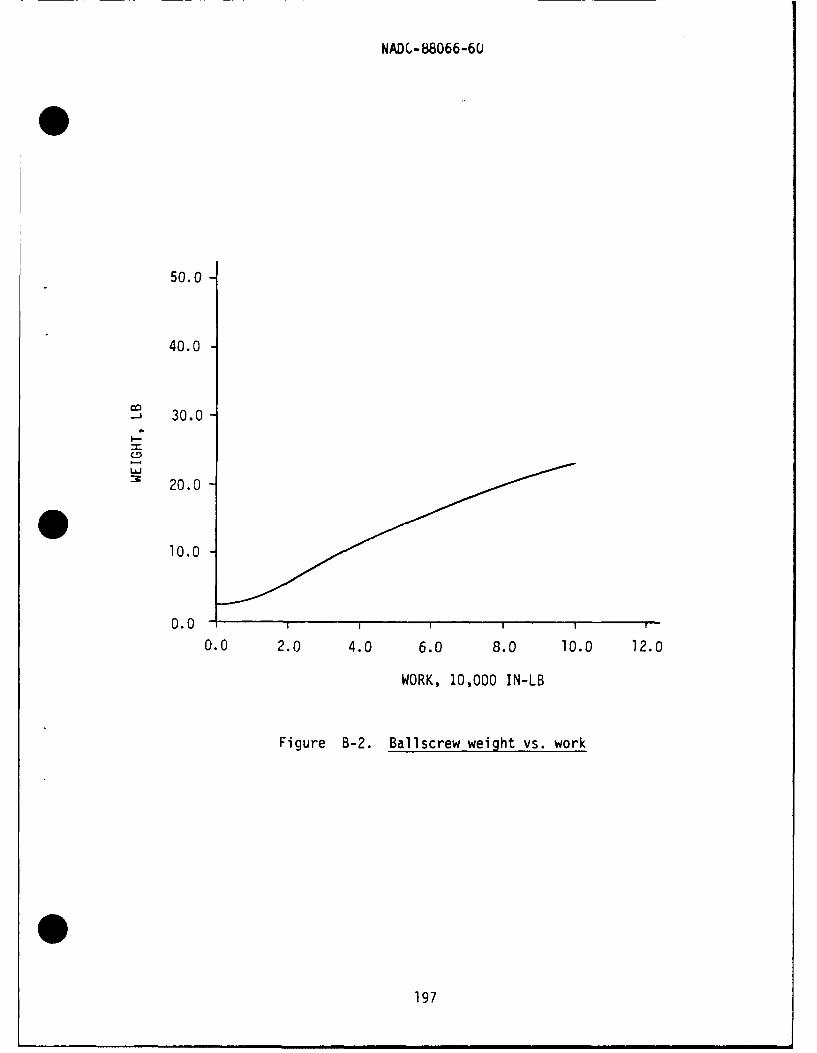
NAD(C-88066-6U
50.0
40.0
-i 30.0
:m 20.0
10.0
0.0 2.0 4.0 6.0 8.0 10.0 12.0
WORK, 10,000 IN-LB
Figure B-2. Baliscrew weight vs. work
197

NADC-8066-6U
10.0
8.0
6.0
4.0 REPRESENTATIVE INPUT/OUTPUTRATIOS FOR BALLSCREW ACTUATOR:
15,000 RPM/2.0 + 1.0 IN/SEC.
2.0
0.0 I I I I I
0.0 4.0 8.0 12.0 16.0 20.0 24.0
HORSEPOWER
Figure B-3. Ballscrew motor weight vs. power
1
198

NADC-88066-60
25-
20
cc 15-.J
i-
10-REPRESENTATIVE INPUT/OUTPUTRATIOS FOR BALLSCREWACTUATOR:15,000 RPM/2.0 +1.0 IN/SEC.
5
SI I I"
13 20 30 40 50 60
POWER, KW
Figure B-4. Electric motor weight vs. power
0i 199

NADC-88U66-60
1000
100
LJ10 NOTES_
110 100 1000 10,000
SWEPT VOLUME, IN3
Figure 8-5. Linear actuator weight
200

NADC-88066-60
WT
NOTES30
* +33 DEG STROKE
* 3 VANE DESIGN O.D. 3.25
* ENGINEERING ESTIMATES
25 LVMAXO.D. 2.90 VOL 120-
20 100-LV MAX- O.D. 2.4 /
5 0-J
I0 9 -1.25"0MAX Lo
60-
L~J I10 2.01....3.25......,
.0 .- MAX
3.5 .D- , -33' 40-
5
20-
STALL HM, 1000 LB-IN
@ 8000 PSI50 75 100 125
0 -- II0 2 4 6 8 10 12 14 16 18 20
SWEPT VOLUME, IN3
Figure B-6. Rotary actuator weight, 3 vane
201

NADC-88066-60
30 NOTES
* +180 STROKE
* 4 VANE
0 ENGINEERING ESTIMATES
25-
LVMAX O.D. 3.25 120
WT
20 - Lv MAX L V AX O.D.2.90 100-SO.D.2.40
VOL-
80S 15- L 1 1
0=I 6. 862/
<P. MAoo X(j 60
21-
STALL HINGE MOMENT, 1000 LB-INI @ 8000 PSI
50 75 100 125
0- i I - I I I I I
0 2 4 6 8 10 12 14 16 18 20
SWEPT VOLUME, IN3
Figure B-7. Rotary actuator weight, 4 vane
202

NADL-88066-60
20
-j
l 15U-
C, HELIUM
CD
L.. 10
5
40 80 120 160 200 240 280
SWEPT VOLUME, IN3
Figure B-8. Metal bellows accumulator, stored energy vs. volume
203

NADC-88066-60
-800
100- O.D., IN.
76 -700
54
80-600
500 CI60-
LL4o -400
40-
300
20- -200
- 100
40 80 120 160 200 240 280
SWEPT VOLUME, IN3
Figure B-9. Metal bellows accumulator, weight and volume vs. swept volume
204

NADC-88U66-60
0
NOTES
* DATA SOURCE: ROCKWELL B-lB
* PADS FOR: 1 GENERATOR200 - 2 PUMPS
1 ATS
150
I-
S100
50
100 200 300 400 500 600 700
OUTPUT POWER, HP
Figure B-10. AMAD weight vs. power
0205

NADC-88066-60
300E
3000
S200
100 WpT9
0-
0 100 200 300
GENERATOR CAPABILITY, KVA
Figure B-11. Electrical power system weight vs. KVA
206

NADC-88066-60
80-
60-EVAPORATIVECOOLING
U-,40-
.20-CL
0
0 50 100
POWER RATING, KW
50 l00 150 200 250 300 350
CURRENT RATING, AMPERES
Figure B-12. Inverter weight vs. power
207

NADC-88066-60
40- 5000 RPM
307
30 70.63 lb/hp
0
0 10 20 30
HORSEPOWER
Figure B-13. 270 volt brushless DC motor weight vs. power
208

NADC-88066-60
NOTES
HYDRAULIC: 8000 PSI SYSTEMFLUID VELOCITY< 25 FT/SEC
ELECTRICAL: 270 VDC SYSTEMINSULATION TEMPERATURE
-10 HYD
EM4 -8
-7
S-6
-5
cc -4
~- -3
10 20 30 40 50 60
POWER, HP
.5
EM
S.
F: ~HYD (CTFE)
HYD (83282)
10 20 30 40 50 60
POWER, HP
Figure B-14. Hydraulic vs. electrical power transmission
209

NADC-88066-60
40 - HYDRAULIC TO FUEL 1
30- 80
6000
30 800
I- 600 z
U 20
400
10-200
0-
0 20 40 60 80 100 120 140 160 180 200
HORSEPOWER
Figure B-15. Heat exchanger weight vs. power
210

NADC-88066-60
25
. 5.0
20-
-J
NOTES
15 DATA SOURCE: LHS PROGRAM
OPERATING PRESSURE: 8000 PSI
10- I I I
0 .5 1.0 1.5 2.0
DISPLACEMENT, IN3/ REV
Figure B-16. Hydraulic pump/motor weight vs. displacement
211

NADC-88066-60
18-
16-52 bi3
14-
S12-
S10-
NOTES
* 12,000 PSI MOTOR/PUMP UNIT
* ESTIMATED WEIGHT DATA6
4
0 .5 1.0
DISPLACEMENT, IN 3/ REV
Figure B-17. Pressure intensifier weight vs. displacement
212

NADC-88066-60
4 NOTES
* 8000 PSI VALVE DESIGN
* DISCONTINUITY DUE TO FLOW FORCE COMPENSATION
* WEIGHT DEPENDANT UPON CHIP SHEAR-OUT, MAXCURRENT, AND ORIFICE SIZE
3 SINGLE SYSTEM VALVE SHOWN; DUAL SYSTEM VALVE1.5 TIMES HEAVIER
14
22 12
10
1- 6
4
0 I I I T0 1 2 3 4
FLOW, GPM
Figure B-18. Direct drive valve weight and volume vs. flow
213

NJADC-88066-60
.16-
_~.12-
Lj .08-
-4
.04-
30 40 50 60 70 80
STALL HINGE MOMENT, 1000 18-IN
Figure B-19. Vane actuator leakage vs. hingemoment
214

NADC-88066-60
300 NOTES* DATA SOURCE: LHS PROGRAM* 8000 PSI VALVES
250 - 0SINGLE STAGE SPOOL/SLEEVE9 MECHANICAL INPUT• INLET FLUID TEMP.: +130OF
200
Lso
50
0 1 2 3 4 5 6 7 8 9 10
VALVE MAX FLOW RATE, GPM
Figure B-20. Valve null leakage vs. no-load rate
z 10
NOTES
* DATA SOURCE: LHS PROGRAM (12 VALVES)6 - 8000 PSI VALVES
* SINGLE STAGE SPOOL/SLEEVE* MECHANICAL INPUTo INLET FLUID TEMP.: +130°F5 DATA FOR NULL POSITION0 AVERAGE LEAKAGE QL = 39.3 CC/MIN @ t = 0
L00 DATA BEYOND 1200 HR IS ESTIMATED
4
C 3
Uj 2
1
00 1 2 3 4 5 6 7 8 9 10
USAGE TIME, 1000 HR
Figure B-21. Valve leakage vs. age
215

NADC-88066-60
NOTES
P RATED 8000 PSI
QRATED = 10 GPM
N RATED = 5900 RPM
QCD = 1.12 GPM1.2-
DISCHARGE PRESSURE
1.0
0.8
L2
0.6 7
0.4 7'
c~ 04- 7~'~CASE DRAIN FLOW
0.2 7'
0 0.2 0.4 0.6 0.8 1.0
DISCHARGE PRESSURE, PDISCHPRATED
Figure B-22. Baseline pump performance characteristics
216

NADC-88U66-60
30
25-
7
20- NOTES
9 SYSTEM PRESSURE: 8000 PSI
/ 0 BOOTSTRAP AIRLESS DESIGN15 - OUTLET PRESSURE: 150 PSI/
•0 INTEGRAL RELIEF VALVE AND RESERVOIRLEVEL GAGING
10 -
5
/
0 200 400 600 800 1000 1200
TOTAL DISPLACEMENT, IN3
Figure B-23. Reservoir weight
217

NADC-88066-6U
0.30- NOTES
* DATA SOURCE: LHS PROGRAM
* TITANIUM FITTINGS
0.25
w 0.20-FUSELAGE AREA
c-
I-
0.15-
UJi
< 0.10"WING AREA
0.05-
-2 -4 -6 - -1 0 -'2 -16
LINE SIZE, DASH NO.
Figure B-24. Average fitting weight per foot
218

NADC-88066-6U
S1.0F ITE
0.7I- 0.9-
-4
ST 0.8P
FIGHTER
0
0.72
L-
L 0.6-
DATA SOURCE: REFERENCES80.5-
2 4 6 810 12
SYTMPRESSURE, 1000 PSI
Figure B-25. Actuator weight vs. system pressure
219

NADC-88066-60
S84-
S80-80000
200
6
-100 _;o 0 50 100 150 200 250 300 35; 0 40
TEMPERATURE, 'F
Figure B-26. Density, MIL-H-83282 hydraulic fluid
-i2
LI
L
400U)
-100 -2 0 10 15 6 5000 30 0
TEMPERATURE, -F
Figure B-27. Viscosity, MIL-H-83282 hydraulic fluid
220

DISTRIBUTION LISTREPORT NO. NADC 88066-60, VOL. I
No. of Conies
Naval Air Development CenterWarminster, PA 1897h-5000
Code 6061 ................................................. 12Code 6013 ................................................. 2Code 8131 ................................................. 2
Naval Air Systems CommandWashington, DC 20361
(AIR-53031B) .............................................. 2(AIR-931) ......................................... ........ 2
Aeronautical Systems DivisionWright-Patterson Air Force Base, OH 45433
(A _FwAL/POOS) .............................................. 1............................................... 1
Defense Technical Information Center (DTIC) ..................... 12Bldg. #5, Cameron StationAlexandria, VA 22314(ATTN: Administrator)
Center for Naval Analyses .......................................4401 Font Ave.P.C. Box 16268Alexandria, VA 22302-0268
..