Accelerate Citrix XenDesktop with Cisco UCS and Cisco UCS Storage Accelerator

© 2013 Cisco and/or its affiliates. All rights reserved. This document is Cisco Public Information. Page 1 of 21
White Paper
Power Efficiency Comparison: Cisco UCS® 5108 Blade Server Chassis and HP BladeSystem®
c7000 Enclosure White Paper
February 2013

© 2013 Cisco and/or its affiliates. All rights reserved. This document is Cisco Public Information. Page 2 of 21
Executive Summary................................................................................................................................................. 3 Main Findings ....................................................................................................................................................... 3
Test Method Overview............................................................................................................................................. 3
Hardware Configuration 1....................................................................................................................................... 4
Results: Hardware Configuration 1........................................................................................................................ 5
Hardware Configuration 2....................................................................................................................................... 7
Results: Hardware Configuration 2........................................................................................................................ 8
Conclusion 10
Appendix A: Solution Firmware and Driver Details ............................................................................................ 11
Appendix B: Test Procedure................................................................................................................................. 12 Hardware and System Firmware ........................................................................................................................ 12 BIOS ................................................................................................................................................................... 12 Operating System ............................................................................................................................................... 13 Benchmark.......................................................................................................................................................... 14 Java Virtual Machine........................................................................................................................................... 15 Power and Temperature Measurements ............................................................................................................ 15
Appendix C: SPECpower_ssj2008 Test Results ................................................................................................. 16

© 2013 Cisco and/or its affiliates. All rights reserved. This document is Cisco Public Information. Page 3 of 21
Executive Summary
Rising energy prices and a drastic increase in computing solution density have made energy management a
critical component of efficient data center operations. IT managers must take into account power utilization and
planning, in addition to, their data center availability, scalability, and resource utilization requirements to cost-
effectively deliver solutions for their business. Cisco is dedicated to the advancement of energy efficiency in the
data center and in computing ecosystems. This document compares the power efficiency of similarly configured
Cisco UCS® 5108 Blade Server Chassis and HP BladeSystem c7000 enclosures.
Cisco compared the power and performance characteristics of equivalently configured Cisco UCS 5108 Blade
Server Chassis and HP BladeSystem c7000 enclosures. The Cisco system was configured with the Cisco UCS
B200 M3 Blade Server, and the HP system was configured with the equivalent HP ProLiant BL460c Gen8
Server Blade. Both systems used the Intel Xeon processor E5-2600 product family. SPECpower_ssj2008, was
run on both configured solutions to evaluate performance, power consumption, and power efficiency.
The results demonstrated that the Cisco UCS 5108 enclosure configured with Cisco UCS B200 M3 blades was
more power efficient and consumed less power than the HP BladeSystem c7000 configured with HP ProLiant
BL460c Gen8 blades.
Main Findings ● Efficiency ◦ The Cisco UCS 5108 enclosure configured with Cisco UCS B200 M3 blades achieved a 6.3 percent
higher performance-to-power ratio than the HP BladeSystem c7000 with HP ProLiant BL460c blades,
using with similarly configured hardware, BIOS, and OS settings. ◦ At a 70 percent target load, the Cisco UCS blade solution consumed 6.5 percent less power than the
HP ProLiant blade solution.
● Power ◦ At the maximum target load, the Cisco UCS blade solution consumed 192 watts (W), or 7.2 percent
less power, than the equivalently configured HP BladeSystem solution. ◦ The Cisco UCS blade solution consumed 167 watts, or 17.4 percent less power, while idle than the
equivalently configured HP BladeSystem solution: a difference equivalent to the power consumed by
three idle HP Proliant BL460c Gen8 blades. ◦ Including the power consumed by a pair of redundant fabric interconnects, the Cisco UCS blade
solution consumes less power than an equivalent HP BladeSystem solution (see Figure 6 later in this
document).
Test Method Overview
To make relevant power consumption and efficiency comparisons, all solution variables that affect power
consumption and performance must be equivalent. The Cisco UCS 5108 and HP BladeSystem c7000 blade
solutions were similarly configured. The BIOS parameters affecting performance and power consumption were
optimized and set equivalently for each blade solution (see Appendix B for detailed BIOS parameter
configuration information). The same benchmark workload was run on each blade solution operating in the same
environmental conditions.

© 2013 Cisco and/or its affiliates. All rights reserved. This document is Cisco Public Information. Page 4 of 21
A benchmark provides a basis for comparison between equivalent computing solution offerings.
SPECpower_ssj2008 is a benchmark developed by the Standard Performance Evaluation Corporation (SPEC),
a nonprofit group of computer vendors, system integrators, universities, research organizations, publishers, and
consultants. The benchmark is designed to provide a view of server system power consumption while the
system runs Java server applications. The results from each SPECpower_ssj2008 benchmark are listed in
Appendix C. These results provide the data that supports the analysis in this report.
Hardware Configuration 1
The first blade solution evaluated was a single enclosure configured with eight blades. The Cisco and HP blade
enclosures were configured similarly, with comparable management hardware components (Table 1). To
measure power consumption during benchmark execution, a power analyzer was connected to the power supply
input of each blade enclosure.
Table 1. Blade Solution (Configuration 1)
Enclosure Cisco UCS 5108 HP BladeSystem c7000
Blade Slots Available/Installed 8/8 16/8
Enclosure Management Module UCS 6248UP [2]1 Onboard Administrator Module [2]
Internal IO Module UCS 2204XP Fabric Extender [2] VC FlexFabric 10Gb Module [2]
Power Supply 2500W Platinum Rated [4] 2400W Platinum Rated [4]
Fan Slots Available/Installed 8/8 10/8
Blade Model B200 M3 BL460c Gen8
Form Factor Half Height Half Height
Processor Intel Xeon E5-2660 [2] Intel Xeon E5-2660 [2]
Physical/Logical Cores 16/32 16/32
Memory 4GB DDR3 RDIMM PC3L-12800 [8] 4GB DDR3 RDIMM PC3L-12800 [8]
Hard Disk Drive 300GB 10K 6Gb, RAID 0 [1] 300GB 10K 6Gb, RAID 0 [1]
Network VIC 1240 10Gb 4-port Adapter [1] FlexFabric 10Gb 2-port Adapter [1]
Storage Controller LSI Logic SAS 2004 [1] Smart Array P220i [1]
1. The Cisco UCS 6248UP 48-Port Fabric Interconnect provides the management and communication backbone for the Cisco UCS B-Series Blade Servers and C-Series Rack Servers. A single redundant pair of fabric interconnects supports up to 20 blade enclosures in a single highly available management domain. In the power efficiency comparison for this configuration, the power consumed by the redundant pair of fabric interconnects was not included in the measurement.
The latest available system firmware at the time of testing was downloaded and installed; see Appendix A for
additional details.
Microsoft Windows Server 2008 R2 Enterprise with Service Pack 1 (SP1) was installed on each server. After
installation, the update utility was run, and all available updates at the time of testing were installed. The same
operating system power management settings were used for both solutions; see the Operating System section
of the test procedure in Appendix B for additional details.
Using the Cisco UCS service profile feature, all Cisco UCS blade BIOS parameters were updated
simultaneously using a common BIOS policy. Each BIOS parameter was manually duplicated on the HP blade
servers using the HP ROM-Based Setup Utility; see the BIOS section of the test procedure in Appendix B.
The blade enclosure power management policy was set to grid redundant for each solution. Only the enclosure
power supplies were connected to the power meter. External networking components were not included in the
power measurements.

© 2013 Cisco and/or its affiliates. All rights reserved. This document is Cisco Public Information. Page 5 of 21
Results: Hardware Configuration 1
At maximum target load, the Cisco UCS blade enclosure consumed 192W, or 7.2 percent less power than the
equivalent HP blade solution. In the active-idle state, the Cisco UCS blade enclosure consumed 167W, or 17.4
percent less power than the HP blade solution.
The Cisco UCS blade solution consumed less power while providing performance comparable to that of the HP
blade solution. Thus, the Cisco UCS blade solution was more efficient, with a 6.3 percent greater performance-
to-power ratio than the HP blade solution (Figure 1).
Figure 1. Blade Solution Power Efficiency (Configuration 1)
The benchmark computes power efficiency by dividing the number of Java server application operations
performed by the average power consumed at each target interval. The performance per watt for each interval is
shown in Figure 2. At each target load, the Cisco blade solution demonstrated a power efficiency advantage
over the comparable HP blade solution. The Cisco blade solution advantage was 4.1 to 8.0 percent better
performance per watt across all target loads.

© 2013 Cisco and/or its affiliates. All rights reserved. This document is Cisco Public Information. Page 6 of 21
Figure 2. Target Load Power Efficiency (Configuration 1)
The methods used to estimate and plan power requirements vary widely. A general rule used by many IT
professional is to size the solution based up power consumption at a specified target workload. The typical
target workloads range from 50 to 70 percent utilization. For this comparison, power consumption at a 70
percent SPECpower_ssj2008 target load was plotted as shown in Figure 3. At this reference point, the Cisco
UCS blade solution consumes 127W, or 6.5 percent less power than the comparable HP blade solution.
Another efficiency metric used by IT professionals is the amount of power consumed while the system is idle.
The SPECpower_ssj2008 benchmark includes an active-idle measurement. The average power consumed by
the Cisco blade solution was 167W, or 17.4 percent less than the equivalent HP blade solution, as shown in
Figure 4.
Figure 3. Blade Solution Power Efficiency at 70 Percent Target Load (Configuration 1)
SPEC Fair Use Rule disclosure condition: At 70 percent target load Cisco UCS B200 M3 Blade Server achieved 7,902,138 ssj_ops using 1824W, and HP ProLiant BL460c Gen8 blade solution achieved 8,119,073 ssj_ops using 1951W.

© 2013 Cisco and/or its affiliates. All rights reserved. This document is Cisco Public Information. Page 7 of 21
Figure 4. Blade Solution Active-Idle Power (Configuration 1)
Hardware Configuration 2
Blade solutions can be extremely efficient. For that reason, enterprise customers deploy multiple blade
enclosures, to achieve the best power density and gain management advantages compared to traditional rack
servers.
Configuration of a large-scale hardware solution, consisting of hundreds of blade servers, to measure power
efficiency is not practical. Instead, a base hardware unit is used to scale and extrapolate power efficiency. The
logical base unit is a fully configured blade enclosure. The HP BladeSystem c7000 supports 16 blades per
enclosure. Thus, a 16-blade solution was used as the base hardware unit (Table 2). The base hardware unit is
duplicated for each 16-blade increment.
Table 2. Base Hardware Unit (Configuration 2)
Enclosure 2X Cisco UCS 51081 1X HP BladeSystem c7000
Blade Slots Available/Installed 2X 8/8 16/16
Enclosure Management Module UCS 6248UP [2]2 Onboard Administrator Module [2]
Internal IO Module 2X UCS 2204XP Fabric Extender [2] VC FlexFabric 10Gb Module [2]
Power Supply 2X 2500W Platinum Rated [4] 2400W Platinum Rated [6]
Fan Slots Available/Installed 2X 8/8 10/10
Blade Model B200 M3 BL460c Gen8
Form Factor Half Height Half Height
Processor Intel Xeon E5-2660 [2] Intel Xeon E5-2660 [2]
Physical/Logical Cores 16/32 16/32
Memory 8GB DDR3 RDIMM PC3L-10600 [4] 8GB DDR3 RDIMM PC3L-10600 [4]
Hard Disk Drive 300GB 10K 6Gb, RAID 0 [1] 300GB 10K 6Gb, RAID 0 [1]
Network VIC 1240 10Gb 4-port Adapter [1] FlexFabric 10Gb 2-port Adapter [1]
Storage Controller LSI Logic SAS 2004 [1] Smart Array P220i [1]
1. Two Cisco UCS 5108 blade enclosures are required to achieve the base hardware unit. 2. The Cisco UCS 6248UP 48-Port Fabric Interconnect is a core part of Cisco UCS. Typically deployed in redundant pairs, the
Cisco UCS 6248UP provides uniform access to both network and storage. The Cisco UCS fabric extender architecture

© 2013 Cisco and/or its affiliates. All rights reserved. This document is Cisco Public Information. Page 8 of 21
provides management for 20 blade enclosures in a single unified system without additional complexity, thus eliminating dedicated chassis management and blade switches and reducing the number of cables required.
The procedures from the previous analyses were used to measure performance and power consumption with
one exception: the power consumed by the pair of redundant Cisco UCS 6248UP fabric interconnects was
included during execution of the SPECpower_ssj2008 benchmark.
Results: Hardware Configuration 2
Beginning with the base hardware unit, the total power consumption was compared for each 16-blade increment.
A single pair of fabric interconnects can support up to 20 blade enclosures, or 160 blades, so the power
consumed by the redundant pair of interconnects was added once to each 16-blade increment for comparison.
For example, the power consumed by an 80-blade solution was calculated using 10 Cisco UCS 5108 enclosures
and 2 Cisco UCS 6248UP fabric interconnects, and using 5 HP BladeSystem c7000 enclosures (Figure 5). A
single Cisco UCS enclosure with 8 blades consumed 1991W. With the same target load, the power consumed
by the redundant pair of fabric interconnects was 530W (see Appendix C). With the same target load, a single
HP blade enclosure consumed 4378W. The calculations for projecting power consumption for an 80-blade
solution were 10 x 1991W + 2 x 265W, or approximately 20.4 kW for the Cisco UCS solution; and 5 x 4378W, or
approximately 21.8 kW for the HP BladeSystem solution.
Figure 5. Example of Total Power Comparison Using an 80-Blade Solution

© 2013 Cisco and/or its affiliates. All rights reserved. This document is Cisco Public Information. Page 9 of 21
With the first increment, the Cisco UCS solution consumes 129W more power than the equivalent HP
BladeSystem solution. With the next increment, the Cisco solution draws 267W less power than the equivalent
HP BladeSystem solution. The unified fabric power savings advantage becomes more apparent as the number
of blade enclosures increases, because for every HP blade enclosure added to the system, duplicate onboard
administrators and virtual connect switches are needed. As the number of blades increase, the power savings
decisively favors the Cisco UCS blade solution. The projected power savings at 160 blades was greater than 3.4
kW; see Figure 6 and Figure 7, which show the power savings across the entire range.
Using 160 Cisco blades instead of HP ProLiant blades, the end user can save more than 3.4 kW of power. The
power savings is nearly equivalent to turning off an HP c7000 BladeSystem fully configured with HP ProLiant
blades. The projected power savings is a conservative estimate that does not include the additional power
savings from data center infrastructure. Additional infrastructure power is required for distribution (transformer
and conversion losses) and cooling (mechanical cooling). Assuming a facility power usage efficiency (PUE) rate
of 1.6, the projected total power savings is 5.5 kW.
Figure 6. Projected Cisco UCS Power Savings
© 2013 Cisco and/or its affiliates. All rights reserved. This document is Cisco Public Information. Page 10 of 21
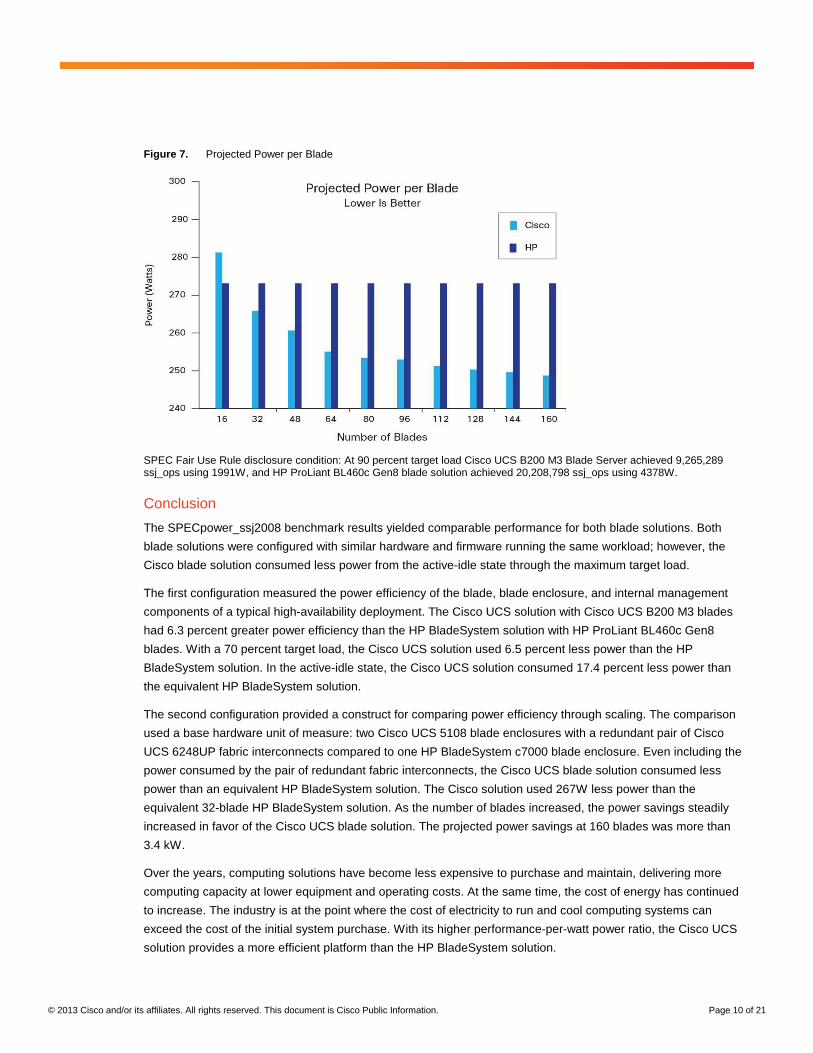
Figure 7. Projected Power per Blade
SPEC Fair Use Rule disclosure condition: At 90 percent target load Cisco UCS B200 M3 Blade Server achieved 9,265,289 ssj_ops using 1991W, and HP ProLiant BL460c Gen8 blade solution achieved 20,208,798 ssj_ops using 4378W.
Conclusion
The SPECpower_ssj2008 benchmark results yielded comparable performance for both blade solutions. Both
blade solutions were configured with similar hardware and firmware running the same workload; however, the
Cisco blade solution consumed less power from the active-idle state through the maximum target load.
The first configuration measured the power efficiency of the blade, blade enclosure, and internal management
components of a typical high-availability deployment. The Cisco UCS solution with Cisco UCS B200 M3 blades
had 6.3 percent greater power efficiency than the HP BladeSystem solution with HP ProLiant BL460c Gen8
blades. With a 70 percent target load, the Cisco UCS solution used 6.5 percent less power than the HP
BladeSystem solution. In the active-idle state, the Cisco UCS solution consumed 17.4 percent less power than
the equivalent HP BladeSystem solution.
The second configuration provided a construct for comparing power efficiency through scaling. The comparison
used a base hardware unit of measure: two Cisco UCS 5108 blade enclosures with a redundant pair of Cisco
UCS 6248UP fabric interconnects compared to one HP BladeSystem c7000 blade enclosure. Even including the
power consumed by the pair of redundant fabric interconnects, the Cisco UCS blade solution consumed less
power than an equivalent HP BladeSystem solution. The Cisco solution used 267W less power than the
equivalent 32-blade HP BladeSystem solution. As the number of blades increased, the power savings steadily
increased in favor of the Cisco UCS blade solution. The projected power savings at 160 blades was more than
3.4 kW.
Over the years, computing solutions have become less expensive to purchase and maintain, delivering more
computing capacity at lower equipment and operating costs. At the same time, the cost of energy has continued
to increase. The industry is at the point where the cost of electricity to run and cool computing systems can
exceed the cost of the initial system purchase. With its higher performance-per-watt power ratio, the Cisco UCS
solution provides a more efficient platform than the HP BladeSystem solution.

© 2013 Cisco and/or its affiliates. All rights reserved. This document is Cisco Public Information. Page 11 of 21
Appendix A: Solution Firmware and Driver Details
Table 3 provides firmware and driver details for the Cisco UCS 5108 Blade Server and HP BladeSystem c7000
solutions.
Table 3. Enclosure and Blade Solution Firmware and Driver Configurations
Component Cisco Hewlett Packard
Enclosure Model UCS 5108 Blade System c7000
Enclosure Management Firmware 5.0(3)N2(2.04b) 3.70
Internal IO Module Firmware 2.0(4b) 3.70
Blade Model B200 M3 BL 460c Gen8
System BIOS B200M3.2.0.4a.0.080920121557 I31 08/20/2012
Integrated Management Controller Firmware
2.0(4b) 1.10
Network Adapter Firmware 2.0(4b) 4.1.450.5
Storage Controller Firmware 20.10.1-0061 3.22
Power Mangement Controller Firware N/A 3.0
Management Controller Driver N/A 3.4.0.0
Network Adapter Driver 2.1.0.10 4.0.449.0
Storage Controller Driver 5.1.112.64 6.22.0.64
Display Adapter Driver 6.1.7600.16385 1.2.1.0
© 2013 Cisco and/or its affiliates. All rights reserved. This document is Cisco Public Information. Page 12 of 21
Appendix B: Test Procedure
This appendix describes the test procedure used to compare the Cisco UCS 5108 Blade Server and HP
BladeSystem c7000 solutions.
Hardware and System Firmware Each blade solution was configured similarly with comparable hardware components; see Tables 1 and 2 earlier
in this document for hardware configuration details. The latest available system firmware at the time of testing
was downloaded and installed; see Appendix A for details.
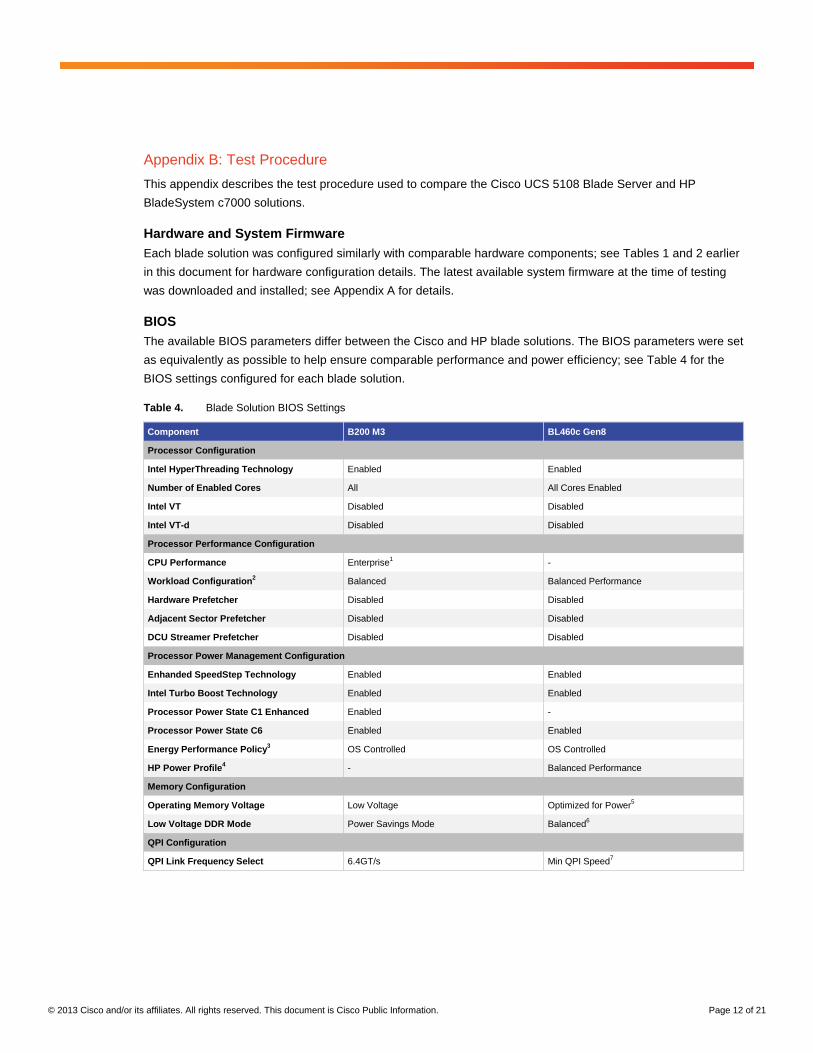
BIOS The available BIOS parameters differ between the Cisco and HP blade solutions. The BIOS parameters were set
as equivalently as possible to help ensure comparable performance and power efficiency; see Table 4 for the
BIOS settings configured for each blade solution.
Table 4. Blade Solution BIOS Settings
Component B200 M3 BL460c Gen8
Processor Configuration
Intel HyperThreading Technology Enabled Enabled
Number of Enabled Cores All All Cores Enabled
Intel VT Disabled Disabled
Intel VT-d Disabled Disabled
Processor Performance Configuration
CPU Performance Enterprise1 -
Workload Configuration2 Balanced Balanced Performance
Hardware Prefetcher Disabled Disabled
Adjacent Sector Prefetcher Disabled Disabled
DCU Streamer Prefetcher Disabled Disabled
Processor Power Management Configuration
Enhanded SpeedStep Technology Enabled Enabled
Intel Turbo Boost Technology Enabled Enabled
Processor Power State C1 Enhanced Enabled -
Processor Power State C6 Enabled Enabled
Energy Performance Policy3 OS Controlled OS Controlled
HP Power Profile4 - Balanced Performance
Memory Configuration
Operating Memory Voltage Low Voltage Optimized for Power5
Low Voltage DDR Mode Power Savings Mode Balanced6
QPI Configuration
QPI Link Frequency Select 6.4GT/s Min QPI Speed7

© 2013 Cisco and/or its affiliates. All rights reserved. This document is Cisco Public Information. Page 13 of 21
Component B200 M3 BL460c Gen8
USB Configuration8
USB Control - USB Enabled
USB Boot Support - Enabled
Removeable Flash Media Boot Sequence - External DriveKey First
1. Selecting Enterprise disables all prefetchers and data reuse: for example, the hardware prefetcher, adjacent cache line prefetcher, and data cache unit (DCU) prefetcher.
2. The equivalent HP BIOS parameter is HP Power Regulator, which uses the operating system power management policy. The operating system used, Microsoft Window Server 2008, ignores this parameter regardless of its setting.
3. The equivalent HP BIOS parameter is Energy/Performance Bias. Balanced Performance is the default setting; it provides the best balance of power efficiency and performance and is recommended by HP for most environments.
4. Although the parameter was set to Balanced Power and Performance, it is automatically set to Custom when individual power settings are modified, as in this case.
5. The equivalent HP BIOS parameter is DIMM Voltage Preference. Optimized for Power Low Voltage DIMMs run at 1.35V, even if this voltage requires memory to run at a lower frequency.
6. The equivalent HP BIOS parameter is Memory Power Savings Mode. Balanced is the default setting for optimal power efficiency.
7. The minimum Intel QuickPath Interconnect (QPI) Link Frequency rate supported by the Intel Xeon processor E5-2600 product family is 6.4 gigatransfers per second (GTps).
8. All USB ports are enabled by default on the Cisco UCS B200 M3.
For a complete list of available BIOS settings for the Cisco UCS B200 M3 and HP BL460c Gen8, see the
following links:
● Cisco UCS Manager GUI Configuration Guide, Release 2.0 - Configuring BIOS Settings
● HP ROM-Based Setup Utility User Guide (HP Part Number: 347563-406)
Operating System The same Microsoft Windows Server 2008 R2 Enterprise with Service Pack 1 image was installed on each blade
server. After the operating system was installed, the update utility was used to install all recommended and
optional updates available at the time of testing.
The same operating system power management settings were used on both blade solutions. The power
management plan was set to Balanced. The specific settings are shown in Figure 8.

© 2013 Cisco and/or its affiliates. All rights reserved. This document is Cisco Public Information. Page 14 of 21
Figure 8. Operating System Power Management Options
To improve Java performance, the local security policy was modified to enable the Administrator account to lock
pages in memory. The security setting determines which accounts can use a process to keep data in physical
memory, which prevents the system from paging the data to virtual memory on disk.
Benchmark The latest SPECpower_ssj2008 version, Version 1.12, was installed on each blade and on the control system.
The SPECpower_ssj2008 benchmark was developed by the Standard Performance Evaluation Corporation
(SPEC), a nonprofit group of computer vendors, system integrators, universities, research organizations,
publishers, and consultants. It was designed to provide a view of a server system's power consumption running
Java server applications.
SPECpower_ssj2008 consists of three main software components:
● Server-Side Java (SSJ)-Workload ◦ SSJ-Workload is a Java program designed to exercise the CPUs, caches, memory, scalability of
shared-memory processors, Java Virtual Machine (JVM) implementations, just-in-time (JIT) compilers,
garbage collection, and other aspects of the operating system of the system under test (SUT). ◦ For more information about SSJ, see http://www.spec.org/power/docs/SPECpower_ssj2008-
Design_ssj.pdf.
● Power and Temperature Daemon (PTDaemon) ◦ PTDaemon offloads the work of controlling a power analyzer or temperature sensor during
measurement intervals to a system other than the SUT. ◦ For more information about PTDaemon, see http://www.spec.org/power/docs/SPEC-
PTDaemon_Design.pdf.

© 2013 Cisco and/or its affiliates. All rights reserved. This document is Cisco Public Information. Page 15 of 21
● Control and Collect System (CCS), including Visual Activity Monitor (VAM) ◦ CCS is a multithreaded Java application that controls and enables the coordinated collection of data
from multiple data sources such as a workload running on a separate SUT, a power analyzer, and a
temperature sensor. ◦ VAM is a software package designed to display activity from one, two, or three SUTs simultaneously in
combination with the SPECpower_ssj2008 benchmark. ◦ For more information about CCS and VAM, see http://www.spec.org/power/docs/SPECpower_ssj2008-
Design_ccs.pdf.
All results discussed in this document are from compliant runs. Although the tests have not been submitted to
SPEC for review, Cisco can disclose the results for the purpose of this study. The comparisons comply with the
required conditions outlined in the SPEC Fair Use Rule for SPECpower_ssj2008. All details required to
reproduce these results are listed in the appendixes. The files from each complaint run referenced in this
document are included in Appendix C.
Java Virtual Machine The same JVM version was installed on each blade and the control system. The JVM version installed was IBM
J9 Virtual Machine (VM): Build 2.6, Java Run Environment (JRE) 1.7.0, Microsoft Windows Server 2008 R2
amd64-64 20120322_106209, JIT enabled, and ahead-of-time (AOT) compilation enabled.
The same JVM command-line options were used on all blades:
-Xgcpolicy:gencon -Xaggressive -Xcompressedrefs -Xmx1500m -Xms1500m -Xmn1100m
-XlockReservation -Xnoloa -XtlhPrefetch -Xlp -Xconcurrentlevel0
A complete list of JVM command-line options and their functions can be found in the IBM user guides for Java
V7 on Microsoft Windows.
Each blade was configured with two Intel Xeon processors E5-2660 CPUs, eight cores per socket, and two
threads (logical processors) per core. Eight JVM instances were started on each blade. Each JVM instance was
bound to four logical processors. The following CPU affinity commands were used:
start /high /affinity [F,F0,F00,F000,F0000,F00000,F000000,F0000000]
Power and Temperature Measurements Yokogawa WT210 Digital Power Meters were used to collect power measurements. The Yokogawa WT210 units
used were within calibration limits.
The enclosures were mounted in the same rack. The inlet temperature was measured at the front of each blade
enclosure during testing. A Digi International Watchport/H probe was used to collect temperature and humidity
data. The inlet temperatures recorded were approximately 24.5°C and varied less than 0.5°C between each test.

© 2013 Cisco and/or its affiliates. All rights reserved. This document is Cisco Public Information. Page 16 of 21
Appendix C: SPECpower_ssj2008 Test Results
Figures 9 through 13 provide SPECpower_ssj2008 test results for the Cisco UCS 5108 Blade Server and HP
BladeSystem c7000 solutions.
Figure 9. SPECpower_ssj2008 Results for Cisco UCS B200 M3 (Configuration 1)

© 2013 Cisco and/or its affiliates. All rights reserved. This document is Cisco Public Information. Page 17 of 21
Figure 10. SPECpower_ssj2008 Results for HP BL460c Gen8 (Configuration 1)

© 2013 Cisco and/or its affiliates. All rights reserved. This document is Cisco Public Information. Page 18 of 21
Figure 11. SPECpower_ssj2008 Results for Cisco UCS B200 M3 (Configuration 2)

© 2013 Cisco and/or its affiliates. All rights reserved. This document is Cisco Public Information. Page 19 of 21
Figure 12. SPECpower_ssj2008 Results for Cisco UCS B200 M3 with Fabric Interconnects (Configuration 2)

© 2013 Cisco and/or its affiliates. All rights reserved. This document is Cisco Public Information. Page 20 of 21
Figure 13. SPECpower_ssj2008 Results for HP BL460c Gen8 (Configuration 2)
© 2013 Cisco and/or its affiliates. All rights reserved. This document is Cisco Public Information. Page 21 of 21
Printed in USA C11-727795-01 05/13