![[Jshopen] Phase2 Final](https://static.fdocuments.in/doc/165x107/577d259b1a28ab4e1e9f3ae3/jshopen-phase2-final.jpg)
Power Cavern Design & Back Analysis Using Phase2 · PDF filePower Cavern Design & Back...
7
Power Cavern Design & Back Analysis Using Phase 2 A Look at the Ingula Power Cavern Project This summary is based on the published paper, The Use of Geotechnical Instrumen- tation to Monitor Ground Displacements During Excavation of the Ingula Power Caverns for Model Calibration and Design Verification Purposes, authors M. Kellaway, D. Taylor, and G.J. Keyter of Braamhoek Consutants Joint Venture, published in The Southern African Institute of Mining and Metallurgy, South African Tunnelling 2012, Lessons Learnt on Major Projects. Geomechanics software used worldwide by geotechnical engineers software tools for rock and soil Article prepared for RocNews Fall 2013
Transcript of Power Cavern Design & Back Analysis Using Phase2 · PDF filePower Cavern Design & Back...
Power Cavern Design &Back Analysis Using Phase2
A Look at the Ingula Power Cavern Project
This summary is based on the published
paper, The Use of Geotechnical Instrumen-
tation to Monitor Ground Displacements
During Excavation of the Ingula Power
Caverns for Model Calibration and Design
Verification Purposes, authors M. Kellaway,
D. Taylor, and G.J. Keyter of Braamhoek
Consutants Joint Venture, published in
The Southern African Institute of Mining
and Metallurgy, South African Tunnelling
2012, Lessons Learnt on Major Projects.
Geomechanics
software used
worldwide by
geotechnical
engineers
software tools for rock and soil
Article prepared for RocNews Fall 2013
Power Cavern Design & Back Analysis using Phase2
A Look at the Ingula Power Cavern Project
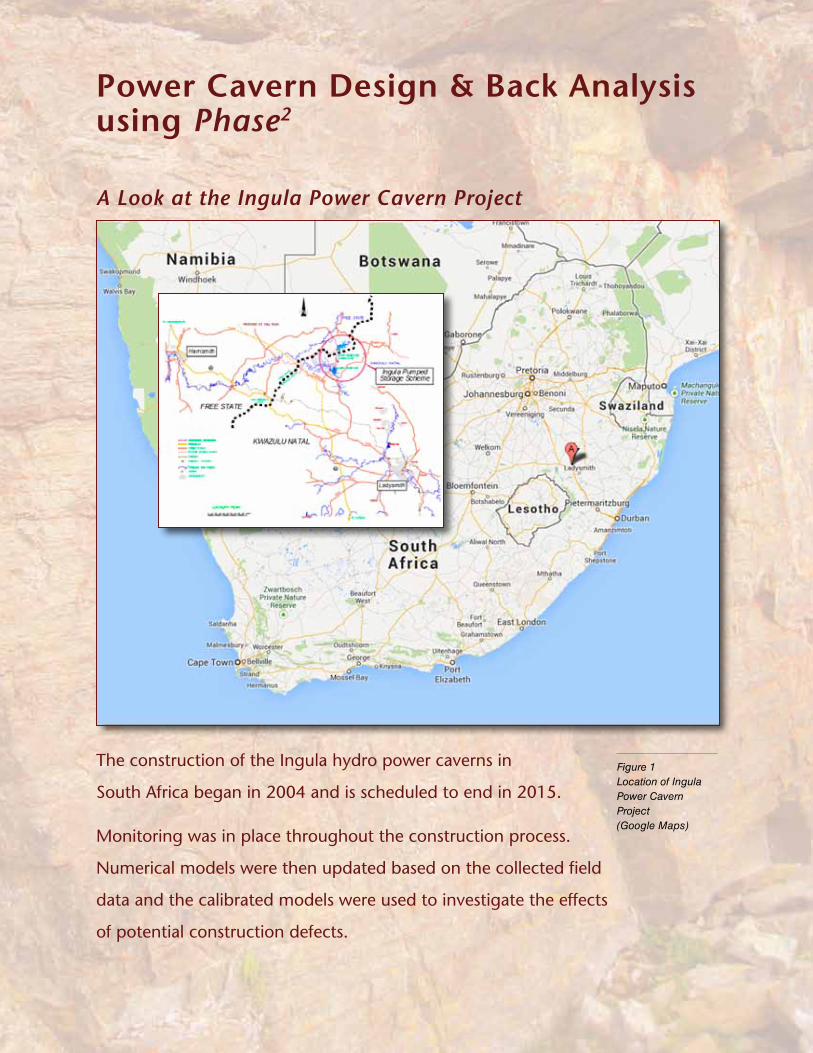
The construction of the Ingula hydro power caverns in
South Africa began in 2004 and is scheduled to end in 2015.
Monitoring was in place throughout the construction process.
Numerical models were then updated based on the collected field
data and the calibrated models were used to investigate the effects
of potential construction defects.
Figure 1Location of Ingula Power CavernProject(Google Maps)
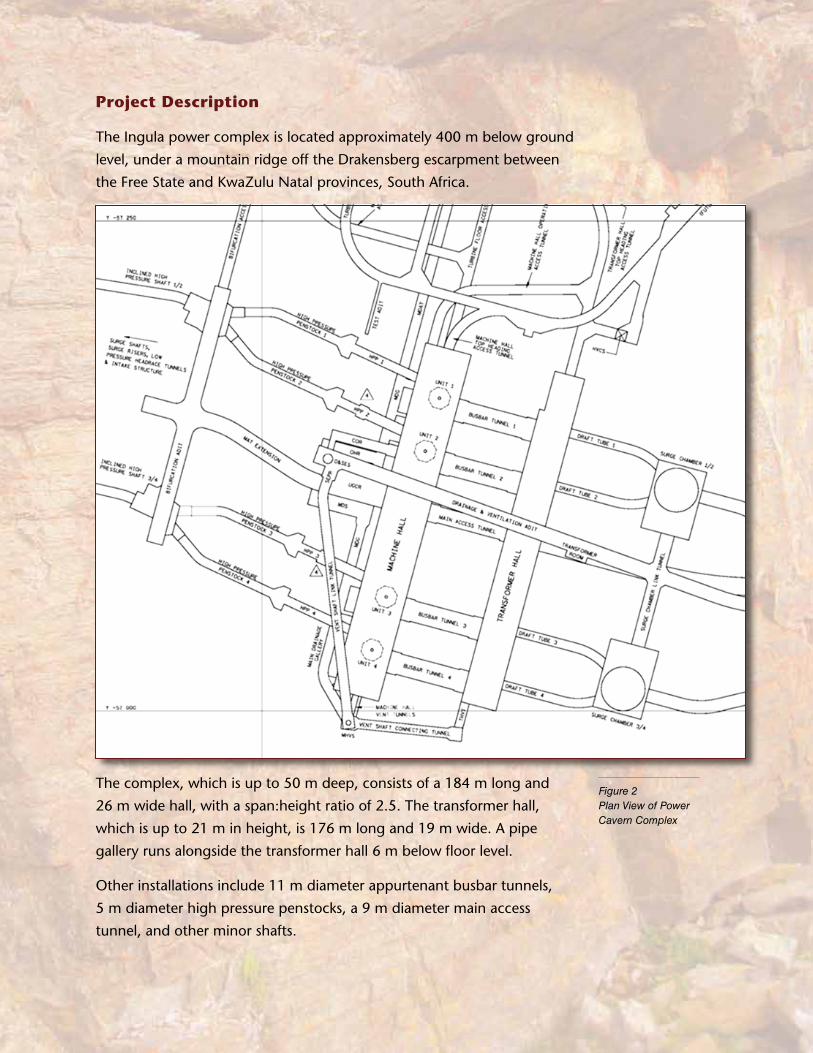
Project Description
The Ingula power complex is located approximately 400 m below ground
level, under a mountain ridge off the Drakensberg escarpment between
the Free State and KwaZulu Natal provinces, South Africa.
The complex, which is up to 50 m deep, consists of a 184 m long and
26 m wide hall, with a span:height ratio of 2.5. The transformer hall,
which is up to 21 m in height, is 176 m long and 19 m wide. A pipe
gallery runs alongside the transformer hall 6 m below floor level.
Other installations include 11 m diameter appurtenant busbar tunnels,
5 m diameter high pressure penstocks, a 9 m diameter main access
tunnel, and other minor shafts.
Figure 2Plan View of Power Cavern Complex
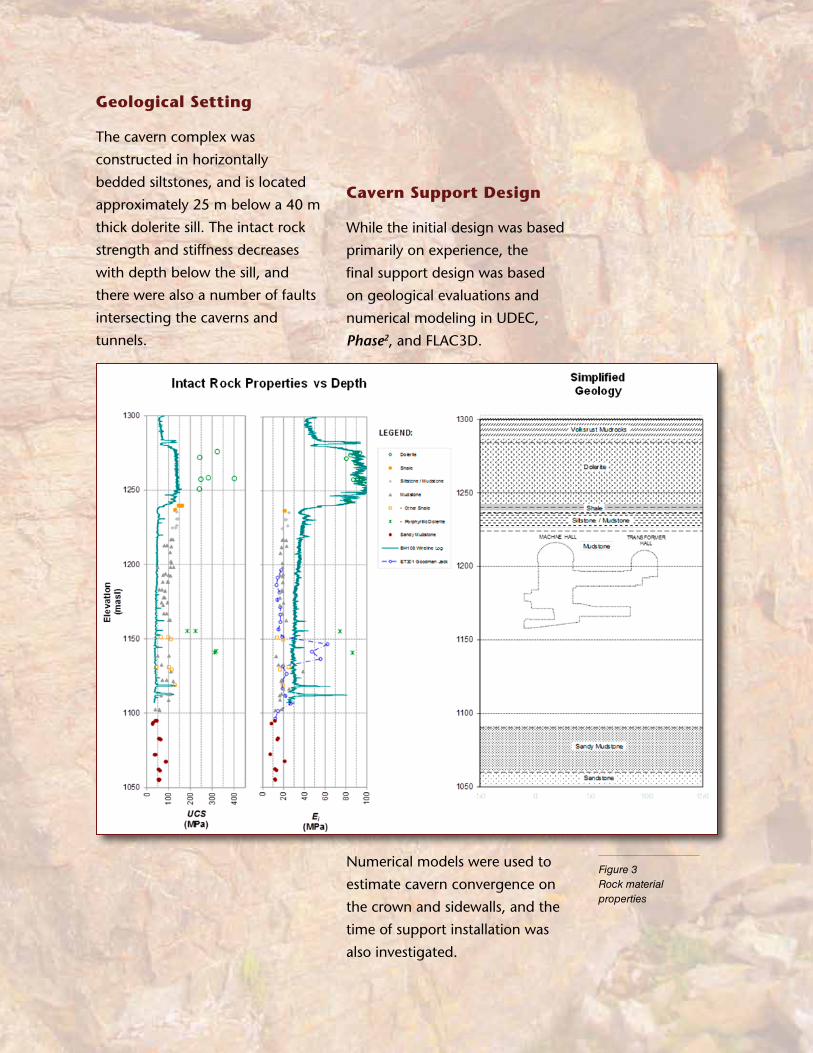
Geological Setting
The cavern complex was
constructed in horizontally
bedded siltstones, and is located
approximately 25 m below a 40 m
thick dolerite sill. The intact rock
strength and stiffness decreases
with depth below the sill, and
there were also a number of faults
intersecting the caverns and
tunnels.
Cavern Support Design
While the initial design was based
primarily on experience, the
final support design was based
on geological evaluations and
numerical modeling in UDEC,
Phase2, and FLAC3D.
Numerical models were used to
estimate cavern convergence on
the crown and sidewalls, and the
time of support installation was
also investigated.
Figure 3Rock material properties
Comparison of Phase2 Results to Cavern Measurements
Instrumentation was placed in
areas of concern, based on the
initial modeling results. Compared
to the numerical results, the
following observations were made
with regard to displacements:
n Measured
displacements
were generally
lower than
expected
n Sidewall
displacements
were generally
larger than crown
displacements
n The rate of
displacement
slowed more
quickly than
anticipated as
the excavation
progressed
Back-Analysis and Remodeling in Phase2
Phase2 models were constructed
in the design phase of the Ingula
project. These models were fine-
tuned towards the end of the
excavation of the main caverns
for three primary reasons. Firstly,
Phase2 models were updated to
reflect the actual geology.
In particular, the dyke with sheared
contacts was incorporated into
the model. Secondly, the staging
was revised to reflect the actual
sequence of excavation and
support installation.
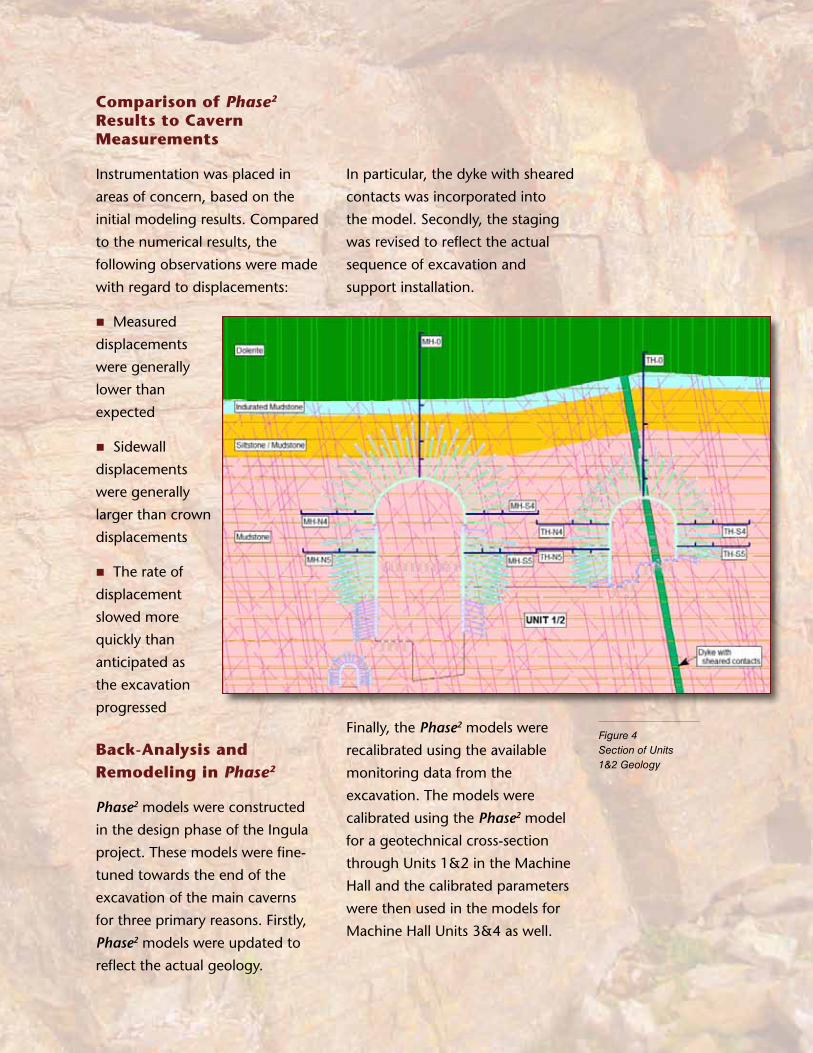
Finally, the Phase2 models were
recalibrated using the available
monitoring data from the
excavation. The models were
calibrated using the Phase2 model
for a geotechnical cross-section
through Units 1&2 in the Machine
Hall and the calibrated parameters
were then used in the models for
Machine Hall Units 3&4 as well.
Figure 4Section of Units 1&2 Geology
One particularly interesting
revision to the Phase2 model was
the assumption that there was
the same percentage of rock
bridges in the strike direction of
bedding planes and joints as in
the dip direction. This adjustment
to the bedding and joint strength
balanced the effect of infinitely
long bedding planes and joints
in the strike direction in Phase2.
Prior to the adjustment, large
rock wedges were formed in
the crown and sidewalls of the
model. After revision, rock wedge
were more typical sizes.
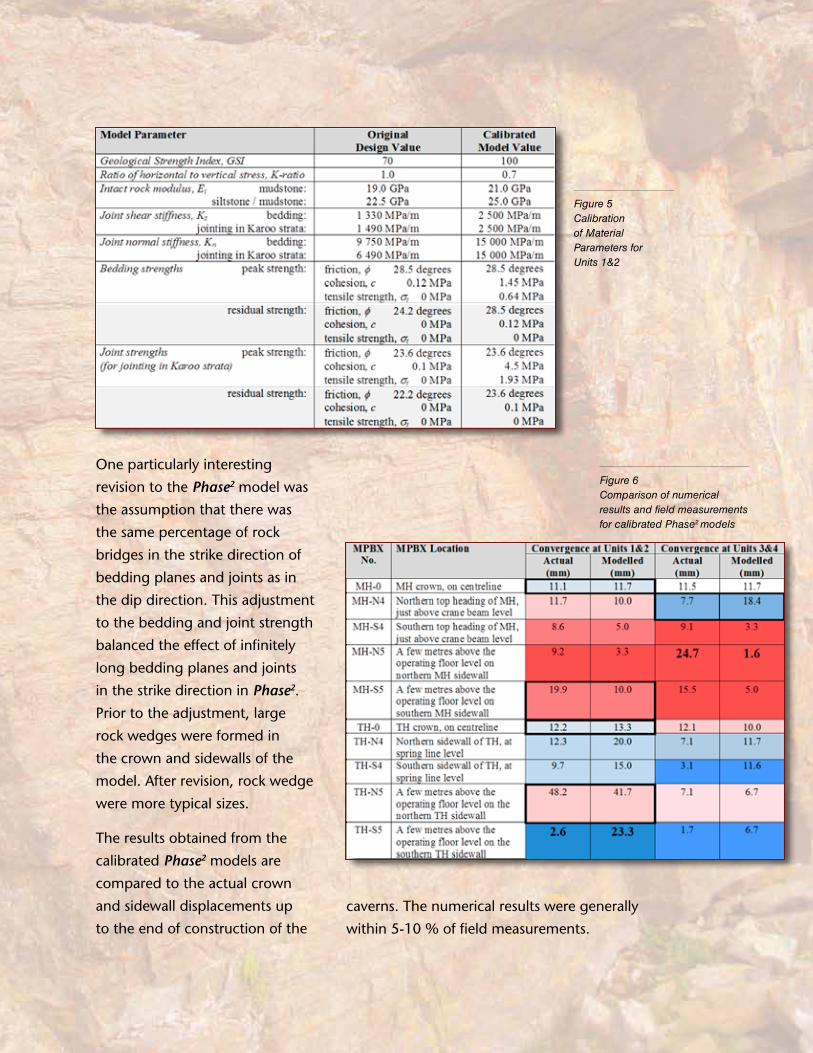
The results obtained from the
calibrated Phase2 models are
compared to the actual crown
and sidewall displacements up
to the end of construction of the
Figure 5Calibration of Material Parameters for Units 1&2
Figure 6Comparison of numerical results and field measurements for calibrated Phase2 models
caverns. The numerical results were generally
within 5-10 % of field measurements.
7
Modeling of Construction Defects
While differences exist between
the Phase2 models and the
cavern measurements, the results
were good enough to merit the
influence of construction defects
to be modeled and analyzed in
Phase2.
The first defect investigated
was the corrosion of invert floor
dowels. This was investigated
by removing all floor dowels
in certain locations in the
calibrated Phase2 models. The
second deviation modeled was
cable anchor hole deviation,
which was actually noted during
construction. To model this defect
in Phase2, staged cable anchor
removal was implemented. In the
calibrated Phase2 models for Units
1&2 it was found that staged
anchor removal resulted in steady
convergence increases, most
significantly in the transformer
sidewalls. In Units 3&4 models,
removal of an anchor resulted
in rock wedge mobilization
and subsequent failure of the
anchors retaining the wedge.
Convergence of the Phase2 model
was not obtained for the final
stage.
Observations and Conclusions
From the model calibration, it
was observed that the presence
of local rock wedges have a large
effect on both the modeling results
and the field measurements. In
general, if a rock wedge exists in
the field, there needs to be one in
the model in order for comparable
results to be obtained.
With regard to the modeling of
construction defects in Phase2,
the numerical results showed
that the long term yield failure
of some damaged cable anchors
may have little effect on cavern
excavation stability. However, the
models also showed that the long
term yield failure of damaged
anchors at critical locations may
result in rock wedge mobilization
and progressive failure. Based
on these Phase2 results, it was
recommended that cavern
instrumentation be maintained
and stability monitoring continued
long term.
To read the original article by M.
Kellaway, D. Taylor and G.J. Keyter,
please click here.