POWELL INDUSTRIES, INC. 2004 ANNUAL...
48
POWELL INDUSTRIES, INC. 2004 ANNUAL REPORT
Transcript of POWELL INDUSTRIES, INC. 2004 ANNUAL...

POWELL INDUSTRIES, INC. 2004 ANNUAL REPORT


“Always On.” These are reassuring words, reflecting a state of confidence and security.
When it comes to the complex systems — electrical, water, traffic, and petrochemical —
that keep our lives working, these are the words we want to hear.
For more than 50 years, Powell has engineered and manufactured equipment to manage
the distribution of electrical energy and other critical processes. Our performance for our
energy, transportation, municipality, and industrial clients has been unfailingly high.
Over the decades we have proven that we are always ready to respond to challenges.
Always raising the bar in safety and reliability. Always able to add value through expertise
and innovation.
As a company, Powell represents continuity. The commitment lives on.
1

“ AS INVESTORS, YOU CAN BE CONFIDENT, AS WE ARE CONFIDENT, OF THE STRONG POSITION POWELL CONTINUES TO HOLD IN THIS INDUSTRY. WE ARE STILL THE SAME STEADFAST, COMMITTED COMPANY WE WERE IN THE BEGINNING. THE ECONOMY MAY FLUCTUATE AND CUSTOMERS’ NEEDS MAY CHANGE, BUT POWELL’S CORE VALUES — RESPONSIVENESS, SAFETY, QUALITY, AND RELIABILITY — CONTINUE TO DELIVER INNOVATION AND ADDED VALUE IN THE MARKETPLACE.”
Dear Investors, Employees, and Friends,
For more than 50 years, Powell has been a
dependable and reliable company in an industry
that is historically cyclical. We are emerging from
a downturn, and although the industry is cyclical,
our performance must be consistent and reliable.
It is fitting that our business is the control and
management of critical processes — wherever
Powell’s products and services are used, clients
demand and expect reliability.
We are equally consistent in our customer-focused
business strategy. Even in the most difficult business
environments, Powell remains firm in our approach
and true to our beliefs: customer service, flexibility,
quality, and progressive product advancement.
In spite of our efforts, 2004 was a difficult year.
The company was faced with markedly higher costs
for our most basic raw materials, and generally
low capital spending by customers in a fiercely
competitive market.
Signs of Improvement. We begin 2005 with a
healthier global economy emerging and many
reasons to believe that Powell is entering a period
of recovery and growth.
Stability is a key factor in the capital investment
decisions of our customers, and today we see the
price of oil and gas, while high, becoming less
volatile. As the economy gains traction, we are
seeing renewed interest within the municipal,
transit, and industrial sectors in repowering and
upgrading infrastructure.
Powell ended the year with inquiries at healthy
levels. The pace of orders grew stronger during the
course of the year, and we ended with an order rate
that we have not experienced for several years.
We have nearly completed a strategic consolidation
of our manufacturing operations — we closed our
Greenville, Texas, facility, merging switch products
into North Canton, Ohio; we consolidated our bus
duct products into the Northlake, Illinois, facility;
and we are completing the transfer of power
electronics products from Watsonville, California,
to Houston, Texas. We expect these changes to
yield efficiencies and have a positive impact on
our bottom line in the near-term.
Legislative Mandates. Several key pieces of
legislation, either pending or recently passed, signal
areas of increased opportunity for Powell.
After the recent passage of the wind energy
legislation by Congress, a contract was released that
had been held at the design stage. Our delivery of
this project within six weeks demonstrated our
continued strength in performing under pressure.
Due to our performance, we have received a
commitment for five additional projects.
President Bush has announced that a top priority
in 2005 will be an initiative to combat air pollution

from the nation’s power plants. Legislation scheduled
for this spring will appropriate $50 billion for
emission reduction programs — creating excellent
integrated packaging opportunities for Powell
switchgear, motor controls, smart systems, and
Power Control Rooms.
The TEA-21 Reauthorization, scheduled for
action in early 2005, allots at least $200 billion
for the type of highway and transit initiatives that
should impact our traction substation and our
traffic management systems businesses.
Future Technologies. Powell continues to work on
new solutions to address the considerable growth in
electrical power consumption anticipated over the
next 20 years. We have been working together with
utilities on mobile systems to extend the useful life
of existing facilities. We are supporting independent
power producers in the development of power plants
fired by natural gas. We are also involved in efforts
to utilize the latest clean coal technologies in many
new utility coal-fired generating plants.
Powell has reinforced our leadership role in
arc-resistant switchgear by expanding our 38kV
switchgear to include an arc-resistant option and
developed a new arc-resistant motor control center
design. We have made significant strides in our
development of a solid-state current limiter, and we
have received financial support from large utility
companies with a strong interest in this product.
Next Challenges. Powell continues to prepare for
the years ahead. Based on a strong cash position,
Powell is engaged in an active acquisition program.
Our objective is to find products with applications
and marketplaces that complement our own.
In preparing for the future, we have strengthened
our corporate management team. As part of that
effort, Mark Reid joined Powell as Executive Vice
President in August. Mark brings a fresh approach
and broad experience to our business strategy and
planning efforts.
As investors, you can be confident, as we are
confident, of the strong position Powell continues to
hold in this industry. We are still the same steadfast,
committed company we were in the beginning. The
economy may fluctuate and customers’ needs may
change, but Powell’s core values — responsiveness,
safety, quality, and reliability — continue to deliver
innovation and added value in the marketplace. We
appreciate the support and continued confidence
our shareholders, customers, and employees have
demonstrated, and we look forward with anticipation
and confidence to the challenges the coming years
will bring.
Thomas W. Powell
Chairman, President, and CEO
Thomas W. PowellChairman, President, and CEO

In an industry where many suppliers strive toward standardization, Powell brings a unique
approach. We continue to specialize in the engineering and packaging of projects with
distinctive needs — whether in location, technology, or logistics. Our ability to develop
custom solutions makes us the preferred supplier for domestic and international customers
who require this type of expertise.
We can expand our clients’ capabilities, providing technical know-how and problem-
solving skills to meet special challenges. Whether designing a new traffic control system
or retrofitting an aging power plant, our strength lies in making large-scale projects
manageable and successful, even under extreme circumstances.
On Task. In 2004, Powell delivered a completely integrated power substation with more than 25 vertical sections of metal-clad switchgear on time and on budget — as part of a multiyear partnership with a major Midwest municipal utility. Again and again, Powell delivers exactly what the customers want, exactly when they want it.
4

ONFOCUS
POWELL’S GREATEST STRENGTHS LIE IN ENGINEERING AND PROJECT MANAGEMENT. WE’RE THE COMPANY THAT CUSTOMERS CALL WHEN A CRITICAL PROCESS CONTROL OR DISTRIBUTION SYSTEM IS COMPLEX AND IT HAS TO BE DONE RIGHT AND ON TIME.
5
POWELL FOCUS• Light Industry• Heavy Industry• Power Generation• Power Distribution• Process Management

Powell has always been out in front of the marketplace. As environmental concerns mount,
we continue to develop products and services for power alternatives such as wind, solar,
and co-generation. Our development staff continually designs products that raise awareness
and standards in safety and reliability. We are also taking the lead in smart systems that add
monitoring and expand communications capabilities to system control equipment.
Following up on an extensive re-engineering effort, Powell continues to invest in
improvements to our internal processes. A recently completed fabrication-and-finish facility
measurably increased our production capacity and improved our process quality record.
6
On Earth. With custom engineering and manufacturing capabilities, Powell is one of the few companies able to respond to the requirements necessary for the development of new energy sources. Current and future legislation regarding wind, solar, and other renewable energy sources will only boost this activity in years to come.

ONINNOVATIONWE ADVANCE THE MANAGEMENT OF CRITICAL PROCESSES IN EACH OF THE INDUSTRIES WE SERVE — ENERGY, MANUFACTURING, TRANSPORTATION, UTILITIES. OUR GOAL? MAKING THE SYSTEMS MORE EFFICIENT AND INTELLIGENT, AND THUS, MORE DEPENDABLE.
Nonhydroelectric Renewable Electricity Generation 2002-2025 (billion kilowatt hours)
Wind GeothermalSource: Energy Information Administration
7

Powell consistently seeks markets and clients whose needs match our capabilities. Today
we are responding to the needs of several regional municipalities and utilities as they
improve systems to meet modern standards and expand to meet infrastructure demands.
Our custom services and products are playing a role in rebuilding the nation’s power, trans-
portation, water, and wastewater systems.
In addition, we are aggressively expanding our alliances overseas, increasing our
commitment in Asia and the Middle East. Our aim is to take part in the global development
that is projected for decades to come.
8
On Location. Powell’s integration and control capability works to improve the associated processes of both complex power systems and complex transportation systems. Our highway management systems optimize a city’s traffic infrastructure and offer a cost-effective alternative to the never-ending need for additional rebar, concrete, and asphalt.

ONOPPORTUNITY
OUR GROWTH STEMS FROM THE NEED FOR CUSTOM QUALITY IN PROCESS CONTROL SYSTEMS — WE’RE SPECIALIZED PROBLEM-SOLVERS. THE BUILDING AND REBUILDING OF INFRASTRUCTURE WORLDWIDE REPRESENTS HUGE POTENTIAL FOR POWELL.
Annual Congestion Costs in Major U.S. Urban Areas (in billions of dollars)Source: Texas Transportation Institute
9

With our continued focus on reliability, safety, and efficiency, Powell’s approach has earned
confidence and loyalty from customers, and respect across the industry. We continue to
expand both our product line and services to make Powell a more comprehensive provider.
Drawing on our technical expertise and established relationships, Powell has steadily
expanded our involvement in aftermarket engineering and services. We are helping
industrial customers make their facilities safer, more efficient, and more economical through
upgrades in power distribution and control systems. Through advanced engineering
services, Powell provides training and maintenance services to help our customers meet
today’s performance requirements.
10
On Line. Power systems for the pulp and paper industry both in the United States and around the world represented a significant portion of Powell’s metal-clad switchgear installations during 2004. Specialized industries with unique requirements continue as a core market for Powell.

ONDIRECTION
POWELL HAS ALWAYS FILLED UNIQUE SEGMENTS IN OUR MARKETS. WE SUPPLY SPECIALIZED SERVICES TO HELP OPTIMIZE CRITICAL PROCESSES BEFORE AND AFTER THE INITIAL EQUIPMENT DELIVERY. OUR TASK REMAINS: KEEPING THE PROCESS “ON.”
Powell Research & Development Expenditure (in millions of dollars)
11

Powell today maintains the vision of our founders more than 50 years ago. We remain a
consistent and reliable provider of custom-engineered solutions when a project involves
extreme challenges and critical processes.
We continue to act as an engaged and reliable resource, to provide positive solutions, to
earn the confidence of our customers. That is how we keep our relationships growing and
our value clear.
Today’s electrical market challenges traditional opportunities, but we are seeing and
creating new possibilities. Powell is finding success in adapting to new markets, improving
our operations to become a more effective provider, and earning our place in the new
global marketplace.
Constant effort keeps Powell focused, inventive, directed, and eager as the new invest-
ment cycle begins. That’s what we mean by “Always On.”
ONTO THE FUTURE
12

Board of Directors
Thomas W. PowellChairman, President, and CEO
Joseph L. BechererConsultant
Eugene L. ButlerChairman - Intercoastal Terminal, Inc.
James F. ClarkVice President - Square D Corporation (Retired)
Stephen W. Seale, Jr.Director - Operations, Materials and, Structures, Southwest Research Institute (Retired)
Robert C. TranchonPresident and CEO Reveille Technology
Ronald J. WolnyVice President - Fluor Daniel, Inc. (Retired)
Don R. MadisonVice President, Chief Financial Officer
Miles “Gus” M. ZellerVice President - Powell Industries President - Powell Electrical Manufacturing
Robert B. GregoryCorporate Controller
Mark W. ReidExecutive Vice President
Corporate Officers
13

Years Ended October 31, 2004 2003 2002 2001 2000
Consolidated Statement of Operations Data
Revenues $ 206,142 $ 253,381 $ 306,403 $ 271,243 $ 223,019
Gross Profit 35,977 48,796 67,520 56,797 40,679
Net Income 1,669 6,985 17,798 13,542 7,061
Per-Share Data
Basic Earnings 0.16 0.66 1.69 1.30 0.68
Diluted Earnings 0.15 0.65 1.66 1.28 0.67
Consolidated Balance Sheet Data
Working Capital 99,270 96,969 86,466 88,981 63,508
Total Assets 196,079 190,478 189,708 186,361 137,926
Long-Term Debt 6,626 6,891 7,264 21,285 5,714
Total Stockholders’ Equity 139,835 136,364 128,100 109,369 94,087
* As restated, see Note O of the Notes to Consolidated Financial Statements. ** Free cash flow is defined as total cash flow from operations less all capital expenditures.
14
Consolidated Financial Highlights
Revenues (in millions of dollars)
Net Income (in millions of dollars)
Free Cash Flow** (in millions of dollars)
(In thousands, except per-share data)

2004FINANCIAL
REVIEW

16
The following discussion should be read in conjunction with the accompanying consolidated financial statements and related notes. In the course of operations, we are subject to certain risk factors, including but not limited to competition and competitive pressures, sensitivity to general economic and industry conditions, internation-al political and economic risks, availability and price of raw materials and execution of business strategy. Any forward-looking statements made by or on our behalf are made pursuant to the safe-harbor provisions of the Private Securities Litigation Reform Act of 1995. Readers are cautioned that such forward-looking statements involve risks and uncertainties in that the actual results may differ materially from those projected in the forward-looking statements.
The effects of the restatement discussed in Note O of the Notes to Consolidated Financial Statements have been reflected in the accompanying Management’s Discussion and Analysis of Financial Condition and Results of Operations.
OVERVIEWWe have continued to experience a significant reduction in market de-mand for our products. The difficult market conditions that existed in fiscal 2003 have continued through fiscal 2004. Additionally, market price levels have deteriorated as competition for available business volume intensified. However, we have been able to expand revenues related to system modification and equipment replacement as customers look for ways to extend the lives of their existing systems.
Although we currently face reduced demand and prices, there are indications of improvement in our principal markets. Historically, business expansion within our principal markets—public and pri-vate utilities, heavy industry and public agencies—have lagged gen-eral economic trends by six to twelve months as our revenues are principally driven by new capital investments. One of the positive trends we have experienced is an increase in new order activity. Orders received during the third and fourth quarters of fiscal 2004 totaled $42.1 million and $62.5 million, respectively, versus $35.8 million and $36.3 million in the same periods a year ago. We are optimistic that we will see further improvement in fiscal 2005.
In anticipation of improving business opportunities, we are taking advantage of lower production volumes to make necessary capital improvements to our manufacturing facility in Houston, Texas. We have committed to capital improvement projects totaling $6.1 million. These projects include a new metal finishing and paint system and replacement of some older metal fabricating equipment with a laser cut fabricating center and material handling system. Consistent with other lean initiatives, these investments will improve our quality and
efficiency as well as lead to lower working capital requirements. These projects are scheduled to be completed in March 2005.
We also expect international business opportunities to strengthen. To enhance our ability to serve the oil and gas and petrochemical industries, we increased our interest in Powell Industries Asia Private Limited (PIA) from 50% to 60% on August 1, 2004. Since that time, these operations have been fully consolidated in our financial state-ments. PIA was formed in 2000 as a joint venture between Powell and Rotary Engineering Limited, Singapore (Rotary). We anticipate the business opportunities to increase, and, with increased support from our domestic operations, we should be able to improve our ability to support the development of oil and gas production in Southeast Asia.
To reduce overhead costs and improve efficiency, we initiated a con-solidation plan that will reduce the number of facilities within our Electrical Power Products segment. During 2004, we consolidated our Greenville, Texas, and North Canton, Ohio, operations, closing the Greenville facility as of June 30; we consolidated our Elyria, Ohio, and Northlake, Illinois, operations, closing the Elyria facility as of October 31; and in September, we announced plans to consoli-date our Watsonville, California, and Houston, Texas, operations, exiting the leased Watsonville facility by December 31, 2004. Total pretax expenses associated with these plant closings are estimat-ed to be approximately $2.6 million. In fiscal 2004, we incurred pretax expenses associated with the plant closings of $2.2 million. For additional information related to consolidation costs, see Note M of the Notes to Consolidated Financial Statements.
RESULTS OF OPERATIONSYear ended October 31, 2004, compared with year ended October 31, 2003Revenue and Gross ProfitConsolidated revenues decreased 19% to $206.1 million in fiscal 2004 compared to fiscal year 2003 revenues of $253.4 million. Domestic revenues decreased $36.9 million to $176.7 million in 2004 compared to 2003. Revenues outside of the United States ac-counted for 14% of consolidated revenues in fiscal 2004 compared to 16% in 2003.
Electrical Power ProductsOur Electrical Power Products segment recorded revenues of $173.5 million in fiscal 2004 compared to $227.0 million in fiscal 2003. Customers have been reluctant to commit to new capital construc-tion projects throughout fiscal 2004 due to economic uncertainty. However, we have been able to expand revenues related to system modification and equipment replacement as customers look for ways to extend the lives of their existing systems. Overall, we have experi-enced a decline in revenues in each of our major markets. Revenues from industrial customers were $98 million in 2004 compared to
MANAGEMENT’S DISCUSSION AND ANALYSIS OF FINANCIAL CONDITION AND RESULTS OF OPERATIONS

17
$125 million in 2003. Utility revenues were $59 million in 2004 compared to $79 million in 2003. Municipal and transit projects gen-erated revenues of $17 million compared to $23 million a year ago.
Gross profit, as a percentage of revenues, decreased to 16.8% in fiscal 2004 from 18.8% in fiscal 2003. Fiscal 2004 costs of goods sold included one-time expenses of $1.8 million to consolidate our operations. Consolidation expenses include employee severance, training and equipment relocation costs. Inflationary pressures, primarily due to higher commodity prices in copper, aluminum and steel, increased direct material expenses by approximately 4%, or $3.3 million, compared to fiscal 2003.
Both revenue and gross profit have been adversely impacted by competitive pricing in a depressed marketplace. Partially offset-ting adverse market conditions have been the results of our efforts to reduce our production overhead costs by improving operating efficiencies through the implementation of lean initiatives.
Process Control SystemsRevenues in our Process Control Systems segment increased 24% to $32.7 million compared to $26.4 million in fiscal 2003. The in-crease in revenue is primarily attributed to our contract to design and build Intelligent Transportation Systems (ITS) for the Holland and Lincoln tunnels for the Port Authority of New York and New Jersey. This contract accounted for $14.3 million of segment revenues in fiscal 2004 and $4.2 million in fiscal 2003. As of October 31, 2004, the remaining value associated with this project in our backlog was $19.5 million, or 44% of segment backlog, which is expected to be recognized as revenue in 2005. Export revenue increased to $0.8 million in fiscal 2004 from $0.7 million in fiscal 2003.
Segment gross profit, as a percentage of revenues, was 21.0% in fiscal 2004, compared to 23.5% in fiscal year 2003. Gross profits as a percentage of revenues were reduced in 2004 due to the large amount of subcontract work and material pass-through purchases on the Holland and Lincoln tunnels contract, which typically will generate significantly lower profits compared to our other professional services.
For additional information related to our business segments, see Note L of the Notes to Consolidated Financial Statements.
Consolidated Operating ExpensesSelling, general and administrative expenses were $35.4 million, or 17.2% of revenues, in fiscal 2004 compared to $35.3 million, or 13.9% of revenues, in fiscal 2003. In fiscal 2004, accounting and auditing fees increased $0.8 million compared to 2003, primarily attributable to Sarbanes-Oxley compliance efforts. One-time con-solidation expenses of $0.4 million were incurred in fiscal 2004. These expenses were costs associated with actions to consolidate
our operations and close certain facilities which represented excess capacity. The benefit of lower operating overheads should be real-ized beginning in 2005. Excluding the impact of these increases, selling, general and administrative expenses would have decreased consistent with revenues.
Research and development expenditures were $3.5 million in 2004 compared to $3.6 million in fiscal 2003. Our research efforts are directed toward the discovery and development of new products and processes as well as improvements in existing products and processes. Research and development costs are included in selling, general and administrative expenses.
Interest Income and ExpenseWe incurred $0.1 million in interest expense in fiscal 2004 com-pared to $0.4 million in fiscal 2003. Interest expense has been reduced by favorable interest rates and decreasing balances on our industrial revenue bond debt. Our industrial revenue bonds have scheduled payments of $0.4 million that become due each year in October. Additionally, in fiscal 2003, we incurred $0.2 million in interest expense on our term loan and the associated interest rate swap. In September 2003, we paid the remaining principal balance on our term loan, which has reduced our interest expense.
We earned $0.9 million in interest income in fiscal 2004 compared to $0.6 million in the previous year. Interest income increased pri-marily due to higher levels of invested funds.
Provision for Income TaxesOur income tax provision/(benefit) for fiscal 2004 and 2003 was ($0.3 million) and $6.1 million, and our effective tax rate was (21%) and 45%, respectively. During 2004, we recorded several nonrecur-ring tax adjustments related to the following items:
a) A $0.4 million benefit was recorded primarily for the benefit of revised extraterritorial income exclusion amounts for the years ended 2002 and 2003. This benefit was derived by calculating the extraterritorial income exclusion amount on a transaction by transaction basis in 2004, as opposed to an aggregate basis as originally estimated.
b) A $0.3 million valuation allowance related to capital losses was released in 2004. We entered into an agreement in 2004 to sell a capital asset that will trigger enough capital gain to utilize the capital loss carryforward; and
c) We released $0.2 million of state income tax reserve in 2004 due to acceptance by certain state taxing authorities of voluntary disclosure agreements in 2004.
Without these adjustments, our 2004 effective tax rate would have been 40%.

18
Net IncomeNet income was $1.7 million, or $0.15 per diluted share, in fiscal year 2004 compared to $7.0 million, or $0.65 per diluted share, in fiscal year 2003. The decrease in net income primarily relates to lower business volume and decreased gross profits in fiscal 2004. Gross profits declined as a result of one-time consolidation costs, inflationary pressures on materials costs, and depressed market price levels. Partially offsetting lower gross profits were higher inter-est income and a net income tax benefit.
In fiscal 2003, net income was negatively impacted as a result of our adoption of Statement of Financial Accounting Standards (“SFAS”) No. 142, “Goodwill and Other Intangible Assets.” During the first quarter of fiscal 2003, we recorded a goodwill impairment loss of $0.5 million as a cumulative effect of a change in accounting prin-ciple. The goodwill impairment charge accounted for a loss of $0.05 per diluted share a year ago.
Year ended October 31, 2003, compared with year ended October 31, 2002Revenue and Gross ProfitConsolidated revenues decreased 17% to $253.4 million in fiscal 2003 as compared to fiscal year 2002 revenues of $306.4 million. Domestic revenues decreased $64.8 million to $213.6 million in 2003 compared to 2002. Despite weaknesses in domestic markets, new investments in oil and gas production facilities contributed to increased international revenues in fiscal 2003. Revenues outside of the United States accounted for 16% of consolidated revenues in 2003 compared to 9% in 2002.
Electrical Power ProductsOur Electrical Power Products segment recorded revenues in fiscal 2003 of $227.0 million compared to $283.6 million in fiscal 2002. Revenues from public and private utilities fell by 55% in fiscal 2003. In particular, there was a significant decline in new investments in electrical power generation facilities. Utility revenues were $79 million in 2003 compared to a record $173 million in 2002. Our municipal customers faced a reduced tax base with which to fund infrastructure projects in 2003. Municipal and transit projects gen-erated revenues of $23 million compared to $29 million in 2002. However, revenues from industrial customers totaled $125 million in fiscal 2003, an increase of $44 million, or 54%, over 2002. This increase in revenue from industrial customers resulted primarily from revenues related to the manufacture and delivery of power control modules for new oil and gas production facilities. These long-term projects to construct new oil and gas production facilities were initiated by our customers during 2001 and 2002.
Gross profit, as a percentage of revenues, was 18.8% in fiscal 2003, compared to 22.0% in fiscal year 2002. Gross profit has been adversely impacted by lower production volumes and competitive pricing pressures. Partially offsetting adverse market conditions were the results of our efforts to reduce our costs of production by improving operating efficiencies through the implementation of lean initiatives. In addition, we incurred an impairment loss of $0.4 million to decrease the carrying value of machinery and equipment to their estimated market value. This impairment loss resulted from our decision to discontinue certain product lines. These product lines generated aggregate revenues of less than $1.0 million in fis-cal 2003.
Process Control SystemsRevenues in our Process Control Systems segment increased 16% to $26.4 million compared to $22.8 million in fiscal 2002. Our most significant award during 2003 was a contract to design and build Intelligent Transportation Systems (ITS) for the Holland and Lincoln tunnels from the Port Authority of New York and New Jersey valued at $37.4 million as of October 31, 2003. Revenue attributable to this project totaled $4.2 million during fiscal 2003. Gross profit, as a percentage of revenues, was 23.5% in fiscal 2003, compared to 23.0% in fiscal year 2002.
For additional information related to our business segments, see Note L of the Notes to Consolidated Financial Statements.
Consolidated Operating ExpensesSelling, general and administrative expenses increased to 13.9% of revenues in fiscal 2003 compared to 12.7% of revenues in fiscal year 2002. Our commitment to continue to develop our customer markets and products resulted in an increase in operating expenses relative to our revenues. Research and development expenditures were $3.6 million in fiscal 2003 compared to $3.4 million in fiscal year 2002. Our research efforts are directed toward the discovery and development of new products and processes as well as im-provements in existing products and processes.
Interest Income and ExpenseWe incurred $0.4 million in interest expense on our term debt and outstanding industrial development revenue bonds during fiscal 2003 compared to $0.5 million in 2002. As a result of lower levels of debt and decreased interest rates, our interest expense has declined. Interest income increased by $0.3 million to $0.6 million in 2003 compared to the same period of the previous year. An increase in invested funds during 2003 has been partially offset by the lower interest rate environment.

19
Provision for Income TaxesOur provision for income taxes reflects an effective tax rate on earn-ings before income taxes of 45.0% in fiscal 2003 compared to 37.1% in fiscal 2002. Included in our provision is $1.3 million for state taxes (net of federal tax benefit), of which $0.9 million reflects revised estimates in state tax exposures related to prior years. Over the past several years, our business has expanded and we are now conducting activities in more states. We have accordingly increased our estimates for such state tax exposures.
Cumulative Effect of Change in Accounting PrincipleAs a result of the adoption of Statement of Financial Accounting Standards (“SFAS”) No. 142, “Goodwill and Other Intangible Assets,” we recorded a goodwill impairment loss of $0.5 million, net of $0.3 million taxes, as a cumulative effect of a change in accounting prin-ciple during the first quarter of 2003. We recorded an impairment charge of $0.4 million, net of $0.2 million taxes, to write off the full value of goodwill in our Process Control Systems segment. In our Electrical Power Products segment, we recorded an impairment charge of $0.1 million, net of approximately $71,000 taxes. The goodwill impairment charge accounted for a loss of $0.05 per diluted share.
Net IncomeNet income was $7.0 million, or $0.65 per diluted share, in fiscal year 2003 compared to $17.8 million, or $1.66 per diluted share, in fiscal year 2002. The decrease in net income primarily relates to lower business volume and decreased gross profits in fiscal 2003. Additionally, net income was negatively impacted as a result of an impairment loss of $0.2 million, net of taxes, recorded to decrease the carrying value of machinery and equipment; an increase in estimates for state tax exposures related to prior years of $0.9 million, net of federal tax benefits; and the net effect of a change in accounting principle related to goodwill accounted for $0.5 million. Each of these adjustments to net income is discussed in the Notes to Consolidated Financial Statements.
LIQUIDITY AND CAPITAL RESOURCESYear ended October 31, 2004, compared with year ended October 31, 2003We have continued to improve our liquidity position. Working capital was $99.3 million at October 31, 2004, compared to $97.0 million at October 31, 2003. As of October 31, 2004, current assets ex-ceeded current liabilities by 3.1 times and our debt to capitalization ratio was less than 0.1 to 1.
At October 31, 2004, we had cash, cash equivalents and marketable securities of $63.2 million, compared to $42.3 million at October 31, 2003. Long-term debt, including current maturities, totaled $7.1 million at October 31, 2004, compared to $7.4 million at October
31, 2003. In addition to our long-term debt, we maintain a revolving credit agreement which at year end provided for a borrowing capac-ity of $15 million through February 2007. As of October 31, 2004 and 2003, there were no outstanding borrowings under this line of credit. For further information regarding our debt, see Note G of the Notes to Consolidated Financial Statements.
Operating ActivitiesNet cash provided by operating activities was $24.9 million for fiscal 2004. A net reduction in operating assets and liabilities provided $20.1 million, with the remainder of the increase related to net earnings adjusted for depreciation, amortization and other noncash expenses. Of the $20.1 million provided by the net reduction in operating assets and liabilities, $14.5 million was provided due to a reduction of investments in contract costs and inventories as projects in our backlog reached contractual billing milestones. In addition, lower sales volumes have resulted in less cash being rein-vested in operating assets. During fiscal 2003, operating activities provided net cash of $36.5 million, of which $22.5 million resulted from a reduction in operating assets and liabilities, with the remainder of the increase related to net earnings adjusted for depreciation, amortization and other noncash expenses.
Investing ActivitiesInvestments in property, plant and equipment during fiscal 2004 totaled $6.5 million compared to $4.5 million in fiscal 2003. The majority of our 2004 capital investments will be used to improve our capabilities to manufacture switchgear and electrical power control rooms. We have committed to capital projects totaling $6.1 million to acquire a new metal finishing and paint system, a laser cut fabri-cating center, and material handling system. As of the end of fiscal 2004, we have incurred costs of $4.2 million for these projects. We expect to incur the balance during the first half of 2005. Consistent with other lean initiatives, these investments will improve our quality and efficiency as well as lead to lower working capital requirements.
Proceeds from the sale of fixed assets provided cash of $1.8 million in fiscal 2004, primarily from the sale of our Franklin Park, Illinois, manufacturing facility, which was idled in 2002. Net trades in mar-ketable securities provided cash of $1.8 million in fiscal 2004. During 2003, we purchased $5.8 million of these investment-grade corporate bonds and classified them as available for sale. The maturity dates of these bonds vary from one to nine years.

20
Financing ActivitiesNet cash provided by financing activities was $0.6 million in fiscal 2004, primarily from the exercise of stock options. Net cash used in financing activities in fiscal 2003 was $3.7 million. In September 2003, we paid the remaining principal balance on our term loan. The repayment of this loan was the primary use of cash for financing activities in fiscal year 2003.
Contractual ObligationsAt October 31, 2004, our long-term contractual obligations were limited to debt and leases. The table below details our commitments by type of obligation and the period that the payment will become due (in thousands).
We are contingently liable for secured and unsecured letters of credit of $10.3 million as of October 31, 2004. We also had performance bonds totaling approximately $167.9 million that were outstanding at October 31, 2004. Performance bonds are used to guarantee contract performance to our customers.
Year ended October 31, 2003, compared with year ended October 31, 2002Working capital was $97.0 million at October 31, 2003, compared to $86.5 million at October 31, 2002. As of October 31, 2003, current assets exceeded current liabilities by 3.2 times and our debt-to-capitalization ratio was less than 0.1 to 1.
At October 31, 2003, we had cash, cash equivalents and marketable securities of $42.3 million, compared to $14.4 million at October 31, 2002. Long-term debt, including current maturities, totaled $7.4 million at October 31, 2003, compared to $12.0 million at October 31, 2002. In addition to our long-term debt, we maintain a revolving credit agreement which at year-end 2003 provided for a credit facility of $15 million through February 2006. As of October 31, 2003, there were no borrowings under this line of credit. For further information regarding our debt, see Note G of the Notes to Consolidated Finan-cial Statements.
Operating ActivitiesNet cash provided by operating activities was $36.5 million for fiscal 2003. A net reduction in operating assets and liabilities provided $22.5 million, with the remainder of the increase related to net earnings adjusted for depreciation, amortization and other noncash expenses. During fiscal 2002, operating activities provided net cash of $31.7 million, of which $8.8 million resulted from a reduction in operating assets and liabilities.
Investing ActivitiesInvestments in property, plant and equipment during fiscal 2003 totaled $4.5 million compared to $13.9 million in fiscal 2002. The majority of these expenditures were used to complete a project initiated during 2002 to increase our manufacturing capacity available for the manufacture of electrical power control modules. These modules are provided to the oil and gas industry for use on offshore platforms.
During 2003, we purchased $5.8 million of investment-grade cor-porate bonds. As of October 31, 2003, the maturity dates of these bonds vary from five to nine years.
Financing ActivitiesFinancing activities used $3.7 million in fiscal 2003. Approximately $4.8 million was used for repayments on our long-term debt. Other financing activities were limited primarily to the exercise of stock options. During fiscal 2002, net cash used by financing activities was $10.0 million, primarily from payments on long-term debt.
OUTLOOK FOR FISCAL 2005We expect our principal markets to strengthen throughout 2005. Customer inquiries, or requests for proposals, have steadily strengthened during the second half of fiscal 2004. One of the posi-tive trends we have experienced is an increase in new order activity. Orders received during the third and fourth quarters of fiscal 2004 totaled $42.1 million and $61.5 million, respectively, versus $35.8 million and $36.3 million in the same periods a year ago. We are optimistic that we will see further improvement in fiscal 2005.
In our Electrical Power Products segment, third and fourth quarter orders increased both sequentially and year over year. In addition, we expect to realize lower overhead expenses and increased efficien-cies as a result of our consolidation efforts and capital improvements, both of which should improve our competitive position. Although our Process Controls Systems segment continues to experience soft market conditions, we anticipate increased funding for municipal projects will be available as general economic conditions strengthen. We believe we will be well positioned to take advantage of improving economic conditions.
As of October 31, 2004
Long-Term Operating Payments Due Debt Capital Lease Leaseby Period Obligations Obligations Obligations Total
Less than 1 year $ 419 $ 55 $ 1,694 $ 2,1681 to 3 years 858 98 2,731 3,6873 to 5 years 800 70 1,438 2,308More than 5 years 4,800 — — 4,800
Total long-term contractual obligations $ 6,877 $ 223 $ 5,863 $ 12,963

21
We anticipate that we will begin reinvesting a portion of our cash in operating working capital in fiscal 2005. Working capital needs are anticipated to increase with growing levels of business activity. We believe that working capital, borrowing capabilities and funds generated from operations will be sufficient to finance anticipated operational activities, capital improvements, debt repayment and possible future acquisitions for the foreseeable future.
EFFECTS OF INFLATION AND RECESSIONIn 2003, we experienced a significant deterioration in business volume due to the effects of the U.S. economy on our markets and customers. New investments in infrastructure projects were curtailed in both our utility and industrial market segments. Our municipal clients faced a reduced tax base with which to fund infrastructure projects. Along with indications of an improving U.S economy, new business inquiry levels strengthened throughout 2004. The pace of orders grew stronger as 2004 progressed, and we ended the year with an order rate that we have not experienced since 2002. We anticipate these conditions will continue into 2005.
As the U.S. economy began to show signs of improvement, we ex-perienced significant price pressures with our key raw materials, primarily copper, aluminum and steel. Competitive market pressures limited our ability to pass these cost increases to our customers. These competing pressures eroded our earnings in 2004. We antici-pate these inflationary pressures will continue to adversely impact our operations in 2005.
CRITICAL ACCOUNTING POLICIES AND ESTIMATESThe preparation of consolidated financial statements in conformity with accounting principles generally accepted in the United States of America requires us to make estimates and judgments with respect to the selection and application of accounting policies that affect the reported amounts of assets, liabilities, revenues and expenses, and the disclosures of contingent assets and liabilities. We base our estimates on historical experience and on various other assumptions that are believed to be reasonable under the circumstances. Actual results may differ from these estimates. We believe the following accounting policies and estimates to be critical in the preparation and reporting of our consolidated financial statements.
Revenue RecognitionOur revenues are generated from the engineering and manufacturing of custom products. We recognize revenues under both the com-pleted contract method and the percentage-of-completion method, depending upon the duration and the scope of the project. At the onset of each project, the size, scope and duration of the contract is reviewed to determine the appropriate revenue recognition method, based upon company policy and applicable accounting standards. Due to the long-term and fixed-price nature of the projects in the
Process Control Systems segment, all revenues are recorded using percentage-of-completion. However, projects in the Electrical Power Products segment vary widely; thus, both the completed contract and percentage-of-completion methods are used. During the last three years, approximately 61% to 71% of revenues in our Electrical Power Product’s segment were recognized using the percentage of completion method.
Under the completed contract method, revenues are recognized upon the transfer of title, which is generally at the time of shipment or delivery (depending upon the terms of the contract), when all significant contractual obligations have been satisfied, the price is fixed or determinable and collectibility is reasonably assured. We use shipping documents and customer acceptance, when applicable, to verify the transfer of title to the customer. We assess whether the price is fixed or determinable based on the payment terms associ-ated with the transaction and whether the sales price is subject to refund or adjustment. Collectibility is assessed based on the credit-worthiness of the customer assessed through credit verification, the customer’s payment history and other relevant factors.
Under the percentage-of-completion method, revenues are recog-nized as work is performed based on the estimated completion to date calculated by multiplying the total contract price by percentage of performance to date, based on total labor dollars or hours in-curred to date to the total estimated labor dollars or hours estimated at completion. Application of the percentage of completion method of accounting requires the use of estimates of costs to be incurred for the performance of the contract. Contract costs include all direct material and labor costs and those indirect costs related to contract performance, such as indirect labor, supplies, tools, repairs and all costs associated with operation of equipment (excluding deprecia-tion). The cost estimation process is based upon the professional knowledge and experience of the company’s engineers, project managers and financial professionals. Factors that are considered in estimating the work to be completed and ultimate contract recov-ery include the availability and productivity of labor, the nature and complexity of the work to be performed, the effect of change orders, the availability of materials, the effect of any delays in performance and the recoverability of any claims. Changes in job performance, job conditions, estimated profitability and final contract settlements may result in revisions to costs and income, and their effects are recognized in the period in which the revisions are determined. Whenever revisions of estimated contract costs and contract values indicate that the contract costs will exceed estimated revenues, thus creating a loss, a provision for the total estimated loss is recorded in that period.

22
Allowance for Doubtful AccountsWe maintain and continually assess the adequacy of an allowance for doubtful accounts representing our estimate for losses resulting from the inability of our customers to pay amounts due to us. This estimated allowance is based on historical experience of uncollected accounts, the level of past-due accounts, the overall level of out-standing accounts receivable, information about specific customers with respect to their inability to make payments and expectations of future conditions that could impact the collectibility of accounts receivable. However, future changes in our customers’ operating performance and cash flows or in general economic conditions could have an impact on their ability to fully pay these amounts which could have a material impact on our operating results.
Impairment of Long-Lived Assets We have significant investments in long-lived assets, including property and equipment and goodwill. We evaluate the recover-ability of the carrying amount of long-lived assets whenever events or changes in circumstances indicate that the carrying value of an asset may not be fully recoverable. The review for impairment of long-lived assets and goodwill takes into account estimates of fu-ture cash flows. Our estimates of future cash flows are based upon budgets and longer-range plans. These budgets and plans are used for internal purposes and are also the basis for communication with outside parties about future business trends. While we believe the assumptions we use to estimate future cash flows are reasonable, there can be no assurance that the expected future cash flows will be realized. As a result, impairment charges that possibly should have been recognized in earlier periods may not be recognized until later periods if actual cash flows deviate unfavorably from earlier estimates. For assets held for sale or disposal, the fair value of the asset is measured using quoted market prices or an estimation of net realizable value. Based on general economic conditions and conditions specific to our industry, the ultimate amounts realized on assets held for sale may differ materially from their currently estimated realizable values.
Accruals for Contingent LiabilitiesFrom time to time, contingencies, such as insurance and legal claims, arise in the normal course of business. Pursuant to current accounting standards, we must evaluate such contingencies to sub-jectively determine the likelihood that an asset has been impaired or a liability has been incurred at the date of the financial state-ments as well as evaluating whether the amount of the loss can be reasonably estimated. If the likelihood is determined to be probable and it can be reasonably estimated, the estimated loss is recorded. The amounts we record for insurance claims, warranties, legal and other contingent liabilities require judgments regarding the amount of expenses that will ultimately be incurred. We use past experience and history, as well as the specific circumstances surrounding each
contingent liability in evaluating the amount of liability that should be recorded. Actual results could differ from our estimates.
Accounting for Income TaxesWe account for income taxes under the asset and liability method. This approach requires the recognition of deferred tax assets and liabilities for the expected future tax consequences of temporary dif-ferences between the carrying amounts and the tax basis of assets and liabilities. Developing our provision for income taxes requires significant judgment and expertise in federal and state income tax laws, regulations and strategies, including the determination of de-ferred tax assets and liabilities and, if necessary, any valuation al-lowances that may be required for deferred tax assets. We recorded a state tax valuation allowance of approximately $54,000 during the year ended October 31, 2004. We have not recorded any other valuation allowances as of October 31, 2004, because we believe that future taxable income will, more likely than not, be sufficient to realize the benefits of those assets as the temporary differences in basis reverse over time. Our judgments and tax strategies are sub-ject to audit by various taxing authorities. While we believe we have provided adequately for our income tax liabilities in the consolidated financial statements, adverse determinations by taxing authorities could have a material adverse effect on our consolidated financial condition and results of operations.
NEW ACCOUNTING STANDARDSIn November 2003, the Emerging Issues Task Force (EITF) reached a consensus opinion on EITF 03-1, “The Meaning of Other-Than-Temporary Impairment and Its Application to Certain Investments.” EITF 03-1 provides guidance on the new requirements for other- than-temporary impairment and its application to debt and marketable equity investments that are accounted for under SFAS No. 115. The new requirements are effective for fiscal years ending after December 15, 2003. The adoption of EITF 03-1 during the quarter ended January 31, 2004, had no impact on our consoli-dated financial position, results of operations or cash flows.
In March 2004, the EITF reached a consensus opinion on EITF 03-06, “Participating Securities and the Two-Class Method under FASB Statement No. 128, Earnings Per Share.” EITF 03-06 provides guidance in applying the two-class method of calculating earnings per-share for companies that have issued securities other than common stock that contractually entitle the holder to participate in any divi-dends declared and earnings of the company. The opinion defines what constitutes a participating security and how to apply the two-class method of calculating earnings per-share to those securities. EITF 03-06 became effective during the quarter ended July 31, 2004, and the adoption did not have an impact on our calculation of earnings per-share.

23
In May 2004, the Financial Accounting Standards Board (FASB) issued FASB Staff Position (FSP) 106-2, “Accounting and Disclo-sure Requirements Related to the Medicare Prescription Drug, Improvement, and Modernization Act of 2003,” to provide account-ing and disclosure guidance for employers that sponsor postretire-ment health care plans that provide prescription drug benefits. The Medicare Prescription Drug, Improvement, and Modernization Act of 2003 (the “Act”) was signed into law on December 8, 2003. The Act introduces a prescription drug benefit under Medicare as well as a federal subsidy to sponsors of retiree health care benefit plans that provide a benefit that is at least actuarially equivalent to Medi-care Part D. The new requirements are effective for interim periods beginning after June 15, 2004. We provide postretirement health benefits that include prescription drug benefits, but this benefit ends when the employee reaches the age of 65. The adoption of FSP 106-2 during the quarter ended October 31, 2004, had no impact on our postretirement benefit cost. In November 2004, the FASB issued SFAS No. 151, “Inventory Costs, an Amendment of ARB No. 43, Chapter 4.” The amendments made by SFAS No. 151 clarify that abnormal amounts of idle facil-ity expense, freight, handling costs and wasted materials (spoilage) should be recognized as current-period charges and require the allocation of fixed production overheads to inventory based on the normal capacity of the production facilities. The guidance is effective for inventory costs incurred during fiscal years beginning after November 23, 2004. We do not believe the adoption of SFAS No. 151 will have a material impact on our consolidated financial posi-tion, results of operations or cash flows.
In December 2004, the FASB issued SFAS No. 123 (revised 2004), “Share-Based Payment.” SFAS No. 123(R) will require that the compensation cost relating to share-based payment transactions be recognized in financial statements. That cost will be measured based on the fair value of the equity or liability instruments issued. SFAS No. 123(R) covers a wide range of share-based compensation arrangements, including share options, restricted share plans, per-formance-based awards, share appreciation rights and employee share purchase plans. SFAS No. 123(R) replaces FASB State-ment No. 123, “Accounting for Stock-Based Compensation,” and supersedes APB Opinion No. 25, “Accounting for Stock Issued to Employees.” SFAS No. 123, as originally issued in 1995, estab-lished as preferable a fair value-based method of accounting for share-based payment transactions with employees. However, that Statement permitted entities the option of continuing to apply the guidance in APB Opinion No. 25, as long as the footnotes to finan-cial statements disclosed what net income would have been had the preferable fair value-based method been used. Public entities will be required to apply SFAS No. 123(R) as of the first interim or annual reporting period that begins after June 15, 2005. We are in the
process of evaluating the impact the adoption of SFAS No. 123(R) will have on our consolidated financial position, results of operations and cash flows.
QUANTITATIVE AND QUALITATIVE DISCLOSURES ABOUT MARKET RISKWe are exposed to certain market risks arising from transactions we have entered into in the normal course of business. These risks primarily relate to fluctuations in interest rates, foreign exchange rates and commodity prices.
We are subject to market risk resulting from changes in interest rates related to our outstanding debt and investments in marketable debt securities. Regarding our various debt instruments outstanding at October 31, 2004 and 2003, a 100-basis-point increase in interest rates would result in a total annual increase in interest expense of less than $75,000. Our investments in marketable debt securities are carried at fair value on the consolidated balance sheet, with un-realized gains and losses reported in other comprehensive income. Changes in interest rates will affect the fair value of the marketable securities as reported. While we do not currently have any derivative contracts to hedge our exposure to interest rate risk, we have in the past and may in the future enter into such contracts. Overall, we believe that changes in interest rates will not have a material near-term impact on our future earnings or cash flows. During each of the past three years, we have not experienced a significant effect on our business due to changes in interest rates.
Our market risk associated with foreign currency rates is not con-sidered to be material, since we primarily arrange compensation in U.S. dollars. During each of the past three years, we have not experienced a significant effect on our business due to fluctuations in foreign exchange rates.
We are subject to market risk from fluctuating market prices of certain raw materials. While such materials are typically available from numerous suppliers, commodity raw materials are subject to price fluctuations. We attempt to pass along such commodity price increases to our customers on a contract-by-contract basis to avoid profit margin erosion. While we may do so in the future, we have not entered into any derivative contracts to hedge our exposure to commodity risk in fiscal years 2004, 2003 or 2002. During 2004, we experienced significant price pressures with some of our key raw materials. Competitive market pressures limited our ability to pass these cost increases to our customers, thus eroding our earnings in 2004. We did not experience a significant effect on our business due to fluctuations in commodity prices in 2003 or 2002. Fluctua-tions in commodity prices may have a material near-term effect on our future earnings and cash flows.

24
POWELL INDUSTRIES, INC. AND SUBSIDIARIES CONSOLIDATED BALANCE SHEETS(In thousands, except share and per-share data)
October 31, 2004 2003
Assets (As Restated, See Note O)
Current Assets: Cash and cash equivalents $ 59,259 $ 36,788 Marketable securities 3,923 5,528 Accounts receivable, less allowance for doubtful accounts of $617 and $1,283, respectively 42,659 45,265 Costs and estimated earnings in excess of billings on uncompleted contracts 19,822 32,174 Inventories 15,332 18,060 Income taxes receivable 1,179 1,045 Deferred income taxes 729 — Prepaid expenses and other current assets 2,717 2,453
Total Current Assets 145,620 141,313
Property, plant and equipment, net 45,041 43,998Other assets 5,418 5,167
Total Assets $ 196,079 $ 190,478
Liabilities and Stockholders’ Equity
Current Liabilities: Current maturities of long-term debt and capital lease obligations $ 474 $ 468 Income taxes payable 1,358 1,999 Accounts payable 14,239 14,342 Accrued salaries, bonuses and commissions 7,964 6,396 Billings in excess of costs and estimated earnings on uncompleted contracts 15,174 13,216 Accrued product warranty 1,545 1,929 Other accrued expenses 5,596 5,994
Total Current Liabilities 46,350 44,344
Long-term debt and capital lease obligations, net of current maturities 6,626 6,891Deferred compensation 1,744 1,608Other liabilities 1,306 1,271
Total Liabilities 56,026 54,114
Commitments and contingencies (Note K)
Minority interest 218 —
Stockholders’ Equity: Preferred stock, par value $.01; 5,000,000 shares authorized; none issued Common stock, par value $.01; 30,000,000 shares authorized; 11,000,000 and 10,994,000 shares issued, respectively; 10,730,000 and 10,641,000 shares outstanding, respectively 110 110 Additional paid-in capital 9,433 8,961 Retained earnings 134,419 132,750 Treasury stock, 270,000 and 352,000 shares, respectively, at cost (2,514 ) (3,312) Accumulated other comprehensive income (loss) 54 (118) Deferred compensation (1,667 ) (2,027)
Total Stockholders’ Equity 139,835 136,364
Total Liabilities and Stockholders’ Equity $ 196,079 $ 190,478
The accompanying notes are an integral part of these consolidated financial statements.

25
POWELL INDUSTRIES, INC. AND SUBSIDIARIES CONSOLIDATED STATEMENTS OF OPERATIONS(In thousands, except per-share data)
Years Ended October 31, 2004 2003 2002
(As Restated, See Note O) (As Restated, See Note O)
Revenues $ 206,142 $ 253,381 $ 306,403Cost of goods sold 170,165 204,585 238,883
Gross profit 35,977 48,796 67,520Selling, general and administrative expenses 35,357 35,339 39,031
Income before interest, income taxes and cumulative effect of change in accounting principle 620 13,457 28,489Interest expense 136 403 508Interest income (880) (578) (298)
Income from continuing operations before income taxes and cumulative effect of change in accounting principle 1,364 13,632 28,279Income tax provision (benefit) (282) 6,137 10,481Minority interest in net loss (23) — —
Income from continuing operations before cumulative effect of change in accounting principle 1,669 7,495 17,798Cumulative effect of change in accounting principle, net of tax — (510) —
Net income $ 1,669 $ 6,985 $ 17,798
Net Earnings per Common Share
Basic: Earnings from continuing operations $ 0.16 $ 0.71 $ 1.69 Cumulative effect of change in accounting principle — (0.05) —
Net earnings $ 0.16 $ 0.66 $ 1.69
Diluted: Earnings from continuing operations $ 0.15 $ 0.70 $ 1.66 Cumulative effect of change in accounting principle — (0.05) —
Net earnings $ 0.15 $ 0.65 $ 1.66
Weighted Average Shares: Basic 10,688 10,591 10,511
Diluted 10,774 10,681 10,698
The accompanying notes are an integral part of these consolidated financial statements.

26
POWELL INDUSTRIES, INC. AND SUBSIDIARIES CONSOLIDATED STATEMENTS OF STOCKHOLDERS’ EQUITY(In thousands)
Accumulated Other Other Additional Comprehensive Comprehensive Paid-In Retained Treasury Income Deferred Income Shares Amount Capital Earnings Stock (Loss) Compensation Total Balance, November 1, 2001 10,964 $ 109 $ 8,680 $ 107,967 $ (4,887) $ (140) $ (2,360) $ 109,369
Net income (As Restated, See Note O) $ 17,798 17,798 17,798
Amortization of deferred compensation-ESOP 252 252
Change in value of interest rate swap, net of $33 income taxes 53 53 53
Exercise of stock options 15 1 (627) 962 336Income tax benefit from stock
options exercised 292 292
Comprehensive Income (As Restated, See Note O) $ 17,851
Balance, October 31, 2002 (As
Restated, See Note O) 10,979 110 8,345 125,765 (3,925) (87) (2,108) 128,100Net income (As Restated, See
Note O) 6,985 6,985 6,985Amortization of deferred
compensation-ESOP 277 277Change in value of interest rate
swap, net of $49 income taxes 87 87 87Change in value of marketable
securities, net of $64 income taxes (118) (118) (118)Exercise of stock options 131 510 641Income tax benefit from stock
options exercised 119 119Issuance of stock 15 366 103 (196) 273
Comprehensive Income (As Restated, See Note O) $ 6,954
Balance, October 31, 2003 (As Restated, See Note O) 10,994 110 8,961 132,750 (3,312) (118) (2,027) 136,364Net income 1,669 1,669 1,669Foreign currency translation
adjustments, net of $11 income taxes 17 17 17
Change in value of marketable securities, net of $85 incometaxes and reclassificationadjustment (see Note B) 155 155 155
Amortization of deferred compensation-ESOP 297 297
Exercise of stock options 240 798 1,038Income tax benefit from stock
options exercised 157 157Amortization of restricted stock 63 63
Issuance of stock 6 75 75
Comprehensive Income $ 1,841
Balance, October 31, 2004 11,000 $ 110 $ 9,433 $ 134,419 $ (2,514) $ 54 $ (1,667) $ 139,835
The accompanying notes are an integral part of these consolidated financial statements.
Common Stock

27
POWELL INDUSTRIES, INC. AND SUBSIDIARIES CONSOLIDATED STATEMENTS OF CASH FLOWS(In thousands)
Years Ended October 31, 2004 2003 2002
(As Restated, (As Restated, See Note O) See Note O)Operating Activities:
Net income $ 1,669 $ 6,985 $ 17,798Adjustments to reconcile net income to net cash provided
by operating activities: Cumulative effect of change in accounting principle, net of tax — 510 —Depreciation and amortization 4,533 5,155 4,898(Gain) loss on disposition of assets (184) 75 68Loss on impairment of assets 535 382 —Deferred income taxes (1,718) 823 75Changes in operating assets and liabilities:
Accounts receivable, net 2,620 24,256 7,071Costs and estimated earnings in excess of billings on uncompleted contracts 12,353 654 3,336Inventories 2,193 1,498 1,867Prepaid expenses and other current assets (728) (147) 110Other assets 72 (442) (436)Accounts payable and income taxes payable (704) 551 (2,907)Accrued liabilities 1,640 (4,503) 659Billings in excess of costs and estimated earnings on uncompleted contracts 1,958 (262) (1,380)Deferred compensation 491 364 370Other liabilities 178 568 137
Net cash provided by operating activities 24,908 36,467 31,666 Investing Activities:
Proceeds from sale of fixed assets 1,766 — —Purchases of property, plant and equipment (6,472) (4,541) (13,872)Purchase of additional interest in consolidated subsidiary (66) — —Sales of marketable securities 2,773 — —Purchases of marketable securities (1,018) (5,763) —
Net cash used in investing activities (3,017) (10,304) (13,872)
Financing Activities: Borrowings on revolving line of credit 516 — 14,450Repayments on revolving line of credit (516) — (23,450)Borrowing on long-term debt and capital lease obligations — 103 —Repayments of long-term debt and capital lease obligations (458) (4,754) (1,704)Proceeds from issuance of stock — 273 —Proceeds from exercise of stock options 1,038 641 752
Net cash provided by (used in) financing activities 580 (3,737) (9,952) Net increase in cash and cash equivalents 22,471 22,426 7,842Cash and cash equivalents at beginning of year 36,788 14,362 6,520
Cash and cash equivalents at end of year $ 59,259 $ 36,788 $ 14,362 Supplemental Disclosures of Cash Flow Information:
Cash paid during the period for:Interest $ 134 $ 423 $ 566
Income taxes $ 1,930 $ 5,252 $ 8,200
Noncash Investing and Financing Activities: Change in fair value of interest rate swap, net of $0, $49 and $33
income taxes, respectively $ — $ 87 $ 53
Change in fair value of marketable securities, net of $85 and $64 income taxes, respectively $ 207 $ (118) $ —
Issuance of common stock for deferred directors’ fees $ 75 $ — $ —
Assets acquired under capital lease obligations $ 200 $ — $ —
The accompanying notes are an integral part of these consolidated financial statements.

28
POWELL INDUSTRIES, INC. AND SUBSIDIARIES NOTES TO CONSOLIDATED FINANCIAL STATEMENTS
A. BUSINESS AND ORGANIZATIONWe develop, design, manufacture and service equipment and sys-tems for the management and control of electrical energy and other critical processes. Headquartered in Houston, Texas, we serve the transportation, environmental, industrial and utility industries.
Powell Industries, Inc. (“we,” “us,” “our,” “Powell” or the “Company”) was incorporated in the state of Delaware in 2004 as a successor to a Nevada company incorporated in 1968. The Nevada corporation was the successor to a company founded by William E. Powell in 1947, which merged into the Company in 1977. Our major subsidiaries, all of which are wholly owned, include: Powell Electrical Systems, Inc.; Transdyn Controls, Inc.; and Powell Industries International, Inc.
B. SUMMARY OF SIGNIFICANT ACCOUNTING POLICIESPrinciples of ConsolidationThe consolidated financial statements include the accounts of Powell Industries, Inc. and its wholly owned subsidiaries. The financial position and results of operation of our Singapore joint venture, in which we acquired a majority ownership on August 1, 2004, have been consolidated since August 1, 2004. As a result of this consoli-dation, we recorded minority interest on our balance sheet for our joint-venture partner’s share of equity. All significant intercompany accounts and transactions are eliminated in consolidation.
Use of EstimatesThe preparation of financial statements in conformity with account-ing principles generally accepted in the United States requires management to make estimates and assumptions that affect the re-ported amounts of assets and liabilities and disclosure of contingent assets and liabilities at the date of the consolidated financial state-ments and the reported amounts of revenues and expenses during the periods reported. The amounts we record for insurance claims, warranties, legal and other contingent liabilities require judgments regarding the amount of expenses that will ultimately be incurred. We use past experience and history, as well as the specific circum-stances surrounding these contingent liabilities, in evaluating the amount of liability that should be recorded. Actual results could dif-fer from our estimates.
Cash and Cash EquivalentsCash and cash equivalents include cash on hand, deposits with banks and highly liquid investments with original maturities of three months or less.
Marketable SecuritiesMarketable securities consist of investment-grade corporate bonds that are classified as available-for-sale. These investments are car-ried at fair value, with unrealized gains and losses, net of related tax effects, included in other comprehensive income. The maturity dates of these investments as of October 31, 2004, vary from one to nine years.
Fair Value of Financial InstrumentsFinancial instruments include short-term investments, marketable securities and debt obligations. Due to the short-term nature of the investments, the book value is representative of their fair value. The carrying value of debt approximates fair value as interest rates are indexed to LIBOR or the bank’s prime rate. Accounts Receivable and Market RiskAccounts receivable are stated net of allowances for doubtful accounts. We maintain and continually assess the adequacy of an allowance for doubtful accounts representing our estimate for losses resulting from the inability of our customers to pay amounts due to us. This estimated allowance is based on historical experience of uncollected accounts, the level of past-due accounts, the overall level of outstanding accounts receivable, information about specific customers with respect to their inability to make payments and ex-pectations of future conditions that could impact the collectibility of accounts receivable. However, future changes in our customers’ operating performance and cash flows or in general economic conditions could have an impact on their ability to fully pay these amounts, which could have a material impact on our operating re-sults. Our domestic receivables are not collateralized. However, we utilize letters of credit to secure payment on sales outside of the U.S. and Canada. At October 31, 2004 and 2003, accounts receiv-able included retention amounts of $7.5 million and $6.2 million, respectively. Retention amounts are in accordance with applicable provisions of engineering and construction contracts and become due upon completion of contractual requirements. Approximately $0.5 million of the retained amount at October 31, 2004, is expect-ed to be collected subsequent to October 31, 2005. No customers accounted for 10% or more of our consolidated accounts receivable balances as of fiscal year ends 2004 and 2003.
Costs and Estimated Earnings in Excess of Billings on Uncompleted ContractsCosts and estimated earnings in excess of billings on uncompleted contracts arise when revenues are recorded on a percentage-of-completion basis but cannot be invoiced under the terms of the contract. Such amounts are invoiced upon completion of contrac-tual milestones.

29
Costs and estimated earnings in excess of billings on uncompleted contracts also include certain costs associated with unapproved change orders. These costs are included when change order ap-proval is probable. Amounts are carried at the lower of cost or net realizable value. No profit is recognized on costs incurred until change order approval is obtained. We also include claims for extra work or changes in scope of work to the extent of costs incurred in contract revenues when we believe collection is probable. At October 31, 2004 and 2003, we have included in contract costs approximately $1.9 million and $2.9 million, respectively, relating to commercial contract claims whose final settlement is subject to future determination through negotiations or other procedures that had not been completed. As of October 31, 2004, we anticipate that $1.5 million of the claims included in contract costs will not be settled within one year. The amounts recorded involve the use of judgments and estimates; thus, actual recoverable amounts could differ from original assumptions.
Assets and liabilities related to costs and estimated earnings in excess of billings on uncompleted contracts as well as billings in excess of costs and estimated earnings on uncompleted contracts have been classified as current and noncurrent under the operating cycle concept whereby all contract-related items are regarded as current regardless of whether cash will be received or paid within a 12-month period.
InventoriesInventories are stated at the lower of cost or market using first-in, first-out (FIFO) or weighted-average methods and include the cost of material, labor and manufacturing overhead. We use estimates in determining the level of reserves required to state inventory at the lower of cost or market. Our estimates are based on market activity levels, production requirements, the physical condition of products and technological innovation. Changes in any of these factors may result in adjustments to the carrying value of inventory.
Property, Plant and EquipmentProperty, plant and equipment are stated at cost and are depreci-ated using the straight-line method over the estimated useful lives of the assets. Expenditures for repairs and maintenance are charged to expense when incurred. Expenditures for major renewals and improvements which extend the useful lives of existing equipment are capitalized and depreciated. Upon retirement or disposition of property, plant and equipment, the cost and related accumulated depreciation are removed from the accounts and any resulting gain or loss is recognized in the consolidated statement of operations.
Impairment of Long-Lived AssetsWe evaluate the recoverability of the carrying amount of long-lived assets whenever events or changes in circumstances indicate that the carrying value of an asset may not be fully recoverable. The review for impairment of long-lived assets and goodwill takes into account estimates of future cash flows. Our estimates of future cash flows are based upon budgets and longer-range plans. These budgets and plans are used for internal purposes and are also the basis for communication with outside parties about future business trends. While we believe the assumptions we use to estimate future cash flows are reasonable, there can be no assurance that the ex-pected future cash flows will be realized. As a result, impairment charges that possibly should have been recognized in earlier pe-riods may not be recognized until later periods if actual cash flows deviate unfavorably from earlier estimates. For assets held for sale or disposal, the fair value of the asset is measured using quoted market prices or an estimation of net realizable value. Based on general economic conditions and conditions specific to our indus-try, the ultimate amounts realized on assets held for sale may differ materially from their currently estimated realizable values.
Intangible AssetsWe adopted SFAS No. 142, “Goodwill and Other Intangible Assets,” on November 1, 2002. This statement requires that goodwill and other intangible assets with indefinite useful lives are no longer am-ortized but instead requires a test for impairment to be performed annually, or immediately if conditions indicate that impairment could exist. Intangible assets with definite useful lives are amortized over their estimated useful lives. For additional information regarding our intangible assets, see Note I.
Income TaxesWe account for income taxes in accordance with SFAS No. 109, “Accounting for Income Taxes.” Under SFAS No. 109, deferred in-come tax assets and liabilities are computed based on the difference between the financial statement and income tax bases of assets and liabilities using enacted tax rates. Under this standard, the effect on deferred income taxes of a change in tax rates is recognized in income in the period that the tax rate changes.

30
Revenue RecognitionOur revenues are generated from the engineering and manufacturing of custom products. We recognize revenues under both the com-pleted contract method and the percentage-of-completion method, depending upon the duration and the scope of the project. At the onset of each project, the size, scope and duration of the contract is reviewed to determine the appropriate revenue recognition method based upon company policy and applicable accounting standards. Due to the long-term and fixed-price nature of the projects in the Process Control Systems segment, all revenues are recorded using percentage-of-completion. However, projects in the Electrical Power Products segment vary widely; thus, both the completed contract and percentage-of-completion methods are used.
Under the completed contract method, revenues are recognized upon the transfer of title, which is generally at the time of shipment or delivery (depending upon the terms of the contract), when all sig-nificant contractual obligations have been satisfied, the price is fixed or determinable, and collectibility is reasonably assured. We use shipping documents and customer acceptance, when applicable, to verify the transfer of title to the customer. We assess whether the price is fixed or determinable based on the payment terms associ-ated with the transaction and whether the sales price is subject to refund or adjustment. Collectibility is assessed based on the credit-worthiness of the customer assessed through credit verification, the customer’s payment history and other relevant factors.
Under the percentage-of-completion method, revenues are recog-nized as work is performed, based on the estimated completion to date calculated by multiplying the total contract price by percentage of performance to date, based on total labor dollars or hours in-curred to date to the total estimated labor dollars or hours estimated at completion. Application of the percentage of completion method of accounting requires the use of estimates of costs to be incurred for the performance of the contract. Contract costs include all direct material and labor costs and those indirect costs related to contract performance, such as indirect labor, supplies, tools, repairs and all costs associated with operation of equipment (excluding deprecia-tion). The cost estimation process is based upon the professional knowledge and experience of the company’s engineers, project managers and financial professionals. Factors that are considered in estimating the work to be completed and ultimate contract recov-ery include the availability and productivity of labor, the nature and complexity of the work to be performed, the effect of change orders, the availability of materials, the effect of any delays in performance and the recoverability of any claims. Changes in job performance, job conditions, estimated profitability and final contract settlements may result in revisions to costs and income, and their effects are recognized in the period in which the revisions are determined. Whenever revisions of estimated contract costs and contract values
indicate that the contract costs will exceed estimated revenues, thus creating a loss, a provision for the total estimated loss is recorded in that period. WarrantiesWe provide for estimated warranty costs at the time of sale, based upon historical rates applicable to individual product lines. In addi-tion, specific provisions are made when the costs of such warranties are expected to exceed accruals. Our standard terms and condi-tions of sale include a warranty for parts and service for the earlier of 18 months from the date of shipment or 12 months from the date of initial operations.
Research and Development ExpenseResearch and development costs are charged to expense as in-curred. These costs are included as a component of selling, gen-eral and administrative expenses on the consolidated statements of operations. Such amounts were $3.5 million, $3.6 million and $3.4 million in fiscal years 2004, 2003 and 2002, respectively.
Foreign CurrencyAssets and liabilities of our foreign joint-venture operation, located in Singapore, are translated at year-end exchange rates, and revenues and expenses are translated at average exchange rates prevailing during the period. Translation adjustments are recorded as other comprehensive income, a separate component of stockholders’ equi-ty, in the accompanying consolidated financial statements. Gains and losses from foreign currency transactions are included in earnings.
Stock-Based CompensationIn accordance with the provisions of SFAS No. 123, “Accounting for Stock-Based Compensation,” we have elected to account for our stock-based employee compensation plans under the intrinsic-value method established by Accounting Principles Board (“APB”) Opinion No. 25, “Accounting for Stock Issued to Employees.” Under APB No. 25, no compensation expense is recorded when the exer-cise price of the employee stock option is greater than or equal to the market price of the common stock on the grant date.

31
If compensation expense for our stock option plans had been de-termined based on the fair value at the grant date for awards con-sistent with the provisions of SFAS No. 123, our net income and earnings per-share would have been as follows:
The effects of applying SFAS No. 123 in the pro forma disclosure above may not be indicative of future amounts as additional awards in future years are anticipated. The fair value of each option grant is estimated on the date of grant using the Black-Scholes option-pricing model with the following assumptions:
Comprehensive IncomeAccumulated other comprehensive income, which is included as a component of stockholders’ equity, includes unrealized gains or losses on available-for-sale marketable securities and derivative instruments and currency translation adjustments in foreign con-solidated subsidiaries.
During 2004, we sold two of our corporate bonds that were classified as available-for-sale securities. We recognized the gain on the sale of these securities in our consolidated statement of operations, and the unrealized gain shown in other comprehensive income for the year ended October 31, 2004, was affected by this reclassification adjustment as follows (in thousands):
New Accounting StandardsIn November 2003, the Emerging Issues Task Force (EITF) reached a consensus opinion on EITF 03-1, “The Meaning of Other-Than-Temporary Impairment and Its Application to Certain Investments.” EITF 03-1 provides guidance on the new requirements for other-than-temporary impairment and its application to debt and mar-ketable equity investments that are accounted for under SFAS No. 115. The new requirements are effective for fiscal years ending after December 15, 2003. The adoption of EITF 03-1 during the quarter ended January 31, 2004, had no impact on our consolidated finan-cial position, results of operations or cash flows. In March 2004, the EITF reached a consensus opinion on EITF 03-06, “Participating Securities and the Two-Class Method under FASB Statement No. 128, Earnings Per Share.” EITF 03-06 provides guidance in applying the two-class method of calculating earnings per-share for companies that have issued securities other than common stock that contractually entitle the holder to participate in any dividends declared and earnings of the company. The opinion defines what constitutes a participating security and how to apply the two-class method of calculating earnings per-share to those securities. EITF 03-06 became effective during the quarter ended July 31, 2004, and the adoption did not have an impact on our calculation of earnings per-share.
In May 2004, the Financial Accounting Standards Board (FASB) issued FASB Staff Position (FSP) 106-2, “Accounting and Disclosure Requirements Related to the Medicare Prescription Drug, Improve-ment, and Modernization Act of 2003,” to provide accounting and disclosure guidance for employers that sponsor postretirement health care plans that provide prescription drug benefits. The Medi-care Prescription Drug, Improvement, and Modernization Act of 2003 (the “Act”) was signed into law on December 8, 2003. The Act introduces a prescription drug benefit under Medicare as well as a federal subsidy to sponsors of retiree health care benefit plans that provide a benefit that is at least actuarially equivalent to Medicare Part D. The new requirements are effective for interim periods
Years Ended October 31, 2004 2003 2002
Net income, as reported $ 1,669 $ 6,985 $ 17,798Less: Total stock-based employee compensation expense determined under fair value based method for all awards, net of related tax effects (802) (745) (834)
Pro forma net income $ 867 $ 6,240 $ 16,964
Basic earnings per-share: As reported $ 0.16 $ 0.66 $ 1.69 Pro forma $ 0.08 $ 0.59 $ 1.61Diluted earnings per-share: As reported $ 0.15 $ 0.65 $ 1.66 Pro forma $ 0.08 $ 0.58 $ 1.59
2004 2003 2002
Expected life of options 7 years 7 years 7 yearsRisk-free interest rate 4.03% 3.98% 3.45%Expected dividend yield 0.00% 0.00% 0.00%Expected stock price volatility 37.28% 38.51% 38.15%
Unrealized holding gains arising during period $ 189Less: Reclassification adjustment for gains included
in net income (34)
Net unrealized gains on marketable securities 155

32
beginning after June 15, 2004. We provide postretirement health benefits that include prescription drug benefits, but this benefit ends when the employee reaches the age of 65. The adoption of FSP 106-2 during the quarter ended October 31, 2004, had no impact on our postretirement benefit cost.
In November 2004, the FASB issued SFAS No. 151, “Inventory Costs, an Amendment of ARB No. 43, Chapter 4.” The amendments made by SFAS No. 151 clarify that abnormal amounts of idle facil-ity expense, freight, handling costs and wasted materials (spoilage) should be recognized as current-period charges and require the allocation of fixed production overheads to inventory based on the normal capacity of the production facilities. The guidance is effective for inventory costs incurred during fiscal years beginning after November 23, 2004. We do not believe the adoption of SFAS No. 151 will have a material impact on our consolidated financial position, results of operations or cash flows.
In December 2004, the FASB issued SFAS No. 123 (revised 2004), “Share-Based Payment.” SFAS No. 123(R) will require that the compensation cost relating to share-based payment transactions be recognized in financial statements. That cost will be measured based on the fair value of the equity or liability instruments issued. SFAS No. 123(R) covers a wide range of share-based compensation arrangements, including share options, restricted share plans, per-formance-based awards, share appreciation rights and employee share purchase plans. SFAS No. 123(R) replaces FASB Statement No. 123, “Accounting for Stock-Based Compensation,” and super-sedes APB Opinion No. 25, “Accounting for Stock Issued to Em-ployees.” SFAS No. 123, as originally issued in 1995, established as preferable a fair value-based method of accounting for share-based payment transactions with employees. However, that Statement permitted entities the option of continuing to apply the guidance in APB Opinion No. 25, as long as the footnotes to financial statements disclosed what net income would have been had the preferable fair value-based method been used. Public entities will be required to apply SFAS No. 123(R) as of the first interim or annual reporting period that begins after June 15, 2005. We are in the process of eval-uating the impact the adoption of SFAS No. 123(R) will have on our consolidated financial position, results of operations and cash flows.
C. STOCK-BASED COMPENSATIONWe provide an employee stock option plan in which 2.1 million shares of our common stock would be made available through an in-centive program for certain employees. The awards available under the plan include both stock options and stock grants, and are subject to certain conditions and restrictions as determined by the Com-pensation Committee of the Board of Directors. There were no stock grants during fiscal years 2004, 2003 and 2002. Stock options granted to the employees are nonqualified and are granted at an ex-
ercise price equal to the fair market value of the common stock on the date of grant. Generally, options granted have an expiration date of seven years from the grant date and will vest in increments of 20 percent per year over a five-year period. Pursuant to the stock op-tion plan, option holders who exercise their options and hold the un-derlying shares of common stock for five years vest in a stock grant equal to 20 percent of the original option shares. While restricted until the expiration of five years, the stock grant is considered issued at the date of the stock option exercise and included in earnings per-share. There were 154,232 shares available to be granted under this plan as of October 31, 2004. In 2002, stockholders approved the Non-Employee Director Stock Option Plan for the benefit of members of the Board of Directors of the Company who, at the time of their service, are not employees of the Company or any of its affiliates. Annually, each eligible Director who is continuing to serve as a Director, will receive a grant of an option to purchase 2,000 shares of our Common Stock. The total number of shares of our common stock available under this plan was 35,117 as of October 31, 2004. Stock options granted to the Di-rectors are nonqualified and are granted at an exercise price equal to the fair market value of the common stock at the date of grant. Generally, options granted have expiration terms of seven years from the date of grant and will vest in full one year from the grant date.
Stock option activity (number of shares) for the Company during fiscal years 2004, 2003 and 2002 was as follows:
Weighted Stock Average Options Exercise Price
Outstanding at October 31, 2001 834,300 $ 13.51 Granted 26,883 23.52 Exercised (118,970) 8.16 Forfeited (22,040) 11.51
Outstanding at October 31, 2002 720,173 $ 14.82
Granted 320,700 15.10 Exercised (53,510) 12.02 Forfeited (600) 15.81
Outstanding at October 31, 2003 986,763 $ 15.06
Granted 27,000 16.38 Exercised (82,986) 12.47 Forfeited (103,384) 15.91
Outstanding at October 31, 2004 827,393 $ 15.26

33
The following table summarizes information about stock options outstanding as of October 31, 2004:
Outstanding Exercisable Number Outstanding Weighted Average Weighted Average Number Exercisable Weighted Average Range of Exercise Prices at 10/31/04 Remaining Contractual Life Exercise Price at 10/31/04 Exercise Price
$ 8.44 - $ 8.50 150,410 1.9 years $ 8.50 150,410 $ 8.50 13.06 - 15.10 304,783 5.6 15.09 66,223 15.07 16.30 - 17.85 348,200 3.7 17.74 195,360 17.85 23.48 - 27.10 24,000 4.3 23.91 20,000 23.94
Total Options 827,393 4.1 15.26 431,993 14.45
The weighted average fair value of options granted was $7.63, $7.16 and $10.83 per option for the fiscal years ended October 31, 2004, 2003 and 2002, respectively.
D. EARNINGS PER-SHAREThe following table sets forth the computation of basic and diluted earnings per-share (in thousands, except per-share data):
Years Ended October 31, 2004 2003 2002
Numerator:
Income from continuing operations $ 1,669 $ 7,495 $ 17,798Cumulative effect of change in accounting principle, net of tax — (510) —
Net income $ 1,669 $ 6,985 $ 17,798 Denominator:
Denominator for basic earnings per-share-weighted average shares 10,688 10,591 10,511Dilutive effect of stock options 86 90 187
Denominator for diluted earnings per-share-adjusted weighted average shares with assumed conversions 10,774 10,681 10,698
Basic Earnings Per-Share:
Earnings from continuing operations $ 0.16 $ 0.71 $ 1.69Cumulative effect of change in accounting principle — (0.05) —
Net earnings $ 0.16 $ 0.66 $ 1.69
Diluted Earnings Per-Share:
Earnings from continuing operations $ 0.15 $ 0.70 $ 1.66Cumulative effect of change in accounting principle — (0.05) —
Net earnings $ 0.15 $ 0.65 $ 1.66
For the years ended October 31, 2004, 2003 and 2002, options to purchase approximately 352,000, 380,000 and 26,000 shares, respec-tively, were excluded from the computation of diluted earnings per-share because the options’ exercise prices were greater than the average market price of our common stock.

34
E. DETAIL OF SELECTED BALANCE SHEET ACCOUNTSActivity in our allowance for doubtful accounts receivable account consists of the following (in thousands):
October 31, 2004 2003
Balance at beginning of period $ 1,283 $ 1,209Adjustments to the allowance (498) 277Deductions for uncollectible accounts
written off, net of recoveries (168) (203)
Balance at end of period $ 617 $ 1,283
Activity in our accrued product warranty account consists of the following (in thousands):
October 31, 2004 2003
Balance at beginning of period $ 1,929 $ 2,123Additions to the accrual 1,387 1,749Deductions for warranty charges (1,771) (1,943)
Balance at end of period $ 1,545 $ 1,929
The components of inventories are summarized below (in thou-sands):
October 31, 2004 2003
Raw materials, parts and subassemblies $ 9,167 $ 12,122
Work-in-progress 6,165 5,938
Total inventories $ 15,332 $ 18,060
The components of costs and estimated earnings on uncompleted contracts (in thousands):
October 31, 2004 2003
Costs incurred on uncompleted contracts $ 271,442 $ 283,750
Estimated earnings 49,691 49,676
321,133 333,426Less: Billings to date 316,485 314,468
$ 4,648 $ 18,958
Included in accompanying balance sheets under the following captions:
Costs and estimated earnings in excess of billings on uncompleted contracts $ 19,822 $ 32,174
Billings in excess of costs and estimated earnings on uncompleted contracts (15,174) (13,216)
$ 4,648 $ 18,958
Property, plant and equipment are summarized below (in thousands):
Range of
October 31, 2004 2003 Asset Lives
Land $ 4,720 $ 5,075 —Buildings and improvements 39,629 36,881 3-39 YearsMachinery and equipment 29,804 33,392 3-15 YearsFurniture and fixtures 2,752 2,964 3-10 YearsConstruction in process 5,336 7,128 —
82,241 85,440 Less-accumulated
depreciation (37,200) (41,442)
Total property, plant and equipment, net $ 45,041 $ 43,998
Included in property and equipment are assets under capital lease of $325,000 and $177,000 at October 31, 2004 and 2003, with related accumulated depreciation of $80,000 and $74,000, respec-tively. Depreciation expense, including the depreciation of capital leases, was $4.3 million, $5.0 million and $4.7 million for fiscal years 2004, 2003 and 2002, respectively.

35
F. EMPLOYEE BENEFIT PLANSWe have a defined employee contribution 401(k) plan for substan-tially all of our employees. We match 50% of employee contributions up to an employee contribution of 6 percent of each employee’s sal-ary. We recognized expenses of $1.2 million, $1.4 million and $1.4 million in fiscal years 2004, 2003 and 2002, respectively, under this plan.
We have established an employee stock ownership plan (“ESOP”) for the benefit of substantially all full-time employees other than employees covered by a collective-bargaining agreement to which the ESOP has not been extended by any agreement or action of ours. The ESOP initially purchased 793,525 shares of the Company’s common stock from a major stockholder. At October 31, 2004 and 2003, there were 606,912 and 634,629 shares in the trust with 375,858 and 358,712 shares allocated to participants, respective-ly. The funding for this plan was provided through a loan from the Company of $4.5 million. This loan will be repaid by the ESOP over a twenty-year period, with equal payments of $424,000 per year including interest at 7 percent. We recorded deferred compensation as a contra-equity account for the amount loaned to the ESOP in the accompanying consolidated balance sheets. We are required to make annual contributions to the ESOP to enable it to repay its loan to us. The deferred compensation account is amortized as compensation expense over twenty years as employees earn their shares for services rendered. The loan agreement also provides for prepayment of the loan if we elect to make any additional contribu-tions. Compensation expense for fiscal years 2004, 2003 and 2002 was $297,000, $277,000 and $252,000, respectively, and interest income for fiscal years 2004, 2003 and 2002 was $128,000, $148,000 and $166,000, respectively. The receivable from the ESOP is recorded as a reduction from stockholders’ equity and the allocated and unallocated shares of the ESOP are treated as out-standing common stock in the computation of earnings per-share. As of October 31, 2004 and 2003, the remaining ESOP receivable was $1.5 million and $1.8 million, respectively.
In October 1985 and February 1987, we entered into Executive Benefit Agreements with several key officers and employees. Three participants remain in this plan, which provides for payments in ac-cordance with a predetermined plan upon retirement or death. We recognize the cost of this plan over the projected years of service of the participant. We have insured the lives of these key employees to assist in the funding of the deferred compensation liability.
In November 1992, we established a plan to extend to retirees health benefits which are available to active employees under our existing health plans. Participants became eligible for retiree health care benefits when they retired from active service at age 55 with a minimum of ten years of service. Generally, the health plans paid a
stated percentage of medical and dental expenses reduced for any deductible and co-payment. These plans are unfunded. Medical coverage may be continued by the retired employee up to age 65 at the average cost to the Company of active employees. At the age of 65, when the employee became eligible for Medicare, the benefits provided by the Company were to be reduced by the amount provided by Medicare and the cost to the retired employee would be reduced to 50 percent of the average cost to the Company of active employees.
In 1994, we modified our postretirement benefits to provide retiree health care benefits to only current retirees and active employees who were eligible to retire by December 31, 1999. Participants eligible for such benefits were required to pay between 20 percent and 100 percent of our average cost of benefits based on years of service. In addition, benefits would end upon the employee’s attainment of age 65. The effect of these modifications significantly reduced our postretirement benefit cost and accumulated benefit obligation.
The plan was amended effective January 1, 2000, to provide cover-age for employees age 55 or more but less than 65 who retire on or after January 1, 2000, with at least 10 years of service. The retiree is required to pay the full retiree cost less the amount paid by the Com-pany, which is a percentage of the year 2000 cost. Effective as of the November 1, 2002, valuation date, retirees are required to pay the CO-BRA rate, instead of the full retiree cost, less the Company’s subsidy.

36
For the year ended October 31, 2004, the measurement of postre-tirement benefit expense was based on assumptions used to value the postretirement benefit liability as of November 1, 2003, our measurement date. The following table illustrates the components of net periodic benefit expense, funded status, the change in funded status and the change in accumulated benefit obligation of the postretirement benefit plans (in thousands):
It is assumed that 70% of employees who are eligible will elect medical coverage, decreasing to 40% in 2014. The assumed health care cost trend measuring the accumulated postretirement benefit obligation was 9% in fiscal year 2004. This trend is expected to grade down to 5% in fiscal year 2008. If the health care trend rate assumptions were increased or decreased by 1% as of October 31, 2004, the effect of this change on the accumulated postretirement benefit obligation would be approximately $80,000. The effect on the aggregate service and interest cost components of the net pe-riodic postretirement benefit cost from a 1% increase or decrease would be approximately $12,000.
As of October 31, 2004, the cash flow estimates for expected ben-efit payments during each of the next ten years are as follows (in thousands):Years Ending October 31, Expected Benefit Payments
2005 $ 932006 882007 982008 1212009 1332010 through 2014 781
G. LONG-TERM DEBTLong-term debt consists of the following (in thousands):
October 31, 2004 2003
Industrial development revenue bonds, maturing in October 2021, with annual sinking-fund payments of $400,000 $ 6,800 $ 7,200
Capital lease obligations 223 64Other borrowings 77 95
Subtotal long-term debt and capital lease obligations 7,100 7,359
Less current portion (474) (468)
Total long-term debt and capital lease obligations $ 6,626 $ 6,891
October 31, 2004 2003 2002
Components of net periodic postretirement benefit expense:Service cost $ 75 $ 92 $ 20Interest cost 73 106 39Prior service cost 108 121 13Net (gain) loss recognized (26) (3) 2
Net periodic postretirement benefit expense $ 230 $ 316 $ 74
Funded status: Retirees $ 94 $ 166 $ 120Fully eligible active participants 507 659 182Other actual participants 754 898 300
Accumulated postretirement benefit obligation 1,355 1,723 602
Less unrecognized balances: Prior service cost 822 1,066 129Net actuarial (gain) loss (544) (149) (57)
Net amount recognized $ 1,077 $ 806 $ 530
Changes in accumulated postretirement benefit obligation:Balance at beginning of year $ 1,723 $ 602 $ 494Service cost 75 92 20Interest cost 73 106 39Loss due to plan change — 1,058 —Actuarial (gain) loss (316) (95) 74Curtailment (gain) (150) — —Benefits paid (50) (40) (25)
Balance at end of year $ 1,355 $ 1,723 $ 602
Fair value of plan assets — — —
Weighted average assumptions: Discount rate 5.8% 6.0% 6.5%

37
We borrowed $8 million in October 2001 through a loan agreement funded with proceeds from tax-exempt industrial development rev-enue bonds (“Bonds”). These Bonds were issued by the Illinois De-velopment Finance Authority and were used for the completion of our Northlake, Illinois, facility. Pursuant to the Bond issuance, a re-imbursement agreement between the Company and a major domes-tic bank required an issuance by the bank of an irrevocable direct-pay letter of credit (“Bond LC”) to the Bonds’ trustee to guarantee payment of the Bonds’ principal and interest when due. The Bond LC periodically changes in amount to equal the outstanding balance of the Bonds and terminates on October 25, 2006. The Bond LC is subject to both early termination and extension provisions customary to such agreements. While the Bonds mature in 2021, the reim-bursement agreement requires annual redemptions of $400,000 beginning on October 25, 2002. A sinking fund is used for the redemption of the Bonds. The Bonds bear interest at a floating rate determined weekly by the Bonds’ remarketing agent, which was the underwriter for the Bonds and is an affiliate of the bank. This interest rate was 1.9% per annum on October 31, 2004.
We have a $15 million revolving line of credit agreement with a major domestic bank, which was amended in October 2004 to extend the maturity date to February 2007. The $15 million revolving line of credit agreement also provides for the issuance of letters of credit. The revolving line of credit allows us to elect an interest rate on amounts borrowed of (1) the bank’s prime rate, which was 4.75% at October 31, 2004, less .5% on the first $5 million and the bank’s prime rate on additional borrowings, or (2) the LIBOR rate, which was 2.3% at October 31, 2004, plus an additional percentage of .75% to 1.25% based on our performance. A fee of .20% to .25% is charged on the unused balance of the line. The agreement contains customary affirmative and negative covenants and requirements to maintain a minimum level of tangible net worth and profitability. The amount available under this agreement is reduced by $3.4 mil-lion for our outstanding letters of credit, which excludes the Bond LC that does not affect the available credit under this agreement. There were no borrowings under this line of credit as of October 31, 2004 or 2003.
Some machinery and equipment used in our manufacturing facili-ties were financed through capital lease agreements. These capital lease agreements are collateralized by the leased property. The capital lease obligations are at a fixed interest rate of 3%.
The annual maturities of long-term debt as of October 31, 2004, are as follows (in thousands):
H. INCOME TAXESThe net deferred income tax asset (liability) is comprised of the following (in thousands):
As of October 31, 2004, the noncurrent deferred income tax asset is included in other assets on the consolidated balance sheet. As of October 31, 2003, the current and noncurrent deferred income tax liabilities are included in other accrued expenses and other liabili-ties, respectively, on the consolidated balance sheet.
Long-Term Year Ending October 31, Debt Maturities Capital Leases Total
2005 $ 419 $ 55 $ 4742006 458 48 5062007 400 50 4502008 400 52 4522009 400 18 418Thereafter 4,800 — 4,800
Total long-term debt maturities $ 6,877 $ 223 $ 7,100
October 31, 2004 2003
Current deferred income taxes: Gross assets $ 3,289 $ 3,459Gross liabilities (2,560) (4,080)
Net current deferred income tax asset (liability) 729 (621)
Noncurrent deferred income taxes: Gross assets 1,757 1,260Gross liabilities (1,145) (1,122)
Net noncurrent deferred income tax asset 612 138
Net deferred income tax asset (liability) $ 1,341 $ (483)

38
The tax effect of temporary differences between GAAP accounting and federal income tax accounting creating deferred income tax as-sets and liabilities are as follows (in thousands):
The components of the income tax provision (benefit) consist of the following (in thousands):
A reconciliation of the statutory U.S. income tax rate and the effec-tive income tax rate, as computed on earnings before income tax provision in each of the three years presented in the Consolidated Statements of Operations is as follows:
Our (benefit) provision for income taxes reflects an effective tax rate on earnings before income taxes of (21%) in fiscal 2004 compared to 45% in fiscal 2003. During 2004, we recorded several nonrecur-ring tax adjustments related to the following items:
a) A $363,000 benefit was recorded primarily for the benefit of revised extraterritorial income exclusion amounts for the years ended 2002 and 2003. This benefit was derived by calculating the extraterritorial income exclusion amount on a transaction by transaction basis in 2004, as opposed to an aggregate basis as originally estimated.
b) A $268,000 valuation allowance related to capital losses was released in 2004. We entered into an agreement in 2004 to sell a capital asset that will trigger enough capital gain to utilize the capital loss carryforward; and
c) We released $200,000 of state income tax reserve in 2004 due to acceptance by certain state taxing authorities of voluntary disclo-sure agreements in 2004.
Without these adjustments, our 2004 effective tax rate would have been 40%.
I. GOODWILL AND OTHER INTANGIBLE ASSETSEffective November 1, 2002, we adopted SFAS No. 142, “Goodwill and Other Intangible Assets.” Under the new rules, goodwill and other intangible assets with indefinite useful lives are no longer subject to amortization. As a result, we discontinued the amortization of goodwill beginning November 1, 2002, and the fiscal year 2003 results were favorably impacted by this reduction in amortization expense by $90,000, net of $53,000 taxes, or $0.01 per diluted share. The statement requires a test for impairment to be performed annually, or immediately if conditions indicate that impairment could exist. Intangible assets with definite useful lives will continue to be amortized over their estimated useful lives.
Upon adoption, we estimated the fair value of our reporting units using a present value method that discounted estimated future cash flows. The cash flow estimates incorporated assumptions on future cash flow growth, terminal values and discount rates. Because the fair value of some reporting units was below their carrying value, application of SFAS No. 142 required us to complete the second step of the goodwill impairment test and compare the implied fair value of each reporting unit’s goodwill with the carrying value. As a result of completing the impairment test, we recorded an impair-ment charge of $510,000, net of $285,000 taxes, to write off the impaired goodwill amounts as a cumulative effect of a change in accounting principle in the first quarter of 2003. We recorded an impairment charge of $380,000, net of $214,000 taxes, to write off the full value of goodwill in our Process Control Systems segment. In our Electrical Power Products segment, we recorded an impairment
October 31, 2004 2003
Allowance for doubtful accounts $ 232 $ 499Reserve for accrued employee benefits 881 757Warranty reserves 581 725Uncompleted long-term contracts (2,560) (4,080)Depreciation and amortization (441) (1,046)Deferred compensation 656 605Postretirement benefits liability 354 299Accrued legal 357 188Uniform capitalization and inventory 1,114 1,289Software development costs (494) —Deferred rent 167 175Other 494 106
Net deferred income tax asset (liability) $ 1,341 $ (483)
Years Ended October 31, 2004 2003 2002
Current: Federal $ 1,318 $ 3,527 $ 9,865State 186 1,970 541
Deferred: (1,786) 640 75
Total income tax provision $ (282) $ 6,137 $ 10,481
Years Ended October 31, 2004 2003 2002
Statutory rate 34 % 34 % 35 %Revised state tax exposure (15 ) — —State income taxes, net of federal benefit 5 10 1Release of capital loss valuation allowance (20 ) — —Federal extraterritorial income exclusion (27 ) — —Nontaxable interest income (8 ) — —Other permanent tax items 8 — —Other 2 1 1
Effective rate (21 )% 45 % 37 %
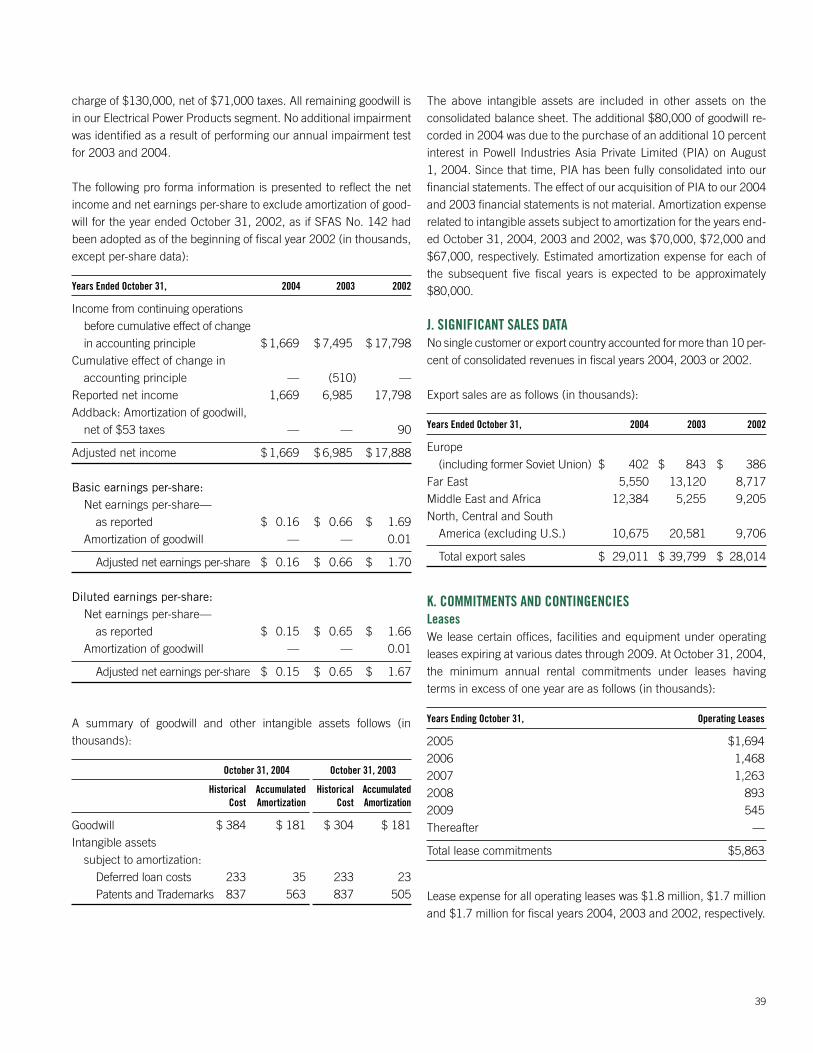
39
charge of $130,000, net of $71,000 taxes. All remaining goodwill is in our Electrical Power Products segment. No additional impairment was identified as a result of performing our annual impairment test for 2003 and 2004.
The following pro forma information is presented to reflect the net income and net earnings per-share to exclude amortization of good-will for the year ended October 31, 2002, as if SFAS No. 142 had been adopted as of the beginning of fiscal year 2002 (in thousands, except per-share data):
A summary of goodwill and other intangible assets follows (in thousands):
The above intangible assets are included in other assets on the consolidated balance sheet. The additional $80,000 of goodwill re-corded in 2004 was due to the purchase of an additional 10 percent interest in Powell Industries Asia Private Limited (PIA) on August 1, 2004. Since that time, PIA has been fully consolidated into our financial statements. The effect of our acquisition of PIA to our 2004 and 2003 financial statements is not material. Amortization expense related to intangible assets subject to amortization for the years end-ed October 31, 2004, 2003 and 2002, was $70,000, $72,000 and $67,000, respectively. Estimated amortization expense for each of the subsequent five fiscal years is expected to be approximately $80,000.
J. SIGNIFICANT SALES DATANo single customer or export country accounted for more than 10 per-cent of consolidated revenues in fiscal years 2004, 2003 or 2002.
Export sales are as follows (in thousands):
K. COMMITMENTS AND CONTINGENCIESLeasesWe lease certain offices, facilities and equipment under operating leases expiring at various dates through 2009. At October 31, 2004, the minimum annual rental commitments under leases having terms in excess of one year are as follows (in thousands):
Lease expense for all operating leases was $1.8 million, $1.7 million and $1.7 million for fiscal years 2004, 2003 and 2002, respectively.
Years Ended October 31, 2004 2003 2002
Income from continuing operations before cumulative effect of change in accounting principle $ 1,669 $ 7,495 $ 17,798
Cumulative effect of change in accounting principle — (510) —
Reported net income 1,669 6,985 17,798Addback: Amortization of goodwill,
net of $53 taxes — — 90
Adjusted net income $ 1,669 $ 6,985 $ 17,888
Basic earnings per-share: Net earnings per-share—
as reported $ 0.16 $ 0.66 $ 1.69Amortization of goodwill — — 0.01
Adjusted net earnings per-share $ 0.16 $ 0.66 $ 1.70
Diluted earnings per-share: Net earnings per-share—
as reported $ 0.15 $ 0.65 $ 1.66Amortization of goodwill — — 0.01
Adjusted net earnings per-share $ 0.15 $ 0.65 $ 1.67
October 31, 2004 October 31, 2003
Historical Accumulated Historical Accumulated Cost Amortization Cost Amortization
Goodwill $ 384 $ 181 $ 304 $ 181Intangible assets
subject to amortization: Deferred loan costs 233 35 233 23Patents and Trademarks 837 563 837 505
Years Ended October 31, 2004 2003 2002
Europe (including former Soviet Union) $ 402 $ 843 $ 386
Far East 5,550 13,120 8,717Middle East and Africa 12,384 5,255 9,205North, Central and South
America (excluding U.S.) 10,675 20,581 9,706
Total export sales $ 29,011 $ 39,799 $ 28,014
Years Ending October 31, Operating Leases
2005 $1,6942006 1,4682007 1,2632008 8932009 545Thereafter —
Total lease commitments $5,863
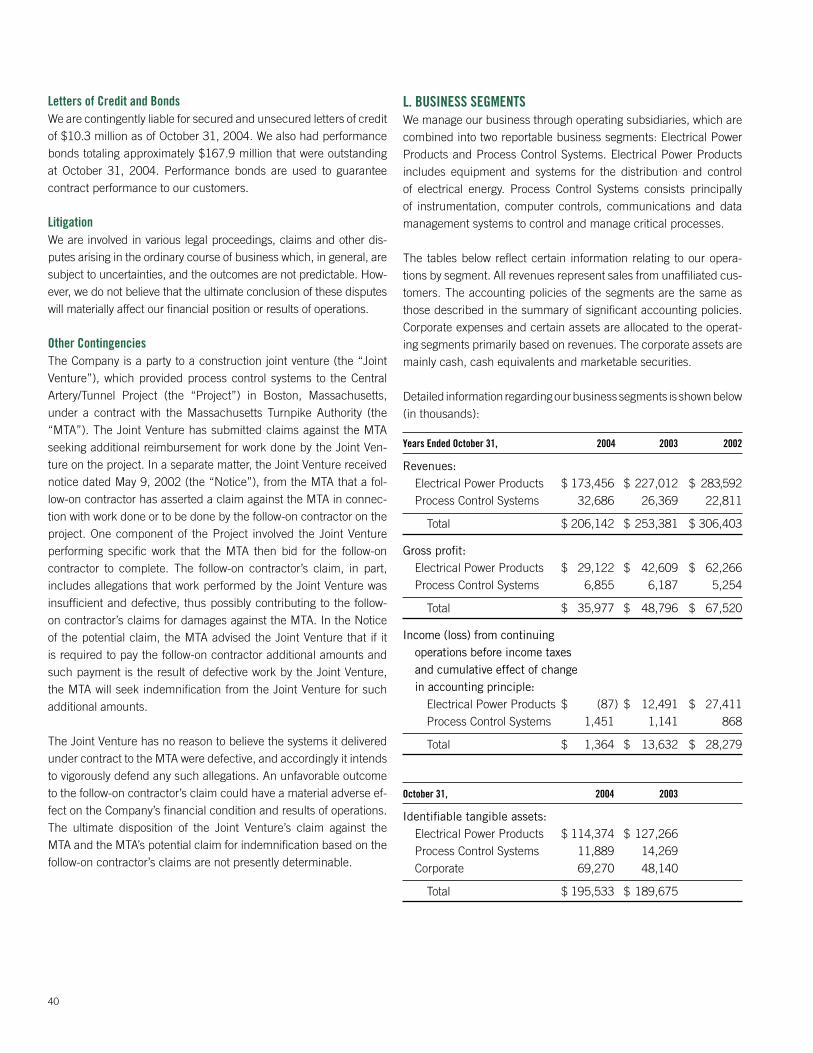
40
Letters of Credit and BondsWe are contingently liable for secured and unsecured letters of credit of $10.3 million as of October 31, 2004. We also had performance bonds totaling approximately $167.9 million that were outstanding at October 31, 2004. Performance bonds are used to guarantee contract performance to our customers.
LitigationWe are involved in various legal proceedings, claims and other dis-putes arising in the ordinary course of business which, in general, are subject to uncertainties, and the outcomes are not predictable. How-ever, we do not believe that the ultimate conclusion of these disputes will materially affect our financial position or results of operations.
Other ContingenciesThe Company is a party to a construction joint venture (the “Joint Venture”), which provided process control systems to the Central Artery/Tunnel Project (the “Project”) in Boston, Massachusetts, under a contract with the Massachusetts Turnpike Authority (the “MTA”). The Joint Venture has submitted claims against the MTA seeking additional reimbursement for work done by the Joint Ven-ture on the project. In a separate matter, the Joint Venture received notice dated May 9, 2002 (the “Notice”), from the MTA that a fol-low-on contractor has asserted a claim against the MTA in connec-tion with work done or to be done by the follow-on contractor on the project. One component of the Project involved the Joint Venture performing specific work that the MTA then bid for the follow-on contractor to complete. The follow-on contractor’s claim, in part, includes allegations that work performed by the Joint Venture was insufficient and defective, thus possibly contributing to the follow-on contractor’s claims for damages against the MTA. In the Notice of the potential claim, the MTA advised the Joint Venture that if it is required to pay the follow-on contractor additional amounts and such payment is the result of defective work by the Joint Venture, the MTA will seek indemnification from the Joint Venture for such additional amounts.
The Joint Venture has no reason to believe the systems it delivered under contract to the MTA were defective, and accordingly it intends to vigorously defend any such allegations. An unfavorable outcome to the follow-on contractor’s claim could have a material adverse ef-fect on the Company’s financial condition and results of operations. The ultimate disposition of the Joint Venture’s claim against the MTA and the MTA’s potential claim for indemnification based on the follow-on contractor’s claims are not presently determinable.
L. BUSINESS SEGMENTSWe manage our business through operating subsidiaries, which are combined into two reportable business segments: Electrical Power Products and Process Control Systems. Electrical Power Products includes equipment and systems for the distribution and control of electrical energy. Process Control Systems consists principally of instrumentation, computer controls, communications and data management systems to control and manage critical processes.
The tables below reflect certain information relating to our opera-tions by segment. All revenues represent sales from unaffiliated cus-tomers. The accounting policies of the segments are the same as those described in the summary of significant accounting policies. Corporate expenses and certain assets are allocated to the operat-ing segments primarily based on revenues. The corporate assets are mainly cash, cash equivalents and marketable securities.
Detailed information regarding our business segments is shown below (in thousands):
Years Ended October 31, 2004 2003 2002
Revenues:Electrical Power Products $ 173,456 $ 227,012 $ 283,592Process Control Systems 32,686 26,369 22,811
Total $ 206,142 $ 253,381 $ 306,403
Gross profit: Electrical Power Products $ 29,122 $ 42,609 $ 62,266Process Control Systems 6,855 6,187 5,254
Total $ 35,977 $ 48,796 $ 67,520
Income (loss) from continuing operations before income taxes and cumulative effect of change in accounting principle:
Electrical Power Products $ (87) $ 12,491 $ 27,411Process Control Systems 1,451 1,141 868
Total $ 1,364 $ 13,632 $ 28,279
October 31, 2004 2003
Identifiable tangible assets: Electrical Power Products $ 114,374 $ 127,266Process Control Systems 11,889 14,269Corporate 69,270 48,140
Total $ 195,533 $ 189,675

41
M. CONSOLIDATION OF OPERATIONSTo reduce overhead costs and improve efficiency, we initiated a consolidation plan in fiscal 2004 to reduce the number of opera-tions within our Electrical Power Products segment. As of June 30, 2004, the consolidation of our Greenville, Texas, and North Canton, Ohio, facilities was complete, resulting in the transfer of our distri-bution switch product lines. In October 2004, we completed the consolidation of our bus duct product lines by combining our Elyria, Ohio, and Northlake, Illinois, facilities. By the end of the first quarter 2005, we expect to complete our consolidation plan with the closure of our Watsonville, California, facility. This facility is under lease, with the lease expiring in February 2005. The completed consolida-tions have resulted in the involuntary termination of 90 employees. The closure of our Watsonville facility will result in the termination of approximately 12 employees.
As of October 31, 2004, the unpaid balance of the consolidation costs is included in accrued salaries, bonuses and commissions and accounts payable on the consolidated balance sheet.
Details of the consolidation reserve during the current period are as follows:
The majority of our consolidation charges relate to severance and employee benefits expense for involuntary terminations during fiscal 2004. The shutdown costs shown above include relocation expens-es for employees, equipment and inventory incurred during fiscal 2004. The relocation and setup of equipment constitutes approxi-mately $400,000 of the shutdown costs shown above. Consolidation costs were recorded in the consolidated statement of operations for the year ended October 31, 2004, as follows:
We expect to incur an additional $400,000 in consolidation expens-es in fiscal 2005 to complete the consolidation of our Watsonville facility.
October 31, 2004
Cost of sales $ 1,777Selling and administrative expenses 393
Total $ 2,170
Accrued Accrued Charges at Year Ended Charges at November 1, October 31, 2004 October 31,
2003 Charges Payments 2004
(In thousands)
Cash charges:Severance and
employee benefits $ — $ 1,084 $ (674) $ 410Shutdown costs — 551 (457) 94
Subtotal $ — 1,635 $ (1,131) $ 504
Noncash charges:Write-down of inventory 535
Total charges $ 2,170

42
N. QUARTERLY RESULTS OF OPERATIONS (UNAUDITED)The table below sets forth the unaudited consolidated operating results by fiscal quarter for the years ended October 31, 2004 and 2003, (in thousands, except per-share data):
2004 Quarters First Second Third Fourth 2004
Revenues $ 53,227 $ 51,476 $ 52,805 $ 48,634 $ 206,142Gross profit 9,555 8,619 9,317 8,486 35,977Net income (loss) 747 360 737 (175) 1,669Basic earnings (loss) per-share 0.07 0.03 0.07 (0.02) 0.16Diluted earnings (loss) per-share 0.07 0.03 0.07 (0.02) 0.15
2003 Quarters First Second Third Fourth 2003
(As Restated, (As Restated, (As Restated, (As Restated, (As Restated, See Note O) See Note O) See Note O) See Note O) See Note O)
Revenues $ 71,580 $ 64,201 $ 60,382 $ 57,218 $ 253,381Gross profit 14,186 12,078 10,556 11,976 48,796Income from continuing operations before cumulative effect
of change in accounting principle 2,998 1,982 1,287 1,228 7,495Net income 2,488 1,982 1,287 1,228 6,985Basic earnings per-share:
Earnings from continuing operations 0.28 0.19 0.12 0.12 0.71Net earnings 0.24 0.19 0.12 0.12 0.66
Diluted earnings per-share:Earnings from continuing operations 0.28 0.19 0.12 0.11 0.70Net earnings 0.23 0.19 0.12 0.11 0.65
2003 Quarters First Second Third Fourth 2003
(As Previously (As Previously (As Previously (As Previously (As Previously Reported) Reported) Reported) Reported) Reported)
Revenues $ 71,580 $ 64,201 $ 60,382 $ 57,218 $ 253,381Gross profit 14,232 12,124 10,615 11,995 48,966Income from continuing operations before cumulative effect
of change in accounting principle 3,034 2,018 1,336 1,240 7,628Net income 2,524 2,018 1,336 1,240 7,118Basic earnings per-share:
Earnings from continuing operations 0.29 0.19 0.13 0.12 0.72Net earnings 0.24 0.19 0.13 0.12 0.67
Diluted earnings per-share: Earnings from continuing operations 0.28 0.19 0.13 0.12 0.71Net earnings 0.24 0.19 0.13 0.12 0.67
The sum of the individual earnings-per-share amounts may not agree with year-to-date earnings per-share as each period’s computation is based on the weighted average number of shares outstanding during the period.

43
O. RESTATEMENTSubsequent to the issuance of our consolidated financial statements for the year ended October 31, 2003, we determined that rent expense for two lease agreements with escalation clauses had been recorded on a cash-paid basis rather than straight-line basis over the term of the lease. As a result, the accompanying consolidated financial statements for the years ended October 31, 2003 and 2002, have been restated from amounts previously reported.
A summary of the significant effects of the restatement is as follows (in thousands, except per-share data):
Year Ended October 31, 2003 Year Ended October 31, 2002
As Previously As Previously Reported As Restated Reported As Restated
Consolidated Statements of OperationsCost of goods sold $ 204,415 $ 204,585 $ 238,745 $ 238,883Gross profit 48,966 48,796 67,658 67,520Selling, general and administrative expenses 35,297 35,339 38,997 39,031Income before interest, income taxes and cumulative effect of
change in accounting principle 13,669 13,457 28,661 28,489Income from continuing operations before income taxes and
cumulative effect of change in accounting principle 13,844 13,632 28,451 28,279Income tax provision (benefit) 6,216 6,137 10,546 10,481Income from continuing operations before
cumulative effect of change in accounting principle 7,628 7,495 17,905 17,798Net income 7,118 6,985 17,905 17,798Net earnings per common share:
Basic:Earnings from continuing operations $ 0.72 $ 0.71 $ 1.70 $ 1.69Net earnings $ 0.67 $ 0.66 $ 1.70 $ 1.69
Diluted:Earnings from continuing operations $ 0.71 $ 0.70 $ 1.67 $ 1.66Cumulative effect of change in accounting principle $ 0.04 $ 0.05 $ — $ —
Net earnings $ 0.67 $ 0.65 $ 1.67 $ 1.66
As of October 31, 2003 As Previously Reported As Restated
Consolidated Balance Sheet Other assets $ 5,029 $ 5,167Total Assets 190,340 190,478Other accrued expenses 6,074 5,994Total Current Liabilities 44,424 44,344Other liabilities 813 1,271Total Liabilities 53,736 54,114Retained earnings 132,990 132,750Total Stockholders’ Equity 136,604 136,364Total Liabilities and Stockholders’ Equity 190,340 190,478

44
REPORT OF INDEPENDENT REGISTERED PUBLIC ACCOUNTING FIRM
To the Board of Directors and Stockholders of Powell Industries, Inc.: In our opinion, the accompanying consolidated balance sheet and the related consolidated statement of operations, stockholders’ equity and cash fl ows present fairly, in all material respects, the fi nancial position of Powell Industries, Inc. and its subsidiaries at October 31, 2004, and the results of their operations and their cash fl ows for the year then ended in conformity with accounting principles generally accepted in the United States of America. These fi nancial statements are the responsibility of the Company’s management; our responsibility is to express an opinion on these fi nancial statements based on our audit. We conducted our audit of these statements in accordance with the standards of the Public Company Accounting Oversight Board (United States). Those standards require that we plan and perform the audit to obtain reasonable assurance about whether the fi nancial statements are free of material misstatement. An audit includes examining, on a test basis, evidence supporting the amounts and disclosures in the fi nancial statements, assessing the accounting principles used and signifi cant estimates made by management, and evaluating the overall fi nancial statement presentation. We believe that our audit provides a reasonable basis for our opinion.
PricewaterhouseCoopers LLPHouston, Texas January 31, 2005
REPORT OF INDEPENDENT REGISTERED PUBLIC ACCOUNTING FIRM
To the Board of Directors and Stockholders of Powell Industries, Inc.:We have audited the accompanying consolidated balance sheet of Powell Industries, Inc. and subsidiaries (the “Company”) as of October 31, 2003, and the related consolidated statements of operations, stockholders’ equity, and cash fl ows for each of the two years in the period ended October 31, 2003. These consolidated fi nancial statements are the responsibility of the Company’s management. Our responsibility is to express an opinion on these consolidated fi nancial statements based on our audits.
We conducted our audits in accordance with the standards of the Public Company Accounting Oversight Board (United States). Those stan-dards require that we plan and perform the audit to obtain reasonable assurance about whether the fi nancial statements are free of material misstatement. An audit includes examining, on a test basis, evidence supporting the amounts and disclosures in the fi nancial statements. An audit also includes assessing the accounting principles used and signifi cant estimates made by management, as well as evaluating the overall fi nancial statement presentation. We believe that our audits provide a reasonable basis for our opinion.
In our opinion, such 2003 and 2002 consolidated fi nancial statements present fairly, in all material respects, the fi nancial position of the Company as of October 31, 2003, and the results of its operations and its cash fl ows for each of the two years in the period ended October 31, 2003, in conformity with accounting principles generally accepted in the United States of America.
As discussed in Note I to the consolidated fi nancial statements, the Company changed its method of accounting for goodwill and other in-tangible assets to conform to Statement of Financial Accounting Standards No. 142, “Goodwill and Other Intangible Assets,” on November 1, 2002.
As discussed in Note O, the 2003 and 2002 consolidated fi nancial statements have been restated.
Deloitte & Touche LLPHouston, TexasDecember 19, 2003 (January 31, 2005, as to the effects of the restatement discussed in Note O)

Powell Industries, Inc..
P.O. Box 12818Houston, Texas77217-2818713.944.6900
Thomas W. PowellChairman, President, and CEO
Mark W. ReidExecutive Vice President
Don R. MadisonVice President, CFO,Secretary and Treasurer
Robert B. GregoryCorporate Controller
Miles “Gus” M. ZellerVice President
Powell Electrical Systems, Inc.
Powell Electrical Manufacturing
8550 Mosley DriveHouston, Texas77075-1180713.944.6900
Miles “Gus” M. ZellerPresident
Delta/Unibus
515 Railroad AvenueNorthlake, Illinois60164-1652708.409.1200
Michael L. BalesPresident
Transdyn, Inc.
5669 Gibraltar DrivePleasanton, California94588-8547925.225.1600
David J. DimlichPresident
Corporate Counsel
Winstead Sechrest & Minick P.C.910 Travis, Suite 1700Houston, Texas 77002-5895713.650.8400
Independent Public Accountants
PricewaterhouseCoopers LLP1201 Louisiana, Suite 2900Houston, Texas 77002-5607713.356.4000
Corporate Information
Design: pennebaker.com

Powell Industries, Inc. P.O. Box 12818
Houston, Texas 77217-2818 Tel: 713.944.6900 www.powellind.com