Powder Material for Inductor...
62
Powder Material for Inductor Cores Evaluation of MPP, Sendust and High flux core characteristics Master of Science Thesis J OHAN KINDMARK F REDRIK ROS ´ EN Department of Energy and Environment Division of Electric Power Engineering CHALMERS UNIVERSITY OF TECHNOLOGY G¨ oteborg, Sweden 2013
-
Upload
truongthien -
Category
Documents
-
view
215 -
download
0
Transcript of Powder Material for Inductor...

Powder Material for Inductor CoresEvaluation of MPP, Sendust and High flux core characteristicsMaster of Science Thesis
JOHAN K INDMARKFREDRIK ROSEN
Department of Energy and EnvironmentDivision of Electric Power EngineeringCHALMERS UNIVERSITY OF TECHNOLOGY
Goteborg, Sweden 2013


Powder Material for Inductor CoresEvaluation of MPP, Sendust and High flux core characteristics
JOHAN KINDMARKFREDRIK ROSEN
Department of Energy and EnvironmentDivision of Electric Power Engineering
CHALMERS UNIVERSITY OF TECHNOLOGYGoteborg, Sweden 2013

Powder Material for Inductor CoresEvaluation of MPP, Sendust and High flux core characteristicsJOHAN KINDMARKFREDRIK ROSEN
c© JOHAN KINDMARKFREDRIK ROSEN, 2013.
Department of Energy and EnvironmentDivision of Electric Power EngineeringChalmers University of TechnologySE–412 96 GoteborgSwedenTelephone +46 (0)31–772 1000
Chalmers Bibliotek, ReproserviceGoteborg, Sweden 2013

Powder Material for Inductor CoresEvaluation of MPP, Sendust and High flux core characteristicsJOHAN KINDMARKFREDRIK ROSENDepartment of Energy and EnvironmentDivision of Electric Power EngineeringChalmers University of Technology
Abstract
The aim of this thesis was to investigate the performance of alternative powder materials and compare thesewith conventional iron and ferrite cores when used as inductors. Permeability measurements were per-formed where both DC-bias and frequency were swept, the inductors were put into a small buck converterwhere the overall efficiency was measured. The BH-curve characteristics and core loss of the materials werealso investigated. The materials showed good performance compared to the iron and ferrite cores. High fluxhad the best DC-bias characteristics while Sendust had the best performance when it came to higher fre-quencies and MPP had the lowest core losses. Sendust had the overall best results when comparing allmaterials and another positive aspect is that they are not limited in which shapes they can be made.
Index term: Core materials, High flux, Inductor, MPP, Powder cores, Sendust
iii

iv

Acknowledgements
First of all we would like to thank or tutor Anders Thorsen for all the help and feedback he has providedduring the whole progress of this thesis. We would like to thank or examiner Torbjorn Thiringer for hisguidance and feedback regarding the report. We would also like to thank Benny Stegefelt for his help withcontact information for the supplier, Lennart Kruse for hisinput regarding inductors and Johan Hakanssonfor his everyday advices. Lastly we would like to thank the Power Solution at Ericsson Lindholmen forsupplying us the resources needed to complete our work. The work has been carried out at Ericsson Lind-holmen.
Johan Kindmark & Fredrik RosenGoteborg, Sweden, 2013
v

vi
Abbrevations
AC - Alternating current
CCM - Continuous conduction mode
DC - Direct current
DCM - Discontinuous conduction mode
EMI - Electro magnetic interference
MOSFET - Metal oxide semiconductor field effect transistor
MPP - Molypermalloy powder
PCB - Printed circuit board
PWM - Pulse width modulation
vii

viii

Contents
Abstract iii
Acknowledgements v
Abbrevations vii
Contents ix
1 Introduction 1
1.1 Background . . . . . . . . . . . . . . . . . . . . . . . . . . . . . . . . . . . . . .. . . . 1
1.2 Aim . . . . . . . . . . . . . . . . . . . . . . . . . . . . . . . . . . . . . . . . . . . . .. 1
1.3 Scope . . . . . . . . . . . . . . . . . . . . . . . . . . . . . . . . . . . . . . . . . . .. . 1
1.4 Method . . . . . . . . . . . . . . . . . . . . . . . . . . . . . . . . . . . . . . . . . .. . 1
2 Technical Background 3
2.1 The inductor and important magnetic concepts . . . . . . . . .. . . . . . . . . . . . . . . 3
2.1.1 The magnetisation curve . . . . . . . . . . . . . . . . . . . . . . . . .. . . . . . 4
2.1.2 Hysteresis losses . . . . . . . . . . . . . . . . . . . . . . . . . . . . . .. . . . . 6
2.1.3 Eddy currents and the resistive losses . . . . . . . . . . . . .. . . . . . . . . . . 6
2.2 Different Inductor Types . . . . . . . . . . . . . . . . . . . . . . . . . .. . . . . . . . . 7
2.3 Core Materials . . . . . . . . . . . . . . . . . . . . . . . . . . . . . . . . . . .. . . . . 7
2.3.1 Ferrite Cores . . . . . . . . . . . . . . . . . . . . . . . . . . . . . . . . . .. . . 8
2.3.2 Powder Cores . . . . . . . . . . . . . . . . . . . . . . . . . . . . . . . . . . .. . 8
2.4 Thermal aging and temperature dependance . . . . . . . . . . . .. . . . . . . . . . . . . 9
2.5 Design Considerations . . . . . . . . . . . . . . . . . . . . . . . . . . . .. . . . . . . . 10
2.6 Buck Converter . . . . . . . . . . . . . . . . . . . . . . . . . . . . . . . . . . .. . . . . 11
ix

Contents
3 Test Subjects 13
4 Frequency Measurements 15
4.1 Test Setup . . . . . . . . . . . . . . . . . . . . . . . . . . . . . . . . . . . . . . .. . . . 15
4.2 Measurements . . . . . . . . . . . . . . . . . . . . . . . . . . . . . . . . . . . .. . . . . 15
4.2.1 Inductance deviation for individual materials . . . . .. . . . . . . . . . . . . . . 15
4.2.2 Inductance deviation comparing different materials. . . . . . . . . . . . . . . . . 18
4.3 Analysis and discussion . . . . . . . . . . . . . . . . . . . . . . . . . . .. . . . . . . . . 19
5 DC-Bias Measurements 21
5.1 Test Setup . . . . . . . . . . . . . . . . . . . . . . . . . . . . . . . . . . . . . . .. . . . 21
5.2 Measurements . . . . . . . . . . . . . . . . . . . . . . . . . . . . . . . . . . . .. . . . . 21
5.2.1 Permeability deviations . . . . . . . . . . . . . . . . . . . . . . . .. . . . . . . . 22
5.2.2 Inductance Changes . . . . . . . . . . . . . . . . . . . . . . . . . . . . .. . . . 24
5.3 Analysis and discussion . . . . . . . . . . . . . . . . . . . . . . . . . . .. . . . . . . . . 27
6 Buck Converter Measurements 29
6.1 Test Setup . . . . . . . . . . . . . . . . . . . . . . . . . . . . . . . . . . . . . . .. . . . 29
6.2 Measurements . . . . . . . . . . . . . . . . . . . . . . . . . . . . . . . . . . . .. . . . . 29
6.2.1 Permeability Comparison . . . . . . . . . . . . . . . . . . . . . . . .. . . . . . 29
6.2.2 Material Comparison . . . . . . . . . . . . . . . . . . . . . . . . . . . .. . . . . 31
6.2.3 High Current Buck Converter . . . . . . . . . . . . . . . . . . . . . .. . . . . . 33
6.2.4 Frequency Sweep in Buck Converter . . . . . . . . . . . . . . . . .. . . . . . . . 34
6.3 Analysis and discussion . . . . . . . . . . . . . . . . . . . . . . . . . . .. . . . . . . . . 35
7 BH-curve Measurements 37
7.1 Test Setup . . . . . . . . . . . . . . . . . . . . . . . . . . . . . . . . . . . . . . .. . . . 37
7.2 Results . . . . . . . . . . . . . . . . . . . . . . . . . . . . . . . . . . . . . . . . .. . . . 38
7.2.1 BH-curve . . . . . . . . . . . . . . . . . . . . . . . . . . . . . . . . . . . . . .. 38
7.2.2 Core losses . . . . . . . . . . . . . . . . . . . . . . . . . . . . . . . . . . . .. . 39
7.3 Analysis and Discussion . . . . . . . . . . . . . . . . . . . . . . . . . . .. . . . . . . . 40
x

Contents
8 Categorisation 43
9 Conclusion 45
9.1 Future Work . . . . . . . . . . . . . . . . . . . . . . . . . . . . . . . . . . . . . .. . . . 45
References 47
xi

Contents
xii

1. Introduction
1.1 Background
In the telecom field there is a demand to increase the efficiency and make the Printed Circuit Boards, PCB,more compact. As of today a large part of the board is occupiedby the power stage, which supplies theboard with its different voltage levels. There is a need to make more efficient and compact power stagesand the inductor does not show the same energy storage vs sizeas the rest of the design. One trend isthat the voltages in the circuit is lowered and therefore a higher current is needed to keep the same powerlevel. These two considerations puts higher requirements on the inductor and it is therefore interesting toinvestigate alternative core materials.
Traditionally ferrites with air gap have been used as choke inductors in the power stages. The major concernwith ferrites is that they saturate early. This can be solvedby increasing the air gap but this will increase theoverall losses of the component. Powder materials, such as iron powder, Sendust, Molypermalloy Powder,MPP, and High flux saturates at higher levels. The powder materials have distributed air gaps which are builtup by small particles which have been bound together. This organic binder has been the major problemsince it has deteriorated over time and reduced the performance of the inductor. Lately the technologyhas improved by replacing the organic binder with a non-organic binder [1]. By using alternative powdermaterials the aim is to reduce the size of the inductor but maintain the performance.
1.2 Aim
The aim of this thesis is to investigate, test and analyse theperformance of inductor coils constructed ofalternative powder alloys. These will then be compared withconventional ferrite and iron powder cores.
1.3 Scope
In this thesis the materials investigated will be used in choke inductors and the materials will be limited toferrites, iron powder, Sendust, MPP and High flux cores. Nanocrystalline materials will be mentioned butwill not be put to the test due to their working conditions being lower frequency applications. Due to the factthat some of the powder materials are limited to toroidal shaped cores all core materials acquired will havethis shape. The tests performed has been limited to investigate the electrical and magnetically properties ofthese materials and thus temperature dependance will not beinvestigated physically but it will be discussed.
1.4 Method
To achieve the goal of this thesis a thorough literature study has to be concluded to give good knowledge ofthe inductor, the various materials suitable for evaluation as well as for the different test setups needed toconclude the measurements.
1

Chapter 1. Introduction
When the materials have been acquired, the toroidal cores will be wounded with copper wire to actualinductors. The inductors will be wound to a couple of different sizes. They will then be run through twotests where the frequency and the DC-bias current are changed respectively in order to get the inductancevariation of the materials. After that, the BH-curves will be measured to see when the material saturates aswell as the losses in the core of the inductor. The inductors will also be mounted in an actual converter tosee the performance in a real application.
When all measurements are performed, the results will be analysed and compared with theoretical dataof the powder materials as well as with performance from inductors using more conventional materials.When the comparisons of the different materials are completed, they will then be categorised for suitableapplications of operations.
2

2. Technical Background
This chapter will describe the relevant theory needed for this thesis. The first part will describe the inductorand how ferromagnetic materials behave under different magnetisation levels. The next part will describedifferent kinds of inductors as well as the materials used inthe cores that are investigated and how theyare affected when stressed with high temperatures. The later part handles general design considerations forinductors as well as the different converter topologies theinductors are supposed to be operating in.
2.1 The inductor and important magnetic concepts
The derivation of the inductor is taken from the bookSolid State Tesla Coil by Gary L. Johnson [2]. Aninductor is an electrical component which stores energy in amagnetic field. An inductor usually consistsof a conductor that is wound around a magnetic core. From circuit theory the voltage,VL, created by thecurrent,i, across the inductor can be expressed as
VL = Ldi
dt(2.1)
whereL is the inductance of the inductor. Another way to explain thesame voltage is to use Faraday’s lawwhich says that
VL = NdΦ
dt(2.2)
whereN is the number of turns of the conductor andΦ is the magnetic flux flowing through the coil. Byputting these equations together one gets
Li = NΦ (2.3)
where the left side is the circuit quantities and the right isthe field quantities. The inductance can then beexpressed as
L = NΦ
i(2.4)
The relation betweenΦ andi is nonlinear when using ferromagnetic materials and it is important to connectthis equation with the magnetic flux density,B, and the field intensity,H. The magnetic flux can be expressedas
Φ =
∫∫
BdA (2.5)
If the magnetic flux density is even across the core the equation simply becomes
Φ = BA (2.6)
whereA is the cross sectional area of the core. The magnetic flux density can then be expressed as
B = µ0µrH (2.7)
3

Chapter 2. Technical Background
whereµ0 is the permeability of vacuum andµr is the relative permeability of the core material. The rel-ative permeability is the prime factor when determining theamount of energy that the inductor can store,especially when the space for the inductor is limited. The energy stored can be expressed as
W =1
2LI2 (2.8)
Finally, the connection of the magnetising force and the current flowing in the inductor can be expressedaccording to Ampere’s law as
Ni =
∮
Hdl (2.9)
This equation states that the current equals the integral ofthe magnetising force surrounded by an arbitrarypartdl. If the loopdl surrounds the full inductor current the equation becomes
Ni = Hl (2.10)
wherel is the mean magnetic path length in the core of the inductor. The relation between the flux densityand the magnetising force is best described using the magnetisation curve, especially for ferromagneticmaterials because of the nonlinearity of the material.
2.1.1 The magnetisation curve
The following explanation of magnetisation curves and magnetic domains is an important concept whenunderstanding how magnetic material behaves and most of thetheory are gathered fromField and WaveElectromagnetics by David Cheng [3].
A typical magnetisation curve, or BH-curve, can be studied in figure 2.1. It can be seen that the BH-curveis only linear for a small part of the applied magnetising force. This is because the magnetic materialsaturate which means that the relative permeability approaches that of air and less energy can be storedin the core. This implies that the permeability will decrease when the linearity between the flux densityand the magnetising force deviates. The inductance decreases with the permeability since the magnetic fluxstays constant (2.6). When the material is fully saturated the inductor can be regarded as short circuit. It istherefore important when designing inductors to have a safedistance between the operating point and thesaturation point. Various materials have different BH characteristics which make them suitable for differentapplications. All magnetic materials have hysteresis and resistive losses but the magnitude of these dependson the materials and the electrical conditions. Magnetic materials have a saturation point where the fluxdensity no longer increases. For ferrites this value is about 0.3 T and for iron 1.8 T [4].
4

2.1. The inductor and important magnetic concepts
H
B
Hc
Br
Fig. 2.1 A typcial shape for a BH-curve.Br represents the remnant flux density andHc is the reversed field requiredto get the flux density back to zero.
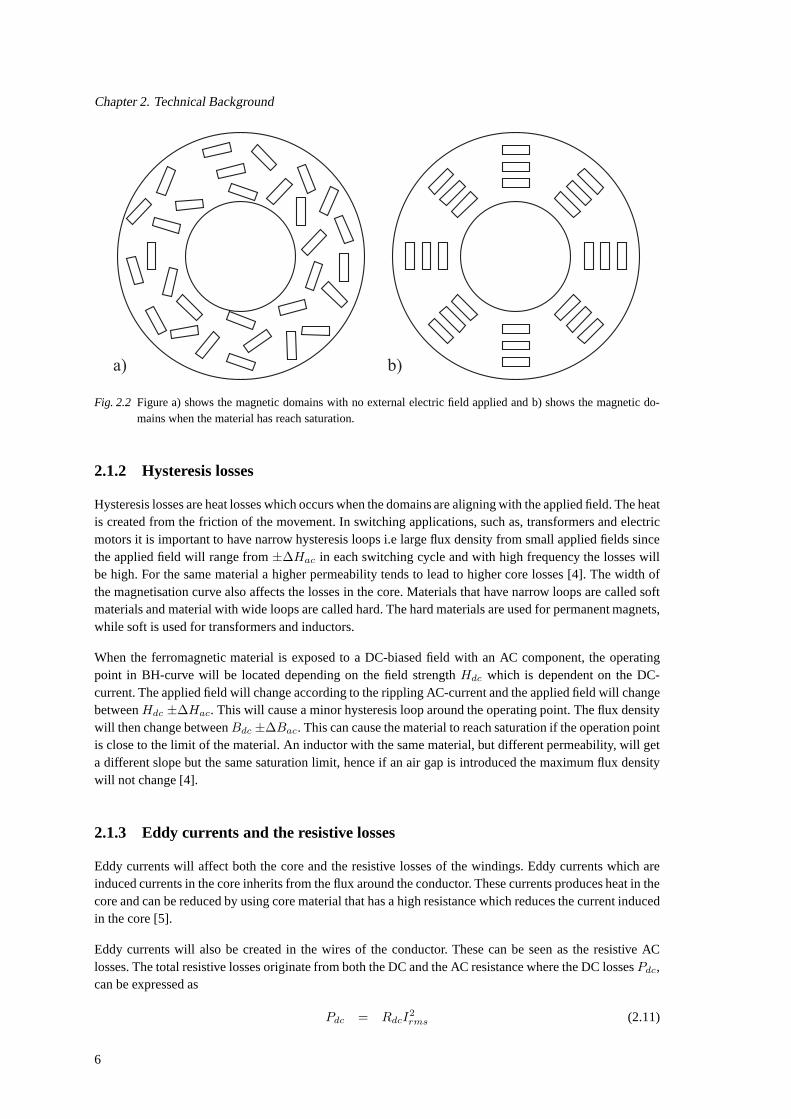
The reason for the saturation in ferromagnetic materials can be explained by using the model of magneticdomains, see figure 2.2. Each of the domains consists of1015 to 1016 atoms and they are fully magnetisedin a sense since all magnetic dipoles made from spinning electrons in one domain is aligned in the samedirection, even without any applied magnetic field. Betweenthe different domains there are domain walls,which are about 100 atoms thick. When the material is demagnetised the different domains have the mag-netic moments in different directions which can be seen in figure 2.2a. The net sum of the random magneticmoments will result in no magnetisation of the material.
When an external magnetic field is applied to the ferromagnetic material the walls of the domains, which arealigned with the external field, will grow at the expense of other domains. This will increase the magneticflux. When the fields are weak the domain movement is reversible, but when reaching a certain point themovements will be non-reversible. When this happen the domains will start to rotate in the same directionas the applied field seen in figure 2.2b. When the applied field becomes zero the flux density will not goback to zero but instead reach a levelBr which is called the remanent flux density. To get the flux densityback to zero an external fieldHc has to be applied but in the opposite direction, the requiredstrength iscalled coercive force. If all domains are aligned with the external field the material has reach saturation andthe flux density cannot be higher, no matter how big the applied field as shown in figure 2.1.
5
Chapter 2. Technical Background
a) b)
Fig. 2.2 Figure a) shows the magnetic domains with no external electric field applied and b) shows the magnetic do-mains when the material has reach saturation.
2.1.2 Hysteresis losses
Hysteresis losses are heat losses which occurs when the domains are aligning with the applied field. The heatis created from the friction of the movement. In switching applications, such as, transformers and electricmotors it is important to have narrow hysteresis loops i.e large flux density from small applied fields sincethe applied field will range from±∆Hac in each switching cycle and with high frequency the losses willbe high. For the same material a higher permeability tends tolead to higher core losses [4]. The width ofthe magnetisation curve also affects the losses in the core.Materials that have narrow loops are called softmaterials and material with wide loops are called hard. The hard materials are used for permanent magnets,while soft is used for transformers and inductors.
When the ferromagnetic material is exposed to a DC-biased field with an AC component, the operatingpoint in BH-curve will be located depending on the field strength Hdc which is dependent on the DC-current. The applied field will change according to the rippling AC-current and the applied field will changebetweenHdc ±∆Hac. This will cause a minor hysteresis loop around the operating point. The flux densitywill then change betweenBdc ±∆Bac. This can cause the material to reach saturation if the operation pointis close to the limit of the material. An inductor with the same material, but different permeability, will geta different slope but the same saturation limit, hence if an air gap is introduced the maximum flux densitywill not change [4].
2.1.3 Eddy currents and the resistive losses
Eddy currents will affect both the core and the resistive losses of the windings. Eddy currents which areinduced currents in the core inherits from the flux around theconductor. These currents produces heat in thecore and can be reduced by using core material that has a high resistance which reduces the current inducedin the core [5].
Eddy currents will also be created in the wires of the conductor. These can be seen as the resistive AClosses. The total resistive losses originate from both the DC and the AC resistance where the DC lossesPdc,can be expressed as
Pdc = RdcI2
rms (2.11)
6

2.2. Different Inductor Types
whereRdc is the DC resistance andIrms is the rms value of the DC-current. The AC resistance is morecomplex and it depends on both the skin effect of the wire as well as the proximity effect and both theseeffects increases with higher frequencies. The skin effectcauses the actual area that the current uses in theconductor to shrink because the current is pushed away from the middle of the inductor. This is due tothat the current creates an alternating magnetic field around the conductor. When the current changes, thismagnetic field will create an electric field directed opposite to the current intensity. This electric field isstrongest in the center of the conductor and thus the currentis pushed to the edges. When choosing the sizeof the conductor it is important to know the skin depth which is the length the current will penetrate intothe conductor and it can be calculated as
d =
√
ρ
πωµ0
(2.12)
whereρ is the resistivity of the material andω is the angular frequency of the current. If the skin depth issmaller than the radius of the conductor the skin effect willaffect the current distribution [6].
The proximity effect occurs when conductors are put close toeach other, for instance in an inductor withmany turns of the conductor. The magnetic field created by thecurrent will induce eddy currents in nearbyconductors and this will change the current distribution overall. Current will be focused in areas in theconductors furthest away from nearby conductors which willdecrease the area the current uses [7]. Thisincreases the resistance which is defined as
R =ρl
Ae
(2.13)
whereρ is the resistivity of the material,l is the length of the conductor andAe is the cross sectional areaof the conductor. Since bothρ andl are constant, the total resistance of the conductor increases when thearea diminishes.
2.2 Different Inductor Types
The inductor core can have different geometries, for instance E, U, C, I, toroidal and block shapes. Allshapes have different advantages and disadvantages and it is mainly depending on the application on whatshape to chose [8]. Toroidal cores, as an example, has a closed magnetic path which will limit the inducedfield to escape but they require special machinery for the wounding to be effective. When constructing aninductor, the traditional way is to wound the conducting wires around the magnetic core. Nowadays there isa type of inductor called composite inductors and these are created backwards seen from the traditional wayof constructing [9]. When creating a composite inductor theconductors are wounded around an air coil andthe edges are connected to a lead frame which serves as the mounting pads as well as the connection to theboard. The core material, which are made by powders, are thenpressed around the coil to give the inductorits square shape. Note that powder materials is not only usedfor composite inductors.
2.3 Core Materials
There exists a lot of various magnetic core materials and some common ones are ferrites, iron laminations,silicon steel and different powder materials, which is the main focus in this thesis. There is a high varianceof the characteristics between the materials and what to chose depends on the application, saturation andthe limit in physical size as mentioned in section 2.1. Some big manufacturer of these are Magnetics,Micrometals and Ferroxcube [4].
Another aspect to consider is at what temperatures the core will be exposed for. For magnetic material thereis a very distinguished temperature known as the Curie temperature,Tc, named after the French scientist
7

Chapter 2. Technical Background
Pierre Curie [3]. When a ferromagnetic material reachesTc it loses its magnetisation and the material willhave the same characteristics as a paramagnetic material withµr around 1. Materials used in inductor coresusually has aTc between130− 1000C.
2.3.1 Ferrite Cores
The name ferrite is a collection of magnetic materials that consists of iron oxide, for example the hematiteFe2O3, where iron oxide is mixed with another material such as magnesium, zinc, nickel and barium [10].The frequency range that ferrites are used in is wide, from kHz to GHz [11]. Ferrites have high resistivitywhich reduces the eddy current losses since it is harder for the current to be induced in the core itself.Nickel-zinc ferrites have the highest resistivity and is used for the highest frequencies. Magnesium-zinc isused for frequencies up to 5 MHz. A drawback of ferrites is itslow saturation limit at around 0.3 T andthey have a very clear breakpoint for the permeability. Whenthey reach saturation the inductance value willplummet rapidly [12].
Ferrite materials are located on the lower end for Curie temperatures and it has its highest permeability justbeforeTc. Even though the magnetisation is lost above the Curie temperature no permanent damage will bedealt to the ferrite material. The change is only in the magnetic properties and not in the physical structureof the material. However, the physical structure may crack if the material is exposed for rapid change of itstemperatures, at above 4 C per minute [13].
2.3.2 Powder Cores
Powder material can consists of different chemical elements in order to obtain the properties required ofthe core. With powder material, the air gap in the core will bedistributed evenly across the whole coreinstead of a gapped part which is the case in a standard ferrite core [12]. The distributed air gap will give thematerial a better temperature stability as well as lower fluxleakage. They also have a smoother reductionof its permeability but it starts much earlier compared to ferrites. They are also good from an EMI pointof view since a discrete air gap can interfere with other partof the system. The permeability of the coredepends on the size of the powder particles and the smaller the particle the lower the permeability becomes.Powder cores usually has its margin of error of the inductance specified to±8 % [14].
Iron Powder
Iron powder used in magnetic cores consists of pure iron, Fe,and it is built up of small particles which isisolated from each other [15]. There exist different types of iron powder, for instance hydrogen reducedand carbonyl iron [16]. The carbonyl iron is usually used in RF, radio frequency, applications since theyhave good temperature stability where as the hydrogen reduced iron commonly is used for DC-chokes,mainly because of their higher permeability. Iron powder has rather high losses compared to the otherpowder materials but this can be compensated for applications where size is not an issue and when lowcost is important. Iron powder saturates between 1-1.5 T andusually has a relative permeability rangingbetween 1-90µ. One major drawback with iron powder has been that the binderused for isolating thegrain particles, typically epoxy, is organic and thereby isexposed for thermal aging [12]. This makes thematerial sensitive for high temperatures, usually above 125 C, and this will cause the material to changeits magnetic properties. Recent studies on new binding material has pushed the temperatures and somemanufactures now guarantee that their cores is aging free upto 200 C [17], more about thermal aging canbe seen in section 2.4.
MPP ( Molypermalloy Powder)
Molypermalloy powder, MPP, was introduced in 1940 and was first used to compensate the capacitancefrom long telephone lines [18]. The core is very stable when it comes to flux density, DC-current and
8

2.4. Thermal aging and temperature dependance
temperature. MPP generally has the lowest losses of all the powder materials and is used when a highersaturation level is needed without increasing the losses. The drawback is the cost, which is many timesmore than that of conventional ferrites, and the geometry which is limited to toroidal shapes. According toMagnetics [14], their MPP cores consists of a mix of 2% molybdenum, 17% iron and 81% nickel and therelative permeability ranges from 14-550. The frequency spectrum varies depending on which manufactur-ers specification that is regarded. Magnetics says that the range for their cores goes up to 1 MHz whereasMicrometals only goes up to 200 kHz [19].
High flux
High flux cores consists of 50% iron and 50% nickel powder and is used when very high saturation, 1.5 T,is needed [20]. The losses is higher compared to MPP but much lower than the iron powder. High flux coresare the best powder cores when it comes to keep its permeability when the DC-bias is increased. Becauseof the permeability of the material, High flux cores are smaller than the standard iron powder core whichmakes it more suitable in applications where space is an issue. High flux cores have relative permeabilitiesbetween 14-160µ and a frequency range up to 200 kHz [14] [19]. High flux cores is, like the MPP core,only available in toroidal shapes.
Sendust
Sendust cores, also called Kool Mu cores, was invented in Japan 1936 and consists of 85% iron, 9% siliconand 6% aluminum [18]. They saturate at around 1T and they fit between iron powder and High flux coreswhen it comes to both losses and cost. The available relativepermeabilities for Sendust cores are between26-125µ. Sendust is cheaper than both MPP and High flux because their is no nickel in the alloy whichmakes the production process easier. Sendust are availablein toroidal and E shape cores as well as blockshapes [19]. The frequency range is again different betweenMagnetics and Micrometals which states therange to 500 kHz and 1 MHz respectively [19] [21].
Nanocrystalline
Nanocrystalline cores were first showed in 1988 when a group of Japanese scientists added small amountsof copper, Cu, and niob, Nb, to a standard Fe-Si-B amorphous alloy [22]. The reason for calling the materialnanocrystalline is that the grain size of the powder is very small, from 10-100 nm. Nanocrystalline materialsavailable in the market today are Nanoperm, Vitroperm, Hitperm and Finemet. The nanocrystalline materi-als shines in the lower frequency ranges, making them ideal for transformers and common mode chokes forinverter drives as well as high power applications [23]. Nanocrystalline materials will not be investigatedfurther in this report but it is an interesting material thatmight develop further and thus it may be useful forhigher frequency applications.
2.4 Thermal aging and temperature dependance
The aging of core material depends on the binding material ofthe powder [24]. In iron powder the bindingmaterial is constructed of epoxy which often is organic and is therefore affected by the heat in core that canlead to thermal aging . When the binder has been exposed to high temperature, the core losses will increase[25]. Once the core has been affected by high temperature theprocess is irreversible i.e the core losses willincrease with time. Therefore it is important to stay withinthe temperature limit when operating with ironpowder. Iron powder as an example has an curie temperature ofover 700C but the binder that holds theparticles together, which usually is epoxy or phenol, has a considerable lower temperature limit. This limithas been around 125 C but manufacturers now claims to have binders that can withstand temperatures upto 200C [26] [24].
9

Chapter 2. Technical Background
The Curie temperature for powder materials, such as MPP, Sendust and High flux is between 450-500
C [21] but the most important part is that the binder that keepthe grains together is non organic which makesit non affected by thermal aging [19] [14]. The rated temperature is still usually put to 200 C because ofthe epoxy finish at the surface of the core [13]. The fact that these material does not inherit the thermalaging effect until 200C make them ideal for working operations with continuously high temperatures.
Another important aspect to consider when it comes to temperatures is the change in permeability thatmight occur. This will change the performance of the inductor which in turn will affect the output ripple. Ifcomparing the powder materials MPP has the best temperaturestability with a change of only 2% at 200
C where High flux and Sendust deviates 4% and 8% respectively [13], this comparison is for the 125µ. Aninteresting observation is that the permeability increases for both MPP and High flux where as it declinesfor Sendust. The deviation in temperature is also greater for higher permeabilities.
2.5 Design Considerations
This section will discuss different aspects of inductor design and inspiration is taken fromSwitching PowerSupply Design by Abraham I. Pressman [4]. For inductor design there are several aspects to consider. Whichapplication should it be used for and what ratings such as current, voltage, frequency shall the inductoroperate under. Other considerations are core size, cost andlosses which is aspects the engineer usually hasto make a trade off between.
To determine the initial inductance, i.e. no bias current orfrequency, of an inductor designers often usesomething called the AL value. The relation is described as
L = ALN2 (2.14)
whereL is the inductance,N is the number of turns of the conductor andAL is the AL value for thespecific core material. The AL value depends on the permeability of the materials as well as the geometricdimensions and is given by the manufacturer of the cores.
As mentioned in section 2.1.1 the DC bias point will affect the permeability of the core material. Anotherparameter that will change the inductance value is the operation frequency. Manufacturers usually presentthe inductance variations for both frequency and current but the frequency is kept low when the DC biasis swept and vice versa. Hence the calculated inductance value may differ from the actual. Therefore oneshould test the inductor in the actual circuit to make sure its characteristics is within the limits of the design.
When designing an inductor for a buck converter, a major factor for the performance of the inductor is theoutput DC-current. The inductance is usually kept high in order to get a smooth output current withoutripple. In cases with a high output current, where the inductance decline one can either increase the turnratio or use a higher permeability material. With a higher permeability one problem is that permeabilitywill have a larger deviation when the current changes due to the fact that the initial permeability declinesearlier. The other case will increase the losses of the inductor since a higher amount of turns means longerconductor and thus higher resistive losses.
When it comes to the frequency of the application there are some general guidelines that may be followed.When the frequency is low, usually iron powder is used because of high saturation flux density, low hys-teresis and eddy losses as well as the cheap cost of the material. At really high frequencies ferrites are usedbecause of their lower core losses. For higher frequency thediameter of the wire is another important aspectsince the skin effect will occur.
When designing inductors there are generally two approaches used, core loss limited and copper loss lim-ited. Which one of the two that is used depends on where the majority of the losses in the design will be
10

2.6. Buck Converter
located. When the current ripple or the frequency is low there will not be any major losses in the core,instead the design is limited by the copper losses in the windings. This is the copper loss limited approachand is often used with buck converters because of the high DC current and there will be significant resistivelosses in the windings according to (2.11). It is, in this case, important to use a wire with a large crosssectional area to reduce the resistance (2.13). There is a trade off since if a thick wire is used, less turns canbe fit into the core which will lower the inductance or alternatively a larger core as to be used. The core losslimited approach is used when the frequency is high and the core material will have a high impact on thelosses. In these cases materials with smaller area of the itsBH loop is suitable.
This is only a small fraction of the issues the designer is confronted with and their is a lot of different thingsto think about which makes the design processes of the inductor both difficult and important for the overallperformance of the circuit.
2.6 Buck Converter
The inductors investigated in this thesis is usually used asoutput chokes in DC-DC converters. The applica-tions studied is mostly converters where the voltage is transformed to a lower level and the inductors havebeen tested in different buck converters. The theory presented is mostly gathered fromPower Electronics:Converters, Applications and Design by N. Mohan et.al [7]. The theory only describes the behaviorof thecircuit and not the logic needed to switch the transistor in the converter. The buck converter is one of thesimplest converters that can be used. It consists of a switch, often a Metal oxide semiconductor field effecttransistor, MOSFET, a diode, a capacitor and an output inductor. The schematics can be seen in 2.3.
Vin Vout
L
D C
S ic Iout
iL
Fig. 2.3 The ideal circuit diagram of a Buck converter.
The principle is that the switch is conducting for a certain amount of time, depending on the input voltageand the desired voltage on the output. In steady state the voltage across the inductor has to be zero fora whole period. For continuous conduction mode, CCM, i.e when the current through the inductor flowsduring the whole period, the relation between the voltages can be derived as
0 =1
T
∫
T
VLdt =1
T(
DT∫
0
(Vd − V0)dt+
T∫
DT
−V0dt) =
=1
T((Vd − V0)DT − V0T − (−V0)DT ) ↔
V0
Vd
= D (2.15)
whereVL is the voltage across the inductor,V0 is the output voltage,D is the duty cycle,Vd is the input
11
Chapter 2. Technical Background
voltage andT is the period of the switching frequency. The voltage is usually monitored and controlled bya drive circuit with pulse width modulation, PWM.
There is also a possibility to run the converter in discontinuous conduction mode, DCM, where the energystored in the inductor is discharged before the ending of theperiod, resulting thatiL, the current throughthe inductor, is zero for a short while before the next period. This may be suitable in applications with highswitching losses since the losses when the MOSFET is turned on is negligible.
12

3. Test Subjects
In this chapter the data description of the different cores used for the inductors will be presented. The samecores will be used for rest of the tests in this thesis unless otherwise specified. When selecting the inductorsthe goal was to get them as similar as possible regarding bothsize and permeability. In Table 3.1 the differentmaterials used are described with their specific values. Forthe rest of this thesis when permeabilities arementioned it will simply be written as 26µ, 60µ, 125µ etc. and it then tells the relative permeability of thementioned core. For the tests it was decided that the inductance values should be 2 and 10µ because of theavailable buck converters. The wire used is a standard copper wire with a diameter of 1.2 mm, except forthe BH measurements where the number of turns were much higher and a 0.7 mm diameter wire was used.The number of turns is calculated from equation (2.14).
Table 3.1: Characteristics of the cores used in the testsMaterial Iron Ferrite MPP High flux Sendustµr 35, 75 125 26, 60, 125 26, 60, 125 60, 125Outer Diameter [mm] 20.2 23.7 21.1 21.1 21.1Inner Diameter [mm] 12.6 13.1 12.0 12.0 12.0Cross Section Area [mm2] 24.3 39.75 22.1 22.1 22.1Mean Path Length [mm] 51.5 57.8 50.9 50.9 50.9Cost [£] 1.01, 0.32 - 1.97 1.26 0.66AL [nH/turn] 18, 45 87 14, 32, 68 14, 32, 68 14, 32, 68Turns 2µ 11, 7 6 12, 8, 6 12, 8, 6 12, 8, 6Turns 10µ 24, 15 12 27, 18, 12 27, 18, 12 27, 18, 12
The iron cores are manufactured by Amidon where the 35µ is an iron mix called carbonyl HP often denotedas -3 and 75µ is a hydrogen reduced iron powder denoted as -26. These were the only two cores availablewith the correct size and reasonable permeability comparedto the other powder materials.
The ferrite core used is called 4C65, TN23/14/7 from Ferroxcube. It is an ungapped core and it was chosensince it resembles the other powder cores in both size and permeability. Ferrite cores are often gapped toget a lower permeability when used as output inductors but tomake the comparison as equal as possible thetoroidal shape was chosen.
The MPP, Sendust and High flux cores are from both Arnold Magnetics and Magnetics Inc. The reasonthere is no 26µ Sendust is that it was not available at the time the materialswere acquired. Note that for theMPP, Sendust and High flux cores only one prize is given since the cost is defined by the size of the core.The reason for not presenting a cost for the ferrite core is that a price was only found in a Swedish store andis is therefore unfair to compare it with a English distributer where the other core were acquired.
13

Chapter 3. Test Subjects
14
4. Frequency Measurements
This chapter will describe the frequency measurements and how the frequency affects the permeability ofthe material. This is interesting since the switching frequencies in converters and the operating frequenciesfor different applications can vary from kHz to MHz and thesemay effect the core materials.
4.1 Test Setup
The frequency will be swept from 10 kHz - 2 MHz using an LCR meter, Agilent 4980A. The instrumenthas a four terminal pair configuration which reduces the influence of stray inductance which occur at higherfrequencies. The four terminals are low current, low potential, high current and high potential respectively.The terminals for the low side is connected together to one side of the test object and the high side to theother. Before any inductor is tested both short and open calibrations are performed on the LCR meter. Forthe short calibration a shortening board, provided by the manufacturer, is connected to the four terminals.The frequency sweep will be divided into 201 values, which isthe maximum for this instrument. While thefrequency is swept both the current and the voltage will be very low, in the micro or milli regions.
4.2 Measurements
The frequency measurement result has been divided into two categories. The first compares each materialseparately for different permeabilities and the inductance change as a function of applied frequency. Inthe second part the different materials are compared to eachother. The change of the inductance will bepresented as a percentage of the initial inductance value.
4.2.1 Inductance deviation for individual materials
When looking at figure 4.1 it is seen that the 35µ iron is stable across the complete test range. The 75µ irondeclines rapidly when reaching 200 kHz.
15

Chapter 4. Frequency Measurements
0.01 0.1 160
65
70
75
80
85
90
95
100
Frequency [MHz]
% o
f ini
tial i
nduc
tanc
e
35µ75µ
Fig. 4.1 The change in inductance for 35µ and 75µ iron cores when the frequency is swept from 10 kHz to 2 MHz.
From figure 4.2 it is apparent that the ferrite is stable over abig range of frequencies, this is no surprisesince ferrite cores are often used for high frequency applications. One interesting phenomenon is the spikesin the inductance at 90 kHz and 700 kHz. This is believed to be the self resonance of the inductor, whichmay depend on the stray capacitance of the core and of the windings. The phenomenon is described in [27]and the measured inductance shape is similar to the one in thearticle. The reason for the different peakvalues of the spikes may be because of the different winding resistance in the two inductors.
0.01 0.1 170
80
90
100
110
120
130
Frequency [MHz]
% o
f ini
tial i
nduc
tanc
e
125µ 10µH125µ 2µH
Fig. 4.2 The change in inductance for the 125µ ferrite core with 2 and 10µH when the frequency is swept from 10kHz to 2 MHz.
In figure 4.3 it can be seen that the 60µ and the 125µ cores are equal up to 150 kHz and after that the 125µ
core starts to decline. One can also see that the 26µ core has the lowest inductance until 250 kHz and islower than 60µ to around 1 MHz where it passes.
16

4.2. Measurements
0.01 0.1 191
92
93
94
95
96
97
98
99
100
Frequency [MHz]
% o
f ini
tial i
nduc
tanc
e
125µ26µ60µ
Fig. 4.3 The change in inductance for 26µ, 60µ and 125µ MPP cores when the frequency is swept from 10 kHz to 2MHz.
The High flux cores, seen in figure 4.4 follows the same patternas the MPP cores with 26µ being lowerin the beginning and then take over as the most consistent after 200 kHz. The 26µ and 60µ cores dropsto 96.5% and 93% respectively which can be seen as a rather good result since the frequency range is,according Magnetics Inc. [21], between 60 Hz - 200 kHz.
0.01 0.1 186
88
90
92
94
96
98
100
Frequency [MHz]
% o
f ini
tial i
nduc
tanc
e
125µ26µ60µ
Fig. 4.4 The change in inductance for 26µ, 60µ and 125µ High flux cores when the frequency is swept from 10 kHz to2 MHz.
The Sendust cores can be seen in figure 4.5 and they perform well compared to the other powder materials.The 60µ core only declines 1.5% at 2 MHz whereas the 125µ reduces by 6%. The most interesting thingto note is that the 60µ have not reached the frequency where the more rapid reduction starts to take placewhich is the case for the 125µ core does.
17

Chapter 4. Frequency Measurements
0.01 0.1 193
94
95
96
97
98
99
100
Frequency [MHz]
% o
f ini
tial i
nduc
tanc
e
125µ60µ
Fig. 4.5 The change in inductance for 60µ and 125µ Sendust cores when the frequency is swept from 10 kHz to 2MHz.
4.2.2 Inductance deviation comparing different materials
In figure 4.6 it is evident that all the material keeps a high inductance through the whole test range and theyare packed tightly together, within 1% difference at 2 MHz. For the lower frequencies MPP has a lowervalue then the other two materials but it overtakes at around1.6 MHz.
0.01 0.1 196
97
98
99
100
Frequency [MHz]
% o
f ini
tial i
nduc
tanc
e
High FluxIronMPP
Fig. 4.6 The change in inductance for the 26µ MPP and High flux and 35µ iron when the frequency is swept from 10kHz to 2 MHz.
When comparing 60µ cores and both of the iron cores, one can see that Sendust clearly has the best per-formance for higher frequency when it comes to keep up the initial permeability with a value of 98.5% at2 MHz. The iron and MPP core is located directly after with a reduction to 96.2% and 96.6% respectively,followed by the High flux at 92.6%. The iron 75µ is by far the worst material when it comes to higherfrequencies since it starts to decline even below 100 kHz.
18

4.3. Analysis and discussion
0.01 0.1 160
70
80
90
100
Frequency [MHz]
% o
f ini
tial i
nduc
tanc
e
High FluxIronMPPSendust
Fig. 4.7 The change in inductance for the 60µ MPP, Sendust and High flux and 75µ iron when the frequency is sweptfrom 10 kHz to 2 MHz.
In figure 4.8 it is apparent that the 75µ iron core has the largest decline in inductance. It is extra interestingsince it is compared to the 125µ of the other cores since higher permeability materials in general declinesfaster than the lower permeabilities, see figure 4.1 - 4.5. The ferrite core keeps its inductance curve flatduring the whole frequency range, but it has diminished a few% after the resonance spikes. For the alloypowders Sendust is the one with the best performance with a 94% of its initial inductance remaining at 2MHz, closely followed by MPP at 91.4% and High flux a little bitlower at 86.5%.
0.01 0.1 160
70
80
90
100
110
120
Frequency [MHz]
% o
f ini
tial i
nduc
tanc
e
Ferrite
High Flux
Iron
MPP
Sendust
Fig. 4.8 The change in inductance for the 75µ iron and the 125µ MPP, Sendust, High flux and ferrite when the fre-quency is swept from 10 kHz to 2 MHz.
4.3 Analysis and discussion
When it comes to the frequency it is clear that the ferrite andSendust cores have the best performance butas seen in figure 4.8 the spikes in the ferrite plot has to be considered. Since this ferrite core is the onlyone tested there is no telling if this behavior is spread through out other ferrite cores or if it is a specificcharacteristic for the particular core. The overall performance of the powder materials is good and thedifferences between them is quite small.
19

Chapter 4. Frequency Measurements
When it comes to the frequency specification for the different powder materials the manufacturer sets arather low number on the frequency range, see section 2.3.2.From the tests it is clear that the permeabilitydeviation is not the main factor for the manufacturer when the set their frequency limit but it may be the corelosses that has the largest impact. Generally the frequencyis kept down because of the core losses duringthe switching and not the permeability deviation of the coreitself but nowadays the switching frequenciesfor converters are pushed to the MHz range which will effect the cores and this has to be accounted forwhen constructing the circuit.
A comparison between the measured values and the manufacturer [28] [29] values can be seen in table 4.1. Itshows the permeability deviation at 1 MHz and the differencebetween the measured and the provided valuesare quite small. The largest deviation is that Micrometals values for MPP and High flux is considerablylower for the 125µ. The values from both manufacturer are estimated from graphs and may not be fullyaccurate.
Table 4.1: Comparison between measured and manufacture values at 1 MHz. The result is presented as %of the initial permeability.
Measured Value [%] Data Sheet Magnetics [%] Data Sheet Micrometals [%]MPP 26µ 97.7 98 99MPP 60µ 97.6 98 96MPP 125µ 95 93 86High flux 26µ 97.5 98 98High flux 60µ 95.8 96 90High flux 125µ 92.4 93 84Sendust 60µ 98.8 99 98Sendust 125µ 96.6 97 96
20

5. DC-Bias Measurements
In this chapter the DC-currents effect on the permeability will be investigated. The reason for doing thesetests is to see how the material behave under various currentconditions since the inductors operate underdifferent conditions and these test may indicate where the materials has their optimal operating condition.
5.1 Test Setup
The DC-bias current is varied from 0-20 A with a step length of0.2 A and the inductance is measured withan inductance analyser 3245 from Wayne Kerr. The inductanceanalyser is fed with two parallel DC-suppliesat 20 A each.
The magnetising force is calculated in Oerstedt which is defined as
H =4πI
1000lm(5.1)
whereI is the current andlm is the mean magnetic path length of the core. The reason for plotting thepermeability deviation against the magnetising force is that both the number of turns and the current areaccounted for and thus makes the comparison more general andOerstedt is used because most of the manu-facturer use it in their data sheets. The relative permeability, µr is calculated from the measured inductancevalues as
µr =lmL
µ0AeN2(5.2)
whereL is the measured inductance,µ0 is the permeability of free space,Ae is the cross sectional area ofthe core andN is the number of turns of the conductor. The number of turns for the different permeabilitiescan be seen in table 3.1
5.2 Measurements
The DC-bias test have been divided into two categories. In the first the permeability deviation of the ma-terials are shown. The different materials are shown separately. In the second part the deviation of theinductance is presented. The materials are compared against one another and the plots are instead dividedwith respect to the relative permeability.
The inductance change is directly proportional to the change in permeability, since the permeability changeis derived from the inductance measurements. The reason forshowing these plots is to give backgroundfor the test with the buck converter because it is easier to see what happens with the inductor at differentcurrents. The idea at this stage was to use a buck converter that had an output inductor at 10µH but this gotchanged afterwards. The measurements was already performed and thus the were chose to be presented andcompared with the 2µH which is the value of the output inductor on the converter used.
21

Chapter 5. DC-Bias Measurements
5.2.1 Permeability deviations
In figure 5.1 the permeabilty deviation is shown for the two iron cores and one interesting observation thatcan be made is that both iron cores increases their permeability for lower magnetising forces. It is not bymuch, just around 2 % for the 35µ core. It is also clear that the higher permeability drops faster than thelower one.
100
101
102
40
50
60
70
80
90
100
Magnetising force [Oe]
% o
f ini
tial p
erm
eabi
lity
35µ75µ
Fig. 5.1 The change in permeability for 35 and 75µ iron cores as a function of Oerstedt.
The ferrite core in figure 5.2 starts to drop at once and has a more smooth drop of compared to the othermaterials and the reason that the starting value does not start at 100% is because the logarithmic plot doesnot start at zero. At 50 Oe the permeability has become as low as 10% of the original value which is verylow compared to the other materials.
100
101
10
20
30
40
50
60
70
80
90
100
% o
f ini
tial p
erm
eabi
lity
Magnetising force [Oe]
125µ
Fig. 5.2 The change in permeability for 125µ ferrite core as a function of Oerstedt.
In figure 5.3 three MPP cores with different permeabilities are shown. It is clear that the lower permeabilitycores keeps their values longer than the ones with higher initial permeability. The follow the same patternas the iron cores which is to be expected.
22

5.2. Measurements
100
101
102
40
50
60
70
80
90
100
% o
f ini
tial p
erm
eabi
lity
Magnetising force [Oe]
26µ60µ125µ
Fig. 5.3 The change in permeability for 26, 60 and 125µ MPP cores as a function of Oerstedt.
In figure 5.4 three High flux cores with different permeabilities are shown. At 100 Oe the 26µ core still has apermeability above 95% of its initial value and overall the High flux cores can withstand larger magnetisingforces than the MPP cores can. This is as expected since the High flux cores are created to be used in highcurrent applications.
100
101
102
60
65
70
75
80
85
90
95
100
105
% o
f ini
tial p
erm
eabi
lity
Magnetising force [Oe]
26µ60µ125µ
Fig. 5.4 The change in permeability for 26, 60 and 125µ High flux cores as a function of Oerstedt.
In figure 5.5 two Sendust cores with different permeabilities are shown. Compared to the other powdermaterials the Sendust cores tends to deviate from their initial values at lower magnetising forces. The shapesare more related to the iron cores and this may be due to the high amount of iron in the powder mix.
23

Chapter 5. DC-Bias Measurements
100
101
102
30
40
50
60
70
80
90
100%
of i
nitia
l per
mea
bilit
y
Magnetising force [Oe]
60µ125µ
Fig. 5.5 The change in permeability for 60 and 125µ Sendust cores as a function of Oerstedt.
5.2.2 Inductance Changes
For the cores with lower permeabilities permeabilities andlow initial inductance, figure 5.6, the change ininductance is very small with a change of just 10% at 20 A for the MPP cores. This depends on the lowamount of turns which yields a low magnetising force. If someturns are added, i.e. by looking at figure5.7, a much higher drop can be seen, especially for the MPP which drops down to 67% of its initial value.Because of the high magnetic saturation of the High flux, the reduction between 2µH and 10µH is low.The peak in the beginning for the iron core is clearly seen forthe 10µH case.
0 2 4 6 8 10 12 14 16 18 2088
90
92
94
96
98
100
102
Current [A]
Indu
ctan
ce [%
]
High FluxIronMPP
Fig. 5.6 The change in inductance for 26µ MPP and High flux and 35µ cores with a DC-current ranging from 0-20 A.All inductors has an initial inductance around 2µH.
24

5.2. Measurements
0 2 4 6 8 10 12 14 16 18 2065
70
75
80
85
90
95
100
105
Current [A]
Indu
ctan
ce [%
]
High FluxIronMPP
Fig. 5.7 The change in inductance for 26µ MPP and High flux and 35µ cores with a DC-current ranging from 0-20 A.All inductors has an initial inductance around 10µH.
Figures 5.8 and 5.9 gives a good comparison since all powder materials are present. High flux is yet againthe most stable core with the lowest amount of deviations. The iron powder has a higher permeability thanthe other cores which makes the inductance drop larger than if it had been an 60µ, according to figures5.1-5.5.
0 2 4 6 8 10 12 14 16 18 2065
70
75
80
85
90
95
100
105
Current [A]
Indu
ctan
ce [%
]
High FluxIronMPPSendust
Fig. 5.8 The change in inductance for 60µ MPP, Sendust and High flux and 75µ cores with a DC-current ranging from0-20 A. All inductors has an initial inductance around 2µH.
25

Chapter 5. DC-Bias Measurements
0 2 4 6 8 10 12 14 16 18 2040
50
60
70
80
90
100
Current [A]
Indu
ctan
ce [%
]
High FluxIronMPPSendust
Fig. 5.9 The change in inductance for 60µ MPP, Sendust and High flux and 75µ cores with a DC-current ranging from0-20 A. All inductors has an initial inductance around 10µH.
In figure 5.10 and 5.11 the 125µ cores are shown and once again the High flux is the best followed by MPPand Sendust. The iron core has a lower permeability than the other materials and it is still not performingbetter than High flux or the MPP core, except for high currentsfor the 10µH case. The reason why ironis added to this plot is because it was the largest permeability available as mentioned in chapter 3 and itwill be compared to the other materials in the converter test. The performance of the ferrite is significantlyworse than the other core materials.
0 2 4 6 8 10 12 14 16 18 200
10
20
30
40
50
60
70
80
90
100
Current [A]
Indu
ctan
ce [%
]
FerriteHigh FluxIronMPPSendust
Fig. 5.10 The change in inductance for 75µ iron core and the 125µ MPP, Sendust, High flux and ferrite cores with aDC-current ranging from 0-20 A. All initial inductors has aninductance around 2µH.
26

5.3. Analysis and discussion
0 2 4 6 8 10 12 14 16 18 200
10
20
30
40
50
60
70
80
90
100
Current [A]
Indu
ctan
ce [%
]
FerriteHigh FluxIronMPPSendust
Fig. 5.11 The change in inductance for 75µ iron core and the 125µ MPP, Sendust, High flux and ferrite cores with aDC-current ranging from 0-20 A. All initial inductors has aninductance around 10µH.
5.3 Analysis and discussion
For high magnetising forces, the High flux core is the strongest material since the permeability is kept at aconstant high value. The other powder materials has a higherreduction of their permeabilities where MPPis slightly better than Sendust. The iron core is harder to analyse since the permeabilities do not match theother powder cores. The 35µ core performs better than the 26µ MPP while the 75µ iron is not as good aseither the 60 and the 125µ MPP cores. The ferrite core is in the lower end of the cores as its inductancedrops instantaneously and this is due to the ferrites low saturation flux density.
In figures 5.1 - 5.5, all the permeability deviations for the different cores are shown. It can be seen that thehigher permeability material changes its permeability both earlier and faster compared to the lower on. Thisdepends on the fact that saturation is reached faster according to (2.7). The ferrite core in figure 5.2 has thehighest reduction of its permeability. This was as expectedsince this type of ferrite core, without air gap, isgenerally used in low current, high frequency applications.
When looking at figures 5.1 - 5.5 one can think that the lower permeabilities are better than the higher onessince the seem to be more stable. This is not entirely true because it all depends on the application theyare used in. As an example by looking at figure 5.3 it can be seenthat the effective permeability for the125µ core at 50 Oe is 50% of the initial i.e. 62µ compared to the 60µ core which has 80% of its initialpermeability i.e. 48µ. This is important when designing the inductor since a higher permeability materialrequires less turns and thus less conductor wire. It might also be possible to use a smaller core in that case.
When comparing the measured results with the data sheets acquired from the Magnetics [30] and Micromet-als [31] there are some differences. The results can be seen in table 5.1. Generally, the values for the higherpermeability are more equal than the lower ones. Magnetics values for their MPP cores tends to be higherthan the measured while Micrometals are slightly lower. Both Magnetics and Micrometals seems to under-estimate the High flux core and regarding the Sendust the values from Magnetics are a little lower and fromMicrometals a bit higher than the measured values. The values from both manufacturer are estimated fromtheir respective graphs and may not be fully accurate.
27

Chapter 5. DC-Bias Measurements
Table 5.1: Comparison between measured and manufacture values of magnetising force required to reach90% of initial permeability.
Measured Value [Oe] Data Sheet Magnetics [Oe] Data Sheet Micrometals [Oe]MPP 26µ 58 80 44MPP 60µ 33 38 32MPP 125µ 18.5 17.5 13High flux 26µ 100+ 100 70High flux 60µ 64 50 47High flux 125µ 23 23 27Sendust 60µ 24 16 30Sendust 125µ 10 8 14
28

6. Buck Converter Measurements
In this chapter, the different core materials will be used asan output inductor in a small Buck converter. Thefrequency as well as the current will be varied and the power will be measured on the input terminal as wellas the output terminal.
6.1 Test Setup
The efficiency test will be performed with a small buck converter from Texas Instrument, which has a fixedoutput voltage, 4 V and a maximum output current of 10 A. The input voltage can be varied between 4.5-18V. The frequency can be set by changing a resistor connected to the drive circuit. The switching frequencywas originally put to 300 kHz but by replacing the resistor with a potentiometer the switching frequencycan easily be changed. Frequencies between 0.2-1.9 MHz willbe used in the tests. A 100 W dynamic load,Chroma 63102, which can handle up to 20 A or 80 V is used in constant voltage mode. The current theload consumes is varied and both the input and output voltages and currents are measured from the buckconverter to get the efficiency of the whole circuit. The measurements are performed with a number of Fluke87 multimeters. The efficiency of the inductor itself is not measured since the board already have existingmeasurement points for in and output power.
6.2 Measurements
All curves presented are mean values of at least three different measurements series. The tests will includepermeability comparisons between different materials as well as different permeabilities with the same corematerial. Output ripple will be measured for the 125µ materials as well as both the iron cores and thefrequency, a second converter was also used in order to make higher current measurements.
6.2.1 Permeability Comparison
In this section the different materials will be presented one by one and with regards to the various perme-abilities. The voltages were put to 12 and 4 V for the input andoutput voltages respectively. The switchingfrequency was put to 400 kHz.
Figure 6.1 show the efficiency for the two iron cores and it caneasily be seen that the high permeabilityiron powder has higher losses. This corresponds to the theory mentioned in section 2.3 which states that thecore losses should be larger for the higher permeability material.
29

Chapter 6. Buck Converter Measurements
1 2 3 4 5 6 7 8 9 1060
65
70
75
80
85
90
95
100
Current [A]
Effi
ency
[%]
35µ75µ
Fig. 6.1 The efficiency of the buck converter as a function of output current for two iron cores with different initialpermeabilities.
Figure 6.2 shows that the core losses for the three MPP cores.Overall it can be seen that the differentpermeabilities keep up with each other due the low core losses in the MPP material and thus the differencebetween them are low.
1 2 3 4 5 6 7 8 9 1080
85
90
95
100
Current [A]
Effi
ency
[%]
125µ26µ60µ
Fig. 6.2 The efficiency of the buck converter as a function of output current for three MPP cores with different initialpermeabilities.
The difference between the High flux cores, seen in figure 6.3,is more apparent than the MPP cores. Theefficiency of the High flux cores has a higher spread than the MPP cores for lower currents. The shape ofthe 26µ core is different than the other curves in the fact that it starts to decline at 6 A.
30

6.2. Measurements
1 2 3 4 5 6 7 8 9 1080
85
90
95
100
Current [A]
Effi
ency
[%]
125µ26µ60µ
Fig. 6.3 The efficiency of the buck converter as a function of output current for three High flux cores with differentinitial permeabilities.
In figure 6.4 the performance of the Sendust cores are shown and they follow the same pattern as for theother materials i.e. the lower permeability material perform better and the curve shapes behave similarly.
1 2 3 4 5 6 7 8 9 1080
85
90
95
100
Current [A]
Effi
ency
[%]
125µ60µ
Fig. 6.4 The efficiency of the buck converter as a function of output current for two Sendust cores with different initialpermeabilities.
6.2.2 Material Comparison
This section will compare the different materials with the same permeabilities against each other. The 75µ
iron will be compared against the 125µ as well as the 60µ. The comparisons will be performed with thesame buck converter as in 6.2.1. The input voltage was put to 12 V and the output voltage was fixed at 4 V.The frequency was put to 400 kHz. The voltage ripple on the output of the buck converter will be measuredfor the 125µ material, since these has the largest ripple due to the higher inductance reduction. The 125µmaterials has also been tested with a sweep of the switching frequency between 0.2-1.9 MHz.
Figure 6.5 shows all the 60µ material and both of the iron powders. It can clearly be seen that the 75µ hasa much lower efficiency than all the other materials and this is due to higher core losses. When looking atthe other materials one will notice that Sendust is the most efficient material at lower currents followed byMPP and High flux. When the current increases all the materialmove towards each other except for the ironwhich is slightly lower than the other powder materials.
31

Chapter 6. Buck Converter Measurements
1 2 3 4 5 6 7 8 9 1065
70
75
80
85
90
95
100
Current [A]
Effi
ency
[%]
High Flux 60µIron 35µIron 75µMPP 60µSendust 60µ
Fig. 6.5 The efficiency of the buck converter as a function of output current for all 60µ material as well as the 75µ and35µ iron.
In figure 6.6 the different 125µ materials are presented as well as the 75µ iron. Even though the iron corehas a lower permeability its performance is still significantly lower than the rest of the materials. Sendusthas the highest efficiency across the whole current spectrumand the performance of the rest of the materialshave similar performance.
1 2 3 4 5 6 7 8 9 1065
70
75
80
85
90
95
100
Current [A]
Effi
ency
[%]
Ferrite 125µHigh Flux 125µIron 75µMPP 125µSendust 125µ
Fig. 6.6 The efficiency of the buck converter as a function of output current for all 125µ material as well as the 75µiron.
Ripple Measurement
The ripple measurement where made with an input voltage of 12V, an output current of 10 A and switchingfrequency 400 kHz. The ripple in the voltage occurs because of the ripple current according to (2.1) and theresults for the 75µ iron and all the 125µ cores can be seen in figure 6.7.
32

6.2. Measurements
0 0.5 1 1.5 2 2.5 3 3.5 4 4.5 5-20
0
20
-20
0
20
-20
0
Time [µs]
Vol
tage
Rip
ple
[mV
]
FerriteHigh FluxMPPSendustIron
Fig. 6.7 The output voltage ripple for all 125µ materials as well as the 75µ iron.
At time zero the switch is turned on and the voltage level increases until the switch is turned off at the peakat 0.8µs. The ripple for the materials has equal looking waveforms,when it comes to the shape. Sendusthas a slightly higher ripple than the other powder material and this can be explained by the fact that itsinductance drops a bit more. The reason that the ripple in theferrite core is as high as it is depends onthe fact that this core is close to its saturation meaning that the initial inductance of 2µH has been greatlyreduced. The small swing that will occur in the flux density will give rise to a high change in the ripplecurrent. Their are two possibilities to decrease the outputripple. First, one can increase the inductance ofthe inductor, this will give higher resistive losses since more copper wire is needed, or a higher outputcapacitance can be used.
6.2.3 High Current Buck Converter
In this section a different buck converter which can provide25 A output will be used to evaluate the ma-terials. In this case the inductor will be slightly over dimensioned due their size which makes it difficultto lower the inductance. The switching frequency for the tests is 500 kHz, the input voltage 14 V and theoutput voltage 1 V. Figure figure 6.8 shows the performance ofthe MPP cores and figure 6.9 shows theHigh flux cores.
5 10 15 20 2540
50
60
70
80
90
100
Current [A]
Effi
cien
cy [%
]
125µ26µ60µ
Fig. 6.8 The efficiency of the buck converter as a function of output current for three MPP cores with different initialpermeabilities when the current is increased to 25 A.
33

Chapter 6. Buck Converter Measurements
5 10 15 20 2540
50
60
70
80
90
100
Current [A]
Effi
cien
cy [%
]
125µ26µ60µ
Fig. 6.9 The efficiency of the buck converter as a function of output current for three High flux cores with differentinitial permeabilities when the current is increased to 25 A.
One can clearly see that in this case the core losses are significantly lower due to the rather high inductancevalue which can be seen because all the cores have similar efficiency at the lower currents when comparedto figure 6.2. This becomes very clear at 7 A where the resistive losses takes over for the 26µ which starts tolose efficiency compared to the other two cores. The 60µ follow the same pattern at 7 A. Here it is clear thatthe trade of between high inductance and resistive losses should be considered when designing a DC-choke.
6.2.4 Frequency Sweep in Buck Converter
In this test the frequency has been swept from 0.2-1.9 MHz with an input voltage of 18 V, an output voltageof 4 V and a current of 10 A. The test was performed with all 125µ cores and 75µ iron core since all thedifferent materials where present. It is important to note that the differences between the material is not onlydependent on the frequency since they behave different for high current. Another factor with an increasingfrequency is that the inductor itself becomes over dimensioned since the ripple decreases. This will havethe effect that the material characteristics becomes more equal since the AC flux shrinks and the results canbe seen in figure 6.10.
0.2 0.4 0.6 0.8 1 1.2 1.4 1.6 1.884
86
88
90
92
94
96
98
100
Frequency [MHz]
Effi
cien
cy [%
]
Ferrite 125µHigh Flux 125µIron 35µIron 75µMPP 125µSendust 125µ
Fig. 6.10 The efficiency for all 125µ material as well as the 35µ and 75µ iron when the switching frequency is sweptin the Buck converter.
One of the first things to notice is that the difference between the different materials is largest for lower
34

6.3. Analysis and discussion
frequencies. Sendust and MPP has the best performance but except from the 75µ iron all materials hassimilar curves. All materials has its efficiency declining with higher frequencies and this is because of theincreased switching losses in the converter and not specifically in the inductor.
6.3 Analysis and discussion
All materials except 75µ iron have similar results but Sendust and MPP have a slightlybetter performancethan the other materials. The largest differences can be seen for lower frequencies and low currents. Thereason for the similar performance is that the majority of the losses is located in the copper wires and theother parts of the converter. This is easiest seen in figures 6.8 and 6.9 where most of the difference above 7A is because of the larger copper resistance for the lower permeability materials.
When focusing on the lower currents it is seen that the High flux core has lower efficiency which corre-sponds to the higher core losses. The performance for the High flux increases with an increase of the outputcurrent in regards to both MPP and Sendust. This mainly depends on the fact that the High flux core keep itsinductance value, i.e. the core losses of MPP and Sendust increases. The performance of MPP and Sendustis similar for all currents tested. This depends on that bothmaterial has low core losses but mostly that thebuck converter give rise to a low flux swing. For currents above 6 A, the High flux core perform as well asthe MPP and Sendust cores.
The ferrite core performs as the other materials for lower currents, mostly because of its very low corelosses, but as the current increases the inductance will drop quickly, see figure 5.10. Even though the ferritecore has a good efficiency, a drawback is that the ripple across the load is a lot higher than the other materialswhich can be seen in figure 6.7.
35

Chapter 6. Buck Converter Measurements
36

7. BH-curve Measurements
The content of this chapter includes measurements of the BH-curve for the different materials. Core lossesfor 10 kHz has also been measured.
7.1 Test Setup
The BH-curve of the core materials will be measured by putting two separate windings on the inductor core.The primary core will create the magnetising force and the secondary winding will be used for measuringthe voltage. The inductor will be fed by an AC voltage from a custom made amplifier available at the site.The current will be measured with a current probe, Lecroy A015, at the primary side and the voltage curvewill be measured by an oscilloscope at the secondary side. The full setup can be seen in figure 7.1.
Vac V
A
N1:N2
Fig. 7.1 Schematics for the setup of the BH-curve measurements.
The cores has been wounded uniformly across the surface of both the primary and secondary side, thisto make the fields more uniform. This will also improve the coupling between the two windings. Themagnetising force can be calculated from equation (2.10) as
H =N1i
l(7.1)
whereN1 is the number of turns on the primary winding,i is the current in the winding andl is the meanmagnetic path of the inductor core. The flux density will be calculated from the output of the secondarywinding as
B =1
AN2
∫
VLdt (7.2)
whereA is the cross sectional area of the core,N2 is the number of turns on the secondary winding andVL is the voltage of the secondary winding [32]. To reach the saturation levels a high amount of turns areneeded on the primary winding as well as a high current.
The reason for measuring at the secondary side is to reduce the effect of the resistive voltage drop on theprimary side. No current flow at the secondary side, because of the 1 MΩ impedance of the Oscilloscope,which implies that the voltage on the secondary side only is affected by the magnetising current [33].
37
Chapter 7. BH-curve Measurements
For practical reasons the 26µ and the 35µ will not be measured because of the high number of turns thatis necessary to reach saturation. For the other cores refer to Table 7.1 for primary and secondary windings.Note that the primary winding may differ a bit from the initial value due to the human factor when manuallywounding the cores.
Table 7.1: TurnsPrimary Secondary
60µ 130 3075µ 100 22125µ 75 15
When the core losses were measured the same amount of turns was wounded on both the primary and thesecondary coil of the core because then no transformation between the two sides are necessary. The numberwas chosen to 30 turns each and the core loss is calculated as
P =VsecondaryIprimary
V olume(7.3)
whereVsecondary is the voltage of the secondary side,Iprimary is the current on the primary side andV olume is the volume of the core.
7.2 Results
In this section the BH-curve measurements will be evaluated. The material will be compared permeabilityagainst permeability.
7.2.1 BH-curve
Figure 7.2 shows the BH-curves for the 60µ cores as well as the 75µ iron. In the linear region it can be seenthat the materials show the same slope which is predicted since the permeability should keep its value inthat region.
When comparing MPP and Sendust, one can see that they have very similar shapes although the Sendustslope starts to flatten earlier then the MPP. When looking at the higher magnetising force one can seethat the Sendust core rises above the MPP. Since the Sendust core starts to flatten earlier it means that itspermeability starts to decline earlier then the MPP and thiscan also be seen in figure 5.9. Since the Sendustgets a slightly higher flux density at higher magnetising forces, this would imply that the saturation fluxwould be higher, but this could not be tested due to limitation of the equipment.
When looking at the High flux core it is clear that the saturation flux is much higher than for MPP andSendust. This was no surprise since the High flux core has its name because of its high flux density. The ironhas not the same shape in the linear region as the other material since it has a different initial permeability.One can see that the iron starts to flatten around the same value as the Sendust but at a faster pace. On theother hand the flux density is much higher than any of the othermaterials.
38
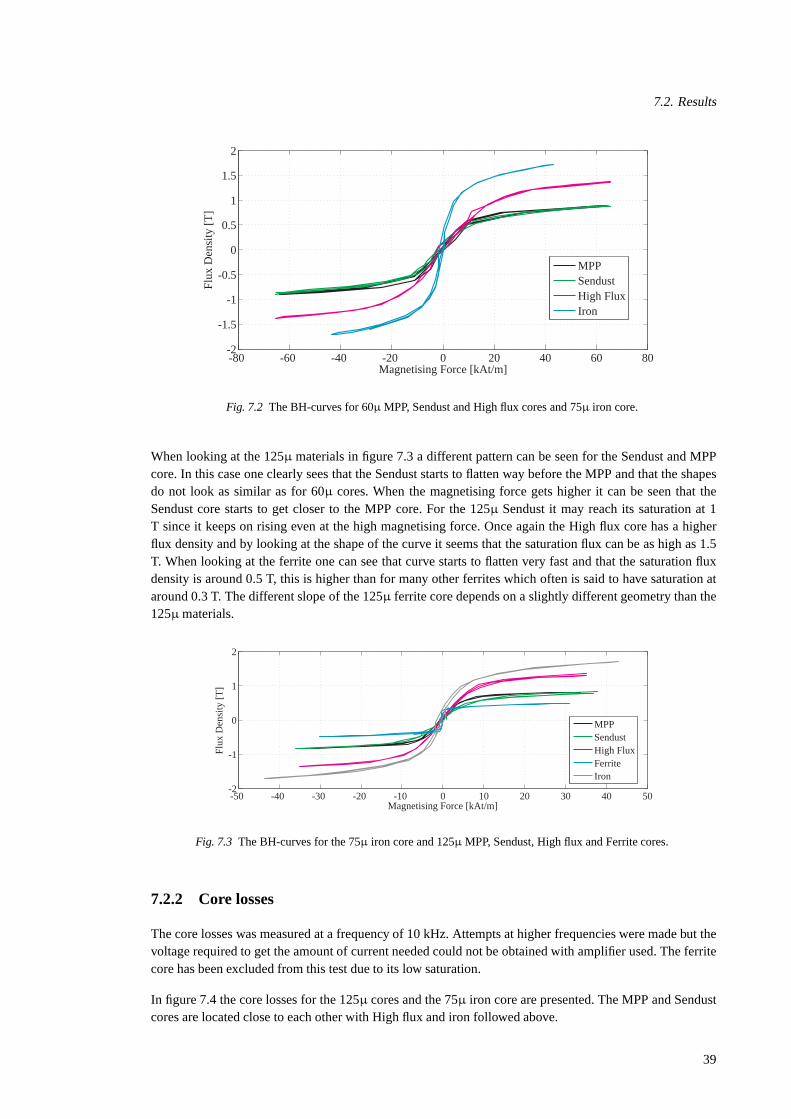
7.2. Results
-80 -60 -40 -20 0 20 40 60 80-2
-1.5
-1
-0.5
0
0.5
1
1.5
2
Magnetising Force [kAt/m]
Flu
x D
ensi
ty [T
]
MPPSendustHigh FluxIron
Fig. 7.2 The BH-curves for 60µ MPP, Sendust and High flux cores and 75µ iron core.
When looking at the 125µ materials in figure 7.3 a different pattern can be seen for theSendust and MPPcore. In this case one clearly sees that the Sendust starts toflatten way before the MPP and that the shapesdo not look as similar as for 60µ cores. When the magnetising force gets higher it can be seen that theSendust core starts to get closer to the MPP core. For the 125µ Sendust it may reach its saturation at 1T since it keeps on rising even at the high magnetising force.Once again the High flux core has a higherflux density and by looking at the shape of the curve it seems that the saturation flux can be as high as 1.5T. When looking at the ferrite one can see that curve starts toflatten very fast and that the saturation fluxdensity is around 0.5 T, this is higher than for many other ferrites which often is said to have saturation ataround 0.3 T. The different slope of the 125µ ferrite core depends on a slightly different geometry than the125µ materials.
-50 -40 -30 -20 -10 0 10 20 30 40 50-2
-1
0
1
2
Magnetising Force [kAt/m]
Flu
x D
ensi
ty [T
]
MPPSendustHigh FluxFerriteIron
Fig. 7.3 The BH-curves for the 75µ iron core and 125µ MPP, Sendust, High flux and Ferrite cores.
7.2.2 Core losses
The core losses was measured at a frequency of 10 kHz. Attempts at higher frequencies were made but thevoltage required to get the amount of current needed could not be obtained with amplifier used. The ferritecore has been excluded from this test due to its low saturation.
In figure 7.4 the core losses for the 125µ cores and the 75µ iron core are presented. The MPP and Sendustcores are located close to each other with High flux and iron followed above.
39

Chapter 7. BH-curve Measurements
0.1 10.01
0.1
1
10
Flux Density [T]
Cor
e Lo
ss [W
/cm3 ]
High FluxMPPSendustIron
Fig. 7.4 The measured core losses as a function of the flux density for the 75µ iron core and 125µ MPP, Sendust andHigh flux cores at 10 kHz.
In figure 7.5 the core losses for the 60µ cores and the 35µ iron core are presented. The curves follow thesame pattern as for the 125µ with the small exception that the High flux core is closer to both Sendust andMPP.
0.1 1
0.1
1
10
Flux Density [T]
Cor
e Lo
ss [W
/cm3 ]
High FluxMPPSendustIron
Fig. 7.5 The measured core losses as a function of the flux density for the 60µ cores and the 35µ at 10 kHz.
7.3 Analysis and Discussion
Overall one can see that all materials have thin BH-curves which is the case for soft magnetic materialsas mentioned in section 2.3. One interesting observation isthat the MPP and Sendust cores have similarshapes as well as limits to their respective flux density at around 0.8 T which is where the MPP core shouldhave its limit. However, the Sendust core should saturate at1 T according to the manufacturers and thisis conclusive for both the 60µ and the 125µ permeabilities. The High flux core is also a bit lower than itsexpected value at 1.5 T but as seen in figures 7.2 and 7.3 the slope has not yet flattened which still makes itpossible for it to reach its expected value.
40

7.3. Analysis and Discussion
When it comes to core losses the materials are located in the expected order which is MPP, Sendust, Highflux and iron where the lowest core losses are mentioned first.The core losses matches the manufacturesdata sheet [34] well for the frequency used. One interestingresult is that the losses are higher for the lowpermeability materials and the same phenomenon can be seen when studying the data sheets for the coresat this low frequency. This pattern changes at higher frequencies and thus the higher permeability cores willhave higher losses. In table 7.2 the losses at 0.3 T are presented. Note that the manufacture did not have anyvalues for Sendust at 10 kHz available.
Table 7.2: Core loss comparison between measured and manufacture values at 0.3 T.Measured Value [W/cm3] Data Sheet Magnetics [W/cm3]
MPP 60µ 0.4 0.5MPP 125µ 0.23 0.175High flux 60µ 0.7 0.7High flux 125µ 0.65 0.42Sendust 60µ 0.55 -Sendust 125µ 0.27 -
If one compares the core losses figures with the BH-curve figures one can see that the MPP and Sendustgraphs are close to each other in all figures. As explained in section 2.1.1 the losses is the movement in theBH-curve and this seems to correspond well between the two measurements.
41

Chapter 7. BH-curve Measurements
42
8. Categorisation
When analysing the measurements some trends are very clear and comprehensive across all tests. The firstone is that High flux has an excellent DC-bias performance where the inductance keeps a high value evenwhen stressed with high magnetising forces. A drawback withthe High flux is that it has lower efficiency inthe buck converter test for lower currents, compared to Sendust and MPP, because of its higher core losses.
When looking at the two powder materials with the lower core losses, MPP and Sendust, one can clearlysee that they are in league with the standard ferrite. One interesting thing is that Sendust cores performedbetter than MPP for all buck tests with high ripple, which wasa bit surprising since the manufactures alwayspromotes MPP as a lower core loss material, see 7.2.2. The 75µ iron core had the overall worst performanceof all the cores. It was especially obvious in the buck tests where it was not even close to the other materials.The reason for this is not clear and parallels can not be drawnto other types of iron cores.
All the tested materials followed the same trend when it comes to core losses for different permeabilities,higher permeability yields higher core losses, but the resistive losses will at some point be the major lossfactor. When it comes to storage vs size it is important that the inductor can handle High flux densityaccording to (2.8) since the flux density is dependent on the effective area of the core. So if the designerwant to reduce the size of the core but still maintain the inductance one must choose a core material withhigh saturation flux density or a material that keeps the inductance even if the current goes up.
By looking at the material in this thesis, to keep a high inductance one might use the iron which has a reallyhigh saturation flux which will keep the inductance even for small cores. An even better alternative wouldbe the High flux core, although it has a lower saturation flux density but the permeability will be higherdue to that its BH-curve starts to flatten for higher magnetising forces than the iron. Another way is to usea higher permeability which will yield in higher inductanceper turn of wire according to (2.14). This willcause one problem if the current gets to high since higher permeability will decrease faster than the lowerone. If one would want higher permeability MPP would be a goodchoice since it has a permeability rangeup 550µ.
For high current applications with low frequencies below 50kHz iron would be preferred due to its highsaturation flux density and low cost since the low frequency will keep the losses down. If the frequencygoes up then High flux would be preferred because of the high current. For frequency higher than 500 kHzone would have to choose between MPP and Sendust and if the current is too high MPP will not be a goodsolution since it has lower saturation flux density than Sendust according to the manufactures, although ithas not been confirmed in this thesis. If the frequency reaches a couple of MHz, ferrites would be the onlychoice but then an air gap has to be introduced, alternatively one could increase the area of the core but thatwill make the inductor larger which could be a limiting factor.
For buck converters it is, as mentioned, important to have aninductor which can handle high current and isnot so dependent of the switching frequency. The test in chapter 6.1 shows that most material can keep theefficiency high but with different output ripple due to reduced inductance. The material that overall werethe best was Sendust and this core was also one of the cheapestwhich would make it a good choice for aDC-choke. This is because of its rather high saturation flux and low core losses.
When it comes to low current applications most of the materials can be used, and in this case it may be
43
Chapter 8. Categorisation
a good idea to use lower permeability because the resistive losses will be lower and instead core losseswill be more dominant. Lower permeability has been shown in the thesis to give higher core losses at lowfrequencies. In this case it can be suitable to use a iron powder core up to some kHz since the losses arelower. Otherwise, if the frequency goes up it is suitable to ferrite since if the current is low, the ferrite willnot reach saturation. If the inductance has to be larger MPP and Sendust would be good choice.
Overall one can say that all the powder material has good performance when it comes to high currents,especially when compared to ferrites. One drawback for the powder materials is their limited core shapeswhere both MPP and High flux are limited to toroidal, while iron powder and Sendust comes in more shapeswhich can be good for a designer with special needs for a design.
Another issue for powder materials is the cost of the cores. Alot of the cores has high nickel content aswell as a costly manufacturing process. When talking to various suppliers of standard inductors, whichwas performed when trying to get hold of test samples, most ofthem expect that they will not start tomake standard components from MPP and High flux in the near future. Most of them promotes their ironpowder since it is easier to work with, the cost for material is much cheaper and the demand is higher. Themanufacturers say that they are not willing to invest in the machinery necessary to make MPP and Highflux due to its cost and limited market for those materials.
Due to aging of the iron powder binders it would not be recommended to use this material for long termapplications, where instead ferrite and the other powder materials does not age in the same way. Whendesigning an application which should last for many years then it would preferred to avoid the iron powderbecause of its organic binder.
44

9. Conclusion
The powder materials tested shows good performance in all tests that has been conducted in this thesis. Theresults confirm that the alternative materials fits in the frequency region between where iron and ferrite coreshas their best performance. The powder materials are suitable as output inductors in DC-DC applicationswhich can be seen in chapter6. The High flux cores had the best performance with high DC-current whereasSendust had the best performance with higher frequencies. The MPP material had the lowest core losses.According to the BH-curve tests, Sendust and to some point High flux did not reach their specified fluxdensity limits. Sendust have been the material that has had the best overall performance. Other positiveaspects with Sendust is that it is the cheapest of the new powder material and the core can be made in othershapes than toroidal.
9.1 Future Work
In order to be able to use the powder material in commercial applications the temperature limits of thematerials has to be investigated, especially the long term stresses under high temperature has to be studied.There would also be a need to optimise the inductor design in aspecific application and compare thesewith the materials used today, for instance with gapped ferrite cores since they have not been compared inthis thesis. Another aspect to consider is the possibility of creating adequate spice models for the differentmaterial which can be a helpful asset in the design process.
45

Chapter 9. Conclusion
46

References
[1] M. W. Horgan, “Inductor core technology: Shrinking power supplies,”Power Electronics Technology,vol. 28, July 2002.
[2] G. L. Johnson,Solid State Tesla Coil, October 2001.
[3] D. K. Cheng,Field and Wave Electromagnetics, 2nd ed. Addison-Wesley, 1989.
[4] A. I. Pressman,Switching Power Supply Design, 3rd ed. McGraw-Hill, 2009.
[5] W. T. McLyman,Transformer and Inductor Design Handbook, 4th ed. Taylor and Francis Group,LLC, 2011.
[6] H. Johnson. Skin effect calculation. Accessed 2013-04-11. [Online]. Available:http://www.sigcon.com/Pubs/misc/skineffect-calculations.htm
[7] N. Mohan, T. M. Undeland, and W. P. Robbins,Power Electronics: Converters, Applications andDesign, 3rd ed. John Wiley and Sons, 2002.
[8] “Magnetics all products bulletin,” Magnetic Inc., 2011, product Bulletin.
[9] N. J. Schade, “Core losses in composite inductors,” Design Handbook, Vishay Intertechnology, Inc.[Online]. Available: http://ecadigitallibrary.com/pdf/CARTSEUROPE06/3.6%20Shadea.pdf
[10] “Soft ferrites and accesories,” Ferroxcube, 2008.
[11] Learn more about ferrite cores. Magnetics, Inc. Accessed 2013-04-12. [Online]. Available:http://www.mag-inc.com/products/ferrite-cores/learn-more-about-ferrites
[12] Learn more about powder cores. Magnetics, Inc. Accessed 2013-07-04. [Online]. Available:http://www.mag-inc.com/products/powder-cores/learn-more-about-powder-cores
[13] “Using magnetic cores at high temperature, cg-06,” Magnetics, Inc, technical Bulletin.
[14] “Powder cores catalog,” Magnetics, Inc, 2012, productCatalog.
[15] Iron powder cores. KDM Co.Ltd. Accesed 2013-07-04. [Online]. Available:http://www.kdm-mag.com/products/Iron-Powder-Cores1/
[16] “Section i: Iron powder cores,” Amidon,Inc, accessed 2013-07-04. [Online]. Available:http://www.amidoncorp.com/productimages/specifications/1-02.pdf
[17] Whats new. Micrometals. Accesed 2013-07-04. [Online]. Available:http://www.micrometals.com/whatsnewindex.html
[18] T.Slatter, “A comparson of molybedenum permalloy powder and sendust cores for energy storageinductors.” Arnold Engineering company, May 2000.
[19] “Micrometals arnold powder cores catalog,” Micrometals Arnold Powder cores, 2012, product Cata-log.
47
References
[20] “Learn more about high flux cores,” Magnetics Inc., accesed 2013-05-31. [Online]. Available:http://www.mag-inc.com/products/powder-cores/high-flux-cores/learn-more-high-flux
[21] “Magnetics powder cores,” Magnetics Inc., accessed 2013-05-31. [Online]. Available:http://www.mag-inc.com/products/powder-cores
[22] M. A. Willard and M. Daniil, “Nanostructured soft magnetic materials,” inNanoscale Magnetic Ma-terials and Applications, J. P. Liu, E. Fullerton, O. Gutfleisch, and D. J. Sellmyer, Eds. Springer US,2009.
[23] M. Ferch, “Softmagnetic materials in todays power electronic designs,” Magnetec, 2000, technicalBulletin.
[24] Htc iron powder core. Manz Electronic Systeme OHG. Accessed 2013-04-15. [Online]. Available:http://www.manz-electronic.com/producthtc-iron-powder-cores20.html
[25] Thermal aging. Micrometals, Inc. Accessed 2013-07-04. [Online]. Available:http://www.micrometals.com/thermalagingindex.html
[26] Taf200. Curie Industrial. Accessed 2013-04-15. [Online]. Available:http://www.curie.com.tw/p2-material-1.asp
[27] J. Smith, “Self-resonant frequency of an inductor,” Clifton Laboratories, accessed 2013-08-20.[Online]. Available: http://www.cliftonlaboratories.com/self-resonantfrequencyof inductors.htm
[28] “Permeability vs frequency curves for powder cores,”Magnetic Inc., accessed 2013-08-20. [Online]. Available:http://www.mag-inc.com/products/powder-cores/permeability-versus-frequency-curves-for-powder-cores
[29] “Permeability v. frequency curves for mpp, hi-flux, smss cores,” Micrometals, 2011, product Bulletin.
[30] “Permeability vs dc-bias curves for powder cores,” Mag-netic Inc., accessed 2013-08-20. [Online]. Available:http://www.mag-inc.com/products/powder-cores/permeability-versus-dc-bias-curves-for-powder-cores
[31] “Permeability v. dc bias curves for mpp, hi-flux, smss cores,” Micrometals, 2011, product Bulletin.
[32] W. Soong, “Bh-curve and iron loss measurement for magnetic materials,” Power Engineering Briefingnote series, School of Electrical and Electronic Engineering, Universiy of Adelaide, 2008.
[33] Y. Han, W. Eberle, and Y.-F. Liu, “New measurement methods to characterize transformer core lossand copper loss in high frequency switching mode power supplies.” in 35th Annual IEEE Power Spe-cialists Conference. Queen’s University at Kingstion, 2004.
[34] “Core loss density curves for powder cores,” Magnetic Inc., accessed 2013-08-20. [Online]. Available:http://www.mag-inc.com/products/powder-cores/core-loss-density-curves-for-powder-cores
48