POVERTY AND ENVIRONMENT INKS The Case of Rural Cambodia · PDF filePoverty and Environment...
44
CDRI - Cambodia’s leading independent development policy research institute POVERTY AND ENVIRONMENT LINKS: The Case of Rural Cambodia TONG Kimsun and SR Y Bopharath Working Paper Series No. 64 November 2011 A CDRI Publication
Transcript of POVERTY AND ENVIRONMENT INKS The Case of Rural Cambodia · PDF filePoverty and Environment...

CDRI - Cambodia’s leading independent development policy research institute
POVERTY AND ENVIRONMENT LINKS: The Case of Rural Cambodia
TONG Kimsun and SRY Bopharath
Working Paper Series No. 64
November 2011
A CDRI Publication


iCDRI Working Paper Series No. 64
POVERTY AND ENVIRONMENT LINKS:The Case of Rural Cambodia
CDRI Working Paper Series No. 64
TONG Kimsun and SRY Bopharath
CDRI Cambodia’s leading independent development policy research institute
Phnom Penh, November 2011

ii Poverty and Environment Links: The Case of Rural Cambodia
© 2011 CDRI - Cambodia’s leading independent development policy research institute
All rights reserved. No part of this publication may be reproduced, stored in a retrieval system or transmitted in any form or by any means—electronic, mechanical, photocopying, recording, or otherwise—without the written permission of CDRI.
ISBN-10: 99950–52–57-7
Poverty and Environment Links: The Case of Rural Cambodia
CDRI Working Paper Series No. 64
November 2011
TONG Kimsun and SRY Bopharath
Responsibility for the ideas, facts and opinions presented in this research paper rests solely with the authors. Their opinions and interpretations do not necessarily reflect the views of the Cambodia Development Resource Institute.
CDRI� 56, Street 315, Tuol Kork� PO Box 622, Phnom Penh, Cambodia℡ (+855-23) 881-384/881-701/881-916/883-603/012 867-278� (+855-23) 880-734 E-mail: [email protected] Website: http://www.cdri.org.kh
Layout and cover design: ENG Socheath and OUM ChanthaPrinted and bound in Cambodia by Angkor Offset, Phnom Penh
iiiCDRI Working Paper Series No. 64
Table of Contents
Lists of Tables .......................................................................................................................... ivAcronyms .................................................................................................................................. vAcknowledgement .................................................................................................................. viiAbstract .................................................................................................................................... ix
1. Introduction ......................................................................................................................... 1
2. Literature Review on Poverty and Climate Change ........................................................ 3
3. Data and Methodology ....................................................................................................... 5
4. Empirical Analysis .............................................................................................................. 74.1. Environmental Income ...................................................................................................74.2. Natural Disaster and Poverty .........................................................................................9
5. Mitigating and Coping Strategies for Climate Change ................................................. 15
6. Conclusion and Policy Implications ................................................................................ 21
References .............................................................................................................................. 22
CDRI Working Paper Series ................................................................................................... 29

iv Poverty and Environment Links: The Case of Rural Cambodia
Lists of Tables
Table 1: Rural per capita Income by Aggregated Income Sources ......................................... 7
Table 2: Poverty Incidence by Region .................................................................................... 8
Table 3: Rural Poverty Estimates for Differing Measures of Income ..................................... 9
Table 4: Natural Disasters at Village Level (mean), 2001-05 ................................................. 9
Table 5: Poverty Headcount Index by Region, 2004 and 2007 ............................................. 10
Table 6: Rural Poverty Headcount Index by Region and Natural Disaster, 2001-05 ........... 11
Table 7: Descriptive Statistics of Dependent and Independent Variables ............................. 11
Table 8: Empirical Results .................................................................................................... 13
Table 9: Mechanisms for Managing Risks ............................................................................ 16
Table 10: Public Sector Interventions in Response to Crises and Natural Disasters .............. 18
vCDRI Working Paper Series No. 64
Acronyms
CDRI Cambodia Development Resource Institute
CCCO Cambodia Climate Change Office
CDM Clean Development Mechanism
CSES Cambodia Socio-economic Survey
DNA Designated National Authority
GDP Gross Domestic Product
IADB Inter-American Development Bank
MOE Ministry of Environment
MOP Ministry of Planning
MRC Mekong River Commission
NAPA National Adaptation Programme of Action
NCCC National Climate Change Committee
NCDM National Committee for Disaster Management
NGO Non-governmental Organisation
USD United States Dollar


viiCDRI Working Paper Series No. 64
Acknowledgements
This study was prepared for the Conference on “The Environment of the Poor” held on 24-26 November 2010 in New Delhi, India, under the sponsorship of Asia Development Bank. Its short version will be published by Oxford University Press by the end of 2011.
This study has benefited from invaluable comments from and discussions with Dr Rebecca Catalla, Dr Amin Bauer and participants at the conference noted above. We thank Ms Pon Dorina and Mr Ker Bopha for their excellent research assistance, and CDRI administration staff for their efficient organisation of logistical arrangements for the field work in Pursat province. Our special thanks go to Ms Susan Watkins who edited this working paper. We are grateful to Mr Larry Strange and Mr Ung Sirn Lee for their encouragement and support.
Phnom Penh
November 2011


ixCDRI Working Paper Series No. 64
Abstract
Environment and poverty nexus is still a polemical issue. Some schools of thought claim that it is poverty that has the major effect on the environment, while another perspective suggests that the environment has more impact on the poor than vice-versa because the poor have no power to exploit the environment. In the context of Cambodia, there is a general consensus that the poor, particularly those living in rural areas, are heavily dependent on the environment i.e. common property resources. If the environment is degraded, the livelihoods of those people will definitely be severely affected.
This paper aims to address the impact of environmental degradation on poverty in Cambodia. We use the Cambodia Socio-economic Survey in 2007 (CSES 2007) and other available secondary data to examine the impact of environmental income (forestry and hunting) and that of environmental variables such as flood, drought, and land erosion on poverty. Following Cavendish (1999), we use a simple descriptive method to assess the former hypothesis. To take other factors into account, probit regression method is adopted to investigate the latter. The study also attempts to examine household risk coping strategies and limitations in response to environmental change, as well as the government’s mitigation and coping strategies.
The results show that poverty rate will increase by an average of 16.3 percent if rural households are unable to access forestry and hunting at all, of which the headcount ratio in Tonle Sap (wetland) is likely to edge up by 14.1 percent. Drought is likely to increase the poverty rate by 6 percent, while flood decreases it by 4 percent. The unexpected result for the case of flood is largely because it is commonly viewed as a source of profit rather than a source of disaster as it usually contributes to the wealth of biodiversity, abundance of fish and soil fertility in Cambodia (MRC 2006). Meanwhile, we also find that a 1 percent increase in land erosion (land productivity as proxy) raises the poverty rate by 3 percent.


1CDRI Working Paper Series No. 64
1
Introduction
Despite fragile political stability in the 1990s, the Cambodian economy has grown at a remarkable speed with average annual growth of about 7.2 percent. Once real political stability was resumed in 1999 (i.e., when the last Khmer Rouge soldiers surrendered and were integrated into society), the economic growth rate accelerated to 9.3 percent per year for the period 2000-2008 which resulted in increasing real per capita income and declining poverty rate. GDP per capita, which was only USD229 in 1993, had doubled to USD455 in 2005 and stood at USD594 in 2007. According to the latest World Bank Poverty Assessment report, the poverty headcount in Cambodia had declined to 30 percent in 2007 from 47 percent in 1993/94. During the same period, other socio-economic indicators such as school enrolment, housing condition, access to safe drinking water, electricity and sanitation have also significantly improved (MOP 2006; World Bank 2009).
Despite this impressive performance, poverty reduction has not been uniform across the country. Poverty rates are higher in rural areas than in urban areas in all geographical zones (MOP 2006). Among the five geographical zones of the country, Plateau/ Mountains is the poorest region with a poverty rate of more than 52 percent in 2004, followed by Tonle Sap (42 percent), Plains (32 percent), Coastal (27 percent) and Phnom Penh (4.6 percent). Given that the Tonle Sap zone accounts for 30 percent of Cambodia’s total population (MOP 2009), of which 42 percent are poor, it has become a special concern to policy makers and other international as well as national stakeholders. The Participatory Poverty Assessment of the Tonle Sap region conducted by the Cambodian Development Resource Institute (2007) in collaboration with the National Institute of Statistics and the Asian Development Bank reveals that the poor have benefited less from Cambodia’s rapid economic growth and still depend heavily on land and water-based natural resources to sustain their livelihoods. Several years of drought and flood, along with poor soils and a lack of water management capacity, have eroded farming capacity which in turn has pushed a large number of the poor to emigrate elsewhere within the country or to Thailand and Malaysia. The report also shows that the poor lack access to basic public services such as safe drinking water, education and health services.
It is widely noted that the frequency and severity of droughts, floods, hurricanes, tropical storms, landslides, earthquakes, volcanic eruptions and El Nino episodes during 1980-99 seem to have increased globally (IADB 2000). The same general trend has been observed in Cambodia. The incidence of flood in the 2000s has increased sharply compared to the late 1990s (see Appendix 1). Such adverse shocks are often considered to be the cause of poverty, but there have been few empirical studies to investigate their impact on household welfare (poverty) in Cambodia. Analysis of these problems has not been possible due to the lack of household survey data that integrates local environmental variables (for example, deforestation, outdoor and indoor air and water quality, soil erosion). This study attempts to fill the gap by utilising the Cambodia Socio-economic Survey (CSES) 2007 data and environmental indicators (drought, flood, soil erosion) to examine the correlation between poverty and the environment. The study also tries to investigate the impact of lost environmental income (forestry income) of household welfare on poverty, the government’s adaptation and mitigation plans particularly on how the programmes can play the dual role of providing immediate and effective relief to households
2 Poverty and Environment Links: The Case of Rural Cambodia
affected by crisis, and rural households’ mitigation (ex-ante) and coping (ex-post) strategies as well as their limitations in responding to environmental changes.
This working paper is organised as follows: Section 2 reviews a selection of previous studies in other countries, while Section 3 focuses on Cambodia. Section 4 describes the characteristics of the data and methodology. Section 5 provides an empirical analysis. Section 6 presents the government climate change adaptation and mitigation policy, and household ex-post and ex-ante risk coping strategies. Section 7 concludes and discusses policy implications.

3CDRI Working Paper Series No. 64
2
Literature Review on Poverty and Climate Change
The poverty-environment relationship is complex and dynamic, and difficult to comprehend in all of its dimensions. For the purpose of poverty reduction, it is useful to address two aspects of the environment that affect the poor: (a) environmental conditions that impact on the health of the poor, and (b) natural resource conditions that affect the income and security of poor households. Numerous studies over the past decade suggest that environmental damage has a significant impact on the health, food security and welfare of the poor. We will briefly summarise the results of some of these studies below.
Reddy and Chakravarty (1999) assess the role of forest resources from a survey of 233 households in northern India. The income of the sample households has been grouped into seven major sources—agricultural, dairy, agricultural labour, business, non-farm employment in public and private sectors, forestry, and artisan work. A simple comparison between poverty indices (headcount ratio; income gap ratio; Sen index; Clark, Heming and Chu ratio; and Foster, Greer and Thorbecke (FGT) index) with and without forestry income indicates that poverty, particularly the FGT index, increases dramatically if forestry income is set to zero. This implies that the poor who largely depend on natural resources are vulnerable to environmental degradation. Similar findings can be found in Ambler (1999) and Kepe (1999). Whereas, Akbar and Lvovsky (2000), Bosch et al. (2001), Brooks and Sethi (1997), Mink (1993), Songsore and McGranahan (1993), and Surjadi (1993) confirm that the health of the poor is directly exposed to air, water and land pollution.
Cavendish (2000) uses data collected on 213 households in 1993/94 from 29 villages in Shindi Ward in southern Zimbabwe to investigate the impact of incorporating environmental income source of household welfare on quantitative analysis of the measurement and causes of rural poverty and inequality. He finds that the poorest are most dependent on environmental income in relative terms, but the better-off make more use of natural resources in absolute terms. Hence, the degradation of natural resources would hurt the poorest the most. However, rising income would tend to increase the use of natural resources; economic growth will not automatically alleviate environmental pressure. Environmental income makes little difference to the causes of poverty and inequality.
Brocklesby and Hinshelwood (2001) summarise the key findings of 23 participatory poverty assessments conducted in 14 developing countries of Asia, Africa and Latin America with respect to the environment and reveal that the poor identified environmental quality as an important determinant of their health, earning capacity, security, energy supplies and housing quality. Dasgupta et al. (2005) investigate the poverty-environment nexus at provincial and district levels in Cambodia, Laos and Vietnam. They use mapping, graphical scatter plots and regression technique to assess the spatial correlation of poverty and environmental variables including deforestation, fragile soil, indoor air pollution, contaminated water, and outdoor air pollution. For the case of Cambodia, they obtain poverty-environmental data from various sources such as the World Food Programme (poverty data: 2001), Mekong River Commission (deforestation, terrain slopes, erosion, and water quality: 2001), Demographic and Health Surveys (intestinal illness, respiratory disease, and the use of biomass fuels: 2001), and Population Census (household’s access to safe drinking water and sanitation: 1998). They find

4 Poverty and Environment Links: The Case of Rural Cambodia
that the regional poverty-environment nexus in Cambodia is largely confined to household-level problems associated with contaminated water and lack of access to adequate sanitation. However, they also find that outdoor air pollution, deforestation, and fragile lands are not significantly associated with poverty at the district level. Given these findings, they conclude that poor households in Cambodia might benefit most strongly from programmes that jointly address poverty and household-level environmental quality.
Assan et al. (2009) focus on the environmental climate variability over Ghana and rural livelihood. The study triangulated primary quantitative and qualitative data with secondary quantitative data. The primary quantitative data collection consisted of 200 households, while the qualitative data collection involved key informant interviews and four focus group discussions. Secondary quantitative data were collected on rainfall and temperature. They argue that the effect of environmental change (declining mean rainfall and rising temperatures) in the northern parts of Ghana on agriculture is enormous, because it leads to increase in evaporation and evapotranspiration rates which in turn reduce soil moisture. This could adversely affect crop cultivation. On-farm and non-farm diversification and migration are considered as survival strategies in environments experiencing rising temperature and declining rainfall.1
1 Hesselberb and Yaro (2006) explain that adaptation through non-farm diversification is an important contribution to livelihood security since farm income consistently fails to meet household expenditure. Ellis (1998) also perceived non-farm diversification, including migration, as an accumulation strategy with could lead to improvement in income and assets. However, no studies have empirically confirmed that non-farm diversification really allows farm households to become quantitatively better and economically empowered to engage with environmental and climate variability (Scoones 1998; Johnson et al. 2005; Thieme 2006; Steward 2007).

5CDRI Working Paper Series No. 64
3
Data and Methodology
The empirical analysis in this study uses the Cambodia Socio-economic Survey (CSES) 2007 collected by the National Institute of Statistics during July-September. The survey is nationally representative, consisting of 3,593 households of which 2,228 reside in rural areas. It provides a wide range of detailed information, including household characteristics, food and non-food consumption, durable assets, livestock, household farm production, non-timber forest collection, other non-agricultural production, wage work and remittances, which makes it possible to estimate consumption, income and poverty at both village and household level.
It has to be said that the CSES 2007 environmental income sources data is not as precise as that collected by Cavendish (1999) whose initial intent was to quantify environmental income including a wide range of consumption goods (wild fruit, vegetables and live animals; mats, pottery and wild medicine), input goods (firewood, leaf litter, and thatching grass), output goods (wild fruit, vegetables and animal, firewood, construction wood, thatch grass, carpentry and pottery sales), and durable goods and stock (furniture, firewood and fencing) which are not available in the CSES standard household survey. To a lesser extent, CSES 2007 captures forestry and hunting income from sawing logs, firewood, wood for charcoal, rattan, bamboo, palm leaves, palm juice, root crops, fruit and vegetables, herbs, honey, as well as wild animals and birds. This enables us to measure the environmental resources for rural households’ income. The household income is divided by household size in order to adjust for inter-household differences. Following Cavendish (1999), we examine the effect of environmental income on poverty i.e. how the exclusion of environmental income increases poverty.
In addition to the household survey, the National Institute of Statistics collected village information covering demographics, economy, infrastructure, rainfall and natural disaster, education and health. Although the village survey was not designed to capture environmental variables such as the amount of rainfall, soil erosion, water contamination, deforestation rate and air pollution, it contained a few questions on natural disaster for the period 2001-2005, the findings from which we converted to a drought and flood dummy variable. Therefore, to some extent we should be able to examine the direct linkage between poverty and environment using the probit model.
In order to define household risk coping strategies and highlight their limitations in response to environmental change, we adopted qualitative methods i.e. focus group discussion (villagers) and in-depth interview (key informants) in the purposively selected rural area hit by natural disaster. Given the limitations of time and budget, only one commune located in Pursat province that was severely hit by drought for three continuous years (2008-2010) has been selected for the study2.
2 Pursat is the fourth largest province in Cambodia and is located in the western part of the country. The eastern part of the province comprises part of the Tonle Sap Lake and the surrounding basin area. The villages selected for case study are considered to be part of the Tonle Sap Lake floodplain.

7CDRI Working Paper Series No. 64
4
Empirical Analysis
4.1. Environmental Income
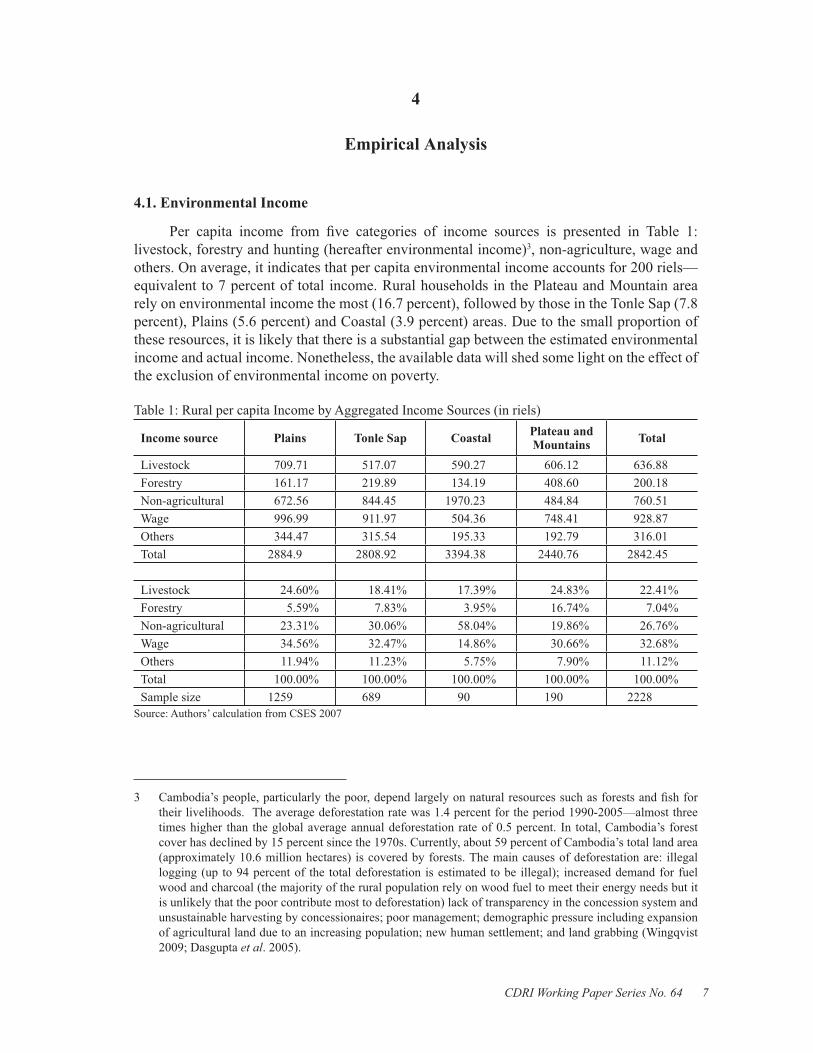
Per capita income from five categories of income sources is presented in Table 1: livestock, forestry and hunting (hereafter environmental income)3, non-agriculture, wage and others. On average, it indicates that per capita environmental income accounts for 200 riels—equivalent to 7 percent of total income. Rural households in the Plateau and Mountain area rely on environmental income the most (16.7 percent), followed by those in the Tonle Sap (7.8 percent), Plains (5.6 percent) and Coastal (3.9 percent) areas. Due to the small proportion of these resources, it is likely that there is a substantial gap between the estimated environmental income and actual income. Nonetheless, the available data will shed some light on the effect of the exclusion of environmental income on poverty.
Table 1: Rural per capita Income by Aggregated Income Sources (in riels)
Income source Plains Tonle Sap Coastal Plateau and Mountains Total
Livestock 709.71 517.07 590.27 606.12 636.88Forestry 161.17 219.89 134.19 408.60 200.18Non-agricultural 672.56 844.45 1970.23 484.84 760.51Wage 996.99 911.97 504.36 748.41 928.87Others 344.47 315.54 195.33 192.79 316.01Total 2884.9 2808.92 3394.38 2440.76 2842.45 Livestock 24.60% 18.41% 17.39% 24.83% 22.41%Forestry 5.59% 7.83% 3.95% 16.74% 7.04%Non-agricultural 23.31% 30.06% 58.04% 19.86% 26.76%Wage 34.56% 32.47% 14.86% 30.66% 32.68%Others 11.94% 11.23% 5.75% 7.90% 11.12%Total 100.00% 100.00% 100.00% 100.00% 100.00%Sample size 1259 689 90 190 2228
Source: Authors’ calculation from CSES 2007
3 Cambodia’s people, particularly the poor, depend largely on natural resources such as forests and fish for their livelihoods. The average deforestation rate was 1.4 percent for the period 1990-2005—almost three times higher than the global average annual deforestation rate of 0.5 percent. In total, Cambodia’s forest cover has declined by 15 percent since the 1970s. Currently, about 59 percent of Cambodia’s total land area (approximately 10.6 million hectares) is covered by forests. The main causes of deforestation are: illegal logging (up to 94 percent of the total deforestation is estimated to be illegal); increased demand for fuel wood and charcoal (the majority of the rural population rely on wood fuel to meet their energy needs but it is unlikely that the poor contribute most to deforestation) lack of transparency in the concession system and unsustainable harvesting by concessionaires; poor management; demographic pressure including expansion of agricultural land due to an increasing population; new human settlement; and land grabbing (Wingqvist 2009; Dasgupta et al. 2005).
8 Poverty and Environment Links: The Case of Rural Cambodia
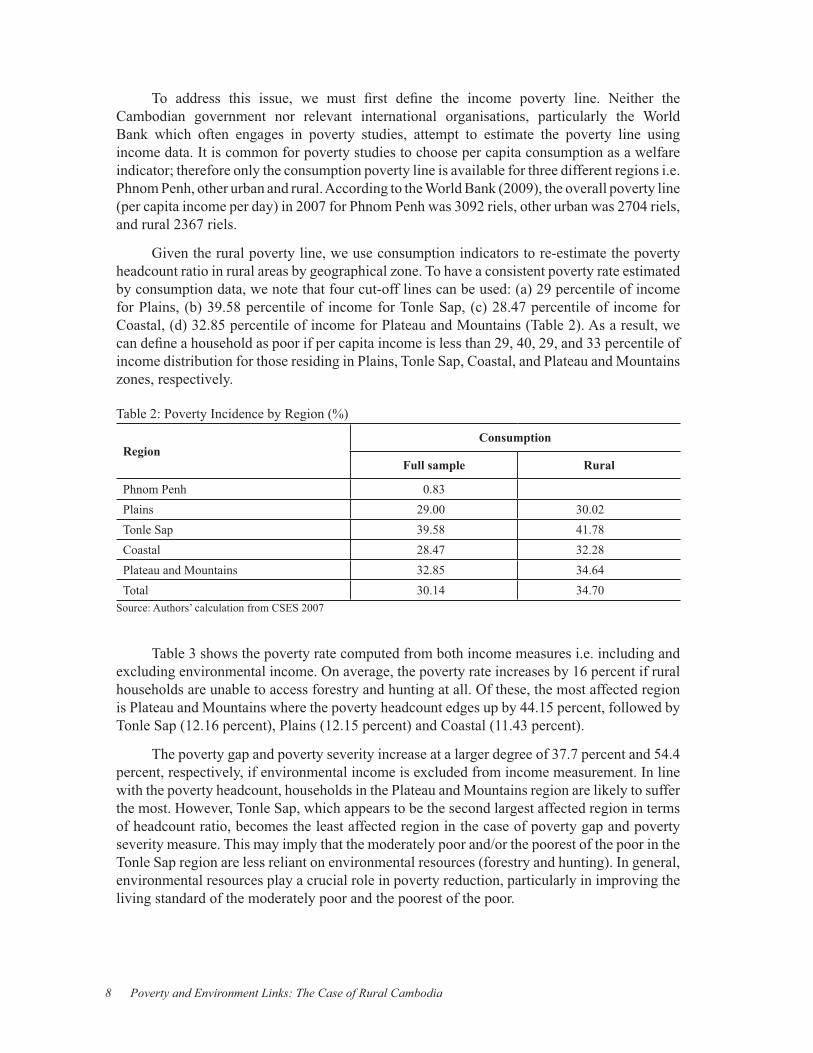
To address this issue, we must first define the income poverty line. Neither the Cambodian government nor relevant international organisations, particularly the World Bank which often engages in poverty studies, attempt to estimate the poverty line using income data. It is common for poverty studies to choose per capita consumption as a welfare indicator; therefore only the consumption poverty line is available for three different regions i.e. Phnom Penh, other urban and rural. According to the World Bank (2009), the overall poverty line (per capita income per day) in 2007 for Phnom Penh was 3092 riels, other urban was 2704 riels, and rural 2367 riels.
Given the rural poverty line, we use consumption indicators to re-estimate the poverty headcount ratio in rural areas by geographical zone. To have a consistent poverty rate estimated by consumption data, we note that four cut-off lines can be used: (a) 29 percentile of income for Plains, (b) 39.58 percentile of income for Tonle Sap, (c) 28.47 percentile of income for Coastal, (d) 32.85 percentile of income for Plateau and Mountains (Table 2). As a result, we can define a household as poor if per capita income is less than 29, 40, 29, and 33 percentile of income distribution for those residing in Plains, Tonle Sap, Coastal, and Plateau and Mountains zones, respectively.
Table 2: Poverty Incidence by Region (%)
RegionConsumption
Full sample Rural
Phnom Penh 0.83 Plains 29.00 30.02Tonle Sap 39.58 41.78Coastal 28.47 32.28Plateau and Mountains 32.85 34.64Total 30.14 34.70
Source: Authors’ calculation from CSES 2007
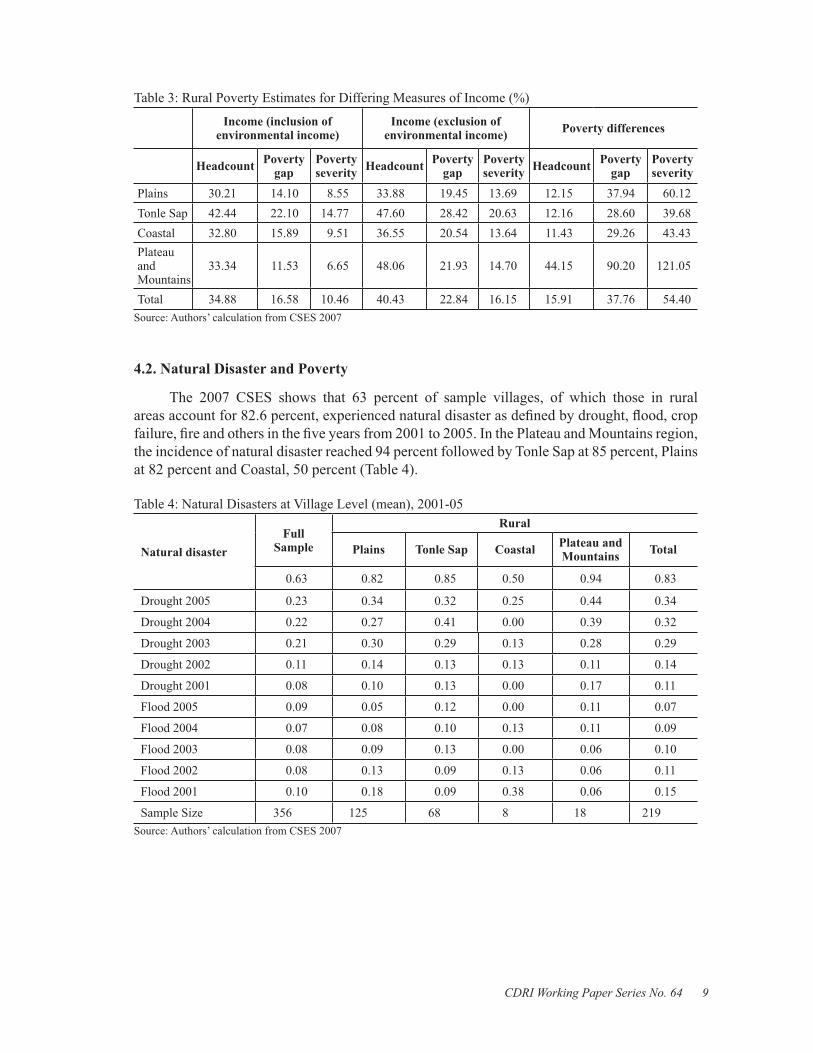
Table 3 shows the poverty rate computed from both income measures i.e. including and excluding environmental income. On average, the poverty rate increases by 16 percent if rural households are unable to access forestry and hunting at all. Of these, the most affected region is Plateau and Mountains where the poverty headcount edges up by 44.15 percent, followed by Tonle Sap (12.16 percent), Plains (12.15 percent) and Coastal (11.43 percent).
The poverty gap and poverty severity increase at a larger degree of 37.7 percent and 54.4 percent, respectively, if environmental income is excluded from income measurement. In line with the poverty headcount, households in the Plateau and Mountains region are likely to suffer the most. However, Tonle Sap, which appears to be the second largest affected region in terms of headcount ratio, becomes the least affected region in the case of poverty gap and poverty severity measure. This may imply that the moderately poor and/or the poorest of the poor in the Tonle Sap region are less reliant on environmental resources (forestry and hunting). In general, environmental resources play a crucial role in poverty reduction, particularly in improving the living standard of the moderately poor and the poorest of the poor.
9CDRI Working Paper Series No. 64
Table 3: Rural Poverty Estimates for Differing Measures of Income (%)
Income (inclusion of environmental income)
Income (exclusion of environmental income) Poverty differences
Headcount Poverty gap
Poverty severity Headcount Poverty
gapPoverty severity Headcount Poverty
gapPoverty severity
Plains 30.21 14.10 8.55 33.88 19.45 13.69 12.15 37.94 60.12Tonle Sap 42.44 22.10 14.77 47.60 28.42 20.63 12.16 28.60 39.68Coastal 32.80 15.89 9.51 36.55 20.54 13.64 11.43 29.26 43.43Plateau and Mountains
33.34 11.53 6.65 48.06 21.93 14.70 44.15 90.20 121.05
Total 34.88 16.58 10.46 40.43 22.84 16.15 15.91 37.76 54.40Source: Authors’ calculation from CSES 2007
4.2. Natural Disaster and Poverty
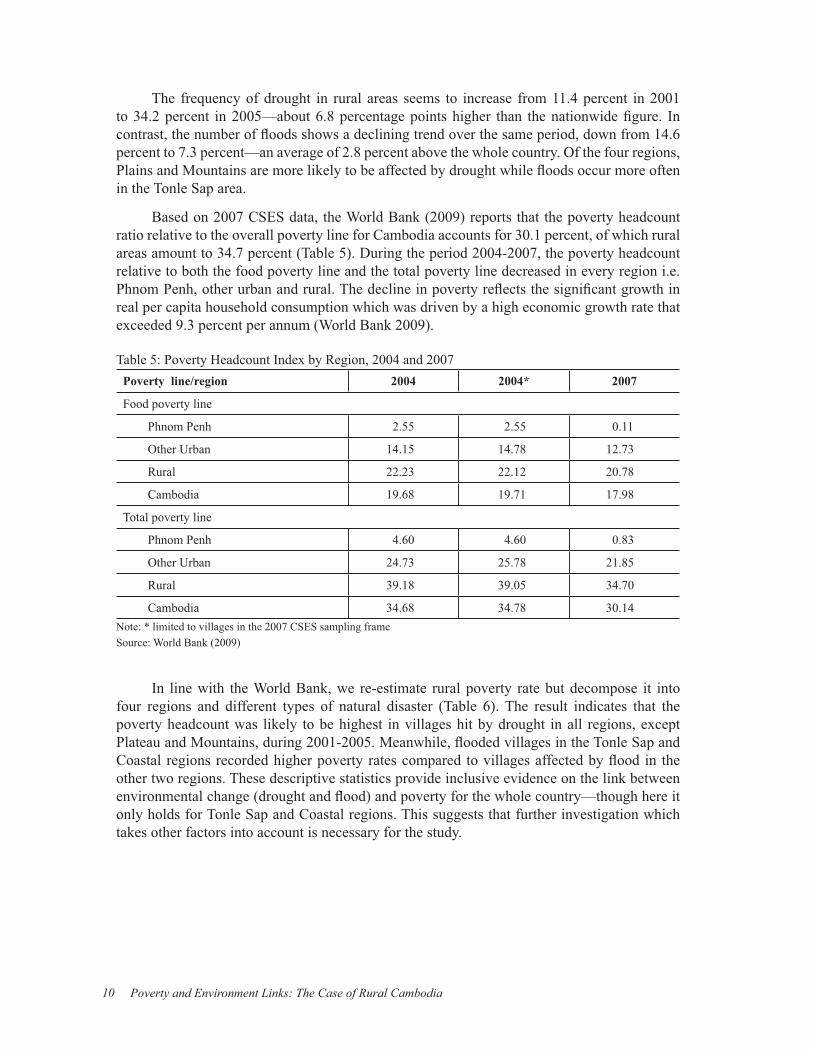
The 2007 CSES shows that 63 percent of sample villages, of which those in rural areas account for 82.6 percent, experienced natural disaster as defined by drought, flood, crop failure, fire and others in the five years from 2001 to 2005. In the Plateau and Mountains region, the incidence of natural disaster reached 94 percent followed by Tonle Sap at 85 percent, Plains at 82 percent and Coastal, 50 percent (Table 4).
Table 4: Natural Disasters at Village Level (mean), 2001-05
Natural disasterFull
Sample
Rural
Plains Tonle Sap Coastal Plateau and Mountains Total
0.63 0.82 0.85 0.50 0.94 0.83
Drought 2005 0.23 0.34 0.32 0.25 0.44 0.34
Drought 2004 0.22 0.27 0.41 0.00 0.39 0.32
Drought 2003 0.21 0.30 0.29 0.13 0.28 0.29
Drought 2002 0.11 0.14 0.13 0.13 0.11 0.14
Drought 2001 0.08 0.10 0.13 0.00 0.17 0.11
Flood 2005 0.09 0.05 0.12 0.00 0.11 0.07
Flood 2004 0.07 0.08 0.10 0.13 0.11 0.09
Flood 2003 0.08 0.09 0.13 0.00 0.06 0.10
Flood 2002 0.08 0.13 0.09 0.13 0.06 0.11
Flood 2001 0.10 0.18 0.09 0.38 0.06 0.15
Sample Size 356 125 68 8 18 219Source: Authors’ calculation from CSES 2007
10 Poverty and Environment Links: The Case of Rural Cambodia
The frequency of drought in rural areas seems to increase from 11.4 percent in 2001 to 34.2 percent in 2005—about 6.8 percentage points higher than the nationwide figure. In contrast, the number of floods shows a declining trend over the same period, down from 14.6 percent to 7.3 percent—an average of 2.8 percent above the whole country. Of the four regions, Plains and Mountains are more likely to be affected by drought while floods occur more often in the Tonle Sap area.
Based on 2007 CSES data, the World Bank (2009) reports that the poverty headcount ratio relative to the overall poverty line for Cambodia accounts for 30.1 percent, of which rural areas amount to 34.7 percent (Table 5). During the period 2004-2007, the poverty headcount relative to both the food poverty line and the total poverty line decreased in every region i.e. Phnom Penh, other urban and rural. The decline in poverty reflects the significant growth in real per capita household consumption which was driven by a high economic growth rate that exceeded 9.3 percent per annum (World Bank 2009).
Table 5: Poverty Headcount Index by Region, 2004 and 2007Poverty line/region 2004 2004* 2007
Food poverty line
Phnom Penh 2.55 2.55 0.11
Other Urban 14.15 14.78 12.73
Rural 22.23 22.12 20.78
Cambodia 19.68 19.71 17.98
Total poverty line
Phnom Penh 4.60 4.60 0.83
Other Urban 24.73 25.78 21.85
Rural 39.18 39.05 34.70
Cambodia 34.68 34.78 30.14Note: * limited to villages in the 2007 CSES sampling frameSource: World Bank (2009)
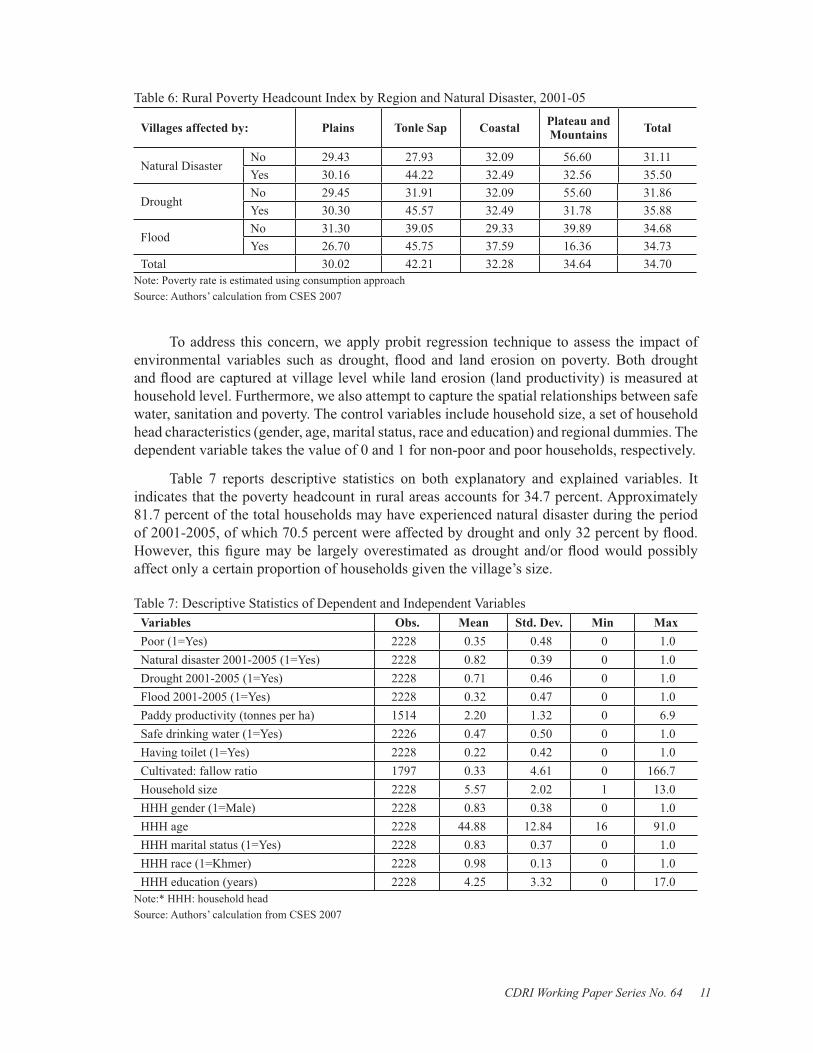
In line with the World Bank, we re-estimate rural poverty rate but decompose it into four regions and different types of natural disaster (Table 6). The result indicates that the poverty headcount was likely to be highest in villages hit by drought in all regions, except Plateau and Mountains, during 2001-2005. Meanwhile, flooded villages in the Tonle Sap and Coastal regions recorded higher poverty rates compared to villages affected by flood in the other two regions. These descriptive statistics provide inclusive evidence on the link between environmental change (drought and flood) and poverty for the whole country—though here it only holds for Tonle Sap and Coastal regions. This suggests that further investigation which takes other factors into account is necessary for the study.
11CDRI Working Paper Series No. 64
Table 6: Rural Poverty Headcount Index by Region and Natural Disaster, 2001-05
Villages affected by: Plains Tonle Sap Coastal Plateau and Mountains Total
Natural Disaster No 29.43 27.93 32.09 56.60 31.11Yes 30.16 44.22 32.49 32.56 35.50
Drought No 29.45 31.91 32.09 55.60 31.86Yes 30.30 45.57 32.49 31.78 35.88
Flood No 31.30 39.05 29.33 39.89 34.68Yes 26.70 45.75 37.59 16.36 34.73
Total 30.02 42.21 32.28 34.64 34.70Note: Poverty rate is estimated using consumption approachSource: Authors’ calculation from CSES 2007
To address this concern, we apply probit regression technique to assess the impact of environmental variables such as drought, flood and land erosion on poverty. Both drought and flood are captured at village level while land erosion (land productivity) is measured at household level. Furthermore, we also attempt to capture the spatial relationships between safe water, sanitation and poverty. The control variables include household size, a set of household head characteristics (gender, age, marital status, race and education) and regional dummies. The dependent variable takes the value of 0 and 1 for non-poor and poor households, respectively.
Table 7 reports descriptive statistics on both explanatory and explained variables. It indicates that the poverty headcount in rural areas accounts for 34.7 percent. Approximately 81.7 percent of the total households may have experienced natural disaster during the period of 2001-2005, of which 70.5 percent were affected by drought and only 32 percent by flood. However, this figure may be largely overestimated as drought and/or flood would possibly affect only a certain proportion of households given the village’s size.
Table 7: Descriptive Statistics of Dependent and Independent VariablesVariables Obs. Mean Std. Dev. Min MaxPoor (1=Yes) 2228 0.35 0.48 0 1.0Natural disaster 2001-2005 (1=Yes) 2228 0.82 0.39 0 1.0Drought 2001-2005 (1=Yes) 2228 0.71 0.46 0 1.0Flood 2001-2005 (1=Yes) 2228 0.32 0.47 0 1.0Paddy productivity (tonnes per ha) 1514 2.20 1.32 0 6.9Safe drinking water (1=Yes) 2226 0.47 0.50 0 1.0Having toilet (1=Yes) 2228 0.22 0.42 0 1.0Cultivated: fallow ratio 1797 0.33 4.61 0 166.7Household size 2228 5.57 2.02 1 13.0HHH gender (1=Male) 2228 0.83 0.38 0 1.0HHH age 2228 44.88 12.84 16 91.0HHH marital status (1=Yes) 2228 0.83 0.37 0 1.0HHH race (1=Khmer) 2228 0.98 0.13 0 1.0HHH education (years) 2228 4.25 3.32 0 17.0
Note:* HHH: household headSource: Authors’ calculation from CSES 2007

12 Poverty and Environment Links: The Case of Rural Cambodia
Shyamsundar (2002) emphasises that sanitation, water and indoor air pollution related diseases are the most important for developing countries. Various studies (Akbar & Lvovsky (2000), Bosch et al. (2001), Brooks & Sethi (1997), Mink (1993), Songsore & McGranahan (1993), Surjadi (1993) suggest that environmental factors have a significant negative impact on the health of the poor through inadequate sanitation, water and indoor air pollution.4 Water pollution and inadequate sanitation are key sources of disease such as diarrhoea, malaria and cholera, while air pollution is a major factor causing respiratory infections. Of 2,228 households, 46.6 percent have access to safe drinking water which is defined as a household’s main source of drinking water during both the dry and wet seasons that is piped to the dwelling, extracted from a tube/piped/protected well, or purchased from tanker truck/vendor.5 Ideally, safe drinking water should reflect a quality of water that can be consumed or used without risk of immediate or long term harm. Despite this fact, Feldman et al. (2007) note that very few data have been collected on the chemical quality of nationwide drinking water sources and specifically, the capacity to assess chemical quality is extremely limited in Cambodia. Only 22.4 percent of rural households have toilet facilities in or near the house.6 The toilet dummy variable is used as the proxy for sanitation in this study.
Soil fertility is a common and important form of environmental loss in many developing countries (Shyamsundar 2002).7 Pieri et al. (1995) suggest that soil quality can be observed indirectly through crop yields or directly by measuring soil changes. Change in crop yields over time is a highly significant indicator of soil fertility loss. Soil fertility loss and land degradation could increase rural poverty headcount, infant mortality rate, rural-urban migration and female headed households, and decrease food production. Following Pieri et al. (1995), we use paddy productivity to capture the impact of land degradation on poverty. It should be noted that these indicators (safe water, sanitation, paddy productivity) are quite broad and sometimes obscure the real meaning of safe water, sanitation and land degradation. In addition, water and sanitation related diseases such as diarrhoea depend on behavioural practices, for example hand washing. Therefore, any interpretation should be made carefully because these indicators could represent different stresses.
4 Water and air pollution are also caused by development that lacks environmental safeguards. 5 According to the Ministry of Planning, 42 percent of the rural population and 76 percent of the urban
population have access to safe water sources. Poor households have far less access to safe water than higher-income households (WB 2004 cited in Wingqvist 2009, pp.12).
6 16 percent of rural and 55 percent of urban population have access to improved sanitation (Wingqvist 2009).
7 Cambodian soils are likely to have low fertility and agricultural productivity depends largely on salt deposited by the annual flood, the use of animal manure and farming rotation systems in the uplands. One of the most serious constraints to crop improvement in Cambodia is soil infertility. The main causes of soil erosion are deforestation and unsustainable agricultural practices (Wingqvist 2009).

13CDRI Working Paper Series No. 64
Table 8: Empirical Results (Probit Model)
VariablesMarginal effects
Model 1 Model 2 Model 3 Model 4 Model 5 Model 6 Model 7
Natural disaster 2001-2005 (1=Yes) 0.038
Drought 2001-2005 (1=Yes) 0.057*** 0.063***
Flood 2001-2005 (1=Yes) -0.035* -0.043**
Paddy productivity -0.031***
Safe drinking water (1=Yes) 0.035*
Having toilet (1=Yes) -0.210***
Household size 0.075*** 0.075*** 0.075*** 0.076*** 0.081*** 0.074*** 0.076***
HHH gender (1=Male) 0.036 0.035 0.039 0.038 0.034 0.039 0.028
HHH age -0.015*** -0.015*** -0.015*** -0.015*** -0.016*** -0.015*** -0.014***
HHH age squared 0.0001*** 0.0001*** 0.0001*** 0.0001*** 0.0001** 0.0001*** 0.0001***
HHH marital status (1=Yes) -0.090* -0.090* -0.095** -0.094** -0.096 -0.093** -0.090**
HHH race (1=Khmer) -0.121 -0.111 -0.130 -0.118 -0.124 -0.117 -0.111
HHH education (years) -0.022*** -0.022*** -0.022*** -0.022*** -0.021*** -0.022*** -0.015***
Plains dummy -0.047 -0.041 -0.049 -0.039 0.003 -0.062 -0.048
Tonle Sap dummy 0.037 0.041 0.041 0.048 0.080* 0.030 0.053
Coastal dummy 0.006 0.011 0.006 0.019 0.001 0.009 -0.025
Number of Observations 2228 2228 2228 2228 1514 2226 2228
LR Chi2 275.17 280.09 276.61 285.18 197.22 275.43 355.88
Prob>Chi2 0.0000 0.0000 0.0000 0.0000 0.0000 0.0000 0.0000
Log-likelihood -1210.99 -1208.53 -1210.77 -1206.49 -862.5 -1210.17 -1170.64
Pseudo R-squared 0.1020 0.1038 0.1022 0.1054 0.1026 0.1022 0.1319
Note: * significant at 10 percent, ** significant at 5 percent, *** significant at 1 percentSource: Authors’ calculation from CSES 2007
Our regression results (Table 8) show that the coefficient of drought dummy is positive and statistically significant at 1 percent level, which suggests that drought is likely to increase the likelihood of being poor in rural Cambodia—holding other factors constant. The coefficient of paddy productivity is negative and statistically significant at 1 percent level, implying that an increase in paddy productivity (soil fertility) would reduce rural poverty rate. In other words, poverty rate is likely to increase due to soil fertility loss. Similarly, the coefficient of toilet dummy is negative and statistically significant at 1 percent level, indicating that sanitation has played a crucial role in poverty reduction in Cambodia. Unexpectedly, the dummy variable for safe drinking water is positive and that for flood is negative. Both coefficients are statistically significant at 10 percent level. This may be partially because the definition of safe drinking water does not reflect its quality. Given that flood is commonly viewed as a source of profit

14 Poverty and Environment Links: The Case of Rural Cambodia
rather than a source of disaster because it usually contributes to the wealth of biodiversity, abundance of fish and soil fertility (MRC 2006), flood (at a certain level) would help reduce the rural poverty rate in Cambodia. In addition to environmental variables, we also find that household size, household head age and educational level are key determinants of poverty.

15CDRI Working Paper Series No. 64
5
Mitigating and Coping Strategies for Climate Change
Natural disasters such as flood, drought and other weather-related phenomena can affect household welfare through the destruction of physical and human capital stock. In this regard, risk management arrangements at both household and public agency levels which can minimise the impact of and exposure to such shocks have attracted considerable attention from researchers, policy makers and other relevant agencies. Typically, risk management strategies cover all the preventive and mitigating strategies that households may implement prior to a crisis, as well as coping arrangements after the realisation of a crisis (Alderman & Paxson 1994).
In order to garner more in-depth information on mitigating strategies which villagers have used during drought, we conducted three focus group discussions each of which consisted of 6 to 8 people in three villages located in Pursat province where drought has occurred since 2007. We observed that most participants do not have proper mitigating strategies. They have responded to drought by selling durable assets, sending further household members (including children) out to work, and migration. In addition, it was also revealed that some villagers have used new rice seed varieties to adapt to extreme weather and relied more on common property resources such as vines to weave mats. But it is worth noting that many parts of the forest nearby the villages have been licensed to private companies (economic land concessions) and are strictly guarded. In addition, social insecurity has also increased e.g. theft and cheating.
Several studies have also highlighted that the informal mechanisms for mitigating and coping with risk become ineffective during a common shock (economic crisis or natural disaster). For example, a natural disaster that affects a whole village or an entire region may impose significant constraints on individual, household and group-based insurance schemes as well as market-based coping mechanisms. The primary reason lies in the sharp decline of asset prices (after shock) because everyone tries to sell similar assets at the same time (Fafchamps & Gavian 1997), gifts and or remittances are insufficient to mitigate the impact of the shock (Morduch 1999), rural financial institutes are unlikely to serve the role of a leading institution when the majority of deposits are withdrawn during harvest failure or flood (Binswanger & Rosenzweig 1986). A World Bank study (2001 cited in Skoufias 2003) observes various mechanisms for managing risks which are applicable to a wide range of crises, including economic, natural disaster and health (Table 9).

16 Poverty and Environment Links: The Case of Rural Cambodia
Table 9: Mechanisms for Managing Risks
Strategies
Arrangement using
Informal mechanisms Formal mechanisms
Individual and household Group Market Policy
Reducing risk Preventive health practices
Collective action for infrastructure, dykes, terraces
Sound macroeconomic policy
Migration Common property resource management
Environmental policy
More secure income source
Education and training policy
Infrastructure (dams, roads)
Active labour market policies
Mitigating riskDiversification Crop and plot
diversificationOccupational association
Saving account in financial institute
Agricultural extension
Income source diversification
Rotating savings and credit association
Microfinance Liberalised trade
Investment in physical and human capital
Protect property rights
Insurance Marriage and extended family
Investment in social capital (networks, association, rituals, reciprocal gift giving)
Old age annuities
Pension system
Sharecropper tenancy Accident, disability and other insurance
Mandated insurance for unemployment, illness, disability and other risks
Buffer stocksCoping with shocks
Sale of assets Transfer from networks of mutual support
Sale of financial assets
Social assistance
Loan from moneylender
Loan from financial institutions
Workfare
Child labour SubsidiesReduced food consumption
Social funds
Seasonal or temporary migration
Cash transfers
Source: Adapted from World Bank (2001) cited in Skoufias (2003)

17CDRI Working Paper Series No. 64
Against these observations, it is important to know about the mitigation and coping strategies that government agencies could adopt to protect households and their members from the impacts of natural disaster. Del Ninno, Dorosh and Smith (2003), who examine household coping strategies and the role of public policies and markets following the 1998 flood in Bangladesh8, highlight that the combination of government policies including earlier trade liberalisation, well-functioning private markets, public and NGO intervention and effective private coping strategies were successful at preventing a major post-disaster.
Owens, Hoddinott and Kinsey (2003) investigate the consequences of alternative public responses to the 1994-95 drought shocks in Zimbabwe. They show that the re-allocation of funds from an ex-post response to shocks to an ex-ante intervention is successful at reducing poverty in non-drought years. At the same time, it allows households to build up additional reserves of livestock that help to buffer consumption in the aftermath of drought. Morris and Wodon (2003) examine the role of transfer and insurance provided by natural disaster relief funds when Hurricane Mitch hit Honduras in 19989 and argue that natural disaster relief funds can play only a limited role in helping poorer households. This is because the majority of emergency aid consists of food, clothing and medicine which are delivered to affected households in (almost) the same proportion. Consequently, this fails to provide more relief to those who suffered greater losses or who are poorer following a disaster.
The Cambodian government has undertaken numerous activities to tackle climate change, some of which are in line with the United Nations Framework Convention on Climate Change (adopted in 1992) and the Kyoto Protocol (enforced in 2005). For example, the government has established the Cambodian Interim Designated National Authority (DNA)10, the Cambodia Climate Change Office (CCCO)11, the National Climate Change Committee (NCCC)12, and implemented several capacity building activities such as the Clean Development Mechanism (CDM) project, the Integrated Capacity Strengthening for CDM project, and the Asia EU Dialogue on the CDM project.
More precisely, the government has considered renewable energy, improved cooking stoves, energy efficient building codes, tax relief for renewable energy and mass transit, reforestation, forest protection, intermittent irrigation, organic matter management, direct seeding and zero tillage as mitigation options for climate change. In this regard, Angkor Bio Cogen Rice Husk Power Project is designed to use rice husks to generate electricity for Ankor Kasekam Roongroeung rice mill. The project will displace the use of diesel fuel for power generation and lead to an estimated carbon emission reduction of 45,815 tonnes (CO2) per year.
8 At their peak, the 1998 floods covered two-thirds of Bangladesh, causing severe damage to the major rice crop and threatening the food security of tens of millions of households.
9 The cost of Hurricane Mitch was substantial in terms of both human and material losses: 5657 people were killed and a third of the population suffered significant economic damage (government of Honduras 1997, 1998 cited in Morris and Wodon 2003, pp.1288)
10 DNA, established in 2003, is responsible for assessing proposed CDM projects against national sustainable development criteria and is authorised to provide written approval for proposed CMD projects conforming to these criteria.
11 CCCO, established in 2003, serves as the Secretariat of DNA. 12 NCCC, established by sub-decree in April 2006, serves as a policy-making body and coordinates the
development and implementation of policies, plans and measures to address climate change issues.

18 Poverty and Environment Links: The Case of Rural Cambodia
For national commitment, the government has implemented a number of programmes including: the improvement of irrigation systems, water supply and sanitation, and the establishment of Farmer Water User Communities; the construction of water culverts, dams, pumping facilities, water gates and canals; and the rehabilitation of roads and bridges to reduce and mitigate the impacts of droughts and floods that occurred in the early 2000s (MOE 2005). More recently, the Cambodian National Adaptation Programme of Action for Climate Change (NAPA) has been developed to provide a framework to guide the coordination and implementation of adaptation initiatives (MOE 2006). Cambodia’s NAPA has identified priority projects to address the effects of climate change in key sectors such as agriculture, water resources, coastal zone and human health. Appendix 3 lists the top 20 high priority non-health and health related projects and a summary of the projects’ profiles.
Blomquist et al. (2002 cited in Skoufias 2003, pp.1094-1096) lists some instruments that are available to governments in the event of an economic crisis or a natural disaster (Table 10). The list of instruments includes cash transfer, public work programmes, unemployment assistance, wage and commodity price subsidies, programmes that target human development, cash transfer programmes on condition of school attendance and regular visits to health centres, service fee waiver, food and nutrition programmes, micro-finance and social fund programmes. Although each type of intervention has both advantages and disadvantages, indicating that the government has to make very difficult choices, none of them are listed among the 20 high priority national adaptation programmes of action for climate change (NAPA).
Table 10: Public Sector Interventions in Response to Crises and Natural Disasters
Intervention type Beneficiaries
Common targeting methods
Advantages Disadvantages
Cash transfer (family allowance, poor unemployment, elderly and disability assistance)
- Poor families, women and children
- Working poor including informal sector
- People with disabilities
- Poor elderly- Other
vulnerable groups
- Mean and proxy mean
- Categorical
- Do not distort price
- Transfers are fungible, can directly meet crucial household needs
- Can distort incentives to labour market participation
- Transfers are fungible subject to unintended household uses
- Implementation is information intensive
Public works (labour intensive, usually infrastructure development project)
- Poor unemployed and underemployed including informal sector
- Poor agricultural workers during off season
- Self-selected (by setting programme remuneration below the minimum wage) -Geographic
- Can be implemented or adapted quickly after crisis onset provided capacity exists
- Programme size can be easily reduced once the crisis is over
- Needed infrastructure is created or maintained
- Can distort incentives to labour market participation
- Substantial leakage to non-poor depending on programme design and targeting method
- Difficult to administer, tradeoff between infrastructure development and poverty alleviation objectives

19CDRI Working Paper Series No. 64
Unemployment assistance (unemployment benefits, severance payments)
- Formal sector unemployment
- Coverage determined by eligibility and employer/employee contribution
- Provide immediate assistance to eligible beneficiaries in the event of crisis
- Has automatic counter-cyclical financing characteristics
- Can distort incentives to labour market participation
- Difficult to adapt quickly due to qualification and contribution requirements
- Based on urban formal sector
Wage subsidies - Formal sector unemployed, working age youth, usually poor
- Targeting by firm type, industrial category, firm size and/or age of the worker
- Can be implemented quickly after crisis onset
- Can reach individual with variety of skills and experience
- Substantial negative incentive effects for employers
- Biased to urban formal sector
Commodity price subsidies (food, energy, housing)
- Poor and extremely poor families, especially urban working poor
- Self-selection (by subsidising only basic staples)
- Potentially low administrative cost depending on delivery mechanism
- Can be implemented or expanded quickly after crisis onset
- Distort commodity prices and use -Substantial leakage to non-poor depending on commodity consumption patterns
- Often biased to urban population
- Difficult to remove once established due to interest group pressure
Target human development (conditional transfers such as school attendance or preventative health care receipt linked to cash transfers)
- Poor students- Poor family
with access to health services
- Geographic- Categorical- Means or proxy
means- Community
(together with one of above)
- Can improve school attendance and/or health care use
- Supports income of poor
- May promote human capital development
- Effective influenced by existing education/health infrastructure
- Extensive monitoring and compliance costs
Service fee waivers (school fees, scholarships, health care)
- Poor students- Poor family
with access to health services
- Geographic- Categorical- Means or proxy
means- Community
(together with one of above)
- May promote human development
- Effectiveness influenced by existing education/health infrastructure
- Limited evidence of long-term impact on school attendance or health
Food and nutrition (school feeding, supplemental feeding and nutrition for young children and women)
- Small children, pregnant and locating mothers
- Children attending school in communities
- Geographic- Mean or proxy
means- Self-targeting
- Can be effective in alleviating hunger, increasing school attendance for poor children -May promote human capital development
- Limited beneficiary group
- Resource incentive- Substantial benefit
leakages depending on targeting method
- Often biased to urban populations

20 Poverty and Environment Links: The Case of Rural Cambodia
Microfinance (microenterprise credit, seasonal rural, and emergency credit for the poor)
- Poor micro entrepreneurs
- Poor women
- Means and proxy means
- Geographic- Individual
project quality
- Promotes physical capital accumulation in poor communities
- May increase household income
- Benefits of public resources may be enhanced by multiplier investment effect
- Limited beneficiary group
- Administrative costly- Biased to rural
population- Limited application
to economy wide crises because of pro-cyclical demand for microcredit
Social funds (small scale infrastructure development, microenterprise support, community based social services)
- Poor families, women and children
- Poor unemployed and under-employed
- Geographic - May promote human and physical capital accumulation in poor communities
- High degree of community involvement in project selection and implementation
- Difficult to implement or adapt quickly after crisis onset
- Often biased to rural populations
Source: Adapted from Annex II of Blomquist et al. (2002) cited in Skoufias (2003), pp.1094-1096

21CDRI Working Paper Series No. 64
6
Conclusion and Policy Implications
There is increasing evidence that human activities could have an impact on global climate due to emissions of greenhouse gases such as carbon dioxide, methane and other industrial gases. High levels of greenhouse gases lead to a warming of the atmosphere which is likely to increase temperature and the frequency and intensity of weather events such as cyclones, windstorms, flood and drought as well as coastal inundation. Changes in environmental conditions and climate patterns directly affect the livelihoods of the poor and undermine the determinants of livelihood security (Brown & Crawford 2008). In Cambodia, the poor—particularly in rural areas—depend largely on natural resources for their livelihoods. Hence, decline in the quality and accessibility of natural resources is likely to affect them most seriously. Specifically, the poor become more vulnerable because they have less ability to adapt to environmental change.
In this paper, we have examined the impact of environmental income (forestry and hunting) and environmental variables such as flood, drought and land erosion on poverty. Our study differs from that of Dasgupta et al. (2005), who investigated the poverty-environmental nexus at the provincial and district level, in that we used data from the 2007 household socio-economic survey. Our study is unique and innovative, both in Cambodia and in the international community, as it combines local area environmental variables (flood and drought) with a standard household survey.
The result shows that the poverty rate will increase by an average of 16 percent if rural households are unable to access forestry and hunting, of which the poverty headcount ratio in Tonle Sap (wetland) may likely edge up by 12 percent. Drought is more likely to increase the poverty rate by 6 percent, while flood will decrease it by 4 percent. The unexpected result for the case of flood is largely because it is commonly viewed as a source of profit rather than a disaster as it is usually contributes to the wealth of biodiversity, abundance of fish and soil fertility in Cambodia (MRC 2006). Meanwhile, we also find that a 1 percent increase in land erosion (land productivity as proxy) raises the poverty rate by 3 percent. This empirical result reconfirms that the frequency of drought and soil infertility is positively highly associated with the poverty rate in Cambodia.
This review of current household and government mitigation and coping strategies is very useful for setting priorities for public programmes and formal social safety nets (protection). Given that group-based informal risk mitigation and coping strategies become less effective during natural disaster (or economic crisis), households may have to rely on self-insurance strategies that appear to be costly. For example, Cambodian households may buy cheaper food, reduce the amount of food consumed, sell land or other assets, purchase food on credit, take loans in cash or kind, work longer, migrate, take children out of school or increase their exploitation of natural resources, as well as restrict their consumption of food and non-food items in order to cope with shocks, i.e. high food prices, sickness and high fuel prices (So 2009; CDRI 2009; Tong 2009). This suggests that public actions that prevent deterioration in children’s nutritional status and maintain access to health services for poor and vulnerable households deserve top priority.

22 Poverty and Environment Links: The Case of Rural Cambodia
References
Akbar, S. & K. Lvovsky (2000), Indoor Air Pollution: Energy and Health for the Poor, ESMAP Newsletter, No. 1. (Washington, DC: World Bank)
Alderman, H. & C.H. Paxson (1994), “Do the Poor Insure? A Synthesis of the Literature on Risk and Consumption in Developing Countries”, in E.L. Bacha (ed.) “Economics in a Changing World’”, Development, Trade and the Environment (London: Macillan) pp.48-78
Ambler, J. (1999), “Attacking Poverty while Improving the Environment: Toward Win-Win Policy Options”, background technical paper prepared for the September 1999 Forum of Ministers meeting under the UNDP-EC Poverty and Environment Initiative
Assan J., C. Caminade & O. Frances (2009), “Environmental Variability and Vulnerable Livelihoods: Minimizing Risks and Optimising Opportunities for Poverty Alleviation”, Journal of International Development, 21(3), pp. 403-418
Binswanger, H.P. & M.K. Rosenzweig (1986), “Behavioural and Material Determinants of Production Relations in Agriculture”, Journal of Development Studies, April, pp. 503-539
Bosch C., K. Hommann, G.M. Rubio, C. Sadoff, & L. Travers (2001), Water, Sanitation and Poverty chapter, Poverty Reduction Strategy Papers’ Source Book (Washington, DC: World Bank)
Brocklesby, M.A. & E. Hinshelwood (2001), Poverty and the Environment: What the Poor Say: An Assessment of Poverty-environment Linkages in Participatory Poverty Assessments (Swansea, UK: Centre for Development Studies, University of Wales)
Brooks, N. & R. Sethi (1997), “The Distribution of Pollution: Community Characteristics and Exposure to Air Toxins”, Journal of Environmental Economics and Management, 32, pp. 233–250
Brown O. & A. Crawford (2008), Assessing the Security Implication of Climate Change for West Africa (Winnipeg, Manitoba: IISD)
Cambodia Development Resource Institute (2007), We are Living with Worry all the Time: A Participatory Poverty Assessment of the Tonle Sap (Phnom Penh: CDRI)
Cambodia Development Resource Institute (2009), The Impact of High Food Prices in Cambodia (Phnom Penh: CDRI)
Cavendish, W. (1999), Poverty, Inequality and Environmental Resources: Quantitative Analysis of Rural Households, Working Paper Series, 99–9 (Oxford, UK: Centre for the Studies of African Economies, University of Oxford)
Cavendish, W. (2000), “Empirical Regularities in the Poverty–Environment Relationship of African Rural Households”, World Development, 28 (11), pp. 1979–2003
Dasgupta S., U. Deichmann, C. Meisner & D. Wheeler (2005), “Where is the Poverty-Environment Nexus? Evidence from Cambodia, Lao PDR, and Vietnam”, World Development, Vol.33, No.4, pp. 617-638
Del Ninno C., P.A. Dorosh & L.C. Smith (2003), “Public Policy, Markets and Household Coping Strategies in Bangladesh: Avoiding a Food Security Crisis Following the 1998 Floods”, World Development, Vol.31, No.7, pp.1221-1238
Ellis F. (1998), “Household Strategies and Rural Livelihood Diversification”, Journal of Development Studies, 35 (1), pp. 1–38
23CDRI Working Paper Series No. 64
Fafchamps, M. & S. Gavian (1997), “The Determinants of Livestock Prices in Niger”, Journal of African Economics, Vol. 6, pp. 255-95
Hesselberb J. & J. Yaro (2006), “An Assessment of the Extent and Causes of Food Insecurity in Northern Ghana Using a Livelihood Vulnerability Framework”, GeoJournal, Vol. 67, pp. 41-55
Inter-American Development Bank (2000), Social Protection for Equity and Growth. (Washington, DC: IADB)
Johnson K., B. Wisner & P. O’Keefe (2005), “Theses on Peasantry Revisited”, Antipode 37 (5) pp. 944–955
Kepe, T. (1999), “Environmental Entitlements in Mkambati: Livelihoods, Social Institutions and Environmental Change on the Wild Coast of the Eastern Cape”, Research Report, No. 1, Programme for Land and Agrarian Studies, Sussex University (Brighton, UK: IDS & PLASS)
Mekong River Commission (2006), Annual Mekong Flood Report 2005, (Vientiane: Mekong River Commission),
Mekong River Commission (2009), Annual Mekong Flood Report 2008 (Vientiane: Mekong River Commission)
Mink, S. (1993), Poverty, Population and the Environment, World Bank Discussion Paper No. 189 (Washington, DC: World Bank)
Ministry of Environment (2006), National Adaptation Programme of Action to Climate Change (NAPA) (Phnom Penh: Ministry of Environment)
Ministry of Environment (2005), Analysis of Policies to Address Climate Change Impacts in Cambodia (Phnom Penh: Ministry of Environment)
Ministry of Planning (2006), A Poverty Profile of Cambodia (Phnom Penh: Ministry of Planning)
Ministry of Planning (2009), General Population Census of Cambodia 2008 (National Report on Final Census Result) (Phnom Penh: National Institute of Statistics)
Morduch J. (1999), “Between the State and the Market: Can Informal Insurance Patch the Safety Net?” The World Bank Research Observer, 14 (2), pp. 187-207
Morris S.S. & Q. Wodon (2003), “The Allocation of Natural Disaster Relief Funds: Hurricane Mitch in Honduras”, World Development, Vol.31, No.7, pp.1279-1289
Owens T., J. Hoddinott & B. Kinsey (2003), “Ex-Ante Actions and Ex-Post Public Responses to Drought Shocks: Evidence and Simulations Zimbabwe”, World Development, Vol.31, No.7, pp.1239-1255
Feldman P.R., J.W. Rosenboom, Mao S., Peng N., Chea S., & S. Iddings (2007), “Assessment of the Chemical Quality of Drinking Water in Cambodia”, Journal of Water and Health, Vol. 5, No. 1, pp. 111-116
Pieri, C., J. Dumanski, A. Hamblin & A. Young (1995), Land Quality Indicators, World Bank Discussion Paper No. 315. (Washington, DC: World Bank)
Reddy, S. R. C., & S.P. Chakravarty (1999), “Forest Dependence and Income Distribution in a Subsistence Economy: Evidence from India”, World Development, 27 (7), pp. 1141–1149
Scoones, I. (1998), Sustainable Rural Livelihoods: A Framework for Analysis, IDS Working Paper Number 72 (Brighton: Institute of Development Studies)
Shyamsundar, P. (2002), Poverty-Environment Indicators, Environmental Economics Series, Paper No. 84, (Washington, DC: World Bank)

24 Poverty and Environment Links: The Case of Rural Cambodia
Skoufias E. (2003), “Economic Crises and Natural Disasters: Coping Strategies and Policy Implications”, World Development, Vol. 31, No. 7, pp. 1087-1102
So S. (2009), Impacts of Rising Prices on Poverty in Nine Study Villages: Some Preliminary Findings (Phnom Penh: CDRI)
Songsore, J., & G. McGranahan (1993), “Environment, Wealth and Health: Towards an Analysis of Intra-urban Differentials within the Greater Accra Metropolitan Area, Ghana”, Environment and Urbanization, 5 (2), pp. 10–34
Steward, A. (2007), “Nobody Farms Here Anymore: Livelihood Diversification in the Amazonian Community of Carvao, a Historical Perspective”, Agriculture and Human Values, 24, pp. 75–92
Surjadi, C. (1993), “Respiratory Diseases of Mothers and Children and Environmental Factors among Households in Jakarta”, Environment and Urbanization, 5 (2), pp. 78–86
Thieme, S. (2006), Social Networks and Migration: Far West Nepalese Labour Migrants in Delhi (London: Transaction Publishers)
Tong, K. (2009), How Did Cambodian Rural Households Cope with Shocks from Food and Oil Price Increase? (Phnom Penh: CDRI)
Wingqvist G. O. (2009), Cambodia Environment and Climate Change, Policy Brief, Environmental Economics Unit, University of Gothenburg, Sweden
World Bank (2001), Social Protection Sector Strategy: From Safety Net to Springboard (Washington DC: World Bank)
World Bank (2009), Poverty Profile and Trend in Cambodia: Findings from the 2007 Cambodia Socio-Economic Survey (CSES), East Asia and Pacific Region (Washington, DC: World Bank)
World Bank (2004), Cambodia at the Crossroads: Strengthening Accountability to Reduce Poverty, East Asia and Pacific Region (Washington, DC: World Bank)

25CDRI Working Paper Series No. 64
Appendix 1: Cambodia Flood Damage 1996-2008
YearTotal flood
damage (USD)
Major area affected Type of flood Major components of loss
1996 86,500,000 Along Mekong, Bassac Rrvers and around Tonle Sap Lake
Mekong flood and flash flood
Crops (250,218 ha), livestock (327), houses (3768), schools (173) roads (802 km), bridges (290 sites), culverts (2499 sites), dams (65 sites), death toll (169)
2000 161,000,000 Along Mekong, Bassac riversand around Tonle Sap Lake
Mekong flood and flash flood
Crops (421,568 ha), houses (7086), schools (6620), roads (908,710 km), bridges (1856 km), culverts (17 sites), dams (397 sites), death toll (347)
2001 36,000,000 Along Mekong, Bassac riversand around Tonle Sap Lake
Mekong flood and flash flood
Crops (164,173 ha), houses (2251), schools (911), roads (7976 km), bridges (175 sites), culverts (44 sites), dams (201 sites), livestock (956), death toll (62)
2002 12,450,000 Along Mekong, Bassac riversand around Tonle Sap Lake
Mekong flood and flash flood
Crops (45,003 ha), houses (35), schools (2), health centers (7), roads (12km), dams (201 sites), livestock (956)
2004 55,000,000 Along Mekong, Bassac riversand around Tonle Sap Lake
Mekong flood and flash flood
Crops (247,393 ha)
2005 3,810,000 Along Mekong, Bassac riversand around Tonle Sap Lake
Mekong flood and flash flood
Crops (1500 ha), houses (1700 flooded, 32 destroyed), schools (30 flooded), death toll (11)
2006 11,800,000 Along Mekong, Bassac riversand around Tonle Sap Lake
Mekong flood and flash flood
Crops (13,787 ha), road (70 km), dams (41 sites), bridges (24 sites), death toll (11)
2007 9,000,000 Along Mekong, Bassac riversand around Tonle Sap Lake
Flash flood Crops (18,786 ha), houses (11 sites), roads (34 km)
2008 5,750,000 Flash flood Crops (18,907 ha)Source: MRC (2009)

26 Poverty and Environment Links: The Case of Rural Cambodia
Appendix 2: The 20 High Priority NAPA ActivitiesProject title Objectives Location Status Sector
Rehabilitation of a Multiple-Use Reservoir in Takeo Province
To improve water storage capacity for multiple uses including irrigation, water supply for urban areas, recreation, and enhanced aquatic biodiversity.
Takeo This is a new initiative. Agriculture and water resources
Rehabilitation of Multiple-Use Dams in Takeo and Kampong Speu Provinces
To improve water management for multiple uses including irrigation, water supply rural communities, recreation, and aquatic biodiversity enhancement.
Takeo, Kampong Speu
Minor repairs have been conducted since the 1980s by local authorities. MOWRAM plans to undertake a detailed study of this project.
Agriculture and water resources
Community and Household Water Supply in Coastal Provinces
To provide safer water for rural communities in coastal areas, and reduce the incidence of water-related diseases.
Kampot Kep and Koh Kong
Wells and ponds have been constructed in Kampot and Kep by FAO, Food for Hunger, UNICEF and the WFP. Some NGOs have also distributed water filters.
Coastal zone
Development and Rehabilitation of Flood Protection Dykes
To protect settlements and agricultural fields from flood.
Battambang, Kampong Cham, Kandal, Kratie, Pursat, Sihanoukville and Svay Rieng
MOWRAM has developed flood protection structures in a number of provinces.
Agriculture and water resources
Rehabilitation of Upper Mekong and Provincial Waterways
To reduce risks caused by Mekong floods, by improving fishery resources, rural livelihoods by supplying sufficient water for irrigation and domestic uses,, and iprovincial water transportation.
Provinces along upper Mekong, Koh Kong, Prey Veng, Pursat and Svay Rieng
Provincial waterways rehabilitation has been carried out by MOWRAM with support from ADB, JICA and WB in Banteay Meanchey, Battambang and Kampong Speu.
Agriculture and water resources
Rehabilitation of Multiple-Use Canals in Banteay Meas District, Kampot Province
To enhance water storage capacity for general use in the villages during the dry season.
Kampot In Kampot the construction of wells and ponds has been undertaken with the assistance of FAO, Food for Hunger, UNICEF and WFP.
Coastal zone
Vegetation Planting for Flood and Windstorm Protection
To reduce flood and windstorm damage to property and crops.
Kampong Thom, Kampot, Kratie, Sihanoukville, Takeo, Prey Veng, Battambang and Banteay Meanchey
In the 1980s, MAFF started promoting the plantation of Acacia and Eucalyptus throughout the country including in coastal areas. Need to promote indigenous species.
Cross-sectional

27CDRI Working Paper Series No. 64
Strengthening of Community Disaster Preparedness and Response Capacity
To ensure preparedness for and effective response to climate hazards at the community level, and reduce climate hazard risks for local communities.
Banteay Meanchey, Kampong Cham, Kampong Speu, Kampot, Kandal, Prey Veng, Svay Rieng and Takeo
National Committee for Disaster Management (NCDM) has prepared a strategic plan integrating community disaster preparedness; Oxfam has worked on a comprehensive disaster management programme in Takeo province including preparedness, mitigation and risk reduction
Cross-sectional
Water Gates and Water Culverts Construction
To regulate flood water around the newly rehabilitated road network; and minimise road and crop damage caused by flood.
Banteay Meanchey, Kampong Cham, Kandal, Kratie, Prey Veng, Siem Reap, Svay Rieng and Takeo
The construction of water gates and culverts has been undertaken by some NGOs and NCDM in selected provinces.
Agriculture and water resources
Safer Water Supply for Rural Communities
To provide safe water in sufficient quantities for rural communities, and reduce the risk of contracting water-related diseases.
Battambang, Kampong Cham, Kampong Speu, Kampong Thom, Kandal, Kratie, Prey Veng, Ratanak Kiri and Takeo
The construction of wells and ponds in selected areas has been carried out by CONCERN, CRCD, FAO, UNICEF and WFP. In some places, locally made water filters have been provided by some NGOs
Agriculture and water resources
Development and Improvement of Small-Scale Aquaculture Ponds
To ensure food security in areas where wild fish stocks are insufficient to meet demand, and increase the income of people living in these areas.
Kampong Cham Kampong Speu Kandal, Kratie, Sihanoukville and Svay Rieng
Limited implementation of small scale aquaculture. MAFF has provided extension service and training to farmers about fishpond culture, as well as rice-fish culture in Kandal, Prey Veng, Svay Rieng and Takeo.
Agriculture and water resources
Promotion of Household Integrated Farming
To increase agricultural productivity, and improve farmers’ incomes, food security and livelihoods in areas affected by flood and drought.
Banteay Meanchey, Battambang, Kampong Speu, Prey Veng, Svay Rieng and Takeo
MAFF with support from ADB has implemented similar projects in selected areas of Banteay Meanchey, Battambang, Pursat and Siem Reap. Some NGOs have implemented similar projects in Prey Veng and Svay Rieng.
Agriculture and water resources
Rehabilitation of Coastal Protection Infrastructure
To increase agricultural production in coastal areas.
Kampot, Kep, Koh Kong and Sihanoukville
Damaged coastal protection structures have been identified and initial limited repairs conducted. GRET has repaired the Prey Nob polder in Sihanoukville and operates it with local communities.
Coastal zone

28 Poverty and Environment Links: The Case of Rural Cambodia
Development and Improvement of Community Irrigation Systems
To provide sufficient water for rice farming, reduce the risk of crop failure from water shortage, enhance food security and assist in eliminating poverty among rural people.
Banteay Meanchey, Battambang, Kampong Cham, Kampong Chhnang, Kampong Speu, Kampong Thom, Kampot, Kandal, Kratie, Prey Veng, Pursat, Ratanak Kiri, Siem Reap, Svay Rieng and Takeo
A number of governmental and non-governmental organisations and other donors such as ADB, APS (Italian Government) and the Japanese Government, have built medium-scale irrigation schemes in several provinces, including Battambang, Kampong Cham, Kampong Speu, Kampong Thom, Prey Veng, and Svay Rieng.
Agriculture and water resources
Community Mangrove Restoration and Sustainable Use of Natural Resources
To stabilise shoreline, reduce sea water intrusion, reduce coastal erosion, and protect coastal areas from storm damage.
Kampot, Kep and Koh Kong
There are at least three modules of similar community-based natural resource management established and/or functioning in coastal areas with support from IDRC/MoE and DANIDA.
Coastal zone
Community-based Agricultural Soil Conservation in Srae Ambel District, Koh Kong Province
To reduce soil erosion from agricultural land in the coastal watershed; and to increase food security.
Koh Kong AFSC has worked with local communities in Srae Ambel in the following areas: sustainable agriculture, and community forestry and fisheries.
Coastal zone
Production of Biopesticides
To reduce malaria incidence by introducing biopesticides
CNM and CPE Limited biopesticide research has been conducted in Cambodia.
Health
Development of Healthcare Centres and Posts
To assist the Ministry of Health in developing healthcare centres and posts in high risk malaria regions and areas highly vulnerable to climate change.
Selected villages in high risk malaria regions
Budget constraints have limited MoH construction of healthcare centres and posts.
Health
Provision of Safe Water in High Risk Malaria Regions
To reduce risk of mosquito bites while collecting water from rivers and streams, and provide communal water sources.
Selected villages in high risk malaria regions and in areas highly vulnerable to climate change
MRD in collaboration with NGOs and international organisations has constructed wells in a number of provinces.
Health
Malaria Education and Mosquito Habitat Clearance Campaigns
To raise public awareness of malaria prevention and treatment, promote behavioural changes towards malaria prevention and treatment; and reduce the extent of mosquito habitats.
Kampong Thom, Koh Kong, Mondul Kiri, Preah Vihear, Pursat, Ratanak Kiri, and Siem Reap
This project complements existing malaria health education by CNM, HU and PFD under the global fund.
Source: MOE (2006)

29CDRI Working Paper Series No. 64
CDRI Working Paper Series
22) Chan Sophal & Sarthi Acharya (July 2002), Land Transactions in Cambodia: An Analysis of Transfers and Transaction Records.
23) McKenney, Bruce & Prom Tola. (July 2002), Natural Resources and Rural Livelihoods in Cambodia.
24) Kim Sedara, Chan Sophal & Sarthi Acharya (July 2002), Land, Rural Livelihoods and Food Security in Cambodia.
25) Chan Sophal & Sarthi Acharya (December 2002), Facing the Challenge of Rural Livelihoods: A Perspective from Nine Villages in Cambodia.
26) Sarthi Acharya, Kim Sedara, Chap Sotharith & Meach Yady (February 2003), Off-farm and Non-farm Employment: A Perspective on Job Creation in Cambodia.
27) Yim Chea & Bruce McKenney (October 2003), Fish Exports from the Great Lake to Thailand: An Analysis of Trade Constraints, Governance, and the Climate for Growth.
28) Prom Tola & Bruce McKenney (November 2003), Trading Forest Products in Cambodia: Challenges, Threats, and Opportunities for Resin.
29) Yim Chea & Bruce McKenney (November 2003), Domestic Fish Trade: A Case Study of Fish Marketing from the Great Lake to Phnom Penh.
30) Hughes, Caroline & Kim Sedara with the assistance of Ann Sovatha (February 2004), The Evolution of Democratic Process and Conflict Management in Cambodia: A Comparative Study of Three Cambodian Elections.
31) Oberndorf, Robert B. (May 2004), Law Harmonisation in Relation to the Decentralisation Process in Cambodia.
32) Murshid, K.A.S. & Tuot Sokphally (April 2005), The Cross Border Economy of Cambodia: An Exploratory Study.
33) Hansen, Kasper K. & Neth Top (December 2006), Natural Forest Benefits and Economic Analysis of Natural Forest Conversion in Cambodia.
34) Pak Kimchoeun, Horng Vuthy, Eng Netra, Ann Sovatha, Kim Sedara, Jenny Knowles & David Craig (March 2007), Accountability and Neo-patrimonialism in Cambodia: A Critical Literature Review.
35) Kim Sedara & Joakim Öjendal with the assistance of Ann Sovatha (May 2007), Where Decentralisation Meets Democracy: Civil Society, Local Government, and Accountability in Cambodia.
36) Lim Sovannara (November 2007), Youth Migration and Urbanisation in Cambodia. 37) Chem Phalla et al. (May 2008), Framing Research on Water Resources Management and
Governance in Cambodia: A Literature Review.38) Pak Kimchoeun and David Craig (July 2008), Accountability and Public Expenditure
Management in Decentralised Cambodia.39) Horng Vuthy and David Craig (July 2008), Accountability and Planning in Decentralised
Cambodia.40) Eng Netra and David Craig (March 2009), Accountability and Human Resource Management
in Decentralised Cambodia.41) Hing Vutha and Hossein Jalilian (April 2009), The Environmental Impacts of the ASEAN-
China Free Trade Agreement for Countries in the Greater Mekong Sub-region.42) Thon Vimealea, Ou Sivhuoch, Eng Netra and Ly Tem (October 2009), Leadership in
Local Politics of Cambodia: A Study of Leaders in Three Communes of Three Provinces.
30 Poverty and Environment Links: The Case of Rural Cambodia
43) Hing Vutha and Thun Vathana (December 2009), Agricultural Trade in the Greater Mekong Sub-region: The Case of Cassava and Rubber in Cambodia.
44) Chan Sophal (December 2009), Costs and Benefits of Cross-border Labour Migration in the GMS: Cambodia Country Study.
45) CDRI Publication (December 2009), Costs and Benefits of Cross-country Labour Migration in the GMS: Synthesis of the Case Studies in Thailand, Cambodia, Laos and Vietnam.
46) CDRI Publication (December 2009), Agricultural Trade in the Greater Mekong Sub-region: Synthesis of the Case Studies on Cassava and Rubber Production and Trade in GMS Countries.
47) Chea Chou (August 2010), The Local Governance of Common Pool Resources: The Case of Irrigation Water in Cambodia.
48) CDRI Publication (August 2010), Empirical Evidence of Irrigation Management in the Tonle Sap Basin: Issues and Challenges.
49) Chem Phalla and Someth Paradis (March 2011), Use of Hydrological Knowledge and Community Participation for Improving Decision-making on Irrigation Water Allcation.
50) Pak Kimchoeun (May 2011), Fiscal Decentralisation in Cambodia: A Review of Progress and Challenges.
51) Christopher Wokker, Paulo Santos, Ros Bansok and Kate Griffiths (June 2011), Irrigation Water Productivity in Cambodian Rice System.
52) Ouch Chandarany, Saing Chanhang and Phann Dalis (June 2011), Assessing China’s Impact on Poverty Reduction In the Greater Mekong Sub-region: The Case of Cambodia.
53) Chann Sopheak, Nathan Wales and Tim Frewer (August 2011), An Investigation of Land Cover and Land Use Change in Stung Chrey Bak Catchment, Cambodia.
54) Nang Phirun, Khiev Daravy, Philip Hirsch and Isabelle Whitehead (June), Improving the Governance of Water Resources in Cambodia: A Stakeholder Analysis.
55) Kem Sothorn, Chhim Chhun, Theng Vuthy and So Sovannarith (July 2011), Policy Coherence in Agricultural and Rural Development: Cambodia.
56) Tong Kimsun, Hem Socheth and Paulos Santos (July 2011), What Limits Agricultural Intensification in Cambodia? The role of emigration, agricultural extension services and credit constraints.
57) Tong Kimsun, Hem Socheth and Paulos Santos (August 2011), The Impact of Irrigation on Household Assets.
58) Hing Vutha, Lun Pide and Phann Dalis (August 2011), Irregular Migration from Cambodia: Characteristics, Challenges and Regulatory Approach.
59) Chem Phalla, Philip Hirsch and Someth Paradis (September 2011), Hydrological Analysis in Support of Irrigation Management: A Case Study of Stung Chrey Bak Catchment, Cambodia.
60) CDRI Publication (October 2011), Poverty Dynamics Study: Evidence from Nine Villages in Cambodia.
61) Ros Bandeth, Ly Tem and Anna Thompson (September 2011), Catchment Governance and Cooperation Dilemmas: A Case Study from Cambodia.
62) Chea Chou, Nang Phirun, Isabelle Whitehead, Phillip Hirsch and Anna Thompson (October 2011), Decentralised Governance of Irrigation Water in Cambodia: Matching Principles to Local Realities.
63) Heng Seiha, Kim Sedara and So Sokbunthoeun (October 2011), Decentralised Governance in Hybrid Polity: Localisation of Decentralisation Reform in Cambodia


CDRI - Cambodia’s leading
independent development policy research ins�tute
� 56 Street 315, Tuol Kork � PO Box 622, Phnom Penh, Cambodia℡ (855-23) 881-384/881-701/881-916/883-603/012 867-278 � (855-23) 880-734E-mail: [email protected] Website: http://www.cdri.org.kh
Price: USD 2.50