Pottery Production and Circulation at the Sannai Maruyama ...
22
SENRI ETI-INOLOGICAL STUDIEs 63: 199-220 ©2003 Hunter-Gatherers of the North Pacific Rim Edited by J. Habu, J.M. Savelle, S. Koyama and H. Hongo Pottery Production and Circulation at the Sannai Maruyama Site, Northern Japan: Chemical Evidence from Early and Middle Jomon Pottery Junko HABu Department of Anthropology University of Caltfornia at Berkeley Mark E. HALL Niigata Prefectural Museum of History Masayuki OGAsAwARA Archaeological Center of Aomori Prefecture This paper examines issues concerning the production and circulation of Early and Middle Jomon pottery in the Tohoku region of northern Japan. An attempt is made to determine whether the copious amounts of pottery found at the Sannai Marnyama site were produced locally (i.e., made either at Sannai Marnyama or in the near vicinity), or were brought in from other areas. Using energy-dispersive x-ray fluorescence (EDXRF), we measure minor and trace element composition of 58 pottery samples from Sannai Marnyama and three other Early and Middle Jomon sites (futatsumori, Korekawa Ichioji and Hatanai) in the Tohoku region. Clay samples from the Sannai Maruyama site are also analyzed. Multivariate analysis of variance (MANOVA), linear discriminant analysis (LDA) with cross-validation, and step-wise discriminant analysis (SDA) with cross- validation are the statistical techniques used to analyze the chemical data. The results support the hypothesis that the majority of the pots examined in this study, including those excavated from Sannai Mamyama, were produced locally, and not imported from other areas. This study also highlights the importance of minor and trace element analysis for the geochemical differentiation of pottery. INTRODUCTION The purpose of this paper is to examine the production and circulation of Early and Middle Jomon pottery in the Tohoku region of northern Japan through chemical analysis of the pottery. The central question that we are asking in this paper is whether pottery excavated from the Sannai Maruyama site, which is located in the northern part of the Tohoku region, was made locally (i.e., either at Sannai Maruyama or in the vicinity), or brought in from elsewhere. Sannai Mamyama is a large prehistoric site dated primarily to the Early and Middle Jomon periods. Radiocarbon dates indicate that the site was occupied from approximately 5050 to 3900 uncalibrated b.p., or 5900 to 4300 calibrated B.P. [Tsun 1999J. Salvage excavations of the site from 1992 to 1994, which were to precede the construction of a baseball stadium, revealed that the entire area planned for the stadium was actually underlain by diverse features from the Early and Middle Jomon periods [OKADA 1995]. Because of the importance of this archaeological 199
Transcript of Pottery Production and Circulation at the Sannai Maruyama ...

SENRI ETI-INOLOGICAL STUDIEs 63: 199-220 ©2003Hunter-Gatherers of the North Pacific RimEdited by J. Habu, J.M. Savelle, S. Koyama and H. Hongo
Pottery Production and Circulation at the Sannai Maruyama Site,
Northern Japan: Chemical Evidence from Early and Middle Jomon Pottery
Junko HABuDepartment ofAnthropology
University of Caltfornia at Berkeley
Mark E. HALL
Niigata Prefectural Museum of History
Masayuki OGAsAwARA
Archaeological Center ofAomori Prefecture
This paper examines issues concerning the production and circulation of Early and
Middle Jomon pottery in the Tohoku region of northern Japan. An attempt is made to
determine whether the copious amounts of pottery found at the Sannai Marnyama site
were produced locally (i.e., made either at Sannai Marnyama or in the near vicinity), or
were brought in from other areas. Using energy-dispersive x-ray fluorescence (EDXRF),
we measure minor and trace element composition of 58 pottery samples from Sannai
Marnyama and three other Early and Middle Jomon sites (futatsumori, Korekawa Ichioji
and Hatanai) in the Tohoku region. Clay samples from the Sannai Maruyama site are also
analyzed. Multivariate analysis of variance (MANOVA), linear discriminant analysis
(LDA) with cross-validation, and step-wise discriminant analysis (SDA) with cross-
validation are the statistical techniques used to analyze the chemical data. The results
support the hypothesis that the majority of the pots examined in this study, including
those excavated from Sannai Mamyama, were produced locally, and not imported from
other areas. This study also highlights the importance of minor and trace element analysis
for the geochemical differentiation of pottery.
INTRODUCTION
The purpose of this paper is to examine the production and circulation of Early and Middle
Jomon pottery in the Tohoku region of northern Japan through chemical analysis of the pottery.
The central question that we are asking in this paper is whether pottery excavated from the
Sannai Maruyama site, which is located in the northern part of the Tohoku region, was made
locally (i.e., either at Sannai Maruyama or in the vicinity), or brought in from elsewhere.Sannai Mamyama is a large prehistoric site dated primarily to the Early and Middle Jomon
periods. Radiocarbon dates indicate that the site was occupied from approximately 5050 to 3900uncalibrated b.p., or 5900 to 4300 calibrated B.P. [Tsun 1999J. Salvage excavations of the site
from 1992 to 1994, which were to precede the construction of a baseball stadium, revealed that
the entire area planned for the stadium was actually underlain by diverse features from the Early
and Middle Jomon periods [OKADA 1995]. Because of the importance of this archaeological
199

200 J. Habu, M.E. Hall and M. Ogasawara
discovery, the governor of Aomori Prefecture halted construction of the stadium and declaredthat the site would be preserved. Subsequent test excavations at the site revealed that the actualsite area extends outside the planned stadium area [HABu and FAwcETI 19991. To date, morethan 700 pit-dwellings, and many other features, have been identified at the site. Chronologicalseriation of pottery from the pit-dwellings indicates that not all the pit-dwellings were occupiedsimultaneously. Nevertheless, the size of the site seems unusually large compared to other Earlyand Middle Jomon settlements [for details of the site, see Hnu 2002, n.d.; HABU eta!. 2001;OKADA, this volume.J
Of particular interest to archaeologists is an abundance of artifacts recovered from theSannai Maruyama site. The 1992 to 1994 excavations yielded more than 40,000 cardboardboxes (approximately 40 x 30 x 25 cm) of excavated materials [OKADA 1995]. The majority ofthese were potsherds. Traditionally, many Japanese scholars have assumed that Jomon pottery,at least pottery from the Incipient to Middle Jomon periods, was produced separately at eachsite where it was found. However, because of the abundance of pottery found at the SannaiMaruyama site, some scholars recently began to question this interpretation. They havesuggested that Sannai Mamyama was a trade center where large amounts of exotic goods andeveryday commodities, including pots, were exchanged. The presence of artifacts made fromexotic materials such as jade and obsidian, neither of which is available near Sannai Mamyama,suggests that long-distance trade was undertaken by the Sannai Maruyama residents. However,very few systematic analyses have been conducted regarding the possible exchange of pottery
and other commodities.As a first step to address this issue, we conducted a preliminary study of the minor and
trace element variability in Jomon pottery from four sites in the Tohoku Region. The sitesselected were Sannai Mamyama, Futatsumori, Korekawa Ichioji and Hatanai, all of which arelocated within Aomori Prefecture. All pottery samples examined date to the Early and MiddleJomon periods.
THEORETICAL BACKGROUND
As has been demonstrated elsewhere (e.g., PoLLAlu and HERON 1996), chemical analysisof pottery is an effective way to examine the issues of pottery production and circulation. Whilethere have been some chemical studies of Jomon pottery [e.g., IsHllcwA 1988, 1989; MITsuH
and INouE 1984; NIN0MWA eta!. 1990], only a limited number of these studies have specificallyfocussed on pottery production and circulation [e.g., Hu and HAlL 1999].
Behind much of the research in chemical studies of archaeological ceramics is theassumption that chemical characteristics of the clay used to manufacture the pottery reflect thelocal geological environment. The principal raw material in the production of pottery is clay,which is usually collected from sub-surface deposits. Since clay chemistry typically reflectsthe local geological environment, clays collected in different regions tend to exhibit differentchemical characteristics [HAan0TTLE and BIsHOP 1992: 27; JONEs 1986: 5-9; MOMM5EN eta!.198$; STEP0NAITIS eta!. 1996: 555-560; WILSoN 197$: 220-221]. Therefore, if we assume thatprehistoric potters used local clay to manufacture their pottery [A1u’oLD 1992:160, see also forexample Ku’JG et al. 1986: 362-363; ZEDEo 1994: 14-21, 50-51], we can expect that prehistoric

Pottery Production and Circulation at the Sannai Maruyama Site, Northern Japan 201
pots made in different regions have different chemical characteristics.While this seems straightforward, there are several other factors that need to be taken into
consideration. First, variability in clay chemistry is not necessarily a function of the distancebetween different clay sources. If the geological environment of a particular region is composedof many different rock types, then clays collected within the same region may have largechemical variability. Conversely, if the geological environments of two or more geographicregions are not significantly different, the clay chemistry between the regions may be similar.Second, clay is not necessarily the only raw material used to make pottery. Potters usually addone or more types of temper, such as sand, fiber, and shell fragments, to the clay. Since varioustypes of temper may affect the overall chemical characteristics of pottery, chemical differencesbetween pots may reflect differences in temper, not clay.
With these caveats in mind, demonstrated differences in the chemical composition ofseparate pieces of pottery could correspond to either (1) specific clay deposits, (2) regional claydeposits, (3) production workshops, or groups of potters who used similar raw materials andprepared the clay in similar fashion, or (4) a combination of two or more of these [AP.1’oLD etal. 1991: 84-88; CLARK et al. 1992; C0sTIN 1991]. On the other hand, if there are no cleardifferences between separate pieces of pottery, it may imply that they were made at the samegeographic locality, but there is also a possibility that they were made at different localitiesassociated with geochemically similar raw materials.
Because of these complexities, provenience studies of pottery from historical periodstypically use kiln samples (potsherds excavated from production sites) as comparativespecimens [e.g., HABu 1989]. At the first stage of the analysis, chemical characteristics of kilnsamples are examined. Once these characteristics are known, it is much easier to proveniencesamples from consumer sites to specific production areas. However, most prehistoric pottery,including Jomon pottery, was open-fired without using kilns. As a result, there are no provenspecimens from production sites that can be used as reference materials. While one can stillidentify chemical similarities and differences between different groups of pottery, there is nomethod of determining a priori the number of sources in the pottery samples examined, nor thedissimilarity between the sources.
Despite these problems, we suggest that the chemical characterization of Jomon potterycan provide insights into pottery production and circulation. The hypothesis that we test in thispaper is the following: if Jomon potters in the Tohoku region produced and used much of theirown pottery locally, we should expect to find statistically significant differences in the chemicalcomposition between pottery samples from different sites. If this hypothesis is rejected (i.e., ifthere are no statistically significant differences), it would suggest either (1) the Jomon pottersused raw materials that were geochemically similar, or (2) pottery was part of atrade/exchange/redistribution network between settlements.
To test the hypothesis, the methodology advocated by Vitali and co-workers [VITALI andFILa.I.auIm 1986; VITAl et al. 1987] was employed. This methodology uses discriminant analysisand multivariate analysis of variance (MANOVA) to examine the relationships betweenchemical variation, site location and time. Unlike correspondence analysis (CA) and otherordination methods, these tests cannot be used to determine the number of groups in a givendata set. The groups in the data must be assumed a priori.

202 J. Habu, M.E. Hall and M. Ogasawara
SITES AND ARCHAEOLOGICAL MATERIALS
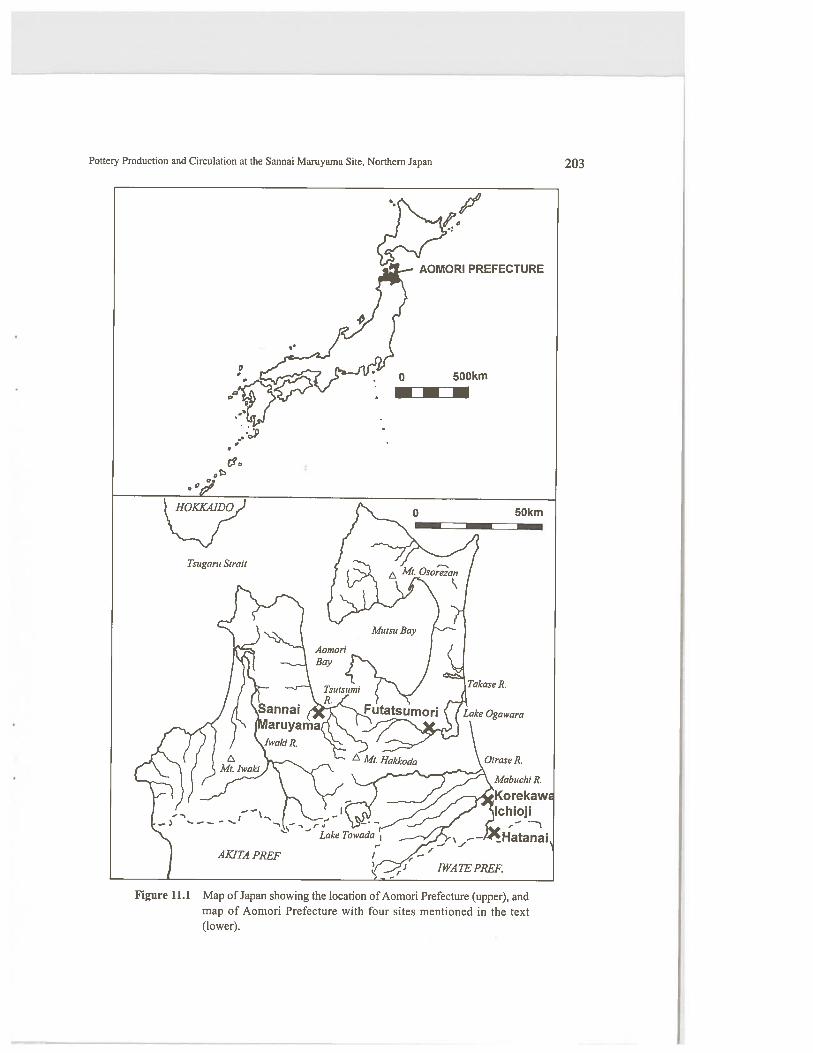
figure 11.1 shows the locations of the four sites analyzed in this paper. Sannai Maruyamais located in Aomori City, on the southeast bank of the Okidate River, which runs into AomoriBay. Details of the site are outlined in Okada’s paper (this volume), as well as by Kidder [1998],Habu [2002, n.d.] and Habu et al. [2001] . A total of 30 pottery samples excavated at the siteby three different institutes were analyzed in this paper. Figure 11.2 shows 12 potsherdsexcavated by the Board of Education of Aomon Prefecture. Figure 11.2.1 through 7 date to theEarly Jomon period, whereas Figure 11.2.8 to 12 are from the Middle Jomon period. Figure11.3 shows ten sherds excavated by Keio University during the 1 960s. These sherds date to theMiddle Jomon period. Finally, Figure 11.4 illustrates 1$ Early Jomon potsherds recovered fromthe columnar soil sample collected in the 6th Test Excavation Area by the Berkeley SannaiMamyama Project. In addition to these potsherd samples, 13 clay samples collected from naturaldeposits at the site were also analysed as possible source materials for potsherds at the site.
The second site, the Futatsumori shell-midden, is located in Kamikita Town, on the eastterrace of the Akagawa River near Lake Ogawara [A0M0RI PnEFEcTua&L MUSEUM Of LocALHIsToRY 1992]. Although the site spans both the Early and Middle Jomon periods, the fourpotsherds examined here (Figure 11.5) were all dated to the Early Jomon period. These sampleswere surface collections.
The third site, Korekawa Ichioji (abbreviated as Ichioji in Tables 11.1 and 11.4), is locatedin Hachinohe City, on the west bank of the Niida River, about six kilometers away from thepresent-day coastline. The site is part of the famous Korekawa site complex, includingKorekawa Ichioji, Nakai and Hofta. Potsherds examined in this paper (Figure 11.6) are all fromthe Ichioji area of the site complex, dating to the Middle Jomon period.
finally, the Hatanai site is located in the upper valley of the Niida River in Nango Village,Sannohe County. Surveys and salvage excavations of the site prior to construction of theYomasan dam, which is part of the Reclamation and Construction Plans of the Hachinohe Plain,revealed that the area was an Early and Middle Jomon settlement associated with large earthenmiddens with numerous potsherds [ARcHAEoLoGIcAL CENTER OF A0M0RI PaefEcTuRE 1994,1995, 1996, 1997, 1999, 2000]. Pottery samples examined from the site (Figure 11.7) are allfrom the Early Jomon period.
COMPOSITIONAL ANALYSIS
Methodology
The minor and trace element composition of the clay and pottery examined in this studywas determined using energy dispersive x-ray fluorescence (EDXRF). EDXRF is a low-costmethod that can be used to accurately measure elements with atomic numbers 11 through 41,and some of the rare earth elements [HAMPEL 1984: 21-22; POTTs 1987: 312-313].
The elemental analyses were performed using a Spectrace 440 EDXRF machine equipped
Pottery Production and Circulation at the Sannai Maruyama Site, Northern Japan 203
Figure 11.1 Map of Japan showing the location of Aomori Prefecture (upper), andmap of Aomori Prefecture with four sites mentioned in the text(lower).

204 J. Habu, ME. Hall and M. Ogasawara
0— — — — SM:MJ:005
Figure 11.2 Rubbings of surface treatment and vessel profiles of the pottery from
the Sannai Maruyama site (excavated by the Board of Education of
Aomori Prefecture).
ZA
$
SM:MJ:OOl
2
10cmSM:MJ:004
SM:MJ:003

Pottery Production and Circulation at the Sannai Maniyarna Site, Northern Japan 205
with a rhodium x-ray tube and a Tracor TX 6100 x-ray analyzer. The x-ray tube was operatedat 30 kV, 20 mA in air at 250 seconds livetime to generate x-ray intensity data for the elementscopper (Cu), gallium (Ga), iron (Fe), lead (Pb), manganese (Mn), nickel (Ni), niobium (Nb),rubidium (Rb), strontium (Sr), thorium (Th), titanium (Ti), yttrium (Y), zinc (Zn), and zirconium(Zr). The x-ray beam size was 0.5 cm to 0.75 cm in diameter. X-ray intensity data for barium(Ba), cerium (Ce), lanthanum (La), and neodymium (Nd) were generated by using an americium(241Ain) gamma-ray source for 500 seconds livetime in air. The Ka and La x-ray intensity linedata were converted to concentration values using a Compton scatter matrix correction and thelinear regression of a set of Geological Survey of Japan (GSJ), National Bureau of Standards(NBS), National Institute of Standards and Technology (NIST), and United States GeologicalSurvey (USGS) mineral standards. Inter-element effects are accounted for by using the Lucas-Tooth and Price (1961) correction.
The detection limits, as determined using geological standards [SHAclu.EY 1995], are asfollows: Ba 20 ppm, Ce 20 ppm, Cu 10 ppm, Fe 10 ppm, Ga 7.8 ppm, La 20 ppm, Mn 40 ppm,Nb 8 ppm, Nd 20 ppm, Ni 10 ppm, Pb 8 ppm, Rb 5 ppm, Sr 3.5 ppm, Th 9 ppm, Ti 23 ppm, Y7 ppm, Zn 4 ppm, and Zr 7 ppm. A comparative study between the EDXRF facility at theUniversity of California at Berkeley with the Research Reactor Facility at the University ofMissouri shows that EDXRF can obtain the same sensitivity, precision and accuracy as neutronactivation for the alkali, alkaline earth and transition metals in a silicic matrix [SHAcKLEY 1998:267].
To monitor the operation of the EDXRF unit, standards of knotvii composition were runwith the unknowns (results in Appendix). Using the Bishop et a!. [1990] definitions forprecision and accuracy, our precision was 10% or less for all elements, and the analytical
SM:k:OO1
5M:kOO$ 8
SM:k:006 6
SM:k:O1O
o 10cm—————I
Figure 11.3 Rubbings of surface treatment and vessel profiles of the pottery fromthe Sannai Marnyama site (excavated by Keio University).

206 J. Habu, ME. Hall and M. Ogasawara
SM:UCBOO
SM.UCB:004b
SM:UCB:005
h:
SM:UC:OO7
SM:UCH:059 16
..amOSM:UCB:045 15
18
0 10cm— — — !
Figure 11.4 Rubbings of surface treatment and vessel profiles of the pottery from
the Sannai Maruyama site (excavated by the Berkeley Sannal
Mamyama Project).

Pottery Production and Circulation at the Sannai Maruyarna Site, Northern Japan 207
0 10cm—————I
Figure 11.6 Rubbings of surface treatment and vessel profiles of the pottery fromthe Korekawa Ichioji site.
0 10cm—————
figure 11.5 Rubbings of surface treatment and vessel profiles of the pottery fromthe Futatsumori shell-midden.
--
I1:002
L2 1:003 3
k
1:005 5
c a1:006 6
c . ‘.
1:007
—
s
••..I’
1:009 9
t:008
1:010 10

208 J. Habu, M.E. Hall and M. Ogasawara
Figure 11.7 Rubbings of surface treatment and vessel profiles of the pottery fromthe Hatanai site.
accuracy for most elements was 15% or less. The accuracy was calculated as follows:
(standard value - mean value)j * 100% / standard value
Precision was calculated in an analogous fashion. These numbers are good since they are a
measure of the difference between a standard value and an observed value.
Destructive EDXRF analysis was not permitted for the sherds from Hatanai and Korekawa
Ichioji. Accordingly, only non-destructive analyses were conducted. Before irradiation, each
potsherd was rinsed with distflled, de-ionized water, scrubbed with a nylon brush, and then
rinsed with distilled, de-ionized water again. The sherds were allowed to air dry. In most cases,
the x-ray analysis was conducted on the cross-section of the sherds. The clay samples were
formed into a flat pellet with the aid of a hand press and fired at 8 50°C for one hour and allowed
to cool in the furnace over night.We do not regard postdepositional chemical alteration as a major concern. Raw clay has
a cation-exchange capacity of only 1% to 5% [HEDGEs and McLELLAN 1976], and fired clay
has an even much lower cation-exchange capacity. Because of this, scholars such as Bishop et
a!. [1982] and Hedges and McLellan [1976] assert that the trace element concentrations are not
I --.-
J:.H:002
H:003 32
r---.-
fr-.r- I ,‘ ::-::.--c- —:::— -
Ii -
I I - — . ,-.--
frr/ 4H:004 _•.c- 5 H:006
11:005
0 10cm

Pottery Production and Circulation at the Sannai Maruyama Site, Northern Japan 209
significantly altered by post-depositional processes (for details, see Habu and Hall [2001: 150]).All statistical operations were performed with SPSS Release 8,0.
Compositional Data and Analysis
Table 11.1 contains the minor and trace element data for each sample. All values are listedin parts per million (ppm). Table 11.2 contains the minor and trace element data for the firedclay samples from Sannai Mamyama.
The elemental values were transformed to log base 10 values. This transformationcompensates for the differences in magnitude between minor and trace elements [PEISACH etat. 1982: 355-356; PoLLn 1986: 69-71; WmsoN 1978: 226,227]. for cases below the detectionlimit, one half the detection limit was used in the transformation and subsequent data analysis.
A multivariate analysis of variance (MANOVA) was performed to assess the overallvariance in the data set [see NouRIs 1993: 57-95; SHAJUvIA 1996: 342-371]. The goals of thisanalysis were to see (1) if the log-transformed population means of the chemical variables arethe same for the four sites, and (2) whether location or time period, or the combination of bothfactors, accounts for the variability in the data. The variance is evaluated by means ofF-values,which are defined as the ratio of between-group to within-group variance for the elements underconsideration. An f-value can range from 0 to infinity. The larger the F-value, the moresignificant a factor or combination of factors is in accounting for the variance [VITALI et at.1987: 428-429]. Akin to the Student’s t-test or the chi-square test, the significance of the F-values is evaluated against the F-distribution. In this study, the F-values were determined usingPillai’s trace statistic. Statistical studies have demonstrated that F-values based on Pillai’s traceare exceedingly robust and detect true differences in the data [SHAfMA 1996: 348]. The eta-squared test statistic, which indicates the proportion of the variability each factor or combinationof factors represents, is also calculated [Nouiis 1993 :41]. A value near 0 indicates the factorrepresents little of the variance in the data. A value near 1 indicates that nearly 100% of thevariability is accounted for by the factor.
Table 11.3 contains the results of the MANOVA test. The clay samples from SannaiMamyama were not included in the MANOVA test since the deposit could have been exploitedat any time, and not necessarily in the Jomon period. While the F-values for both the time periodand site location are statistically significant at the 95% confidence level, most variance in thedata is due to site location: the eta-squared test statistic indicates that site location accounts fornearly 70% of the variability in the data.
Discriminant analysis [see BAxTER 1994a: 185-2 18, l994b] was performed to assessseparation between the four sites and see which subset of variables separates the four groupsbest. In linear discriminant analysis (LDA), it is assumed that unique groups exist in the dataand linear combinations of variables that maximize the differences between groups are sought.Stepwise discriminant analysis (SDA) adds or deletes variables in a set of criteria so that groupseparation is maximized. This method results in the removal of variables that can blur thedistinctions between groups. More realistic classification rules were then obtained using a cross-validation algorithm [3.xmR 1 994b]. In this “leave one out” process, each sample was allocatedto a group on the basis of discriminant functions that were calculated without the sample.

Tab
le11
.1M
inor
and
trac
eel
emen
tco
mpo
siti
onof
the
pott
ery
sher
ds(p
pm).
SAM
PLE
#SI
TE
PHA
SET
iM
nFe
Ni
Cu
Zn
Th
Rb
SrY
Zr
Nb
Ba
La
Ce
Nd
F:E
J:00
IF
utat
sum
oñE
arly
jom
on80
1251
123
603
2442
209
2120
1311
525
022
152
1664
122
ndnd
f:E
J:00
2Fu
tats
umor
iE
arly
Jom
on80
6234
927
002
2132
123
1725
1055
358
3318
08
1387
29nd
nd
F:E
J:00
3Fu
tats
umor
iE
arly
Jom
on85
1364
921
995
2637
9227
3416
7481
2421
111
375
ndnd
nd
f:E
J:00
4fu
tats
umod
Ear
lyJo
mon
1125
060
234
206
1937
780
2728
i’d58
169
2221
615
305
ndnd
i’d
H:0
01H
atan
aiE
arly
Jom
on13
560
537
5106
733
2812
526
29nd
4082
1921
514
391
nd49
nd
H:0
02H
atan
aiE
arly
Jom
on10
290
398
4110
125
2510
924
2213
3311
619
195
1127
6nd
34nd
11:0
03H
atan
aiyom
op
1097
031
146
409
4023
144
3020
1351
139
2426
38
382
26i’d
22
11:0
04H
atan
aiE
arly
Jom
on79
9128
530
379
1721
9524
17nd
2210
420
133
nd29
3nd
29nd
11:0
05H
atan
aiE
arly
Jom
on87
4732
326
621
1939
121
2225
nd55
150
2218
612
384
ndnd
nd
11:0
06H
atan
aiE
arly
Jom
on76
3529
325
334
2524
186
2420
nd77
124
2017
2nd
389
ndnd
nd
11:0
07H
atan
aiE
arly
Jom
on98
0536
635
332
2921
9732
2719
5611
418
181
1535
4nd
37nd
1:00
1Ic
hioj
iM
iddl
eJo
mon
6942
340
3758
640
3726
720
3014
9231
730
167
993
920
5624
1:00
2Ic
hioj
iM
iddl
eJo
mon
1142
062
353
161
1673
182
2325
1nd
7527
725
149
nd67
1nd
nd20
1:00
3Ic
hioj
iM
iddl
eJo
mon
8922
486
4379
820
167
191
1820
nd63
279
3212
5i’d
712
i’d43
21
1:00
4Ic
hioj
iM
iddl
eJom
on90
3421
137
849
1760
210
1927
nd53
263
5215
$11
996
3963
46
1:00
5Ic
hioj
iM
iddl
eJom
on63
3631
331
074
1914
128
816
2519
8420
221
178
1159
120
41nd
1:00
6Ic
hioj
iM
iddl
eJo
mon
9299
940
5185
522
4026
122
42nd
8327
428
177
1491
6nd
3928
1:00
7Ic
hioj
iM
iddl
eJom
on94
1913
5954
866
1215
135
618
33nd
7331
532
158
11$7
520
nd21
1:00
8Ic
hioj
iM
iddl
eJo
mon
1219
422
931
520
3651
180
3955
1672
469
4719
0nd
900
2873
34
1:00
9Ic
hioj
iM
iddl
eJo
mon
8284
289
4395
015
5021
619
23nd
6626
323
156
1483
9nd
3322
1:01
0Ic
hioj
iM
iddl
eJom
on11
277
544
4956
426
142
326
2145
nd62
417
4717
1nd
$68
2351
25
SM:E
J:O
Ol
Sann
aiM
aruy
ana
Ear
lyJo
mon
1102
675
236
279
nd38
114
2338
1613
227
526
212
i’d21
42i’d
6140
SM:E
J:00
2Sa
nnai
Mar
uyam
aE
arly
Jom
on66
9143
831
183
3246
137
2437
1971
159
4021
612
1560
2055
36
SM:E
J:00
3Sa
nnai
Mar
uyam
aE
arly
Jom
on89
9036
022
412
2725
114
1728
1451
518
3817
89
3090
2347
49
SM:E
J:00
4Sa
nnai
Man
jyam
aE
arly
Jom
on76
0361
739
083
3138
140
2337
1193
211
3923
912
2318
i’d48
42
SM:E
J:00
5Sa
nnai
Man
iyam
aE
arly
Jom
on51
4822
617
161
125
3710
819
2910
7250
332
197
1243
6924
5673
SM:E
J:00
6Sa
nnai
Mam
yam
aE
arly
Jom
on74
7321
625
837
3073
9219
3513
107
217
3321
610
2225
2960
43
SM:E
J:00
7Sa
nnai
Mar
uyam
aE
arly
Jom
on68
2423
315
822
2362
5721
23nd
7119
124
166
1214
71i’d
3122
SM:k
:001
Sann
aiM
aruy
ama
Mid
dle
Jom
on10
34$
419
4858
526
4116
129
4$19
9113
934
254
2076
3i’d
4926
SM:k
:002
Sann
aiM
aruy
ama
Mid
dleJ
omon
6950
467
3302
216
6516
725
3515
8820
326
163
1010
33i’d
3$26
SM:k
:003
Sann
aiM
aruy
ama
Mid
dle
Jom
on77
5065
939
686
2430
7$27
3715
$116
439
212
1268
2nd
4926
SM:k
:004
Sann
aiM
aruy
ama
Mid
dleJ
omon
6101
288
2885
221
5892
2132
1299
153
2215
612
543
2340
22
SM:k
:005
Sann
aiM
aruy
ama
Mid
dleJ
omon
6902
235
3706
915
3269
1636
1341
180
2515
89
831
nd28
24
SM:k
:006
Sann
aiM
amya
ma
Mid
dle
Jom
on86
4926
536
257
3039
150
2634
1567
169
4422
516
979
2147
29
SM:k
:007
Sann
aiM
aruy
ama
Mid
dle
Jom
on83
7829
637
559
2652
195
2840
1085
153
Jj
2254
34
SM:k
:008
Sann
aiM
aniy
sma
Mid
dleJ
omon
7269
23$
3933
419
3115
026
2352
167
3418
39
849
2341
27
SM:k
:009
Sann
atM
ai’iy
ama
Mid
dleJ
omon
8866
488
3485
414
2414
924
30i’d
5824
227
174
1190
420
3024
SM
:k:0
l0Sa
mia
iMar
uyam
aM
iddl
eJom
on85
6265
255
762
2171
114
2639
1712
410
524
203
1667
0i’d
40i’d

SM
:MJ:
00l
Sann
aiM
amya
ma
Mid
dle
Jom
on72
1027
328
063
2124
6528
38nd
7414
527
200
1134
622
nd25
SM:M
J:00
2Sa
nnai
Mar
uyam
aM
iddl
eJo
mon
7123
297
3090
029
7564
2342
1491
126
2819
312
362
2132
ndSM
:MJ:
003
Sann
aiM
aruy
ama
Mid
dle
Jom
on66
8518
035
759
3713
9326
3010
6513
127
190
1636
922
ndnd
SM:M
J:00
4Sa
nnai
Mar
uyam
aM
iddl
eJom
on96
1149
740
705
5326
132
3630
1167
141
3720
112
384
27nd
27SM
:MJ:
005
Sann
aiM
aruy
ama
Mid
dleJ
omon
6769
309
3712
626
3777
2539
1210
812
625
185
1534
7nd
nd30
SM:U
CB
:O0l
Sann
aiM
amya
ma
Ear
lyJo
mon
6919
676
4092
748
4487
2143
1786
236
3715
512
981
2049
33SM
:UC
B:0
02Sa
nnai
Mam
yam
aE
arly
Jom
on79
2359
329
163
3334
7622
3916
4820
127
183
1477
1nd
36nd
SM:U
CB
:002
Sann
aiM
anjy
ama
Ear
lyJo
mon
6222
446
2520
917
3475
1930
1746
208
3417
512
606
nd41
25SM
:UC
B:0
02Sa
nnai
Mar
uyam
aE
arly
Jom
on67
1954
935
450
3930
227
3140
1717
191
3816
5nd
605
2441
22SM
:UC
B:0
03Sa
nnai
Mar
uyam
aE
arly
Jom
on65
0756
038
361
1824
172
2938
1697
219
3617
513
821
2752
25SM
:UC
B:0
03Sa
nnai
Mam
yam
aE
arly
Jom
on68
5365
337
400
3726
161
2839
2193
231
3918
411
821
2049
26SM
:UC
B:0
04Sa
nnai
Mam
yam
aE
arly
Jom
on73
7257
940
545
2742
118
2239
1669
208
3718
3nd
784
2135
27SM
:UC
B:0
04Sa
nnai
Mam
yam
aE
arly
iom
on60
2562
234
810
2932
212
2747
2210
721
533
166
1666
527
4823
SM:U
CB
:005
Sann
aiM
aruy
ama
Ear
lyJo
mon
6550
954
3915
833
4819
624
4320
7128
042
167
1512
8526
4730
SM:U
CB
:006
Sann
aiM
anjy
ama
Ear
lyJo
mon
6106
1128
4157
533
5413
223
4914
5426
136
206
813
9425
5228
SM:U
CB
:007
Sann
aiM
aruy
ama
Ear
lyJo
mon
9772
808
7141
3nd
2059
2337
1638
161
1918
39
1078
nd32
24SM
:UC
B:0
08Sa
nnai
Mar
uyam
aE
arly
Jom
on61
1979
027
709
3922
9420
3911
6015
131
159
966
221
3223
SM:U
CB
:OlO
Sann
aiM
aruy
ama
Ear
lyJo
mon
6130
483
3336
314
2515
425
3115
5715
926
182
1064
6nd
3020
SM:U
CB
:041
Sann
aiM
amya
ma
Ear
lyJo
mon
7346
1084
4273
611
2590
2351
1037
286
2819
5nd
1661
nd42
32SM
:UC
B:0
45Sa
nnai
Mam
yam
aE
arly
Jom
on67
3562
340
042
2233
6225
4314
9221
336
161
1486
823
4929
SM:U
CB
:059
Sann
aiM
aruy
ama
Ear
lyJo
mon
6207
770
3551
121
3312
821
4113
6915
642
169
1136
1nd
40nd
SM:U
CB
:064
Sann
aiM
aruy
ama
Ear
lyJo
mon
6227
584
3493
015
6112
024
4912
4419
031
215
1079
5nd
30nd
SM:U
CB
:064
Sann
aiM
aruy
ama
Ear
lyJo
mon
5475
318
1981
117
1650
1660
1747
218
2815
710
677
nd32
ndN
ote:
“nd”
stan
dsfo
rno
tde
tect
ed.
Tab
le11
.2M
ino
ran
dtr
ace
elem
ent
com
po
siti
on
of
the
San
nai
Mar
uy
ama
clay
(pp
m).
SAM
PLE
#SI
TE
Ti
Mn
FeN
iC
uZ
nG
aPb
Th
Rb
SrY
Zr
Nb
Ba
La
Ce
Nd
clay
0lSa
nnai
Mar
uyam
a-cl
ay85
1212
5250
126
2620
111
2652
1413
915
634
223
1364
725
5123
clay
02S
anna
iMar
uyam
a-cl
ay86
7313
8353
018
1823
108
2344
1213
717
036
227
1167
624
5326
clay
03S
anna
iMar
uyam
a-cl
ay75
7013
6547
853
1817
8625
4716
124
165
3320
610
637
2846
30cl
ay04
San
naiM
amya
ma-
clay
8740
1382
5320
816
2910
629
4819
130
175
3522
119
573
2047
20cl
ayos
San
naiM
amya
ma-
clay
7375
1294
4629
325
1888
2642
1211
615
136
209
1353
7nd
44nd
clay
06S
anna
iMar
uyam
a-cl
ay94
4314
8954
942
1718
9421
5120
137
168
3423
117
625
2555
31cl
ayo7
San
naiM
aruy
ama-
clay
8512
1252
5189
826
20Il
l26
5215
139
157
3422
313
573
2248
24cl
ayO
8S
anna
iMar
uyam
a-cl
ay78
0110
4947
915
2417
9027
5218
139
148
2922
315
572
nd53
21cl
ay09
Sann
aiM
awya
ma-
clay
8809
1279
5406
616
910
429
5716
133
165
3622
212
569
nd45
24cl
aylO
San
naiM
amya
ma-
clay
7671
1178
5076
630
1995
2448
2114
314
633
219
1256
526
5328
clay
llS
anna
iMar
uyam
a-cl
ay80
5112
7752
556
2921
9522
5013
132
153
3021
915
508
2453
26cl
ayl2
San
naiM
amya
ma-
clay
7419
978
4886
319
1798
2940
1614
113
430
215
1850
221
4424
clay
l3Sa
nnai
Mar
uyam
a-cl
ay88
1418
7557
689
2240
101
3047
1711
117
436
218
1867
029
5622
—

212 J. Habu, M.E. Hall and M. Ogasawara
Table 11.3 Multivariate analysis of variance results.
Pillai’s Trace F-value Eta2
Site 2.09 5.21 0.697
Phase 0.63 3.70 0.630
Site*Phase undefined 0.000 0.000
Looking at site location, LDA with cross-validation resulted in 77% of the cases being
correctly classified. The misclassified cases are listed in Table 11.4. A plot of the cross-validated
discriminant functions is in figure 11.8. for a probability off-to-enter of 0.05, a probability
of f-to-remove equal to 0.10, and maximizing the Wilks’ lambda score between groups, SDA
with cross-validation correctly classified 85% of the cases. The following log-transformed
elements were identified as the most important discriminators: Cu, Nd, Pb, Sr, Ti, Zn, and Zr.
The misclassified cases for the SDA with cross-validation are also listed in Table 11.4.
finally, figure 11.8 also plots the discriminant scores for the 13 clay samples from the
Sannai Mamyama site. While the discriminant functions do associate the Sannai Mamyama
clay samples with the Sannai Mamyama pottery samples, the discriminant scores for pottery
samples have more spread. In other words, the minor and trace element characteristics of the
clay samples are more homogenous than those of the pottery samples.
DISCUSSION
The F-statistic from the MANOVA test and the results from the discnminant analysis tests
indicate that the log-transformed population means of the chemical variables for the four sites
differ, and that most variance in the data is due to site location. LDA and SDA with cross-
validation resulted in 77% and 85% of the cases being correctly classified respectively. These
results support the hypothesis that the majority of the pottery samples examined here are likely
to have been produced locally.Among the four sites, the futatsumori shell-midden had the highest percentage of
misclassified samples (75% in both LDA and SDA). The large variability among Futatsumon
sherds is illustrated in Figure 11.4. Unfortunately, because the sample size from this site is
extremely small (only four samples), no definite conclusions can be drawn from these particular
results. The percentage of misclassified samples from the Korekawa Ichioji site using LDA
with cross-validation (40%) was also high, but in SDA with cross-validation, the percentage
misclassified was only 10%. This difference (40% vs. 10%) is likely due to the fact that SDA
only uses the variables that can discriminate between groups [see BAxTER 1994a: 212-213].
The percentages for misclassified samples from the Sannai Maruyama and Hatanai sites were
relatively low: 15% (LDA with cross-validation) and 10% (SDA with cross validation) for
Sannai Mamyama, and 14% in both methods for Hatanai.The discriminant functions indicate association of natural clay samples from Sannai
Mamyama with pottery samples from the same site. This supports our ifflerpretation that Jomon
potters at Sannai Maruyama used local clay resources. It must be emphasized, however, that
matching a clay source to a ceramic group on geochemical grounds is not always straightforward

Pottery Production and Circulation at the Sannai Maruyama Site, Northern Japan 213
A
4
A
CAA AA A
A2
A III SEo I S
A • •.0 .• 0••
g • •o
•:°
SITE
E -2 + • Sannal MaruyamaU
— U 0 Sannai Man1yamaay
U U U
4 i AIsioji
+
6 + Fulatsumoti
-6 4 -2 0 2 4
Discriminant Scores from Function I
Figure 11.8 Plot of the first two discriminant functions obtained from linear
discriminant analysis with cross validation.
Table 11.4 Misclassified cases from the discriminant analysis for groups based on site location.
Sample No. Actual Group Predicted Group, LDA Predicted Group, SDAwith cross validation with cross validation
F:EJ:001 Futatsumori IchiojiF:EJ:002 futatsumori Sannai Marnyamaf:EJ:003 futatsumori Sannai Maruyama HatanaiF:EJ:004 Futatsumori Ichioji IchiojiH:005 Hatanai Futatsumori futatsumori1:004 Ichioji Sannai Mamyama1:005 Ichioji Futatsumori Futatsumori1:007 Ichioji futatsumori1:008 Ichioji Sannai MaruyamaSM:EJ:003 Sannai Maruyama Futatsumod HatanaiSM:EJ:007 Sannai Maruyama futatsumoriSM:K:009 Sannai Maruyama HatanaiSM:K:OlO Sannai Marnyama FutatsumoriSM:MJ:003 Sannai Maruyama HatanaiSM:MJ:004 Sannai Maruyama futatsumodSM:UCB:002a Sannai Marnyama Futatsumori futatsumoriSM:UCB:002c Sannai Mamyama Hatanai
Note: A blank entry indicates that the specimen was not misclassified.

214 J. Habu, M.E. Hall and M. Ogasawara
[ADAN-BAvyEwITz and PERLMAN 1985; ARNOLD et al. 2000; SuMMERHAYEs 1997J. In thepresent study, natural clay samples were obtained from only one location near the site, and littleattention was paid to the depth from which the samples were taken. Ideally, clay samples should
be taken from several locations throughout a clay deposit to fully document geochemicalvariation within the deposit. Thus, the spread of discriminant scores for the Sannai Maruyamapottery observed so far could be due to either geochemical variation in a single clay deposit, orthe mixing of clays and tempers from elsewhere with the clay from the site. Further researchis needed to assess these posibilities.
The misclassified cases in discriminant analysis could have a variety of causes. One
possibility is that the misclassified samples indeed belong to their predicted geochemical groups.This could mean that some pots were moved between sites. Kojo’s [1981] petrographic studyindicates that an average of 20 to 30 % of the pottery at Moroiso-b phase sites in central Japanwas imported. The overall percentage misclassified in the present study is in this range, andcould reflect cases of pottery movements between sites. Therefore, it is possible that the
misclassified samples actually belong to the cross-validated groups predicted by LDA and SDA.
Alternatively, the misclassified samples may not belong to the predicted groups. Althoughboth MANOVA and LDA/SDA assume that actual chemical groups have been recognized inthe data set, this assumption may be inappropriate: some samples may have been from chemicalgroups that are not represented by any of the four groups.
The misclassified cases may be due to the use of different tempers, or of more than oneclay source, at a given site. Petrographic analysis can provide further insights as to the clay“recipes” used, while beryllium and lead isotopes can be used to provenance the specific claysused in pottery [IM.MuRA et al. 1998].
Misclassification could also be due to similarity in the chemistry of regional clay sources.For example, since the Futatsumori and Sannai Mamyama sites are both located h areas of
Holocene and Quatemary muds, sands and gravels that were formed primarily by the erosionof the Ou mountains [JAPANEsE GEoLoGIcAL SuRvEY 1982: 9], it is possible that the chemicalcharacteristics of clays in or near the two sites are geochemically similar. Quantitativepetrography could possibly address whether this is an issue or not.
finally, another possibility is that misclassification and overlap between groups was due
to the accuracy and precision of the EDXRF analyses. Bishop et at. [1990: 540] and Wilson
[1978: 222] note that when the accuracy and/or precision of an analytical method are greaterthan 5%, the analytical method sometimes masks the statistical differences between groups.Further analyses, using a technique such as neutron activation analysis, will be necessary inorder to clarify these issues.
Our results using SDA with cross-validation indicated that Cu, Fe, Ga, Mn, Nd, Pb, Ti,
Zn and Zr are the most important discriminating elements. Other than iron and titanium, allthese elements occur at trace levels. Past x-ray fluorescence (XRF) studies of Jomon potteryby Japanese scholars have focussed on measuring major and minor elements. This study, aswell as our previous studies [HABu and HALL 1999, 2001], emphasizes the importance of minorand trace element analysis for sourcing Jomon pottery.

Pottery Production and Circulation at the Sannai Mawyama Site, Northern Japan 215
CONCLUSION
In conclusion, although the analysis presented here is still preliminary, the results dosupport the hypothesis that most pots excavated from Sannai Mamyama were made locally,with little if any introduction of pottery from other areas. The results of our study alsodemonstrate the importance of minor and trace element analysis, as opposed to only the studyof major elements, for distinguishing pottery made in different areas.
In order to investigate why large amounts of pottery were produced at the SannaiMamyama site, we need to consider site functions in relation to subsistence, settlement, religionand social networks [HABu 2002, n.d.; HABu et at. 2001). Future chemical analyses shouldinclude (1) more systematic testing for changes through time in the chemical composition ofpottery, (2) further comparison with other Jomon sites in the vicinity of Sannai Mamyama, (3)investigation of possible correlations between stylistic variation and the chemical compositionof pottery, and (4) analyses of clay artifacts other than pots, such as clay figurines.
Because of its extraordinarily large size and the abundance of associated artifacts, thearchaeological study of the Sannai Mamyama site has attracted the attention of many scholars[e.g., Ktnnrtn 1998; UMEHAL4 and YASuDA 1995]. As recent studies [e.g., HAnu 2002, n.d.;Hu et at. 2001; OKADA, this volume] indicate, however, the intra-site spatial pattems, as wellas their changes through time, are extremely complex, and we are just beginning to understandthe structural complexity. Although the results presented here deal with only one specificresearch question regarding pottery production and circulation, we hope that our research willhelp to clari& the nature and function of this extremely interesting Jomon site.
APPENDIX Values obtained for RGM-1 Standard (ppm).
Element RGM-1 (Govindaraju 1994) RGM-1, this study (n7)Ba 807 798
Ce 47 45
Cu 11.6 17Fe203 18600 19000
Ga 15 15
La 24 26
MnO 360 349
Nb 8.9 12
Nd 19 26
Ni 4.4 6Pb 24 23
Rb 149 148
Sr 108 102
Th 15.1 16
Ti02 2670 2810
Y 25 31
Zn 32 39
Zr 219 218

216 J. Habu, M.E. Hall and M. Ogasawara
ACKNOWLEDGMENTS
We would like to thank Steve Shackley for reviewing a draft of this manuscript. We would also like to
thank the Board of Education of Aomori Prefecture, Jomon Gakushu-kan of Hachinohe City, and the
Department of Ethnology and Archaeology of Keio University for providing us with the potsherd samples.
Any errors, of course, are ours.
BIBLIOGRAPHY
ADAN-BAvYEWITZ, D. and I. PEIuMAN
1985 Local pottery provenience studies: a role for clay analysis. Archaeomet,y 27: 203-217.
AoMoru PfaFEcTuIL MUSEUM OF LOCAL HISTORY [Aomori Kenritsu Kyodo-kan]
1992 Shelt-middens Adjacent to Lake Ogawara: Excavtion Reports of the Yamanaka No. 2 Shell
midden in Misawa City, and the futatsumori Shell-midden in Tenmabayashi Village
[Ogawara-ko shuhen no Kaizuka: Misawa-shi Yamanaka (2) Kaizuka, Tenmabayashi-mura
Futatsumori Kaizuka Hakkutsu Chosa Hokoku]. Aomori: Aomori Prefectural Museum of
Local History. (In Japanese)
ARCHoLoGICAL CENTER OF AoMolu PIFECTu1 [Aomori-ken Maizo Bunkazai Chosa CenterJ
1994 The Hatanai Site Vol. I [Hatanai Iseki, I]. Aomon: Board of Education of Aomori Prefecture
[Aomori-ken Kyoiku IinkaiJ.
1995 The Hatanai Site, Vol. II [Hatanai Iseki II]. Aomori: Board of Education of Aomori
Prefecture [Aomori-ken Kyoiku Iinkai].
1996 The Hatanai Site, Vol. III [Hatanai Iseki, III]. Aomori: Board of Education of Aomori
Prefecture [Aomori-ken Kyoikti IinkaiJ.
1997 The Hatanai Site, Vol. IV [Hatanai Iseki, IV]. Aomori: Board of Education of Aomori
Prefecture [Aomori-ken Kyoiku IinkaiJ.
1999 The Hatanai Site, Vol. V [Hatanai Iseki, V]. Aomori: Board of Education of Aomori
Prefecture [Aomori-ken Kyoiku Iinkai].
2000 The Hatanai Site, Vol. VI [Hatanai Iseki, VI]. Aomori: Board of Education of Aomori
Prefecture [Aomori-ken Kyoiku Iinkai].
ARNOLD, Dean
1992 Commentary on Section II. In Hector Neff (ed.), Chemical Characterization of Ceramic
Pastes in Archaeology. Monographs in World Archaeology, No. 7. Madison: Prehistory
Press. pp. 159-166.
ARNOLD, D. F., H. NEFF, and M. D. GLASC0CK
2000 Testing assumptions of neutron activation analysis: communities, workshops and paste
preparation in Yucatan, Mexico. Archaeometry 42: 301-316.
ARNOLD, Dean, Hector NEFF, and Ron BISHOP
1991 Compositional analysis and ‘sources’ of pottery: an ethnoarchaeological approach. American
Anthropologist 93: 70-90.
BAxTER, Mike
1994a Exploratory Multivariate Analysis in Archaeology. Edinburgh: Edinburgh University Press.
1 994b Stepwise discriminant analysis in archaeometry: a critique. Journal ofArchaeotogical Science

Pottery Production and Circulation at the Sannai Maruyama Site, Northern Japan 217
21: 659-666.
Bisuop, Ronald, Robert L. RANDS, and George HOLLEY
1982 Ceramic compositional analysis on archaeological perspective. In M. Schiffer (ed.), Advances
in Archaeological Method and Theory, Vol. 5. Tucson: University of Arizona Press. pp. 275-
330.
BIsHOP, Ron, Velatta CAN0uTs, Patricia CRowN, and Suzanne Da ATLEY
1990 Sensitivity, precision, and accuracy: their roles in ceramic compositional data bases.
American Antiquity 55: 537-546.
CLARK, Caven P., Hector NEFF, and Michael GLAscocK
1992 Neutron activation analysis of Late Woodland ceramics from the Lake Superior Basin. In H.
Neff (ed.), Chemical Characterization of Ceramic Pastes in Archaeology. Monographs in
World Archaeology No. 7. Madison: Prehistory Press. pp. 255-268.
C0sTIN, Cathy
1991 Craft specialization: issues in defining, documenting, and explaining the organization of
production. In M. Schiffer ted.), Archaeological Method and Theory, Vol. 3. Tucson:
University of Arizona Press. pp. 1-56.
GovmtDARMu, K.
1994 1994 compilation of working values and sample description for 383 geostandards.
Geostandards Newsletter 18: 1-158.
HABu, Junko
1 989(ed.) Report of the No. 7 Science Building Area Excavation at the Hongo Campus of the
University of Tokyo [Tokyo Daigaku Hongo Konai no Iseki, Rigakubu 7 go kan ChitenJ.
Tokyo: University of Tokyo. (In Japanese with English summary)
2002 A life-history of the Sannai Marnyama site: changes in site function, residential mobility and
cultural landscape. In Shiro Sasaki (ed), New Perspectives on the Study ofPrehistoric
Httnter-Gatherer Cultures. Senri Ethnological Reports 30. Osaka: National Museum of
Ethnology. pp. 161-183. (In Japanese)
n.d. Ancient Jomon ofJapan. Cambridge: Cambridge University Press. (In press)
HABu, Junko and Clare FAwcETT
1999 Jomon archaeology and the representation of Japanese origins. Antiquity 73: 587-593.
HABu, Junko and Mark E. HALL
1999 Jomon pottery production in central Japan. Asian Perspectives 38(1): 90-110.
2001 Jomon pottery production at Honmura-cho and Isarago sites, Insights from geochemistry.
Anthropological Science 109(2): 141-166.
HABu, Junko, Minkoo KIM, Mio KATAYAMA, and Hajime K0MIYA
2001 Jomon subsistence-settlement systems at the Sannai Maruyama site. Bulletin of the Indo
Pact/Ic Prehistoty Association 21: 9-21.
HAMPEL, Joachim
1984 Technical considerations in X-ray fluorescence analysis of obsidians. In R. E. Hughes (ed.),
Obsidian Studies in the Great Basin. Contributions of the University of California
Archaeological Research Facility, No. 45. Berkeley: Archaeological Research Facility,
University of California. pp. 2 1-25.

218 J. Habu, M.E. Hall and M. Ogasawara
HARB0TTLE, Garman and Ronald BISHOP
1992 Commentary on technique. In H. Neff (ed.), Chemical Characterization of Ceramic Pastes
in Archaeology. Monographs in World Archaeology No. 7. Madison: Prehistory Press. pp.
27-29.
HEDGEs, R. E. M. and M. McLELLAN
1976 On the cation exchange capacity of fired clays and its effect on the chemical and radiametric
analysis of pottery. Archaeometiy 18(2): 203-207.
IMAMURA, M., M. SAKAMOT0, I. SAIT0, and M. NISHITANI
199$ Provenance study of ancient earthenwares based on Be isotopes. Paper presented at the 9th
International Congress of Geochemistry, Beijing.
ISHIKAWA, Ryuji
198$ Fabric analyses of pottery recovered from the No. 57 site [No. 57 iseki shutsudo doki no
taido bunseki. Tama New Town No. 57 iseldJ. In Tokyo Board of Education (ed.), The Tama
New Town No. 57 Site [Tama New Town No. 57 IsekiJ. Tokyo: Tokyo Board of Education.
(In Japanese)
IsHIKAwA, Ryuji
1989 Approaches to understanding pottery groups of different ceramic traditions [Ikeito doki-gun
rikai e no approach]. Shelimounds [Kaizuka] 42: 1-12. (In Japanese)
JAPANESE GEoLoGIcAL SURVEY
1982 Geological Atlas ofJapan. Tokyo: Japanese Geological Survey.
JONES, Richard E.
1986 Greek and Cypriot Pottery: A Review ofScientific Studies. Athens: The British School at
Athens.
KIDDER, J. Edward Jr.
199$ The Sannai Maruyama site: new views on the Jomon period. Southeast Review ofAsian
Studies 20: 29-52.
KILIKOGLOU, V., Y. MANIATIs and A. P. GRIMANI5
1988 The effect of purification and firing of clays on trace element provenance studies.
Archaeometiy 30:37-46.
KING, R. H., D. W. Rupp, and L. W. SoRENSON
1986 A multivariate analysis of pottery from southwestern Cyprus using neutron activation analysis
data. Journal ofArchaeological Science 13: 36 1-374.
Kojo, Yasushi
1981 Inter site pottery movements in the Jomon Period. Journal of the Anthropological Society of
Ntpon 89: 27-54.
LUCAS-TOOTH, H. J. and B. J. PRICE
1961 A mathematical method for the investigation of inter-element effects in X-ray fluorescent
analyses. Metallurgia 64(383): 149-152.
MITsUJI, Toshikazu and Akio IN0UE
1984 Fabric analyses of clays and Jomon pottery [Nendo oyobi Jomon doki no taido]. In The
Excavation Team of the Ohashi 2-chome Site [Meguro-ku Ohashi 2-chome Iseki ChosakaiJ
(ed.), The Ohashi Site, Meguro Ward, Tokyo [Tokyo-to Meguro-ku Ohashi Iseki] . Tokyo:
Meguro Ward. pp. 93-107. (In Japanese)

Pottery Production and Circulation at the Sannai Maruyama Site, Northern Japan 219
M0MMsEN, H., A. KREUSER, and J. WEBER
1988 A method for grouping pottery by chemical composition. Archaeometiy 30: 47-57.NIN0MIYA, Shuji, Minoni WARAsHINA, Junko HABu, and Masumi OsAwA
1990 Chemical analyses of Jomon pottey excavated from the Isarago sheilmidden site, with
special references to Moroiso Style pottery [Isarago Kaizuka Iseki shutsudo Jomon doki
bunseki-kagakuteki kenkyu: Moroiso shiki doki o chushin ni]. Paper presented at the 7th
Annual Meeting of the Japanese Society on Cultural Property, Tokyo. (In Japanese)
NoRuIs, Marija
1993 SPSSfor Windows: Advanced Statistics, Release 6.0. Chicago: SPSS.
OK&DA, Yasuhiro
1995 Into doki bunka no kyodai shuraku [A large settlement from the Ento Pottery Culture: the
Sannai Mamyama site in Aomori Prefecture]. Kikan Kokogaku [Archaeology Quarterly] 50:
25-30. (In Japanese)
PEIsAci-i, M., L. JAcoBsoN, G. J. B0uLLE, D. G;HwALA, and L. G. UNDEIuiILL
1982 Multivariate analysis of trace elements determined in archaeological materials and its usefor characterisation. Journal ofRadioanalytical Chemistry 69: 349-3 64.
POLLARD, A. Mark
1986 Data analysis. In R. E. Jones (ed.), Greek and Cypriot Pottery: A Review ofScientJic Studies.Athens: The British School at Athens. pp. 15-96.
POLLARD, A. Mark and Carl HERON
1996 The geochemistry of clays and the provenance of ceramics. In Archaeological Chemistry.Royal Society of chemistry, Cambridge. pp. 104-147.
POTTs, Philip J.
1987 A Handbook ofSilicate Rock Analysis. New York: Chapman and Hall.SHAcKLEY, M. Steven
1995 Sources of archaeological obsidian in the Greater American Southwest: an update andquantitative analysis. American Antiquity 60: 531-553.
1998 Gamma-rays, X-rays, and stone tools: some recent advances in archaeological geochemistry.
Journal ofArchaeological Science 25: 259-270.
SHARMA, Subhash
1996 Applied Multivariate Techniques. New York: John Wiley and Sons, Inc.
SuMMERHAYEs, Glenn
1997 Losing your temper: the effect of mineral inclusions on pottery analyses. Archaeology in
Oceania 32: 108-117.
STEP0NAITIs, Vincas, M. James BLACKMAN, and Hector NEFF
1996 Large-scale patterns in the chemical composition of Mississippian pottery. Antiquity 61: 555-572.
Tsun, Seiichiro
1999 Chronology at the Sannai Mamyama site using a high precision ‘4C dating method [Koseido4C nendai sokutei niyom Sannai Maruyama iseki no hennen]. Chikyu Special Issue 26: 32-
38. (In Japanese)
Tuna, A. A., J. PAJUCER, and G. Nictaass
1980 The analysis of Romano-British pottery by atomic absorption spectrophotometry.
I

220 J. Habu, ME. Hall and M. Ogasawara
Archaeometiy 22(2): 153-171.
UMEHAP Takeshi and Yosmisioii Yasuda teds.)
1995 Discovery ofthe Jomon Civilization: New Discoveries at the Sannai Maruyama Site [Jomon
bunka no Hakken: Kyoi no Sannai Maruyama IsekiJ. Tokyo: PHP Kenlcyujo. (In Japanese)
VITALI, Vanda and Ursula M. FRANKLIN
1986 New approaches to the characterization and classification of ceramics on the basis of their
elemental composition. Journal ofArchaeological Science 13: 161-170.
VITALI, Vanda, J. W. SIMMoNs, Elizabeth HENRICKS0N, L. D. LEwNE, and Ronald G. HANCOCK
1987 A hierarchical taxonomic procedure for provenance determination: a case study of
Chalcolithic ceramics from the Central Zagros. Journal ofArchaeological Science 14: 423-
435.
WILSoN, A. L
1978 Elemental analysis of pottery in the study of its provenance: a review. Journal ofArchaeo
logical Science 5: 219-236.
ZEDEIo, Maria Nieves
1994 Sourcing Prehistoric Ceramics at Chodistaas Pueblo, Arizona. Anthropological Papers of
the University of Arizona, No. 58. Tucson: University of Arizona Press.