Potentiometric, Thermodynamics and DFT Calculations of ...
23
Int. J. Electrochem. Sci., 15 (2020) 3891 – 3913, doi: 10.20964/2020.05.29 International Journal of ELECTROCHEMICAL SCIENCE www.electrochemsci.org Potentiometric, Thermodynamics and DFT Calculations of Some Metal(II)-Schiff Base Complexes Formed in Solution. Kareem A. Asla 1 , Abeer T. Abdelkarimm 2 , Gaber M. Abu El-Reash 3 , Ahmed A. El-Sherif 2,* 1 Department of Chemistry, Faculty of Science, Zagazig University, Zagazig, Egypt. 2 Department of Chemistry, Faculty of Science, Cairo University, Cairo, Egypt. 3 Department of Chemistry, Faculty of Science, Mansoura University, Mansoura, Egypt. * E-mail: [email protected] Received: 7 November 2019 / Accepted: 1 February 2020 / Published: 10 April 2020 Formation constants of the complexes formed in solution from reaction between a ligand named [(3E,3'E)-3,3'-(ethane-1,2-diylbis(azanylylidene))bis(N-(pyridin-2-yl)butanamide)] (EDAP) and chloride salts of Co 2+ , Ni 2+ , Cu 2+ and Zn 2+ were estimated in 50 % DMSO-water solution at different temperatures. The stability order for the complexes greatly agree with Irving-Williams stability order that is Zn 2+ > Cu 2+ > Ni 2+ > Co 2+ . The concentration distributions of the various complex species in solution were estimated as a function of pH using speciation computer program. The temperature effect as well as the thermodynamic parameters were also reported for the free EDAP ligand and M(II) Schiff base complexes. DFT method has been utilized to obtain geometrically optimized structures for the studied complexes. The theoretical calculations were in agreement with the calculated values of stability constants. Keywords: Schiff base; Protonation; DFT; Copper(II) complexes, Potentiometry. 1. INTRODUCTION Protonation constant is crucial physical and chemical parameter in the chemistry of drug, enzymes and spectrophotometric applications. In the field of drug design, there is a strong relationship between protonation constants and the properties of drug as solubility, lipophilicity, acidity, alkalinity, permeability and transport behavior. In the chemistry of enzymes, it gives good data about the stereochemistry of active site in the enzyme. Moreover, in spectrophotometry, it is a suitable tool to determine the concentration of each species and the suitable pH for the reaction [1-9]. Potentiometry is considered as a crucial method utilized in determination of protonation constants because of its wide applicability and reliability [10-12].
Transcript of Potentiometric, Thermodynamics and DFT Calculations of ...
Int. J. Electrochem. Sci., 15 (2020) 3891 – 3913, doi: 10.20964/2020.05.29
International Journal of
ELECTROCHEMICAL SCIENCE
www.electrochemsci.org
Potentiometric, Thermodynamics and DFT Calculations of
Some Metal(II)-Schiff Base Complexes Formed in Solution.
Kareem A. Asla1, Abeer T. Abdelkarimm2, Gaber M. Abu El-Reash3, Ahmed A. El-Sherif 2,*
1 Department of Chemistry, Faculty of Science, Zagazig University, Zagazig, Egypt. 2 Department of Chemistry, Faculty of Science, Cairo University, Cairo, Egypt. 3 Department of Chemistry, Faculty of Science, Mansoura University, Mansoura, Egypt. *E-mail: [email protected]
Received: 7 November 2019 / Accepted: 1 February 2020 / Published: 10 April 2020
Formation constants of the complexes formed in solution from reaction between a ligand named
[(3E,3'E)-3,3'-(ethane-1,2-diylbis(azanylylidene))bis(N-(pyridin-2-yl)butanamide)] (EDAP) and
chloride salts of Co2+, Ni2+, Cu2+ and Zn2+ were estimated in 50 % DMSO-water solution at different
temperatures. The stability order for the complexes greatly agree with Irving-Williams stability order
that is Zn2+ > Cu2+ > Ni2+ > Co2+. The concentration distributions of the various complex species in
solution were estimated as a function of pH using speciation computer program. The temperature effect
as well as the thermodynamic parameters were also reported for the free EDAP ligand and M(II) Schiff
base complexes. DFT method has been utilized to obtain geometrically optimized structures for the
studied complexes. The theoretical calculations were in agreement with the calculated values of stability
constants.
Keywords: Schiff base; Protonation; DFT; Copper(II) complexes, Potentiometry.
1. INTRODUCTION
Protonation constant is crucial physical and chemical parameter in the chemistry of drug,
enzymes and spectrophotometric applications. In the field of drug design, there is a strong relationship
between protonation constants and the properties of drug as solubility, lipophilicity, acidity, alkalinity,
permeability and transport behavior. In the chemistry of enzymes, it gives good data about the
stereochemistry of active site in the enzyme. Moreover, in spectrophotometry, it is a suitable tool to
determine the concentration of each species and the suitable pH for the reaction [1-9]. Potentiometry is
considered as a crucial method utilized in determination of protonation constants because of its wide
applicability and reliability [10-12].
Int. J. Electrochem. Sci., Vol. 15, 2020
3892
The formation of chelate molecule is important from theoretical, analytical and synthetic point
of view. The chelate formation requires certain favorable structural features. Schiff bases and their
complexes intensively investigated due to their versatile medical applications including remarkably
antituberculosis [13], antibacterial [14,15], antitumor [16,17], antifungal [15,18], antimalarial [19] and
anti-inflammatory [20,21]. The coordination properties of Schiff base ligands and the possible various
biological activities of their metal complexes recently paid great attention from researchers however,
limited research has been done for protonation and complex formation equilibria of Schiff bases and
their metal complexes.
However, to understand the activities of the Schiff bases and their complexes, it is important to
have a complete picture about the thermodynamics and solution equilibria involved in the reactions. The
stability constant gives an idea about the extent of bonding between the bonding atoms in a ligand and
metal ion. Also, the concentration of a complex in solution can be predicted on the basis of the stability
constants. Thus, keeping the above facts in mind and in continuation of our research program [22-32]
directed to study ligands of biological significance and their complexes, we have synthesized a Schiff
base; (3E,3'E)-3,3'-(ethane-1,2-diylbis(azanylylidene))bis(N-(pyridin-2-yl)butanamide), EDAP
(Scheme 1) and carried out a systematic study on its interactions with some bivalent transition metals at
ionic strength 0.1 MNaNO3 at temperatures 20, 25, 30 and 35 °C in DMSO-water media using
potentiometric technique. In the present work, the protonation constants of (EDAP) Schiff base ligand,
the temperature effects, thermodynamics, the formation constants and the computational studies of metal
complexes were reported.
2. EXPERIMENTAL
2.1. Chemicals and reagents
The chemical reagents such as HNO3, NaOH and NaNO3 were purchased from BDH and used
without ultra-purification. Hydrated CuCl2 (≥ 99.99 %), CoCl2 (98 %) and NiCl2 (99.9 %) as well as
anhydrous ZnCl2 (≥ 99 %) salts were purchased from Sigma-Aldrich Chemicals Company.
Ethylenediamine (98%), 2-aminopyridine (98%), ethylacetoacetate, xylene and DMSO were provided
by Aldrich Chemicals Company.
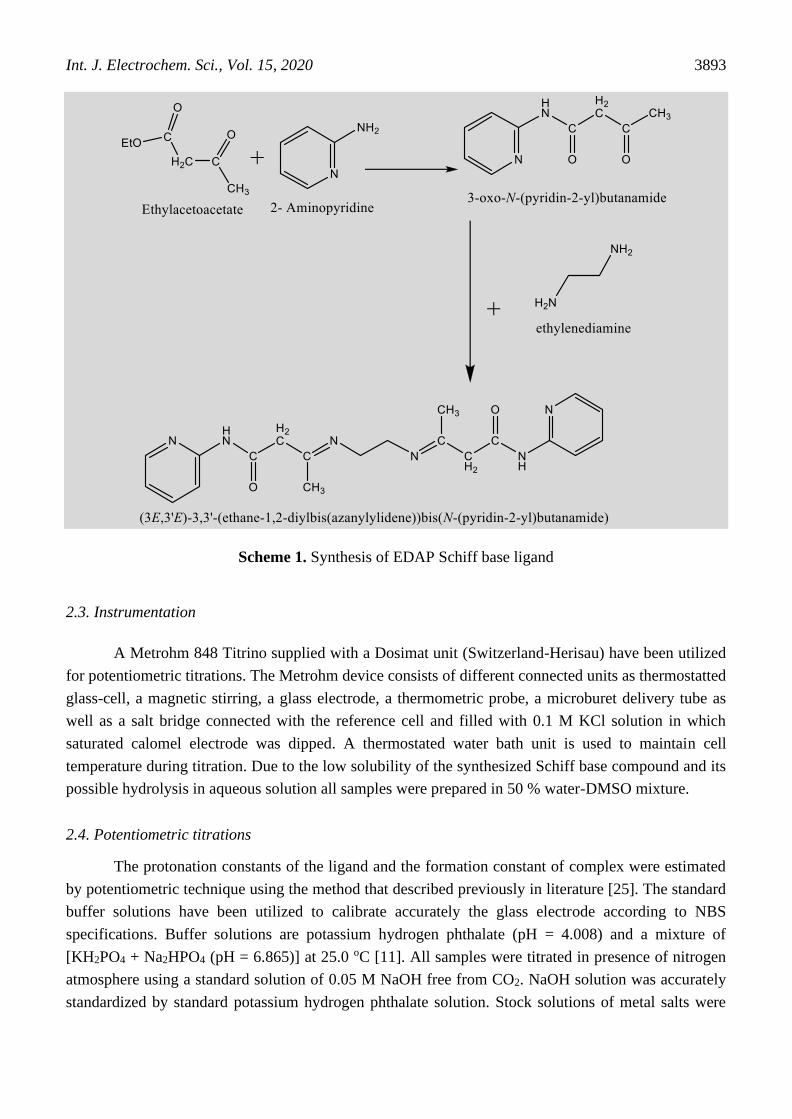
2.2. Synthesis of (EDAP) ligand
The (EDAP) ligand [(3E,3'E)-3,3'-(ethane-1,2-diylbis(azanylylidene))bis(N-(pyridin-2-
yl)butanamide)] was prepared as described previously [33] (Scheme 1).
Int. J. Electrochem. Sci., Vol. 15, 2020
3893
Scheme 1. Synthesis of EDAP Schiff base ligand
2.3. Instrumentation
A Metrohm 848 Titrino supplied with a Dosimat unit (Switzerland-Herisau) have been utilized
for potentiometric titrations. The Metrohm device consists of different connected units as thermostatted
glass-cell, a magnetic stirring, a glass electrode, a thermometric probe, a microburet delivery tube as
well as a salt bridge connected with the reference cell and filled with 0.1 M KCl solution in which
saturated calomel electrode was dipped. A thermostated water bath unit is used to maintain cell
temperature during titration. Due to the low solubility of the synthesized Schiff base compound and its
possible hydrolysis in aqueous solution all samples were prepared in 50 % water-DMSO mixture.
2.4. Potentiometric titrations
The protonation constants of the ligand and the formation constant of complex were estimated
by potentiometric technique using the method that described previously in literature [25]. The standard
buffer solutions have been utilized to calibrate accurately the glass electrode according to NBS
specifications. Buffer solutions are potassium hydrogen phthalate (pH = 4.008) and a mixture of
[KH2PO4 + Na2HPO4 (pH = 6.865)] at 25.0 oC [11]. All samples were titrated in presence of nitrogen
atmosphere using a standard solution of 0.05 M NaOH free from CO2. NaOH solution was accurately
standardized by standard potassium hydrogen phthalate solution. Stock solutions of metal salts were

Int. J. Electrochem. Sci., Vol. 15, 2020
3894
prepared and standardized by EDTA solution [34]. The sample solution prepared by mixing equal
volumes of DMSO and water to avoid hydrolysis of ligand during titration. Moreover, the ionic strength
was kept constant during titration using NaNO3 as supporting electrolyte.
As known, the calculated formation constants using potentiometric method have been carried out
using concentration of hydrogen ion expressed in molarity. However, the concentration in pH-meter
have been expressed in activity coefficient -log aH+ (pH). Therefore, Van Uitert and Hass equation (Eq.
1). This equation was used to convert the pH-meter readings (B) to [H+] [35, 36].
−log10 [H+] = B +log10 UH (1)
Where log10 UH is the correction factor for the solvent composition and ionic strength for which
B is read. pKw Values for titrated samples were estimated as described previously [37]. All precautions
and procedures follow the literature conditions [38- 40].
The protonation constants of the (EDAP) ligand were estimated potentiometrically by titrating
(40 cm3) of (1.25x10⁻³ M) ligand solution with standard sodium hydroxide solution. The formation
constants of the metal (II) complexes were estimated by titration (40 cm3) of [MCl2.nH2O (1.25x10⁻³ M)
+ (EDAP) (1.25x10⁻³ M /2.5x10-3 M).
The equilibrium constants which were calculated from the titration data according to the
following equations (2) and (3).
p(M, metal ion) + q(L, Ligand) + r(H, proton) [Mp(L)q(H) r] (2)
rqp
rqp
pqrHLM
HLM
][][][
])()([= (3)
2.5. Data Processing
The MINIQUAD-75 computer program has been used to calculate ca. 100 reading for each
titration [41]. The SPECIES program [42] has been utilized to give the species distribution diagrams for
the studied samples.
2.6. Computational studies
DFT calculations were performed using DMOL3 program [43-45] in Materials Studio package
[46]. DFT semi-core pseudopods calculations (dspp) were done with the double numerica basis sets as
well as polarization functional (DNP) [47]. The RPBE functional is based on the generalized gradient
approximation (GGA) as best correlation functional [48, 49].
3. RESULTS AND DISCUSSION
3.1. Protonation constants of EDAP Schiff base ligand
The proton dissociation constants (log KH) of the ligand have been used for the calculation the
formation constant of the Schiff base complexes. Moreover, the Schiff base ligand shows high flexibility
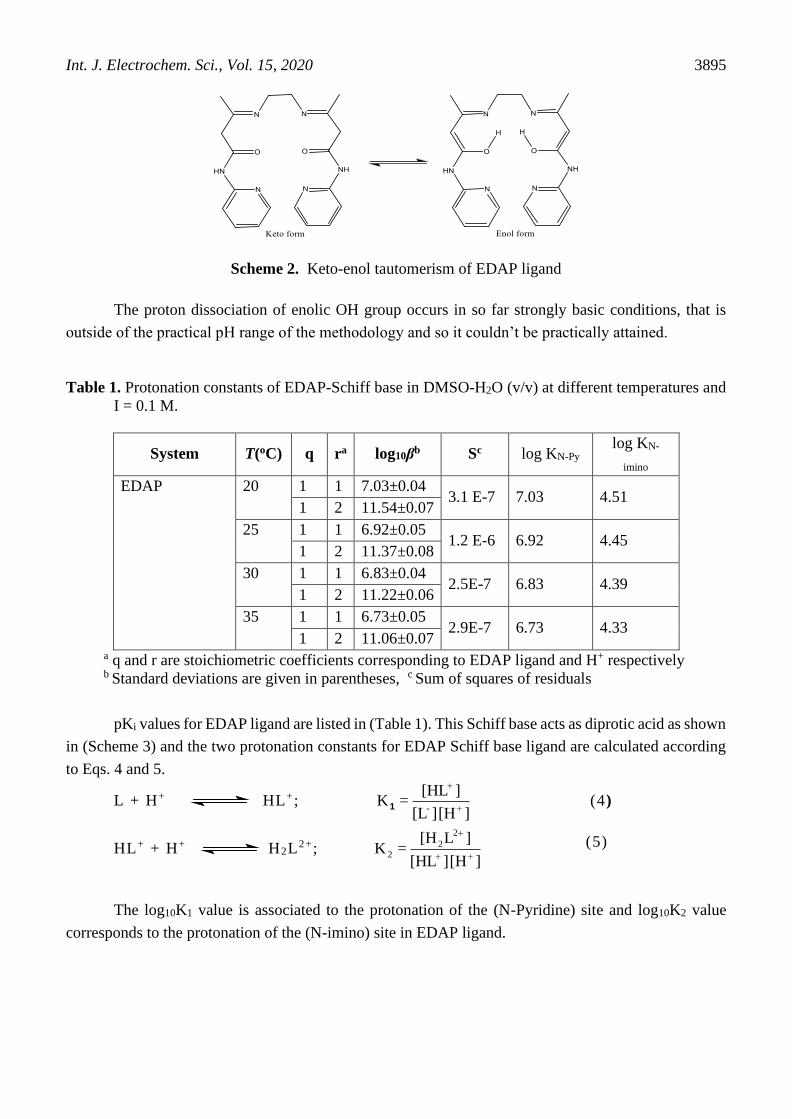
to coordinate to the metal ion in the two tautomer keto-enol forms (Scheme 2).
Int. J. Electrochem. Sci., Vol. 15, 2020
3895
Scheme 2. Keto-enol tautomerism of EDAP ligand
The proton dissociation of enolic OH group occurs in so far strongly basic conditions, that is
outside of the practical pH range of the methodology and so it couldn’t be practically attained.
Table 1. Protonation constants of EDAP-Schiff base in DMSO-H2O (v/v) at different temperatures and
I = 0.1 M.
System T(oC) q ra log10βb Sc log KN-Py log KN-
imino
EDAP 20 1 1 7.03±0.04 3.1 E-7 7.03 4.51
1 2 11.54±0.07
25 1 1 6.92±0.05 1.2 E-6 6.92 4.45
1 2 11.37±0.08
30 1 1 6.83±0.04 2.5E-7 6.83 4.39
1 2 11.22±0.06
35 1 1 6.73±0.05 2.9E-7 6.73 4.33
1 2 11.06±0.07 a q and r are stoichiometric coefficients corresponding to EDAP ligand and H+ respectively b Standard deviations are given in parentheses, c Sum of squares of residuals
pKi values for EDAP ligand are listed in (Table 1). This Schiff base acts as diprotic acid as shown
in (Scheme 3) and the two protonation constants for EDAP Schiff base ligand are calculated according
to Eqs. 4 and 5.
L + H+
HL+;
][H ][L
][HL =K
- +
+
1 (4)
HL+ + H+ H2L2 +; ][H ][HL
]L[H = K
2
22 ++
+
(5)
The log10K1 value is associated to the protonation of the (N-Pyridine) site and log10K2 value
corresponds to the protonation of the (N-imino) site in EDAP ligand.

Int. J. Electrochem. Sci., Vol. 15, 2020
3896
Scheme 3. Protonation equilibria of EDAP ligand
The study of protonation equilibria for the Schiff base ligand under study cannot be performed
in aqueous solution because it is insoluble in water. DMSO solvent has been widely used for
potentiometric studies of both protonation and formation equilibria. The mixture DMSO-water 50 %:50
% was best chosen solvent to give soluble and stable Schiff base solution. The use of these mixed
solvents has some advantages over pure DMSO that are:- (i) pure DMSO is very hygroscopic and
controlling its water content is difficult [50] which in turn would extensively affect reproducibility of
our experiment. (ii) However, a mixture of 50%:50% DMSO-water has only small hygroscopic nature.
(iii) A further advantage of this type of mixed solvents is its compatibility with the standard glass
electrode, so that the pH measurements may be performed in a similar way to that employed in a purely
aqueous solution. In contrast, the use of pure DMSO is not favourable to potentiometry. (iv) Another
advantage of the DMSO-water mixture is its large acidity range (pKw = 15.52±0.1) [38,51] which allows
studying the deprotonation equilibria of weak acids which could be hardly studied in pure water [50,
52].

Int. J. Electrochem. Sci., Vol. 15, 2020
3897
2 4 6 8 10 12
0
20
40
60
80
100%
Sp
eci
es
pH
LH2
LHL
Figure 1. Concentration distribution diagram of various species as a function of pH in the EDAP system
(EDAP = 1.25 M, T = 25 oC, I = 0.1 M).
Herein, two protonation constants were calculated for EDAP ligand and the SPECIES program
was utilized to give the distribution of EDAP ligand species as a function of pH (Fig.1). The species
distribution graph is a good tool for obtaining complete picture about the concentration of each species
present as a function of pH. It enables us to obtain the best conditions for preparation a solid complex as
pH, concentration and ligand:metal ratio. At low pH, (EDAP) exists initially in a fully protonated form
with maximum percent of 100% as H2L below pH < 2. On addition of base, pH value increases so the
(H2L2+) species loses its first proton from an imino group to form (HL+), which is the predominant
species at pH = 5.6. As conditions become more alkaline, the second proton released from protonated
pyridine ring begins deprotonation to the free ligand (L) reaching a maximum percent of 99.8 % at pH
= 9.6. The log KN-imino values ranges from (4.45-4.51) is similar to that found in literature for the imino
group (4.40) [53-55]. In addition, the log KN-pyridine values ranges from (6.72-7.03) is similar to that found
in literature for the pyridine moiety (6.37-7.10) [56-59].
3.2. Stability constants of the Schiff base complexes
The formation constants of M(II)-Schiff base complexes in DMSO-water mixture were
computed using the Miniquad-75 program. It was found that the pH titration curves of all complexes
were situated at lower than that of the free Schiff base ligand curve as they required more alkali to have
the same pH as the free Schiff base. The protons of the protonated complexes can be easily replaced by

Int. J. Electrochem. Sci., Vol. 15, 2020
3898
metal ion and this enhances formation of complex. The potentiometric titration curve of Cu(II)-Schiff
base complex as a representative example was given in (Fig. 2).
Figure 2. Potentiometric titration curve of the Cu-EDAP system (Cu-EDAP = 1.25 M, T = 25 oC, I =
0.1 M).
The stoichiometric stability constants of M(II)-complexes of the investigated Schiff base ligand
at different temperatures are listed in (Table 2). The data recorded in (Table 2) demonstrate the formation
of the metal complexes with stoichiometric coefficients 110 and 111.
The pKa values of the protonated complex has been computed using Eq. 6 [60,61].
pKa = log β111 - log β110 (6)
The obtained pKa value for the Schiff base ligand is in accord with of pyridine ring (6.92). As
mentioned above, the lower value (5.61) for the Cu-complex than the free ligand (6.92) owe to
acidification upon complexation. For example, the pKa value Cu(II) complex diminishes to 5.61 by 1.31
pH difference from 6.92 of free ligand.
0
1
2
3
4
5
6
7
8
9
10
0 1 2 3 4 5 6 7
Volume of NaOH added
pH
EDAP
Cu-EDAP

Int. J. Electrochem. Sci., Vol. 15, 2020
3899
Table 2. Stability constants of M(II)-EDAP-Schiff base in DMSO-water at different temperatures and I
= 0.1 M.
System T (oC) p q r log10β S
Cu-EDAP 20 1 1 0 6.27±0.04 7.2E-7
1 1 1 11.96±0.06
25 1 1 0 6.19±0.05 5.6E-7
1 1 1 11.79±0.06
30 1 1 0 6.10±0.04 1.1E-7
1 1 1 11.62±0.08
35 1 1 0 6.01±0.04 6.4E-7
1 1 1 11.46±0.08
Ni-EDAP 20 1 1 0 5.83±0.06 5.5E-7
1 1 1 11.12±0.09
25 1 1 0 5.75±0.05 7.4E-7
1 1 1 10.97±0.07
30 1 1 0 5.67±0.04 1.6E-7
1 1 1 10.81±0.08
35 1 1 0 5.59±0.04 6.2E-7
1 1 1 10.66±0.08
Co-EDAP 20 1 1 0 5.66±0.04 3.1E-7
1 1 1 10.9±0.06
25 1 1 0 5.61±0.03 4.9E-7
1 1 1 10.8±0.07
30 1 1 0 5.55±0.05 2.5E-7
1 1 1 10.69±0.06
35 1 1 0 5.49±0.05 3.9E-7
1 1 1 10.57±0.06
Zn-EDAP 20 1 1 0 4.7±0.04 5.1E-7
1 1 1 10.85±0.08
25 1 1 0 4.66±0.06 2.9E-7
1 1 1 10.78±0.09
30 1 1 0 4.60±0.05 8.2E-7
1 1 1 10.65±0.08
35 1 1 0 4.55±0.05 4.5E-7
1 1 1 10.56±0.08 Definitions of stability constants:
K110 = KML= [ML] / [M][L];
K111 = KMHL= [MHL] / [ML][H]
(L = Schiff base ligand); (Charges are omitted for simplicity). a p, q and r are stoichiometric coefficients corresponding to metal(II), EDAP ligand and H+ respectively b Standard deviations are given in parentheses c Sum of squares of residuals

Int. J. Electrochem. Sci., Vol. 15, 2020
3900
2 4 6 8 10 12
0
20
40
60
80
100
% S
peci
es
pH
100
111
110
Figure 3. Concentration distribution diagram of various species as a function of pH in the Cu-EDAP
system (EDAP = 1.25 M, T = 25 oC, I = 0.1 M).
According to the species distribution diagram for Cu-EDAP system (Fig. 3), Copper(II) ions
coordinate easily with EDAP molecules forming two different pH species, the deprotonated (Cu-EDAP)
and protonated (Cu-HEDAP) species. The later species is formed with 80% at pH = 4.4 while as the
former deprotonated species reach to 97% at pH = 7.8.
3.3. The relationship between the properties of central metal ion and stability of complexes
Preferential binding of a ligand to one metal instead of another metal is somewhat depends on
the relationship between the stability constants of metal complexes and the properties of the metal ions,
such as the atomic number, ionic radius, ionization potential as well as electronegativity [62]. In this
study, the stability constants of the Schiff base complexes agree with Irving-Williams’ order [51,63]
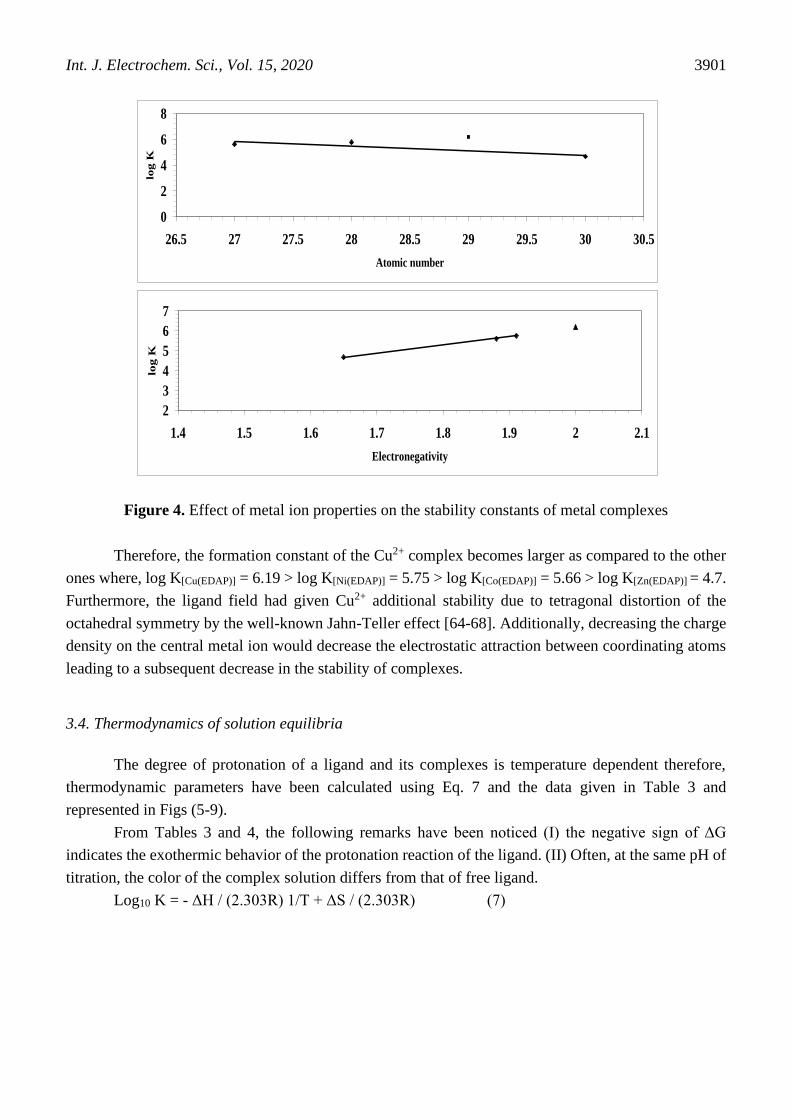
where, Zn2+ < Co2+ < Ni2+ < Cu2+. Moreover, there was nearly linear relation between the reciprocal of
ionic radii (1/r) as well as electronegativity of the studied metals and log10KML (Fig. 4). The increase in
the electronegativity of metal ions will reduce the electronegativity difference between the bonding
atoms in a complex and this enhances the covalent character and consequently the stability of complexes
increases.
Int. J. Electrochem. Sci., Vol. 15, 2020
3901
Figure 4. Effect of metal ion properties on the stability constants of metal complexes
Therefore, the formation constant of the Cu2+ complex becomes larger as compared to the other
ones where, log K[Cu(EDAP)] = 6.19 > log K[Ni(EDAP)] = 5.75 > log K[Co(EDAP)] = 5.66 > log K[Zn(EDAP)] = 4.7.
Furthermore, the ligand field had given Cu2+ additional stability due to tetragonal distortion of the
octahedral symmetry by the well-known Jahn-Teller effect [64-68]. Additionally, decreasing the charge
density on the central metal ion would decrease the electrostatic attraction between coordinating atoms
leading to a subsequent decrease in the stability of complexes.
3.4. Thermodynamics of solution equilibria
The degree of protonation of a ligand and its complexes is temperature dependent therefore,
thermodynamic parameters have been calculated using Eq. 7 and the data given in Table 3 and
represented in Figs (5-9).
From Tables 3 and 4, the following remarks have been noticed (I) the negative sign of ΔG
indicates the exothermic behavior of the protonation reaction of the ligand. (II) Often, at the same pH of
titration, the color of the complex solution differs from that of free ligand.
Log10 K = - ΔH / (2.303R) 1/T + ΔS / (2.303R) (7)
0
2
4
6
8
26.5 27 27.5 28 28.5 29 29.5 30 30.5
Atomic number
log K
2
3
4
5
6
7
1.4 1.5 1.6 1.7 1.8 1.9 2 2.1
Electronegativity
log
K

Int. J. Electrochem. Sci., Vol. 15, 2020
3902
Table 3. Stepwise stability constants for ML and MHL complexes of EDAP-Schiff base ligand in
DMSO-water mixtures and I = 0.1 M at different temperatures.
Mn+ 20 oC 25 oC 30 oC 35 oC
logK1 logK2 logK1 logK1 logK1 logK2 logK1 logK2
Zn2+ 4.71 6.15 4.66 6.12 4.60 6.05 4.55 6.01
Co2+ 5.66 5.24 5.61 5.19 5.55 5.14 5.49 5.08
Ni2+ 5.83 5.29 5.75 5.22 5.69 5.14 5.58 5.07
Cu2+ 6.27 5.69 6.19 5.60 6.10 5.52 6.01 5.45
logK1= log K110 = log [ML] / [M][L]; logK2= log K111 = log [MHL] / [ML][H]
Table 4. Thermodynamics for the association of EDAP Schiff base ligand in 50% DMSO-50%
H2O(v/v).
System H
(kJmol-1)
S
(JK-1 mol-1)
G
(kJmol-1)
EDAP
L- + H+ LH -34.3 17.7 -39.5
HL + H+ H2L+ -20.8 15.6 -25.4
0.00330 0.00333 0.00336 0.00339 0.00342 0.00345 0.00348
3.0
3.5
4.0
4.5
5.0
5.5
6.0
6.5
7.0
7.5
8.0
LogK1
LogK2
Log K
1/ T
y = 1764.8x + 0.9046
R2 = 0.999
y = 1089.6x + 0.7312
R2 = 0.998
Figure 5. Effect of temperature on the protonation constants (log K1 and log K2) of EDAP Schiff base
ligand (EDAP = 1.25 M, T = 25 oC, I = 0.1 M)..
.

Int. J. Electrochem. Sci., Vol. 15, 2020
3903
0.00330 0.00333 0.00336 0.00339 0.00342 0.00345 0.00348
5.4
5.6
5.8
6.0
6.2
6.4
LogK1
LogK2L
og
K
1/ T
y = 1574.3x + 0.8163
R2 = 0.998
y = 1400.8x + 0.8236
R2 = 0.997
Figure 6. Effect of temperature on the formation constants of Cu(II)-EDAP complexes (Cu-EDAP =
1.25 M, T = 25 oC, I = 0.1 M).
0.00330 0.00333 0.00336 0.00339 0.00342 0.00345 0.00348
5.0
5.1
5.2
5.3
5.4
5.5
5.6
5.7
5.8
5.9
LogK1
LogK2
Log
K
1/ T
y = 1453x + 0.7893
R2 = 0.999
y = 1331.7x + 0.6723
R2 = 0.998
Figure 7. Effect of temperature on the formation constants of Ni(II)–EDAP complexes (Ni-EDAP =
1.25 M, T = 25 oC, I = 0.1 M).
.

Int. J. Electrochem. Sci., Vol. 15, 2020
3904
0.00330 0.00333 0.00336 0.00339 0.00342 0.00345 0.00348
5.0
5.1
5.2
5.3
5.4
5.5
5.6
5.7
LogK1
LogK2
Log K
1/ T
y = 985.7x + 2.2428
R2 = 0.998
y = 916.62x + 2.0615
R2 = 0.997
Figure 8. Effect of temperature on the formation constants of Co(II)–EDAP complexes (Co-EDAP =
1.25 M, T = 25 oC, I = 0.1 M).
.
0.00330 0.00333 0.00336 0.00339 0.00342 0.00345 0.00348
4.0
4.2
4.4
4.6
4.8
5.0
5.2
5.4
5.6
5.8
6.0
6.2
6.4
6.6
6.8
7.0
LogK1
LogK2
Log
K
1/ T
y = 846.95x + 3.2172
R2 = 0.977
y = 881.78x + 1.6443
R2 = 0.994
Figure 9. Effect of temperature on the formation constants of Zn(II)–EDAP complexes (Zn-EDAP =
1.25 M, T = 25 oC, I = 0.1 M).
.

Int. J. Electrochem. Sci., Vol. 15, 2020
3905
Figure 10. The molecular structure of Co-EDAP complex along with the atom numbering scheme.
The stability constants of the metal complexes have been computed at different temperatures and
the following remarks have been summarized as follow:
a) Values of formation constant decrease with rising of temperatures, suggesting that the
complex formation is exothermic process and this is also agree with the (-ve) values of (∆H).
b) As it is known, the divalent metal ions are surrounded by six water molecules in an
octahedral symmetry [68]. Therefore, the obtained values of entropy and enthalpy are probably the sum
of the contributions of both bond broken and bond formation reactions.
c) Inspection of the data reveals that M(II)-complexes (ML) as well as the protonated
complexes (MHL) are formed in 1:1 molar ratio while 1:2 complexes (ML2) were not observed. This
may owe to the steric effect of the second bulky ligand which prevents formation of the (1:2) complex
species.
d) At constant temperature, the stability order of the Schiff base complexes obeys the
stability order of the binary complexes as well as Irving–Williams order [69-71].
e) The spontaneous process of the complex formation reactions is demonstrated by the
negative sign of (∆G).
f) According to the data recorded in Table 5, the abnormal higher (+ve) values of ∆S for all
the metal complexes demonstrate that the reactions are entropically favorable and this is in agreement
with the principal suggesting that displacement of water molecules (bond breaking) by coordinated

Int. J. Electrochem. Sci., Vol. 15, 2020
3906
ligand [72-76] increase in the number of particles liberated in solution and hence the randomness of the
system as shown in Eq. 8.
[M(H2O)n]+2
(aq) + L-(aq) === ML+
(aq) + nH2O (8)
Table 5. Thermodynamic functions for ML and MHL complexes of EDAP Schiff base in DMSO-water
mixture and I = 0.1 M.
Mn+ T/K Gibbs energy/kJ.mol-1 Enthalpy/kJ.mol-1 Entropy/J.mol-1.K-1
G1 G2 H1 H2 S1 S2
Zn2+
293 -26.4 -34.5
-18.7 -16.9 26.4 59.9 298 -26.6 -34.9
303 -26.7 -35.1
308 -26.9 -35.5
Co2+
293 -31.2 -28.9
-19.7 -18.3 41.2 37.7 298 -31.5 -29.1
303 -31.7 -29.3
308 -31.9 -29.5
Ni2+
293 -32.7 -29.6
-27.7 -25.6 17.3 14.0 298 -32.8 -29.7
303 -32.9 -29.8
308 -33.0 -29.9
Cu2+
293 -35.2 -31.9
-30.1 -27.7 17.5 14.4 298 -35.3 -32.0
303 -35.4 -32.1
308 -35.5 -32.2
3.5. The relationship between the ionic strength and the protonation constants of Schiff base.
The ionic strength of the solution (I) is given by Eq. 9
I =1/2 Σ Zi2 Mi (9)
Where, Mi is the molar concentration of the ions and Zi is the charge of an ion. The relation
between ionic strength and the activity coefficients of the ions in solution is given by Eq. 10.
log γ± = -α Z+ |Z-| I1/2 (10)
Where γ± is the activity coefficient of cations and anions, α is the degree of dissociation, and
Z+|Z-| is the positive product of the cations and anions. At very low concentration the value of γ± ≈1 and
therefore the ions behave independently. At higher concentrations, the value of γ± ≠1 and the oppositely
charged ions attract each other [70].

Int. J. Electrochem. Sci., Vol. 15, 2020
3907
Figure 11. Plot of log10K versus I1/2 at 25 oC (EDAP = 1.25 M, I = 0.1, 0.2 and 0.3 M, r = 0.98-0.99).
So, the ionic strength of different solution affects the protonation behavior of ligand at constant
temperature. In this study, the protonation constants of the Schiff base ligand (EDAP) have been
estimated at different ionic strengths (I = 0.10, 0.20 and 0.30 M) using NaNO3 as supporting electrolyte
at 25 oC.
Table 7. Protonation constants of EDAP-Schiff base at 25 oC at different ionic strengths of NaNO3.
System logK± σa logK± σa logK± σa
I = 0.10 M I = 0.20 M I = 0.30 M
1) L + H+ HL+
6.98 ± 0.05 6.64 ± 0.07 6.14 ± 0.04
2) HL+ + H+ H2L2+
4.45 ± 0.08 4.22 ± 0.06 4.04 ± 0.03
aStandard deviation
The data reported in Table 7 shows that decreasing ionic strength of solution by dilution would
increase the protonation constant of the Schiff base ligand which in a good agreement with Debye-
Hückel equation [71]. For all systems, there is a linear relationship between the values of log10K and the
square root of (I) Fig. 11. The values of correlation coefficients for the calculated values ranges from
0.98-0.99.
3.6. Molecular computational calculation
Optimization of the metal(II) complexes was done to get the most stable structure formed in
solution. Computational parameters include the energies of gas phase, frontier molecular orbitals
(EHOMO, ELUMO), electronegativity (χ), energy band gap (∆E) which explains the probable charge transfer
3
3.5
4
4.5
5
5.5
6
6.5
7
7.5
0.25 0.3 0.35 0.4 0.45 0.5 0.55 0.6
pK
a
I1/2

Int. J. Electrochem. Sci., Vol. 15, 2020
3908
interaction within the molecule, global hardness (η), chemical potential (μ), global electrophilicity index
(ω) and global softness (S) [77-81] are listed in Table 6.
𝜒 (electronegativity) = −1
2 (𝐸𝐿𝑈𝑀𝑂 + 𝐸𝐻𝑂𝑀𝑂)
𝜇 (potential) = −𝜒 = 1
2 (𝐸𝐿𝑈𝑀𝑂 + 𝐸𝐻𝑂𝑀𝑂)
η (hardness) = 1
2 (𝐸𝐿𝑈𝑀𝑂 − 𝐸𝐻𝑂𝑀𝑂)
𝑆 (softness) = 1
2 η
𝜔 (electrophilicity) =𝜇2
2𝜂
To understand the mode of chelation and stability of these complexes in solution, DFT method
was used to give the most stable geometry of metal complexes and the energy parameters have been
calculated for all these complexes to correlate the experimental values with the theoretical parameters
obtained from computational calculations for all compounds.
The molecular structure along with atom numbering scheme of Co-EDAP complex as a
representative example are represented in Fig.10 (Table 1S). From the analysis of the data calculated for
the bond lengths and angles (Ǻ), one can conclude the following:
In most of the cases, the actual bond lengths and bond angles are relatively close to the optimal
values, and thus the proposed geometry of the complex is acceptable. The energies of both HOMO (π
donor) and LUMO (π acceptor) are main parameters in quantum chemical studies. Where, HOMO is the
orbital that acts as an electron donor, LUMO is the orbital that act as the electron acceptor and these
molecular orbitals are known as the frontier molecular orbitals (FMOs). The HOMO–LUMO band gap
is a good indication for the compound stability [82,83]. As HOMO–LUMO band gap increases the
stability of compound increases accordingly and the chemical reactivity decreases. The values of band
gap for the complexes have descending order as follow:
Cu-EDAP (∆E = 2.43) > Ni-EDAP (∆E = 0.51) > Co-EDAP (∆E = 0.29) > Zn-EDAP (∆E =
0.17). The significant higher value of Cu-EDAP complex (ΔE = 2.43) is agree with the obtained values
compared to that of other complexes.
The higher values of hardness (η) would attain a molecule higher stability according to the
principle of hardness [84]. The global hardness (η) has been calculated for the Metal complexes and was
found to follow this sequence; Cu-EDAP (η = 0.61) > Ni-EDAP (η = 0.13) > Co-EDAP (η = 0. 07) >
Zn-EDAP (η = 0.04) which also supports the experimental results.

Int. J. Electrochem. Sci., Vol. 15, 2020
3909
Table. 6. Some quantum chemical parameters of the M(II)-EDAP complexes.
Compound -EH
(ev)
-EL
(ev)
∆E
(ev)
X
(ev)
µ
(ev)
η
(ev)
S
(ev)-1
ω
(ev)
Ϭ
(ev)-1
Cu-EDAP 4.39 1.96 2.43 3.17 -3.17 0.61 0.30 8.29 1.65
Ni-EDAP 2.43 1.92 0.51 2.17 -2.17 0.13 0.06 18.45 7.83
Co-EDAP 1.82 1.53 0.29 1.68 -1.68 0.07 0.03 19.55 13.89
Zn-EDAP 1.89 1.71 0.17 1.80 -1.80 0.04 0.02 37.32 22.99
5. CONCLUSIONS
Complex formation constant of some bivalent metal ions with EDAP Schiff base ligand were
studied in 50 % DMSO-H2O mixture. As well known, quantitative data obtained from the protonation
and stability constants of EDAP ligand and its M(II) complexes contributes greatly by its active groups
as (C=O), (C=Npyridine) and (C=Nazomethine) in the biological systems. From our point of view, the data
collected from this study would help researchers to understand the acid-base behavior as well as the
chemical factors of Schiff base s in the common DMSO-water mixtures which are involved in more
complicated biological processes. The protonation and complexation reactions are exothermic and
spontaneous. Four factors affecting the stability of complexes in solution i) hardness and softness of the
coordinating species; ii) size of the metal ions; iii) Basic character of the ligands and iv) Reaction
temperature. DFT methods were used to have good data about the most optimum geometry and energy
parameters to support the experimental results for complexes.
SUPPLEMENTARY DATA:
Table 1S. Selected bond angles (°) and bond length (Å) of Co-EDAP using DFT-method.
Bond Actual
angles (°)
optimum
angles (°) Bond
Actual
Length(Å)
Optimum
Length(Å)
H(55)-C(28)-H(54) 107.826 109 C(6)-C(28) 1.521 1.497
H(55)-C(28)-C(6) 112.112 110 C(5)-C(27) 1.519 1.497
H(54)-C(28)-H(53) 107.7 109 C(26)-C(16) 1.406 1.42
H(54)-C(28)-C(6) 112.881 110 C(25)-C(26) 1.4 1.42
H(53)-C(28)-C(6) 109.66 110 C(24)-C(25) 1.424 1.42
H(52)-C(27)-H(51) 108.207 109 C(23)-C(24) 1.383 1.42
H(52)-C(27)-H(50) 108.224 109 N(22)-C(23) 1.388 1.358
H(52)-C(27)-C(5) 114.023 110 C(16)-N(22) 1.391 1.358
H(51)-C(27)-C(5) 109.646 110 N(21)-C(14) 1.389 1.358
H(50)-C(27)-C(5) 109.626 110 C(20)-N(21) 1.387 1.358
H(49)-C(26)-C(25) 120.931 120 C(19)-C(20) 1.384 1.42

Int. J. Electrochem. Sci., Vol. 15, 2020
3910
H(49)-C(26)-C(16) 118.722 120 C(18)-C(19) 1.42 1.42
H(48)-C(25)-C(26) 120.547 120 C(17)-C(18) 1.398 1.42
H(48)-C(25)-C(24) 121.845 120 C(14)-C(17) 1.411 1.42
H(47)-C(24)-C(25) 121.606 120 N(15)-C(16) 1.403 1.345
H(47)-C(24)-C(23) 119.12 120 C(11)-N(15) 1.375 1.369
H(46)-C(23)-C(24) 120.898 120 N(13)-C(14) 1.398 1.345
H(46)-C(23)-N(22) 114.795 116.5 C(9)-N(13) 1.384 1.369
C(24)-C(23)-N(22) 124.257 123.5 C(11)-O(12) 1.278 1.208
H(45)-C(20)-N(21) 115.396 116.5 C(7)-C(11) 1.514 1.509
H(45)-C(20)-C(19) 119.926 120 C(9)-O(10) 1.287 1.208
N(21)-C(20)-C(19) 124.671 123.5 C(8)-C(9) 1.522 1.509
H(44)-C(19)-C(20) 119.437 120 C(6)-C(8) 1.535 1.497
H(44)-C(19)-C(18) 121.252 120 C(5)-C(7) 1.537 1.497
H(43)-C(18)-C(19) 122.056 120 N(4)-C(6) 1.299 1.26
H(43)-C(18)-C(17) 120.458 120 N(3)-C(5) 1.293 1.26
H(42)-C(17)-C(18) 121.097 120 C(2)-N(3) 1.471 1.47
H(42)-C(17)-C(14) 118.382 120 C(1)-C(2) 1.539 1.523
C(26)-C(16)-N(22) 122.5 120 C(1)-N(4) 1.465 1.47
C(26)-C(16)-N(15) 117.226 120 C(1)-H(32) 1.107 1.113
N(22)-C(16)-N(15) 120.155 120 C(1)-H(33) 1.103 1.113
H(41)-N(15)-C(16) 113.466 110 O(31)-H(59) 0.975 0.942
H(41)-N(15)-C(11) 114.952 117.4 O(31)-H(58) 0.975 0.942
N(21)-C(14)-C(17) 122.562 120 O(30)-H(57) 0.976 0.942
N(21)-C(14)-N(13) 120.82 120 O(30)-H(56) 0.972 0.942
C(17)-C(14)-N(13) 116.617 120 C(28)-H(55) 1.1 1.113
H(40)-N(13)-C(14) 112.942 110 C(28)-H(54) 1.096 1.113
H(40)-N(13)-C(9) 114.404 117.4 C(28)-H(53) 1.104 1.113
N(15)-C(11)-O(12) 123.665 122.6 C(27)-H(52) 1.095 1.113
N(15)-C(11)-C(7) 115.642 114 C(27)-H(51) 1.102 1.113
O(12)-C(11)-C(7) 120.665 122.5 C(27)-H(50) 1.104 1.113
N(13)-C(9)-O(10) 123.239 122.6 C(26)-H(49) 1.092 1.1
N(13)-C(9)-C(8) 114.641 114 C(25)-H(48) 1.089 1.1
O(10)-C(9)-C(8) 121.913 122.5 C(24)-H(47) 1.087 1.1
H(39)-C(8)-H(38) 108.291 109.4 C(23)-H(46) 1.088 1.1
H(39)-C(8)-C(9) 109.954 108.8 C(20)-H(45) 1.085 1.1
H(39)-C(8)-C(6) 110.692 109.41 C(19)-H(44) 1.089 1.1
H(38)-C(8)-C(9) 109.087 108.8 C(18)-H(43) 1.09 1.1
H(38)-C(8)-C(6) 109.293 109.41 C(17)-H(42) 1.09 1.1
C(9)-C(8)-C(6) 109.493 110.2 N(15)-H(41) 1.019 1.012
H(37)-C(7)-H(36) 106.199 109.4 N(13)-H(40) 1.018 1.012
H(37)-C(7)-C(11) 106.765 108.8 C(8)-H(39) 1.104 1.113
H(37)-C(7)-C(5) 108.425 109.41 C(8)-H(38) 1.097 1.113
H(36)-C(7)-C(11) 110.263 108.8 C(7)-H(37) 1.1 1.113
H(36)-C(7)-C(5) 107.866 109.41 C(7)-H(36) 1.102 1.113
C(11)-C(7)-C(5) 116.816 110.2 C(2)-H(35) 1.104 1.113

Int. J. Electrochem. Sci., Vol. 15, 2020
3911
C(28)-C(6)-C(8) 116.013 117.2 C(2)-H(34) 1.101 1.113
C(28)-C(6)-N(4) 127.169 115.1
C(8)-C(6)-N(4) 116.785 115.1
C(27)-C(5)-C(7) 113.628 117.2
C(27)-C(5)-N(3) 128.471 115.1
C(7)-C(5)-N(3) 117.861 115.1
C(6)-N(4)-C(1) 120.838 108
C(5)-N(3)-C(2) 119.944 108
H(35)-C(2)-H(34) 106.807 109.4
H(35)-C(2)-C(1) 107.934 109.41
H(34)-C(2)-C(1) 108.039 109.41
H(33)-C(1)-H(32) 107.057 109.4
H(33)-C(1)-C(2) 108.736 109.41
H(32)-C(1)-C(2) 107.966 109.41
4. ABBREVIATIONS
EDAP: [(3E,3'E)-3,3'-(ethane-1,2-diylbis(azanylylidene))bis(N-(pyridin-2-yl)butanamide)]
DMSO: Dimethyl sulphoxide
Cu-EDAP: Copper(II) complex
Zn-EDAP: Zinc(II) complex
Ni-EDAP: Nickel(II) complex
Co-EDAP: Cobalt(II) complex
References
1. M. Meloun, S. Bordovská and A. Vrána, Anal. Chim. Acta, 584(2) (2007) 419.
2. G. Roda, C. Dallanoce, G. Grazioso, V. Liberti, and M. De Amici Analytical Sciences, 26(1) (2010)
51.
3. M. Sanchooli, J. Chemistry, (2013), Article ID 989362, 8 pages.
4. A.E. Pütün, G. Bereket and E. Keskin, J. Chemical Eng. Data, 40 (1) (1995) 221.
5. I. Narin, S. Sarioglan, B. Anilanmert and H. Sari, J. Solution Chem., 39(10) (2010) 1582.
6. S.S. Anli, Y. Altun, N. Sanli, G. Alsancak and J.L. Beltran, J. Chemical Eng. Data, 54(11) (2009)
3014.
7. O. Hakli, K. Ertekin, M.S. Ozer and S. Aycan, J. Anal. Chem., 63(11) (2008) 1051.
8. H. Sigel and R.B. Martin, Chem. Rev., 82 (1982) 385.
9. C. Öğretir, S. Yarligan, S. Demirayak and T. Arslan, J. Mol. Struct. Theochem., 666-667 (2003) 609.
10. F.C. Rossotti and H. Rossotti, The Determination of Stability Constants. McGraw-Hill Inc., New
York (1961).
11. R.G. Bates, Determination of pH, Theory and Practice, 2nd edn. John Wiley and Sons, New York
(1975).
12. A.E. Martell, M. Calvin, Chemistry of Metal Chelate Compounds. Prentice-Hall Inc., New York
(1952).
13. A. Ozdernir, G. Turan-zitouni, Z.A. Kaplancikli and G. Revial, Marmara Pharmaceutical J., 14
(2010) 79.
14. L. Mitu, N. Raman, A. Kriza, N. Stặnicặ and M. Dianu, J. Serb. Chem. Soc., 74 (10) (2009) 1075.

Int. J. Electrochem. Sci., Vol. 15, 2020
3912
15. A.A.El-Sherif, J. Inorg. Chim. Acta. 36 (2009) 4991.
16. T.H. Rakha, O.A. El-Gammal, H.M. Metwally and G.M. Abu El-Reash, J. Mol. Struct., 1062 (2014)
96.
17. M. Arfan, R. Khan, A. A. Tavman and S.S. Saba, J. Saudi Chem. Soc., 1–5 (2012).
18. S.K. Sengupta, O.P. Pandey and S.A.A. Rai, J. Spectrochim. Acta, (A)65 (2006) 139.
19. S. Gemma, G. Kukreja, C. Fattorusso, M. Persico, M. Romano, M. Altarelli, L. Savini, Med. Chem.
Lett., 16 (20) (2006) 5384.
20. M. Gokce, S. Utku and E. Kupeli, Fur J Med. Chem., 44(9) (2009) 3760.
21. N.M. Hosny, Y.E. Sherif and A.A. El-Rahman, J. Coord. Chem., 61(16) (2008) 2536.
22. A.A. El-Sherif, J. Solution Chem., 41(2) (2012) 249.
23. A. Fetoh, K.A. Asla, A.A. El-Sherif, H. El-Didamony and G.M. Abu El-Reash. J. Mol. Struct,. 1178
(2019) 524.
24. A.A. El-Sherif, J. Coord. Chem., 64 (12) (2011) 2035.
25. A.A. El-Sherif, M.R. Shehata, M.M. Shoukry and N. Mahmoud, J. Solution Chem., 45 (2016) 410.
26. M. M. Mahrouk, A.T. Abdelkarim, A.A. El-Sherif, M.M. Shoukry, Int. J. Electrochem. Sci., 10
(2015) 456
27. A.A. El-Sherif and M. M. Shoukry, J. Main Group Metal Chem., 29(4) (2006) 189.
28. A.T. Abd El-Karim and A.A. El-Sherif, J. Mol. Liquids, 219 (2016) 914.
29. A.A. El-Sherif, A. Fetoh, Y. K. Abdulhamed and G.M.A. El-Reash, Inorg. Chim. Acta, 480 (2018)
1.
30. N.A. Al-Awadi, N.M. Shuaib, A.A. El-Sherif, A. El-Dissouky and E. Al-Saleh, Bioinorg. Chem. and
Applications, (2008), Art. No. 479897.
31. A.A. El-Sherif, J. Solution Chem. 39 (2010) 1562.
32. A.A. El-Sherif and M. M. Shoukry, J. Progress in Reaction Kinetics and Mechanism 36 (2011)
215–226.
33. A, Fetoh, K.A. Asla, A.A. El-Sherif, H. El-Didamony and G.M. Abu El-Reash, J. Mol. Struct. 1178
(2019) 524.
34. F.J. Welcher, Van Nostand, Princeton (1965).
35. E.M. Woolley, D.G. Hurkot and L.G. Hepler, J. Phys. Chem. 74 (1970) 3908.
36. G.L. Van Uitert and C. G. Hass, J. Am. Chem. Soc., 75 (1971) 451.
37. E.P. Serjeant, Potentiometry and potentiometric titrations. Wiley, New York (1984).
38. A. Golcu, M. Tumer, H. Demirelli and R.A. Wheatley, Inorg. Chim. Acta, 358 (2005) 1785.
39. A.E. Martell and R. J. Motekaitis, The Determination and Use of Stability Constants. VCH,
Weinheim (1988).
40. M. Meloun, J. Havel, E. Högfelt, Computation of Solution Equilibria: A Guide to Methods in
Potentiometry, Extraction and Spectrophotometry; Ellis Horwood Limited: Chichester, Wiley, New
York (1988).
41. P. Gans, A. Sabatini and A. Vacca, Inorg. Chim. Acta, 18 (1976) 237.
42. L. Pettit, University of Leeds, Personal Communication.
43. B. Delley, Int. J. Quantum Chem., 69 (1998) 423.
44. B. Delley, From molecules to solids with the DMol3 approach. J. Chem. Phys., 113 (2000) 7756.
45. A. Kessi and B. Delley, Int. J. Quantum Chem., 68 (1998) 135.
46. Materials Studio (Version 5.0), Copyright 2009. Accelrys software Inc., San Diego, USA.
47. W.J. Hehre, L. Radom, P.V.R. Schlyer and J.A. Pople, Ab Initio Molecular Orbital Theory, Wiley,
New York, (1986).
48. B. Hammer, L.B. Hansen and J.K. Nrskov, Phys. Rev., B 59 (1999) 7413.
49. A. Matveev, M. Staufer, M. Mayer and N. Rösch, Int. J. Quantum Chem., 75 (1999) 863.
50. A.A. El-Sherif, M.M. Shoukry, M.M.A. Abd-Elgawad, J. Solution Chem., 42 (2013) 412.
51. A.A. El-Sherif, M.R. Shehata, M.M. Shoukry and M.H. Barakat, J. Spectrochim. Acta, (A) 96 (2012)

Int. J. Electrochem. Sci., Vol. 15, 2020
3913
889.
52. D. Martin and H.G. Hauthal, Dimethylsulphoxide, Van Nostrand Reinhold, Workingham, UK,
(1975).
54. H. Doine. Bull. Chem. Soc. Jpn., 58 (1985) 1327.
55. T. Gunduz, E. Kilic, F. Koseoglu and E. Canel. Anal. Chim. Acta, 282 (1993) 489.
56. F. Polat, H. Atabey, H. Sari and A. Çukurovali. Turk J Chem., 37 (2013) 439
57. Z. Cimerman, N. Gale and B. Bosner, J. Mol. Struct., 274 (1992) 131.
58. P. Gürkan and N. Sari, Talanta, 44 (1997) 1935.
59. W.J. Geary, G. Nickless and F.H. Pollard, Anal. Chim. Acta, 27 (1962) 71.
60. T. Gilndiiz, E. Kilic and E. Cane, Anal. Chim. Acta, 282(3) (1993) 489.
61. M.S. Aljahdali, A.A. El-Sherif, M.M. Shoukry and S.E. Mohamed, J. Solution Chem., 42 (2013)
1028.
62. M.S. Aljahdali, A.T. Abdelkarim and A.A. El-Sherif, J. Solution Chem., 42(11) (2013) 2240.
63. J. E. Huheey, Inorganic Chemistry-Principles of Structure and Reactivity. Harper SI Edn, New York
(1983).
64. H. M. Irving and H. S. Rossotti, J. Chem. Soc,. (1954) 2904.
65. F.A. Cotton and G. Wilkinson, Advanced Inorg. Chem., Wiley, London (1962)
66. J.E. Huheey, Inorg. Chem., SI Edn, Harper, New York (1983).
67. M.T. Beck, Chemistry of Complex Equilibria, Akademiai Kiado, Budapest (1970).
68. H. Irving and R.J.P. Williams, The stability of transition-metal complexes. J. Chem. Soc., (1953)
3192.
69. A.A. El-Sherif, M.R. Shehata, M.M. Shoukry and M.H. Barakat, Bioinorg. Chem. and Applications,
(2012), Article ID 984291, doi:10.1155/2012/984291.
70. W.U. Malik, G.D. Tuli and R.D. Madan, Selected Topics in Inorg. Chem., S. Chand & Company
LTD, New Delhi, 3rd edition, (1984).
71. G.A. Ibañez and G.M. Escandar, Polyhedron, 17 (25-26) (1998) 4433.
72. F.R. Harlly, R.M. Burgess and R.M. Alcock, Solution Equilibria, Ellis Harwood, Chichester, UK,
(1980).
73. L.E. Orgel, An Introduction to Transition Metal Chemistry Ligand Field Theory, Methuen, London,
(1966).
74. A.A. El-Sherif and T.M.A. Eldebss, J. Spectro. Chim. Acta, (A) 79 (2011) 1803-1814.
75. B. Jeragh, D. El-Wahaib, A.A. El-Sherif and A. El-Dissouky, J. Chemical Eng. Data, 52(5) (2007)
1609.
76. A. McAuley, G.H. Nancollas and K. Torrance, Inorg. Chem., 6 (1967) 136.
77. R.G. Pearson, J. Org. Chem., 54 (1989) 1423.
78. P. Geerlings, F. De Proft and W. Langenaeker, Chem. Rev., 103 (2003) 1793.
79. R.G. Parr, Electrophilicity index. J. Am. Chem. Soc., 121 (1999) 1922–1924.
80. P.K. Chattaraj and S. Giri, J. Phys. Chem., A 111 (2007) 11116.
81. G. Speie, J. Csihony, A.M. Whalen and C.G. Pie-Pont, Inorg. Chem., 35 (1996) 3519.
82. A. Aihara, J. Phys. Chem. A ,103 (1999)7487.
83. R.C. Haddon and T. Fukunaga, Absolute hardness as a measure of aromaticity. Tetrahedron Lett.,
29 (1988) 4843.
84. R.G. Parr and P.K. Chattara, Principle of maximum hardness. J. Am. Chem. Soc., 113 (1991) 1854.
© 2020 The Authors. Published by ESG (www.electrochemsci.org). This article is an open access
article distributed under the terms and conditions of the Creative Commons Attribution license
(http://creativecommons.org/licenses/by/4.0/).