Potentiometric Sensor for Gadolinium(III) Ion Based on Zirconium
12
ISSN: 0973-4945; CODEN ECJHAO E-Journal of Chemistry http://www.e-journals.net 2009, 6(4), 1139-1149 Potentiometric Sensor for Gadolinium(III) Ion Based on Zirconium[IV] Tungstophosphate as an Electroactive Material HARISH K. SHARMA * and NADEEM SHARMA Department of Chemistry, M. M. University, Mullana, Ambala-133203, Haryana, India. [email protected] Received 10 March 2009; Accepted 5 April 2009 Abstract: A new inorganic ion exchanger has been synthesized namely Zirconium(IV) tungstophosphate [ZrWP]. The synthesized exchanger was characterized using ion exchange capacity and distribution coefficient (K d ). For further studies, exchanger with 0.35 meq/g ion-exchange capacity was selected. Electrochemical studies were carried out on the ion exchange membranes using epoxy resin as a binder. In case of ZrWP, the membrane having the composition; Zirconium(IV) tugstophosphate (40%) and epoxy resin (60%) exhibits best performance. The membrane works well over a wide range of concentration from 1x10 -5 to 1x10 -1 M of Gd(III) ion with an over- Nernstian slope of 30 mv/ decade. The response time of the sensor is 15 seconds. For this membrane, effect of internal solution has been studied and the electrode was successfully used in partially non-aqueous media too. Fixed interference method and matched potential method has been used for determining selectivity coefficient with respect to alkali, alkaline earth, some transition and rare earth metal ions that are normally present along with Gd(III) in its ores. The electrode can be used in the pH range 4.0-10.0 for 10 -1 M and 3.0-7.0 for 10 -2 M concentration of target ion. These sensors have been used as indicator electrodes in the potentiometric titration of Gd(III) ion against EDTA and oxalic acid. Keywords: Inorganic ion exchanger, Gd(III), Selectivity, Potentiometric titration. Introduction The rare earth industry is growing steadily and an average increase over past several years has been 5-15%. Main applications involve the use of mixed rare earths as gasoline-cracking catalysts, as starting materials for making "Misch Metal" (Common commercial alloy of cerium containing around 45-65% Ce), the use of rare earth silicides for various
Transcript of Potentiometric Sensor for Gadolinium(III) Ion Based on Zirconium

ISSN: 0973-4945; CODEN ECJHAO
E-Journal of Chemistry
http://www.e-journals.net 2009, 6(4), 1139-1149
Potentiometric Sensor for Gadolinium(III) Ion
Based on Zirconium[IV] Tungstophosphate
as an Electroactive Material
HARISH K. SHARMA* and NADEEM SHARMA
Department of Chemistry, M. M. University,
Mullana, Ambala-133203, Haryana, India.
Received 10 March 2009; Accepted 5 April 2009
Abstract: A new inorganic ion exchanger has been synthesized namely
Zirconium(IV) tungstophosphate [ZrWP]. The synthesized exchanger was
characterized using ion exchange capacity and distribution coefficient (Kd). For
further studies, exchanger with 0.35 meq/g ion-exchange capacity was selected.
Electrochemical studies were carried out on the ion exchange membranes using
epoxy resin as a binder. In case of ZrWP, the membrane having the
composition; Zirconium(IV) tugstophosphate (40%) and epoxy resin (60%)
exhibits best performance. The membrane works well over a wide range of
concentration from 1x10⁻⁵ to 1x10⁻¹M of Gd(III) ion with an over- Nernstian
slope of 30 mv/ decade. The response time of the sensor is 15 seconds. For this
membrane, effect of internal solution has been studied and the electrode was
successfully used in partially non-aqueous media too. Fixed interference
method and matched potential method has been used for determining selectivity
coefficient with respect to alkali, alkaline earth, some transition and rare earth
metal ions that are normally present along with Gd(III) in its ores. The electrode
can be used in the pH range 4.0-10.0 for 10-1 M and 3.0-7.0 for 10-2 M
concentration of target ion. These sensors have been used as indicator electrodes
in the potentiometric titration of Gd(III) ion against EDTA and oxalic acid.
Keywords: Inorganic ion exchanger, Gd(III), Selectivity, Potentiometric titration.
Introduction
The rare earth industry is growing steadily and an average increase over past several years
has been 5-15%. Main applications involve the use of mixed rare earths as gasoline-cracking
catalysts, as starting materials for making "Misch Metal" (Common commercial alloy
of cerium containing around 45-65% Ce), the use of rare earth silicides for various
1140 HARISH K. SHARMA et al.
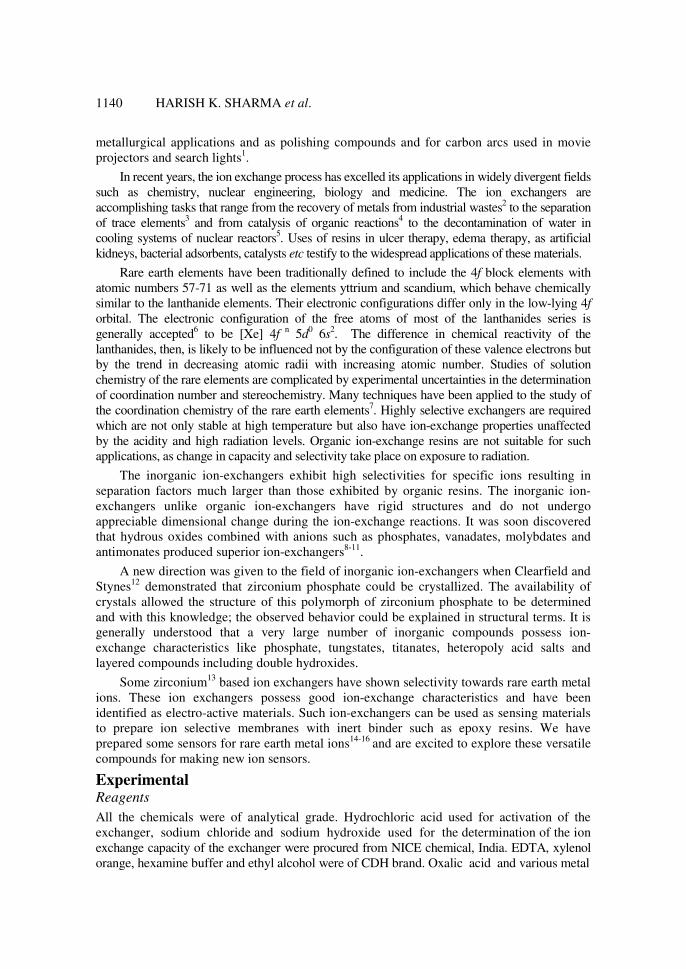
metallurgical applications and as polishing compounds and for carbon arcs used in movie
projectors and search lights1.
In recent years, the ion exchange process has excelled its applications in widely divergent fields
such as chemistry, nuclear engineering, biology and medicine. The ion exchangers are
accomplishing tasks that range from the recovery of metals from industrial wastes2 to the separation
of trace elements3 and from catalysis of organic reactions
4 to the decontamination of water in
cooling systems of nuclear reactors5. Uses of resins in ulcer therapy, edema therapy, as artificial
kidneys, bacterial adsorbents, catalysts etc testify to the widespread applications of these materials.
Rare earth elements have been traditionally defined to include the 4f block elements with
atomic numbers 57-71 as well as the elements yttrium and scandium, which behave chemically
similar to the lanthanide elements. Their electronic configurations differ only in the low-lying 4f
orbital. The electronic configuration of the free atoms of most of the lanthanides series is
generally accepted6 to be [Xe] 4f
n 5d
0 6s
2. The difference in chemical reactivity of the
lanthanides, then, is likely to be influenced not by the configuration of these valence electrons but
by the trend in decreasing atomic radii with increasing atomic number. Studies of solution
chemistry of the rare elements are complicated by experimental uncertainties in the determination
of coordination number and stereochemistry. Many techniques have been applied to the study of
the coordination chemistry of the rare earth elements7. Highly selective exchangers are required
which are not only stable at high temperature but also have ion-exchange properties unaffected
by the acidity and high radiation levels. Organic ion-exchange resins are not suitable for such
applications, as change in capacity and selectivity take place on exposure to radiation.
The inorganic ion-exchangers exhibit high selectivities for specific ions resulting in
separation factors much larger than those exhibited by organic resins. The inorganic ion-
exchangers unlike organic ion-exchangers have rigid structures and do not undergo
appreciable dimensional change during the ion-exchange reactions. It was soon discovered
that hydrous oxides combined with anions such as phosphates, vanadates, molybdates and
antimonates produced superior ion-exchangers8-11
.
A new direction was given to the field of inorganic ion-exchangers when Clearfield and
Stynes12
demonstrated that zirconium phosphate could be crystallized. The availability of
crystals allowed the structure of this polymorph of zirconium phosphate to be determined
and with this knowledge; the observed behavior could be explained in structural terms. It is
generally understood that a very large number of inorganic compounds possess ion-
exchange characteristics like phosphate, tungstates, titanates, heteropoly acid salts and
layered compounds including double hydroxides.
Some zirconium13
based ion exchangers have shown selectivity towards rare earth metal
ions. These ion exchangers possess good ion-exchange characteristics and have been
identified as electro-active materials. Such ion-exchangers can be used as sensing materials
to prepare ion selective membranes with inert binder such as epoxy resins. We have
prepared some sensors for rare earth metal ions14-16
and are excited to explore these versatile
compounds for making new ion sensors.
Experimental Reagents
All the chemicals were of analytical grade. Hydrochloric acid used for activation of the
exchanger, sodium chloride and sodium hydroxide used for the determination of the ion
exchange capacity of the exchanger were procured from NICE chemical, India. EDTA, xylenol
orange, hexamine buffer and ethyl alcohol were of CDH brand. Oxalic acid and various metal
Potentiometric Sensor for Gadolinium(III) Ion 1141
ion solutions were prepared by either direct weighing of AR grade reagent or by indirect
standardization. Distilled water was prepared with the help of double distillation plant etc.
Instrumentation
Digital potentiometer (Microsil) was used to measure the emf. pH measurement was done
with the help of pH meter (Microsil, LIC 196). Balance Electronic Top Pan (Endeavour) was
used for all the weighing.
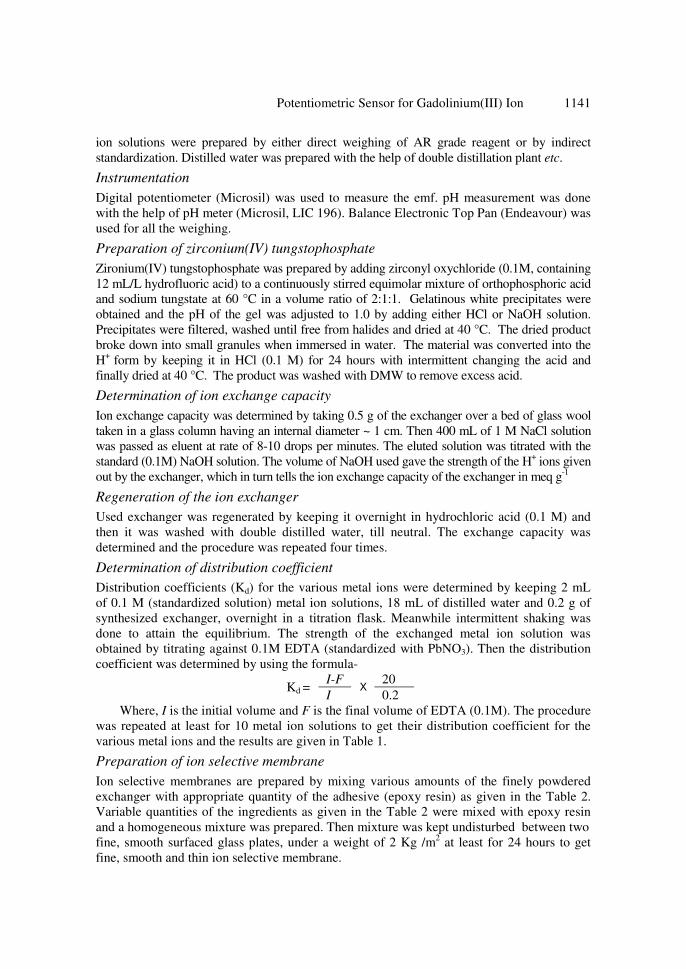
Preparation of zirconium(IV) tungstophosphate
Zironium(IV) tungstophosphate was prepared by adding zirconyl oxychloride (0.1M, containing
12 mL/L hydrofluoric acid) to a continuously stirred equimolar mixture of orthophosphoric acid
and sodium tungstate at 60 °C in a volume ratio of 2:1:1. Gelatinous white precipitates were
obtained and the pH of the gel was adjusted to 1.0 by adding either HCl or NaOH solution.
Precipitates were filtered, washed until free from halides and dried at 40 °C. The dried product
broke down into small granules when immersed in water. The material was converted into the
H+
form by keeping it in HCl (0.1 M) for 24 hours with intermittent changing the acid and
finally dried at 40 °C. The product was washed with DMW to remove excess acid.
Determination of ion exchange capacity
Ion exchange capacity was determined by taking 0.5 g of the exchanger over a bed of glass wool
taken in a glass column having an internal diameter ~ 1 cm. Then 400 mL of 1 M NaCl solution
was passed as eluent at rate of 8-10 drops per minutes. The eluted solution was titrated with the
standard (0.1M) NaOH solution. The volume of NaOH used gave the strength of the H+ ions given
out by the exchanger, which in turn tells the ion exchange capacity of the exchanger in meq g-1
Regeneration of the ion exchanger
Used exchanger was regenerated by keeping it overnight in hydrochloric acid (0.1 M) and
then it was washed with double distilled water, till neutral. The exchange capacity was
determined and the procedure was repeated four times.
Determination of distribution coefficient
Distribution coefficients (Kd) for the various metal ions were determined by keeping 2 mL
of 0.1 M (standardized solution) metal ion solutions, 18 mL of distilled water and 0.2 g of
synthesized exchanger, overnight in a titration flask. Meanwhile intermittent shaking was
done to attain the equilibrium. The strength of the exchanged metal ion solution was
obtained by titrating against 0.1M EDTA (standardized with PbNO3). Then the distribution
coefficient was determined by using the formula-
I-F 20 Kd =
I X
0.2
Where, I is the initial volume and F is the final volume of EDTA (0.1M). The procedure
was repeated at least for 10 metal ion solutions to get their distribution coefficient for the
various metal ions and the results are given in Table 1.
Preparation of ion selective membrane
Ion selective membranes are prepared by mixing various amounts of the finely powdered
exchanger with appropriate quantity of the adhesive (epoxy resin) as given in the Table 2.
Variable quantities of the ingredients as given in the Table 2 were mixed with epoxy resin
and a homogeneous mixture was prepared. Then mixture was kept undisturbed between two
fine, smooth surfaced glass plates, under a weight of 2 Kg /m2 at least for 24 hours to get
fine, smooth and thin ion selective membrane.

1142 HARISH K. SHARMA et al.
Table 1. The Kd value for various metal ions.
S.No. Metal ion Kd(distribution coefficient)
1 Gd(III) 35.0
2 Pr(III) 5 .0
3 Nd(III) 20.0
4 Sm(III) 10.0
5 La(III) 5.0
6 Ce(III) 10.0
7 Cu(III) 25.0
8 Dy(III) 20.0
9 Tb(III) 5.0
10 Y(III) 30.0
Table 2. Composition of the ingredients for the preparation of membranes
S.No. Ion selective
Membrane, %
Quantity of the
exchanger, g
Quantity of the Epoxy
resin, g
1 40 0.40 0.60
2 50 0.50 0.50
3 60 0.60 0.40
Activation of the membrane
The membranes were fixed to one end of the glass tube of 1.8 cm (internal diameter) using
epoxy resin as an adhesive. These electrodes were then equilibrated with Gd+3
ion solution
(0.1 M) for 24 hours. Now the membrane is ready to sense the metal ion in the external
solution. Further regeneration is essential at least for 2 hours whenever these are to be used
and whenever not in use, these are kept in distilled water.
EMF Measurements
The tube was filled 3/4th
with Gd+3
solution (0.1 M) and immersed in a beaker containing
test solution of varying concentrations. All the EMF measurements were carried out using
the following cell assembly:
Hg-Hg2Cl2(s), KCl (sat.) 0.1M Gd+3
membrane test solution | KCl (sat.), Hg2Cl2-Hg
Results and Discussion Selection of the metal ion Distribution coefficients for the various metal ions were found out which show that best
exchanged ion is Gd(III) ion. The distribution coefficient for Gd(III) ion is 35 where as for the
other metal ions it is very low and hence, the synthesized exchanger (ZrWP) acts as a good
sensor for the Gd(III) ion and it can easily detect the Gd(III) ion in the external solution.
Calibration curve
A series of solutions were prepared by using 0.1 M solution of Gd(III) ion. Potential
measurements were made on the selected electrodes for different concentrations of Gd(III)
ion solutions. EMFs were plotted against log of activities of the Gd(III) ions.
Experiments were repeated four times to check the reproducibility of the electrode system.
Standard deviation of ±0.005 mV was observed. Representative curves are shown in Figure
1(a), 1(b), 1(c) and calibration curve is shown by Figure 1(d). Membrane composition ZrWP:
epoxy resin as 40%:60% shows linearity in the concentration range 10-5
M to 10-1
M with
slope of 30 mV/ decade, taking 10-1
M solution as external solution. The limit of detection
was calculated according to IUPAC recommendations17-18
from the intersection of the two

Potentiometric Sensor for Gadolinium(III) Ion 1143
extrapolated linear portions of the curves. Various results are shown in Table 3. ZrWP based
electrode showed over-Nernstian response which is common19-20
. The reason for the non-
Nernstian behavior of the electrode may be the possible discrepancy between ion activities in
the bulk and at the phase boundary, i.e. the uptake of the ions by the membranes results in a
depletion zone of the analyte ions from the Nernst diffusion layer. Response time of the
electrodes was less than 15 seconds. It is still lower for the relatively concentrated solution.
Potential behavior of the membranes remains unchanged when the potentials are measured
either from low to high or high to low concentrations. These membranes could be used
without any measurable divergence. The electrodes were stored in Gd(III) ion solution (0.1 M)
when not in use to avoid any change in metal ion concentration in the membrane phase.
log a
-9 -8 -7 -6 -5 -4 -3 -2 -1 0
EM
F (
mV
)
-0.10
-0.08
-0.06
-0.04
-0.02
0.00
10-1
M10
-2 M
10-3
M
Figure 1(a). Curves for Gd(III) selective electrode (40% membrane) based on ZrWP in
epoxy resin and also the effect of internal solution.
10-2
10-3
log aGd3+
-9 -8 -7 -6 -5 -4 -3 -2 -1 0
EM
F(m
V)
-0.14
-0.12
-0.10
-0.08
-0.06
-0.04
-0.02
0.00
10-1
M
10-2
M
10-3
M
Figure 1(b). Curves for Gd(III) selective electrode (50% membrane) based on ZrWP in
epoxy resin and also the effect of internal solution.
log a Gd3+
EM
F,
mV
E
MF
, m
V
1144 HARISH K. SHARMA et al.
log aGd
3+
-9 -8 -7 -6 -5 -4 -3 -2 -1 0
EM
F (
mV
)
-0.12
-0.10
-0.08
-0.06
-0.04
-0.02
0.00
10-1
M10
-2 M
10-3
M
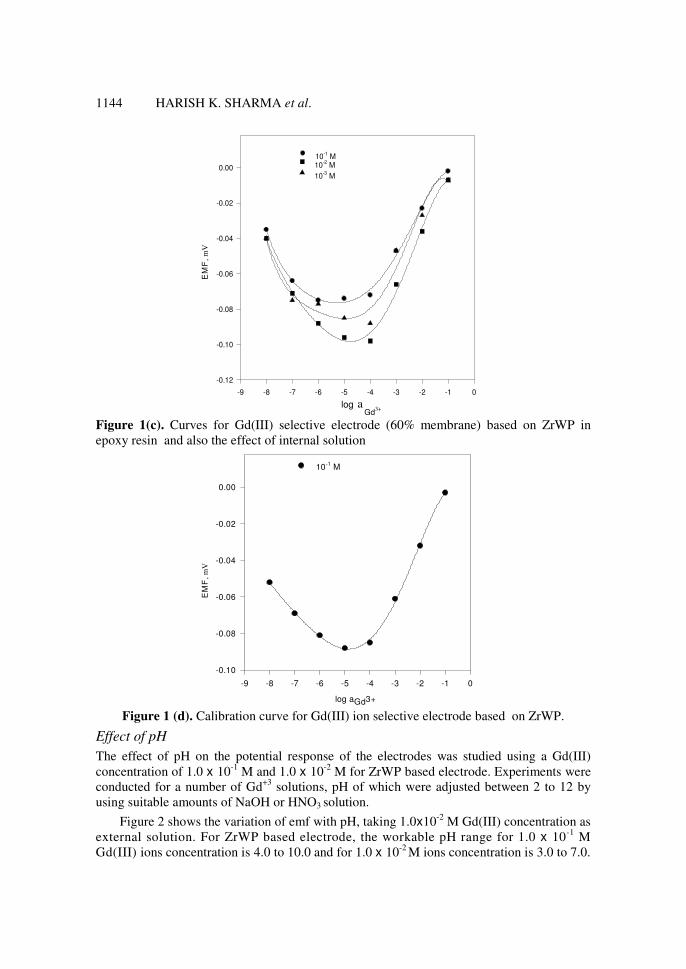
Figure 1(c). Curves for Gd(III) selective electrode (60% membrane) based on ZrWP in
epoxy resin and also the effect of internal solution
log aGd3+
-9 -8 -7 -6 -5 -4 -3 -2 -1 0
EM
F (
mV
)
-0.10
-0.08
-0.06
-0.04
-0.02
0.00
10-1
M
Figure 1 (d). Calibration curve for Gd(III) ion selective electrode based on ZrWP.
Effect of pH
The effect of pH on the potential response of the electrodes was studied using a Gd(III)
concentration of 1.0 x 10⁻¹
M and 1.0 x 10⁻²
M for ZrWP based electrode. Experiments were
conducted for a number of Gd+3
solutions, pH of which were adjusted between 2 to 12 by
using suitable amounts of NaOH or HNO3 solution.
Figure 2 shows the variation of emf with pH, taking 1.0x10⁻²
M Gd(III) concentration as
external solution. For ZrWP based electrode, the workable pH range for 1.0 x 10⁻¹
M
Gd(III) ions concentration is 4.0 to 10.0 and for 1.0 x 10⁻²
M ions concentration is 3.0 to 7.0.
log a Gd
3+
EM
F,
mV
E
MF
, m
V
Potentiometric Sensor for Gadolinium(III) Ion 1145
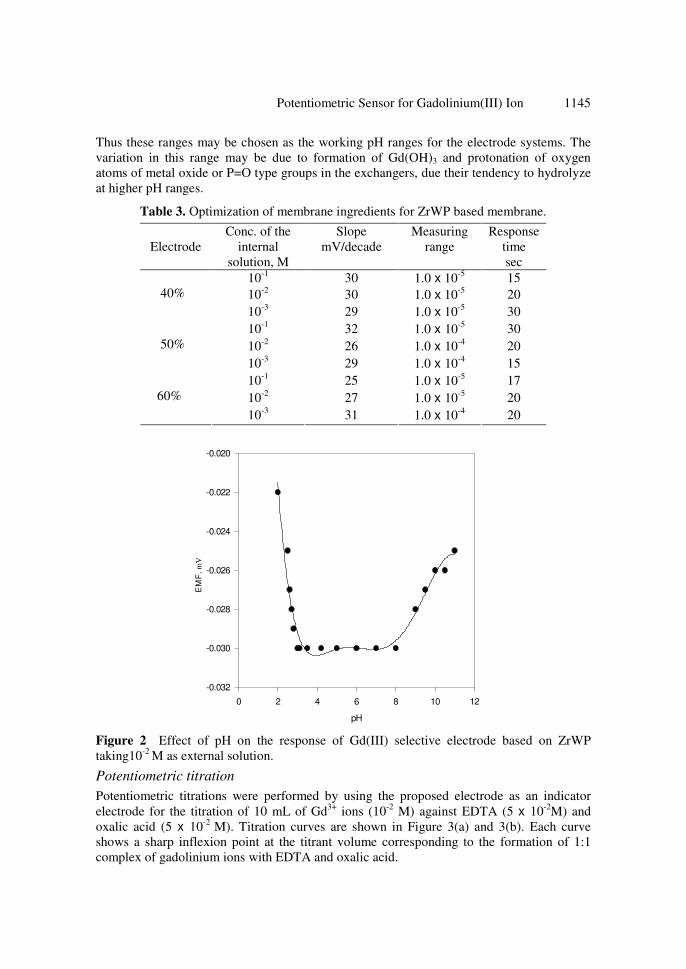
Thus these ranges may be chosen as the working pH ranges for the electrode systems. The
variation in this range may be due to formation of Gd(OH)3 and protonation of oxygen
atoms of metal oxide or P=O type groups in the exchangers, due their tendency to hydrolyze
at higher pH ranges.
Table 3. Optimization of membrane ingredients for ZrWP based membrane.
Electrode
Conc. of the
internal
solution, M
Slope
mV/decade
Measuring
range
Response
time
sec
10-1
30 1.0 x 10⁻⁵
15
10-2
30 1.0 x 10⁻⁵
20
40%
10-3
29 1.0 x 10⁻⁵
30
10-1
32 1.0 x 10⁻⁵
30
10-2
26 1.0 x 10⁻⁴
20
50%
10-3
29 1.0 x 10⁻⁴
15
10-1
25 1.0 x 10⁻⁵
17
10-2
27 1.0 x 10⁻⁵
20
60%
10-3
31 1.0 x 10⁻⁴
20
pH
0 2 4 6 8 10 12
EM
F (
mV
)
-0.032
-0.030
-0.028
-0.026
-0.024
-0.022
-0.020
Figure 2 Effect of pH on the response of Gd(III) selective electrode based on ZrWP
taking10-2
M as external solution.
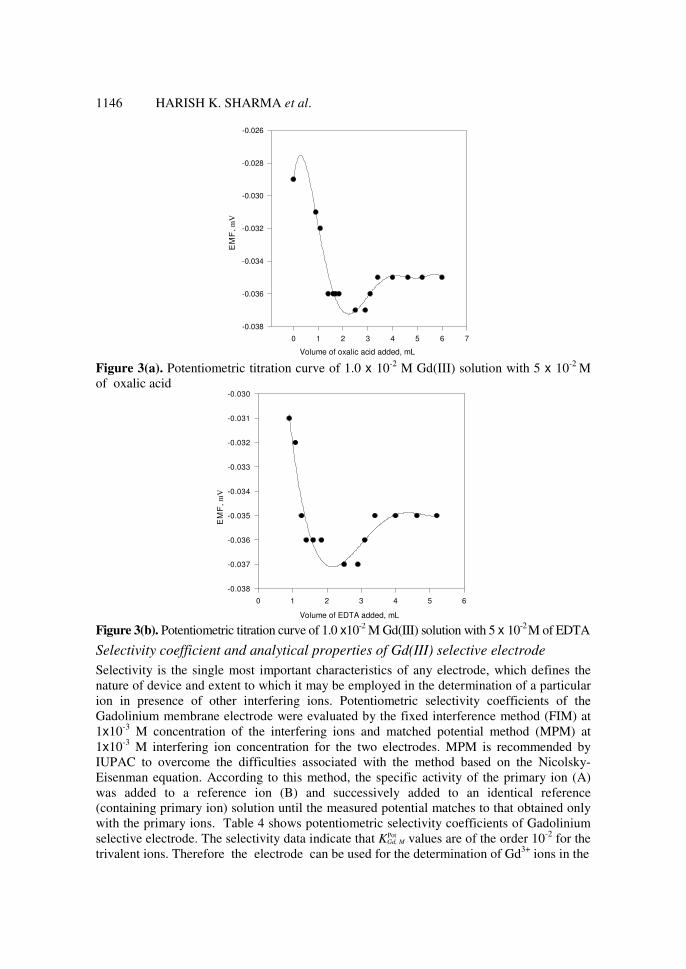
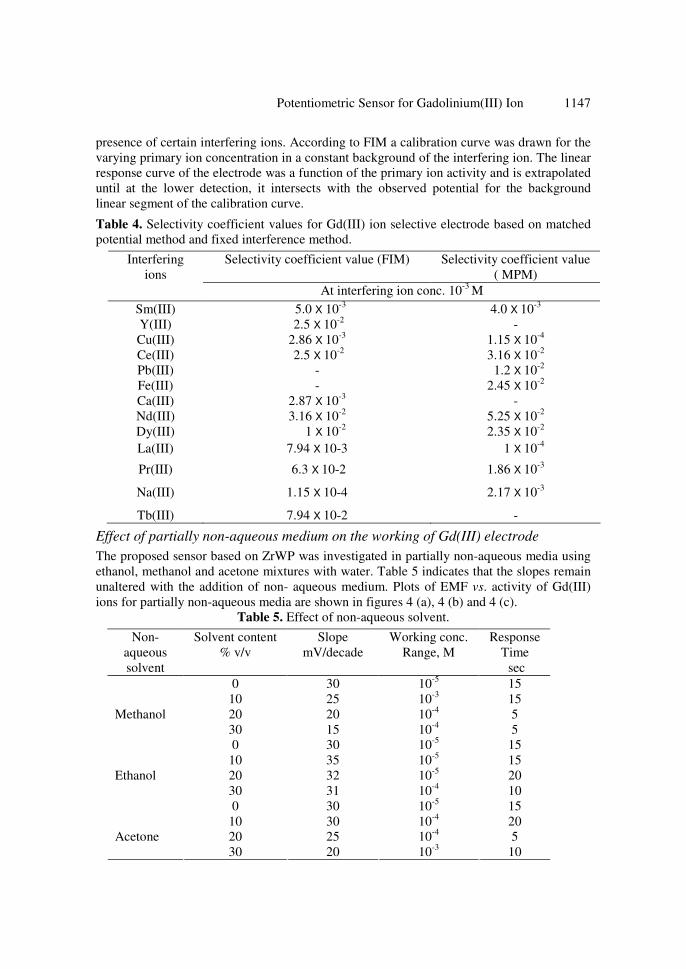
Potentiometric titration
Potentiometric titrations were performed by using the proposed electrode as an indicator
electrode for the titration of 10 mL of Gd3+
ions (10-2
M) against EDTA (5 x 10⁻²
M) and
oxalic acid (5 x 10⁻²
M). Titration curves are shown in Figure 3(a) and 3(b). Each curve
shows a sharp inflexion point at the titrant volume corresponding to the formation of 1:1
complex of gadolinium ions with EDTA and oxalic acid.
EM
F,
mV
1146 HARISH K. SHARMA et al.
Volume of oxalic acid added (mL)
0 1 2 3 4 5 6 7
EM
F (
mV
)
-0.038
-0.036
-0.034
-0.032
-0.030
-0.028
-0.026
Figure 3(a). Potentiometric titration curve of 1.0 x 10
-2 M Gd(III) solution with 5 x 10
-2 M
of oxalic acid
Volume of EDTA added (mL)
0 1 2 3 4 5 6
EM
F (
mV
)
-0.038
-0.037
-0.036
-0.035
-0.034
-0.033
-0.032
-0.031
-0.030
Figure 3(b). Potentiometric titration curve of 1.0 x10
-2 M Gd(III) solution with 5 x 10
-2 M of EDTA
Selectivity coefficient and analytical properties of Gd(III) selective electrode
Selectivity is the single most important characteristics of any electrode, which defines the
nature of device and extent to which it may be employed in the determination of a particular
ion in presence of other interfering ions. Potentiometric selectivity coefficients of the
Gadolinium membrane electrode were evaluated by the fixed interference method (FIM) at
1x10⁻³
M concentration of the interfering ions and matched potential method (MPM) at
1x10⁻³
M interfering ion concentration for the two electrodes. MPM is recommended by
IUPAC to overcome the difficulties associated with the method based on the Nicolsky-
Eisenman equation. According to this method, the specific activity of the primary ion (A)
was added to a reference ion (B) and successively added to an identical reference
(containing primary ion) solution until the measured potential matches to that obtained only
with the primary ions. Table 4 shows potentiometric selectivity coefficients of Gadolinium
selective electrode. The selectivity data indicate that KGd, M values are of the order 10-2
for the
trivalent ions. Therefore the electrode can be used for the determination of Gd3+
ions in the
Volume of oxalic acid added, mL
Volume of EDTA added, mL
Pot
EM
F,
mV
EM
F,
mV
Potentiometric Sensor for Gadolinium(III) Ion 1147
presence of certain interfering ions. According to FIM a calibration curve was drawn for the
varying primary ion concentration in a constant background of the interfering ion. The linear
response curve of the electrode was a function of the primary ion activity and is extrapolated
until at the lower detection, it intersects with the observed potential for the background
linear segment of the calibration curve.
Table 4. Selectivity coefficient values for Gd(III) ion selective electrode based on matched
potential method and fixed interference method.
Selectivity coefficient value (FIM) Selectivity coefficient value
( MPM)
Interfering
ions
At interfering ion conc. 10-3
M
Sm(III) 5.0 X 10⁻³
4.0 X 10⁻³
Y(III) 2.5 X 10⁻²
-
Cu(III) 2.86 X 10⁻³
1.15 X 10⁻⁴
Ce(III) 2.5 X 10⁻²
3.16 X 10⁻²
Pb(III) - 1.2 X 10⁻²
Fe(III) - 2.45 X 10⁻²
Ca(III) 2.87 X 10⁻³
-
Nd(III) 3.16 X 10⁻²
5.25 X 10⁻²
Dy(III) 1 X 10⁻²
2.35 X 10⁻²
La(III) 7.94 X 10⁻³ 1 X 10⁻⁴
Pr(III) 6.3 X 10⁻² 1.86 X 10⁻³
Na(III) 1.15 X 10⁻⁴ 2.17 X 10⁻³
Tb(III) 7.94 X 10⁻² -
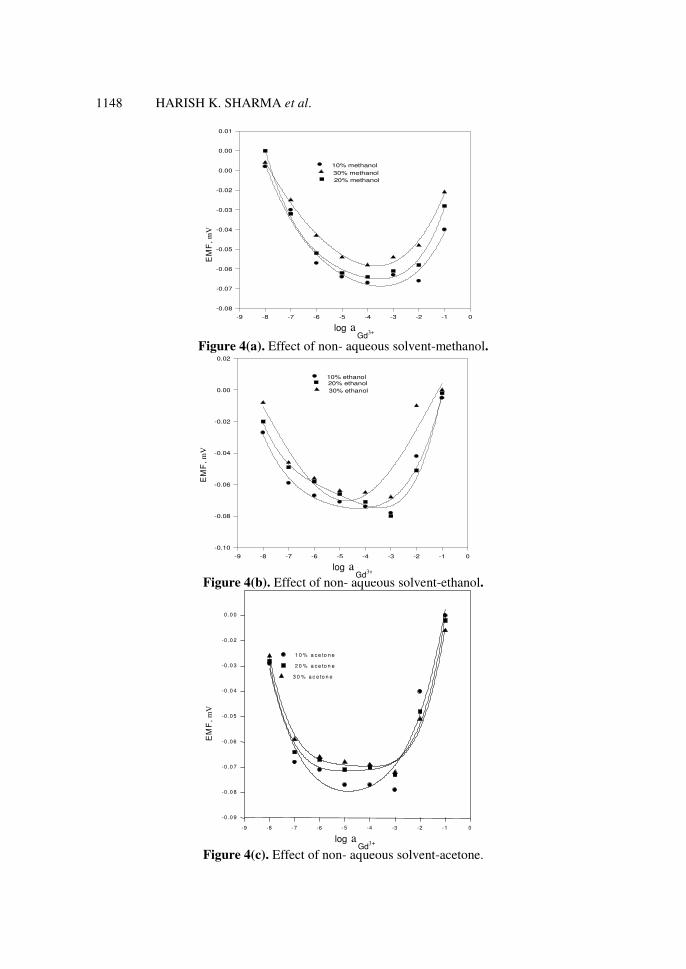
Effect of partially non-aqueous medium on the working of Gd(III) electrode
The proposed sensor based on ZrWP was investigated in partially non-aqueous media using
ethanol, methanol and acetone mixtures with water. Table 5 indicates that the slopes remain
unaltered with the addition of non- aqueous medium. Plots of EMF vs. activity of Gd(III)
ions for partially non-aqueous media are shown in figures 4 (a), 4 (b) and 4 (c).
Table 5. Effect of non-aqueous solvent.
Non-
aqueous
solvent
Solvent content
% v/v
Slope
mV/decade
Working conc.
Range, M
Response
Time
sec
0 30 10-5
15
10 25 10-3
15
20 20 10-4
5
Methanol
30 15 10-4
5
0 30 10-5
15
10 35 10-5
15
20 32 10-5
20
Ethanol
30 31 10-4
10
0 30 10-5
15
10 30 10-4
20
20 25 10-4
5
Acetone
30 20 10-3
10
1148 HARISH K. SHARMA et al.
log aGd
3+
-9 -8 -7 -6 -5 -4 -3 -2 -1 0
EM
F (m
V)
-0.08
-0.07
-0.06
-0.05
-0.04
-0.03
-0.02
0.00
0.00
0.01
10% methanol
20% methanol
30% methanol
Figure 4(a). Effect of non- aqueous solvent-methanol.
log aGd
3+
-9 -8 -7 -6 -5 -4 -3 -2 -1 0
EM
F (m
V)
-0.10
-0.08
-0.06
-0.04
-0.02
0.00
0.02
10% ethanol20% ethanol
30% ethanol
Figure 4(b). Effect of non- aqueous solvent-ethanol.
Figure 4(c). Effect of non- aqueous solvent-acetone.
- 9 - 8 - 7 - 6 - 5 - 4 - 3 - 2 - 1 0
-0 . 0 9
-0 . 0 8
-0 . 0 7
-0 . 0 6
-0 . 0 5
-0 . 0 4
-0 . 0 3
-0 . 0 2
0 . 0 0
1 0 % a c e t o n e
2 0 % a c e t o n e
3 0 % a c e t o n e
log a Gd
3+
log a Gd
3+
log a Gd
3+
EM
F,
mV
E
MF
, m
V
EM
F,
mV
Potentiometric Sensor for Gadolinium(III) Ion 1149
References 1. Kirk R E and Othmer D F, Encyclopedia of Chemical Technology, Wiley, New York,
1982, 19, p 836.
2. Ramos R L, Rubio L F, Cornado R M G and Barron J M, J Chem Tech Biotechnol.,
1995, 62 , 64.
3. Iglesias M, Antico E and Salvado V, Advances in Ion-Exchange for Industry &
Research, in P A Williams and A Dyer (Eds.) special publication no. 239 of Royal
Society of Chemistry, 1999, p 317.
4. Helfferich F, Ion Exchange, McGraw Hill, New York, 1962.
5. Moller T and Harjula R, Advances in Ion-Exchange for Industry & Research, in
Williams P A and Dyer A (Eds.), Special Publication No. 239 of Royal Society of
Chemistry, 1999, p 276.
6. Greenwood N and Earshaw A, Chemistry of the elements, Pergamon Press, 1984,
p1429, New York.
7. Burgress J, Metal Ion in Solution, Ellis Horwood, Chinchester, 1978.
8. Kraus K A and Philips H O, J. Am. Chem. Soc., 1956, 78, 644.
9. Kraus K A and Philips H O, Carlson T A and Johnson J S, 2nd
UN Conf. Peaceful
Uses At. Energy, Geneva, 1958, 28, 3.
10. Amphlett C B, 2nd
UN Conf. Peaceful Uses At. Energy, Geneva, 1958, 28, 3.
11. Amphlett C B, Inorganic Ion Exchangers, Elsevier, Amsterdam, 1964.
12. Clearfield and Stynes J A, J Inorg Nucl Chem., 1964, 26, 117.
13. Coetzee C J, Ion- Sel Electrod Rev., 1981, 3, 105.
14. Mittal S K, Sharma H K and Kumar S KA, Talanta, 2004, 62 , 801.
15. Mittal S K, Sharma H K and Kumar S K A, Sensors, 2004, 4, 125.
16. Mittal S K and Singh P P, Indian J Chem., 1995, 34A, 1009.
17. Buck R P and Lindner E, Pure Appl Chem., 1994, 66, 2527.
18. Umezawa Y, Umezawa K and Sato L, Pure Appl Chem., 1995, 67 , 507.
19. Jain A K, Singh R P and Bala C, Anal Letter, 1982, 15, 1557.
20. Malik W U, Srivastava S K and Bansal A, Anal Chem., 1982, 54, 407.

Submit your manuscripts athttp://www.hindawi.com
Chromatography Research International
Hindawi Publishing Corporationhttp://www.hindawi.com Volume 2013
Hindawi Publishing Corporationhttp://www.hindawi.com Volume 2013
Carbohydrate Chemistry
International Journal of
Hindawi Publishing Corporationhttp://www.hindawi.com
International Journal of
Analytical ChemistryVolume 2013
ISRN Chromatography
Hindawi Publishing Corporationhttp://www.hindawi.com Volume 2013
Hindawi Publishing Corporation http://www.hindawi.com Volume 2013Hindawi Publishing Corporation http://www.hindawi.com Volume 2013
The Scientific World Journal
Bioinorganic Chemistry and ApplicationsHindawi Publishing Corporationhttp://www.hindawi.com Volume 2013
Hindawi Publishing Corporationhttp://www.hindawi.com Volume 2013
CatalystsJournal of
ISRN Analytical Chemistry
Hindawi Publishing Corporationhttp://www.hindawi.com Volume 2013
ElectrochemistryInternational Journal of
Hindawi Publishing Corporation http://www.hindawi.com Volume 2013
Hindawi Publishing Corporationhttp://www.hindawi.com Volume 2013
Advances in
Physical Chemistry
ISRN Physical Chemistry
Hindawi Publishing Corporationhttp://www.hindawi.com Volume 2013
SpectroscopyInternational Journal of
Hindawi Publishing Corporationhttp://www.hindawi.com Volume 2013
ISRN Inorganic Chemistry
Hindawi Publishing Corporationhttp://www.hindawi.com Volume 2013
Hindawi Publishing Corporationhttp://www.hindawi.com Volume 2013
Journal of
Chemistry
Hindawi Publishing Corporationhttp://www.hindawi.com Volume 2013
Inorganic ChemistryInternational Journal of
Hindawi Publishing Corporation http://www.hindawi.com Volume 2013
International Journal ofPhotoenergy
Hindawi Publishing Corporationhttp://www.hindawi.com
Analytical Methods in Chemistry
Journal of
Volume 2013
ISRN Organic Chemistry
Hindawi Publishing Corporationhttp://www.hindawi.com Volume 2013
Hindawi Publishing Corporationhttp://www.hindawi.com Volume 2013
Journal of
Spectroscopy