
Potential Savings from Biosimilars in Canada - CADTH.ca · 13 biologics which lost or are expected...
14
PMPRB presentation in CADTH Symposium 2017 April 23-25, 2017 Elena Lungu, Manager NPDUIS, PMPRB Lead author: Gary Warwick, Senior Economist, PMPRB Potential Savings from Biosimilars in Canada
Transcript of Potential Savings from Biosimilars in Canada - CADTH.ca · 13 biologics which lost or are expected...

PMPRB presentation in CADTH Symposium 2017 April 23-25, 2017 Elena Lungu, Manager NPDUIS, PMPRB Lead author: Gary Warwick, Senior Economist, PMPRB
Potential Savings from Biosimilars in Canada

2
The PMPRB is an independent quasi-judicial body established by Parliament in 1987 under the Patent Act (Act), with a dual role: Regulatory – To ensure that prices charged by patentees for patented medicines sold in Canada are
not excessive. The PMPRB was created as part of a major overhaul of Canada’s drug patent regime, which sought to balance two policy objectives: The government strengthened patent protection for drugs in an effort to encourage more pharmaceutical
industry research and development investment in Canada. Simultaneously, it sought to mitigate the financial impact of that change on Canadians by creating the PMPRB.
Reporting – To report on pharmaceutical trends of all medicines and on R&D spending by patentees.
NPDUIS is a research initiative established by federal, provincial, and territorial Ministers of Health in September 2001, as a partnership between the PMPRB and the CIHI;
It operates independently from the PMPRB’s regulatory activities; Pursuant to s.90 of the Patent Act, the PMPRB has the mandate to generate analysis that
provides policy makers and public drug plan managers with critical information and intelligence on price, utilization and cost trends.

Agenda
A. Pharmaceutical cycle B. Canada’s experience with biologics C. Biosimilars savings
3

A. Pharmaceutical cycle
4
Period of patent exclusivity followed by competition: For small molecules the substitution
and uptake is often immediate and nearly total at a fraction of the price;
For large molecules the uptake has been slow and the discount moderate;
The pharmaceutical cycle essential for the affordability of new meds: Allows manufactures to recuperate
their cost during patent protection, Post market exclusivity, payers can
redirect investments towards new treatments.
7 out of the top 10 selling drugs were biologics in 2016.
Source: PMPRB CompassRx, 2015/16 Data source: NPDUIS, CIHI

B. Canada’s experience with biologics 13 biologics which lost or are expected to lose patent protection and face biosimilar competition by 2020
Relatively high use and sales compared to foreign markets
Biologics growing market segment Important sales: $24B over 11 years
5
5.6%
8.8%
5.0% 3.4%
15.9%
12.6%
10.9%
6.9%
11.4%
8.9%
6.0%
4.2%
Canada US Other PMPRB7 Other OECD
2006 Select drugs 2016 Select drugs 2016 Top 5 select drugs
$ 0.0B
$ 0.5B
$ 1.0B
$ 1.5B
$ 2.0B
$ 2.5B
$ 3.0B
$ 3.5B
$ 4.0B
2006 2007 2008 2009 2010 2011 2012 2013 2014 2015 2016
Follitropin alfa Natalizumab Omalizumab
Epoetin alfa Bevacizumab Filgrastim
Trastuzumab Rituximab Insulin glargine
Etanercept Ranibizumab Adalimumab
Infliximab
Source: MIDAS™ Database, 2006 to 2015, IMS AG. All rights reserved

C. Biosimilars savings Are a function of:
1. Importance of drugs (e.g. sales) Biologics with larger sales have a greater
biosimilar saving potential 2. Timing of biosimilar market entry Earlier market entry allows for the savings to be
realized sooner 3. Biosimilar uptake (e.g. use)
4. Price discount Greater price discount Greater saving potential
6
Molecule
2016 Canadian
sales
Infliximab $ 1,008M
Adalimumab $ 649M
Etanercept $ 337M
Ranibizumab $ 337M
Insulin glargine $ 259M
Trastuzumab $ 251M
Rituximab $ 241M
Filgrastim $ 128M
Omalizumab $ 106M
Bevacizumab $ 104M
Epoetin alfa $ 99M
Natalizumab $ 50M
Follitropin alfa $ 14M
Increased market penetration of the biosimilar = Greater saving
potential
= Source: MIDAS™ Database, IMS AG. All rights reserved
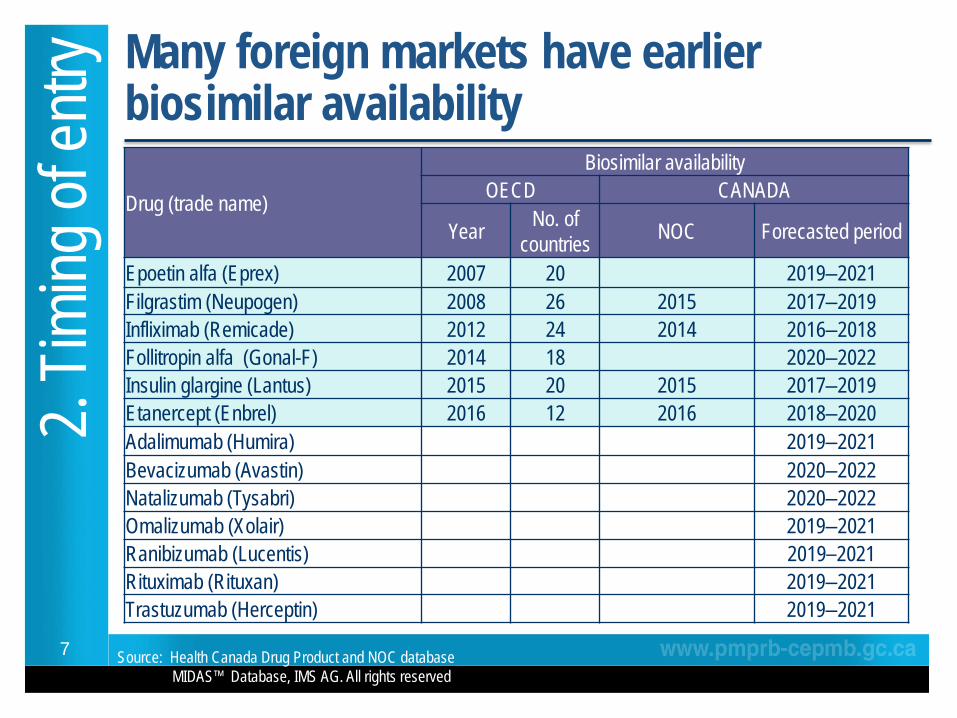
Many foreign markets have earlier biosimilar availability
7
2. Tim
ing of
entry
Drug (trade name)
Biosimilar availability OECD CANADA
Year No. of countries NOC Forecasted period
Epoetin alfa (Eprex) 2007 20 2019‒2021 Filgrastim (Neupogen) 2008 26 2015 2017‒2019 Infliximab (Remicade) 2012 24 2014 2016‒2018 Follitropin alfa (Gonal-F) 2014 18 2020‒2022 Insulin glargine (Lantus) 2015 20 2015 2017‒2019 Etanercept (Enbrel) 2016 12 2016 2018‒2020 Adalimumab (Humira) 2019‒2021 Bevacizumab (Avastin) 2020‒2022 Natalizumab (Tysabri) 2020‒2022 Omalizumab (Xolair) 2019‒2021 Ranibizumab (Lucentis) 2019‒2021 Rituximab (Rituxan) 2019‒2021 Trastuzumab (Herceptin) 2019‒2021
Source: Health Canada Drug Product and NOC database MIDAS™ Database, IMS AG. All rights reserved

International experience with biosimilar uptake
8
3. Bi
osim
ilar u
ptake
Source: MIDAS™ Database, IMS AG. All rights reserved
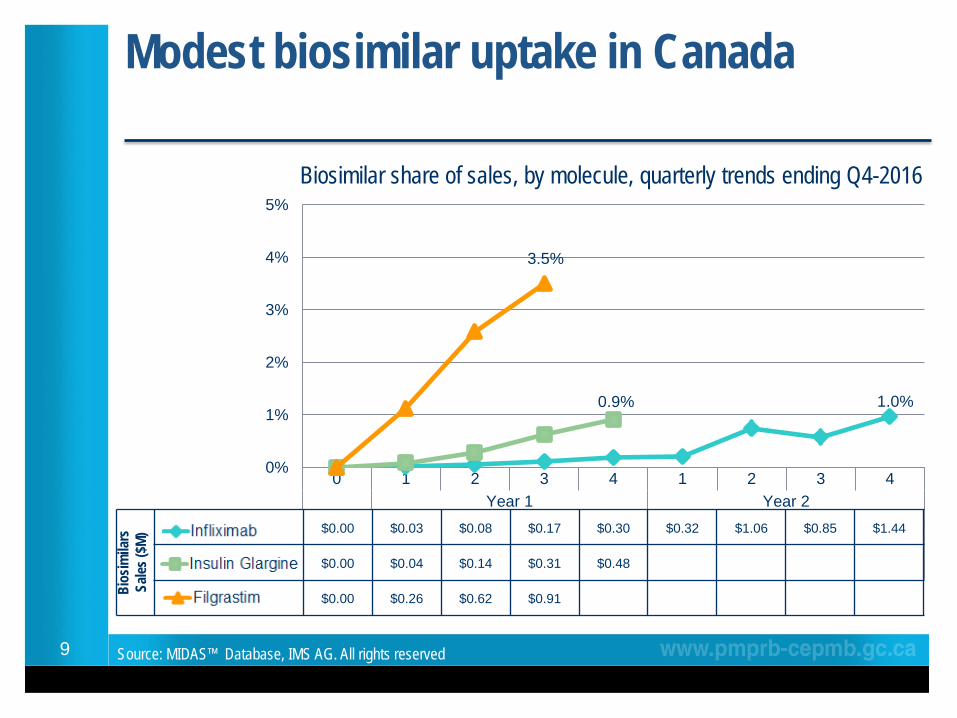
Modest biosimilar uptake in Canada
9
0 1 2 3 4 1 2 3 4Year 1 Year 2
Infliximab 0.0% 0.0% 0.1% 0.1% 0.2% 0.2% 0.7% 0.6% 1.0%Insulin Glargine 0.0% 0.1% 0.3% 0.6% 0.9%Filgrastim 0.0% 1.1% 2.6% 3.5%
1.0% 0.9%
3.5%
0%
1%
2%
3%
4%
5%
Source: MIDAS™ Database, IMS AG. All rights reserved
$0.00 $0.03 $0.08 $0.17 $0.30 $0.32 $1.06 $0.85 $1.44
$0.00 $0.04 $0.14 $0.31 $0.48
$0.00 $0.26 $0.62 $0.91 Bios
imila
rs
Sales
($M)
Biosimilar share of sales, by molecule, quarterly trends ending Q4-2016

Reference price – biosimilar price The infliximab experience
10
47%
4. Bi
osim
ilar d
iscou
nt
Source: Market Intelligence Report: Biologic Response Modifier Agents, 2015, PMPRB, NPDUIS Data source: MIDAS™ Database, IMS AG. All rights reserved
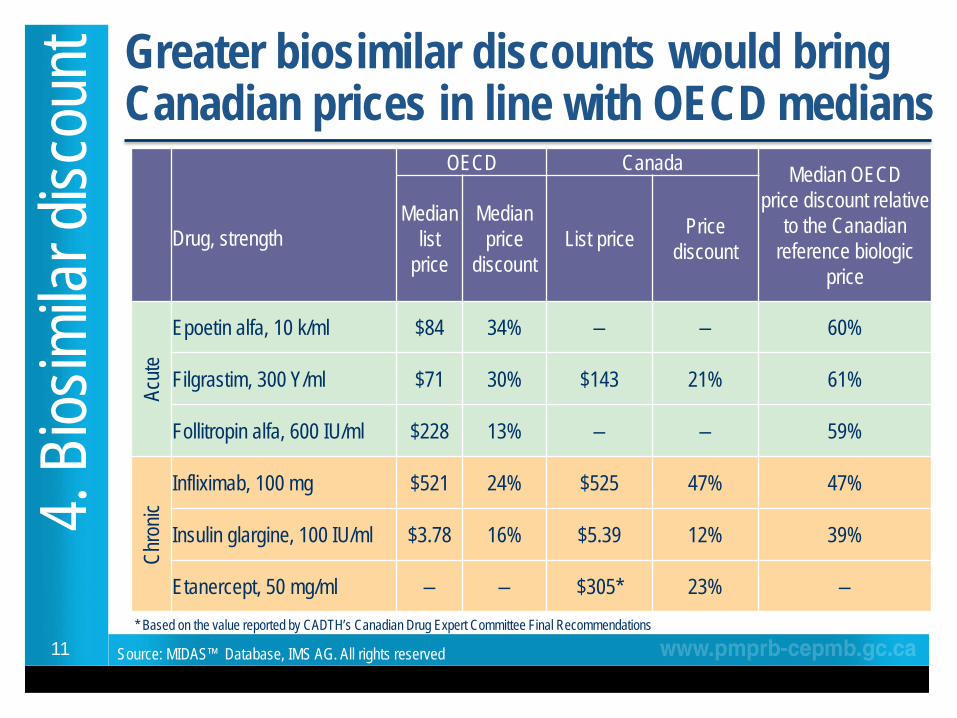
Greater biosimilar discounts would bring Canadian prices in line with OECD medians
11
4. Bi
osim
ilar d
iscou
nt
Drug, strength
OECD Canada Median OECD price discount relative
to the Canadian reference biologic
price
Median list
price
Median price
discount List price Price
discount
Acute
Epoetin alfa, 10 k/ml $84 34% ‒ ‒ 60%
Filgrastim, 300 Y/ml $71 30% $143 21% 61%
Follitropin alfa, 600 IU/ml $228 13% ‒ ‒ 59%
Chro
nic Infliximab, 100 mg $521 24% $525 47% 47%
Insulin glargine, 100 IU/ml $3.78 16% $5.39 12% 39%
Etanercept, 50 mg/ml ‒ ‒ $305* 23% ‒
* Based on the value reported by CADTH’s Canadian Drug Expert Committee Final Recommendations
Source: MIDAS™ Database, IMS AG. All rights reserved

Potential Savings from Biosimilars in Canada
12
Low discount: 25% Avg. uptake: 50%
High discount: 50% High uptake: 85%
Low discount: 25% Avg. uptake: 30%
High discount: 50% High uptake: 85%
Drug 2016 Sales* Forecast Low
estimate High
estimate Year 3 Sales†
Acute 13% savings 43% savings Filgrastim $126M 2019 $145M $18M $62M Epoetin alfa $99M 2021 $75M $10M $32M Follitropin alfa $14M 2022 $20M $3M $8M Chronic 8% savings 43% savings Infliximab $1004M 2018 $1,210M $91M $514M Adalimumab $649M 2021 $974M $73M $414M Etanercept $337M 2020 $347M $26M $147M Ranibizumab $337M 2021 $337M $25M $143M Insulin glargine $241M 2019 $306M $23M $130M Rituximab $241M 2021 $286M $21M $122M Trastuzumab $180M 2021 $202M $15M $86M Bevacizumab $104M 2022 $110M $8M $47M Omalizumab $106M 2021 $184M $14M $78M Natalizumab $50M 2022 $62M $5M $27M
*For the brand name product. † Assuming no biosimilar availability.
Source: PMPRB poster: Potential Savings from Biosimilars in Canada, 2016 Data source: MIDAS™ Database, IMS AG. All rights reserved $0.33B $1.8B

Conclusions A. Pharmaceutical cycle
Beyond patent protection period, drug spending on branded products may mean lost opportunities to fund newer treatment options.
B. Canada’s experience with biologics The relatively higher use of biologics in Canada means Canadians have the most to
gain from potential biosimilar savings. C. Biosimilars savings
Have been modest to date due to the low uptake. At current Canadian price discounts for a number of biosimilars (~25%) and average
OECD uptake (30% by 3rd year), the savings would be limited: 8% or tens of millions of dollars for top-selling biologics.
The price discount of recent biosimilars (15%-23%) has resulted in relatively higher prices in Canada (except for the biosimilar of infliximab);
Greater biosimilar discounts (30%-60%) would result in closer alignment with OECD price levels and greater saving potential;
– At the same time, greater biosimilar uptake (e.g. 85%) could results in savings as high as 43%, or hundreds of millions of dollars for top-selling biologics.
13