Potential Pathogens, Antimicrobial Patterns, and Genotypic ...
41
1 Potential Pathogens, Antimicrobial Patterns, and Genotypic Diversity of Escherichia coli Isolates in Constructed Wetlands Treating Swine Wastewater A. M. Ibekwe* 1 , S. E. Murinda 2 , C. DebRoy 3 , and G. B. Reddy 4 1 USDA-ARS, U.S. Salinity Laboratory, 450 W. Big Springs Rd, Riverside, CA 92507, USA 2 Department of Animal and Veterinary Sciences, California State Polytechnic University, Pomona, CA 91768. USA 3 E. coli Reference Center, Pennsylvania State University, State College, PA. 4 Department of Natural Resources and Environmental Design, North Carolina Agricultural and Technical State University, Greensboro, NC 27411, USA *Corresponding author: A. Mark Ibekwe USDA-ARS-U. S. Salinity Laboratory 450 W. Big Springs Rd Riverside, CA 92507. Phone: 951-369-4828 Fax: 951-342-4964 E-mail: [email protected] Key words: Constructed wetland, Contaminants, E. coli, BOX AIR-1 and, Antimicrobial. Constructed wetland for removal of swine waste FEMS Microbiology Ecology Advance Access published January 10, 2016 by guest on January 11, 2016 http://femsec.oxfordjournals.org/ Downloaded from
Transcript of Potential Pathogens, Antimicrobial Patterns, and Genotypic ...

1
Potential Pathogens, Antimicrobial Patterns, and Genotypic Diversity of Escherichia coli
Isolates in Constructed Wetlands Treating Swine Wastewater
A. M. Ibekwe*1, S. E. Murinda
2, C. DebRoy
3, and G. B. Reddy
4
1USDA-ARS, U.S. Salinity Laboratory, 450 W. Big Springs Rd, Riverside, CA 92507, USA
2Department of Animal and Veterinary Sciences, California State Polytechnic University,
Pomona, CA 91768. USA
3E. coli Reference Center, Pennsylvania State University, State College, PA.
4Department of Natural Resources and Environmental Design, North Carolina Agricultural
and Technical State University, Greensboro, NC 27411, USA
*Corresponding author:
A. Mark Ibekwe
USDA-ARS-U. S. Salinity Laboratory
450 W. Big Springs Rd
Riverside, CA 92507.
Phone: 951-369-4828
Fax: 951-342-4964
E-mail: [email protected]
Key words: Constructed wetland, Contaminants, E. coli, BOX AIR-1 and, Antimicrobial.
Constructed wetland for removal of swine waste
FEMS Microbiology Ecology Advance Access published January 10, 2016 by guest on January 11, 2016
http://femsec.oxfordjournals.org/
Dow
nloaded from

2
Abstract
E. coli populations originating from swine houses through constructed wetlands were analyzed
for potential pathogens, antimicrobial susceptibility patterns, and genotypic diversity. E. coli
isolates (n = 493) were screened for the presence of the following virulence genes: stx1, stx2,and
eae (Shiga toxin-producing E. coli [STEC]), heat-labile enterotoxin (LT) genes and heat stable
toxin STa and STb (enterotoxigenic E. coli (ETEC), cytotoxin necrotizing factors 1 and 2 (cnf1
and cnf2 [necrotoxigenic E. coli- NTEC]), as well as O and H antigens, and the presence of the
antibiotic resistance genes blaTEM, blaSHV, blaCMY-2, tet A, tet B, tet C, mph(A), aadA, StrA/B,
sul1, sul2, and sul3. The commensal strains were further screened for 16 antimicrobials and
characterized by BOX AIR-1 PCR for unique genotypes. The highest antibiotic resistance
prevalence was for tetracycline, followed by erythromycin, ampicillin, streptomycin,
sulfisoxazole, and kanamycin. Our data showed that most of the isolates had high distribution of
single or multi drug-resistant (MDR) genotypes. Therefore, the occurrence of MDR E. coli in the
wetland is a matter of great concern due to possible transfer of resistance genes from
nonpathogenic to pathogenic strains or vice versa in the environment.
Introduction
Constructed wetlands can offer significant benefits to human populations in both developed and
developing countries (Kadlec and Knight, 1996; Ibekwe et al., 2003, Ibekwe et al., 2007).
Benefits include water-quality improvement, water reclamation, conservation of habitat for
species, flood control, recreational and education activities. In the swine production system
wastes are traditionally flushed into an anaerobic lagoon and then later sprayed on agricultural
by guest on January 11, 2016http://fem
sec.oxfordjournals.org/D
ownloaded from
3
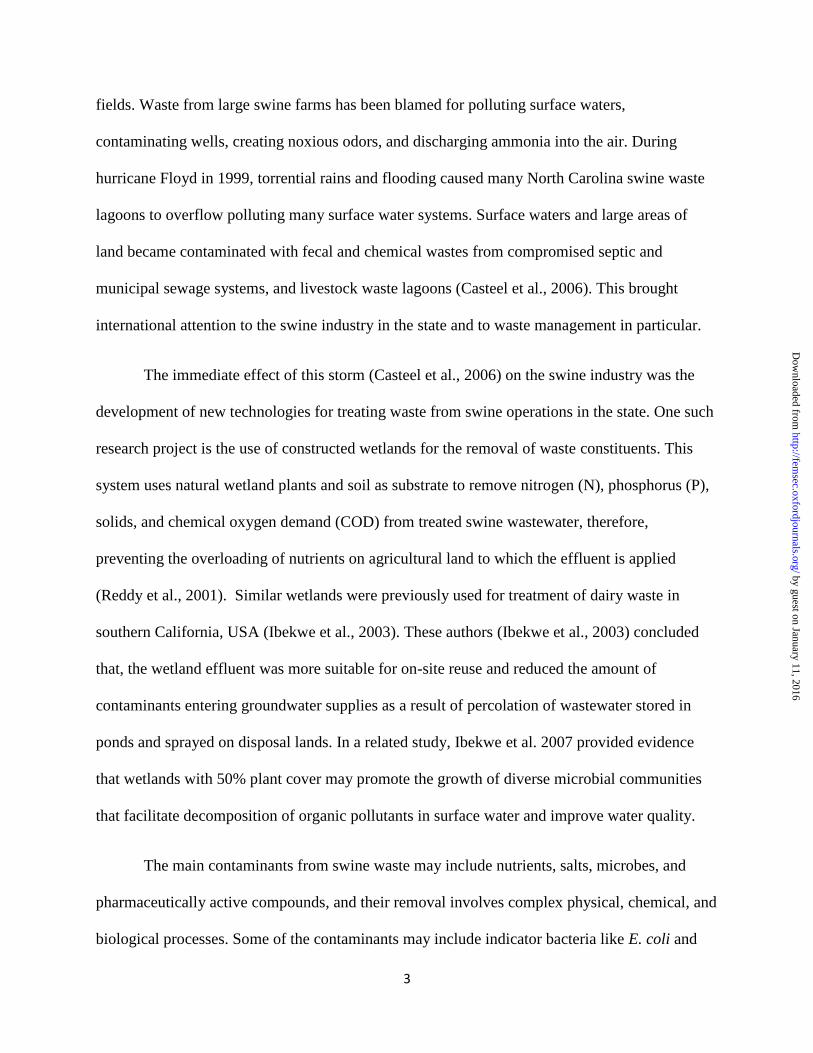
fields. Waste from large swine farms has been blamed for polluting surface waters,
contaminating wells, creating noxious odors, and discharging ammonia into the air. During
hurricane Floyd in 1999, torrential rains and flooding caused many North Carolina swine waste
lagoons to overflow polluting many surface water systems. Surface waters and large areas of
land became contaminated with fecal and chemical wastes from compromised septic and
municipal sewage systems, and livestock waste lagoons (Casteel et al., 2006). This brought
international attention to the swine industry in the state and to waste management in particular.
The immediate effect of this storm (Casteel et al., 2006) on the swine industry was the
development of new technologies for treating waste from swine operations in the state. One such
research project is the use of constructed wetlands for the removal of waste constituents. This
system uses natural wetland plants and soil as substrate to remove nitrogen (N), phosphorus (P),
solids, and chemical oxygen demand (COD) from treated swine wastewater, therefore,
preventing the overloading of nutrients on agricultural land to which the effluent is applied
(Reddy et al., 2001). Similar wetlands were previously used for treatment of dairy waste in
southern California, USA (Ibekwe et al., 2003). These authors (Ibekwe et al., 2003) concluded
that, the wetland effluent was more suitable for on-site reuse and reduced the amount of
contaminants entering groundwater supplies as a result of percolation of wastewater stored in
ponds and sprayed on disposal lands. In a related study, Ibekwe et al. 2007 provided evidence
that wetlands with 50% plant cover may promote the growth of diverse microbial communities
that facilitate decomposition of organic pollutants in surface water and improve water quality.
The main contaminants from swine waste may include nutrients, salts, microbes, and
pharmaceutically active compounds, and their removal involves complex physical, chemical, and
biological processes. Some of the contaminants may include indicator bacteria like E. coli and
by guest on January 11, 2016http://fem
sec.oxfordjournals.org/D
ownloaded from

4
antimicrobials. E. coli are widely used as indicators of fecal contamination of waterways in most
urban and rural areas. They have diverse genotypes and phenotypes, and some characteristics
are shared among strains exposed to similar environments due to selection pressure (Ishii and
Sadowsky, 2008). One method for identifying the diverse genotype in E. coli is the use of BOX
AIR-1 PCR method (Dombek et al., 2000; Lyautey et al., 2010; Chandran and Mazumder, 2015).
This technique is able to identify E. coli isolates with unique fingerprints as well as determine
their diversity in complex environments. The unique fingerprints can further be used to identify
host sources, and to determine the quality of water in a large watershed (Chandran and
Mazumder, 2015). The level of selective pressure exerted on these bacteria in any environment
may be a useful criterion in the evaluation of the quality of that environment as well. One such
tool to assist in examining the selection pressure on E. coli is assessing their antimicrobial
susceptibilities (Graves et al., 2002; Graves et al., 2007).
There are at least 17 classes of antimicrobials approved for use in food animals in the
United States (Anderson et al., 2003). These antimicrobials provide benefits such as improved
animal health, higher productivity, and in some cases, reduction in foodborne pathogens
(Mathew et al., 2007), and other pathogens of public health significance. However, use of
antibiotics for agricultural purposes, particularly for growth enhancement, has come under much
scrutiny throughout the world, as it has been shown to contribute to the increased prevalence of
antibiotic-resistant bacteria of public health significance (Mathew et al., 2007). In 2003, the FDA
directly addressed the issue of risks associated with use of antibiotics in food animals with the
release of the Guidance for Industry 152 (www.fda.gov/cvm), which outlined steps for risk
assessment in the evaluation of new animal drugs in terms of microbial food safety (FDA 2003).
by guest on January 11, 2016http://fem
sec.oxfordjournals.org/D
ownloaded from

5
The presence of antibiotics in the environment at certain concentrations has been
associated with chronic toxicity and the prevalence of resistance to antibiotics in bacterial
species has been recognized as a major threat to public health (Schwartz et al., 2006; Kummerer,
2009). It is now recognized that antibiotics constitute a new class of water contaminants of
emerging concern with adverse effects on aquatic life (Kummerer, 2009; Fatta-Kassinos et al.,
2011; Kolpin et al., 2002; Michael et al., 2013). The number of studies focusing on the use of
constructed wetlands for the removal of antibiotics or antibiotic resistant genes is very limited
(Sidrach-Cardona and Bécares, 2013). These authors (Sidrach-Cardona and Bécares, 2013)
concluded that hydraulic design and presence of plants were extremely important in reducing
total numbers of bacteria, which was related to the total numbers of antibiotic resistant bacteria.
Therefore, higher bacterial removal in constructed wetlands may result in lower antibiotic
resistant bacteria loadings to the environment. Unfortunately, many countries focus monitoring
of antibiotic resistance in the clinical environments such as hospitals, with special emphasis on
pathogenic bacteria, while aquatic ecosystems receive much less attention, although they might
be the reservoirs of the resistances (Servais and Passerat, 2009).
The present study looks at potential E. coli pathogens, antimicrobial susceptibilities, and
genetic diversity of isolates in surface flow constructed wetland systems used for treating swine
waste. Our main objectives were to examine the presence of potential pathogens of E. coli and
quantify antibiotic resistant E. coli from the wetland system, and describe their diversity in
different configurations of constructed wetlands (Fig S1). The overall goal of this constructed
wetland system is to have final effluent water that is suitable for on-site reuse and with reduced
amounts of contaminants entering the environment.
Materials and methods
by guest on January 11, 2016http://fem
sec.oxfordjournals.org/D
ownloaded from

6
Experimental site
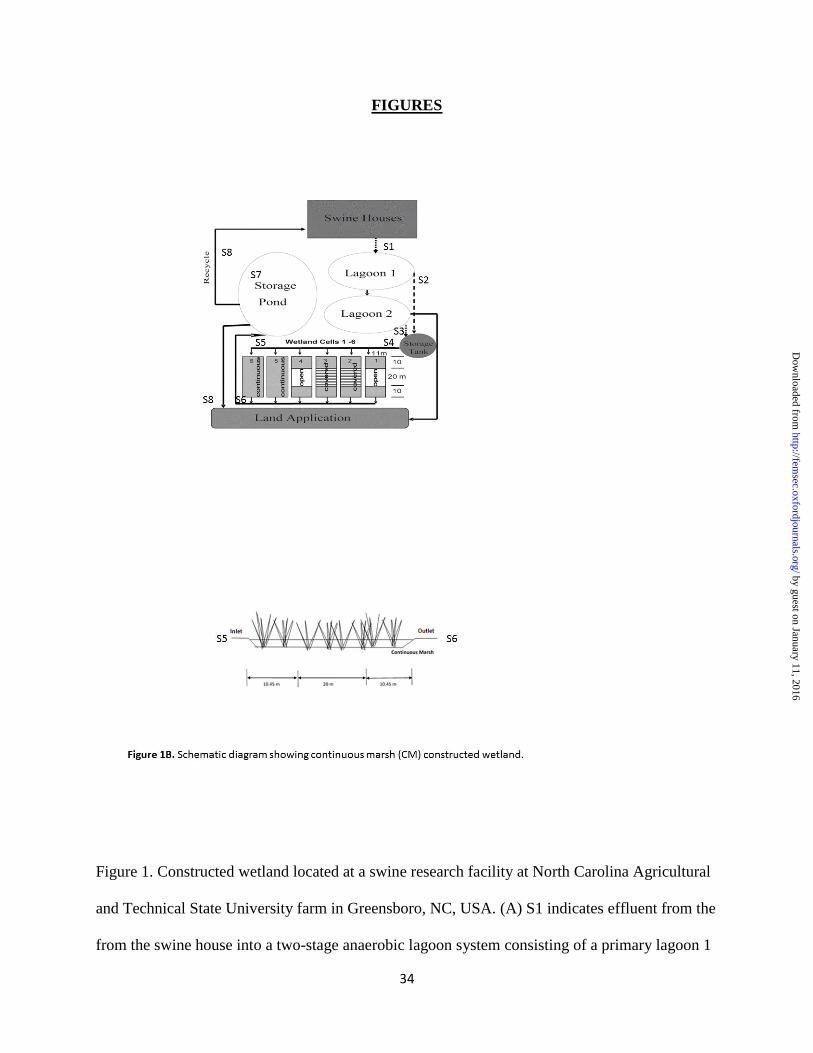
The experimental site was a constructed wetland located at a swine research facility at North
Carolina Agricultural and Technical State University farm in Greensboro, NC, USA. The
wetland has six cells 40 m long by 11 m wide and was constructed in 1995 (Fig. 1A). Each cell
consisted of 11 m by 10 m marsh at both influent and effluent and 11 m by 20 m pond section
separating the marshes and planted with Typha latifolia L. (broadleaf cattail) and Scirpus
americanus (bulrush) in March 1996 (Reddy et al., 2001). The marsh and pond sections of
wetlands (cells 1-4 Fig. 1A) have previously been described (Reddy et al., 2001). In 2003,
modifications on cells 5 and 6 (Forbes et al., 2010) were done to achieve a continuous marsh
system with a slope of 0.33%, from inlet to outlet end and planted with giant bulrushes (Scirpus
californicus) (Fig.1B). This study focused on the evaluation of the modifications with the aim of
understanding the role of microorganisms in the constructed wetland with continuous marsh.
Waste flow from the swine houses was flushed with recycled water into a two-stage anaerobic
lagoon, and the flow from the lagoon was pumped into a storage tank as described before (Dong
and Reddy, 2010). The wastewater from the storage tank was discharged by gravity into the
wetland cells, and the final effluent from the wetland was discharged into a storage pond for
recycling into the swine house or application on land.
During the study, the number of pigs used from January 2007 to January 2012 ranged
between 65 and 115. Furthermore, the following antibiotics were used for sub-therapeutic and
therapeutic treatments and were always added through water supply: penicillin, tylosin tartrate,
lincomycin hydrochloride, ceftiofur hydrochloride, and liquamycin. Feeding regiment included
crude protein, lysine, crude fat, crude fiber, calcium, phosphorus, salt, selenium, and zinc at
different ratios during different production stages (growers, finishers, gestation, and lactation).
by guest on January 11, 2016http://fem
sec.oxfordjournals.org/D
ownloaded from

7
Sampling design
To detect the spatial and temporal variation of E. coli, isolates from the wetland samples were
collected from eight different points in the wetland in April, August, and November 2010. The
first sample (S1) was the flow from the swine house into a two-stage anaerobic lagoon system
consisting of a primary lagoon 1 (S2) with overflow into a secondary lagoon 2 (S3) that flows to
the storage tank (S4). Wastewater from the 8000 L storage tank was discharged by gravity to
each continuous wetland cell influent for sampling point S5. The final effluent samples (S6)
from the continuous marsh cells were discharged into a storage pond (S7) where it was recycled
for flushing of the swine production facility and for land application (S8). All samples were
maintained on ice until arrival in the laboratory and then stored at 4 oC for further analysis.
Samples were analyzed for ammonia (NH+
4-N), nitrate (NO3-N), total-phosphate (TP) and
available-phosphate (PO43-
) using a flow injection analysis instrument (Lachat-QuikChem 8000,
Loveland, CO, USA). Carbon (C) and nitrogen (N) concentrations were measured using the
Perkin–Elmer 2400, CHNS/O series II Analyzer (Shelton, CT, USA).
Enumeration E. coli
Water samples were processed in the laboratory and analyzed by adding 100 mL of a water
sample to a Colilert vessel (Westbrook, Maine, USA) and processing following the
manufacturer’s protocol. E. coli populations were enumerated and expressed as Most Probable
Number (MPN/100 mL). For isolation of E. coli colonies from Colilert vessels, 100 μL liquid
sample was removed from positive wells, then spread plated onto Chromagar ECC agar
(CHROMagar Microbiology, Paris, France), and incubated at 37 °C for 24 h. Individual colonies
of pure cultures that were isolated were stored at –80 °C for further characterization following
the manufacturer’s protocol in accordance with method 9223 (Eaton et al., 1998).
by guest on January 11, 2016http://fem
sec.oxfordjournals.org/D
ownloaded from
8
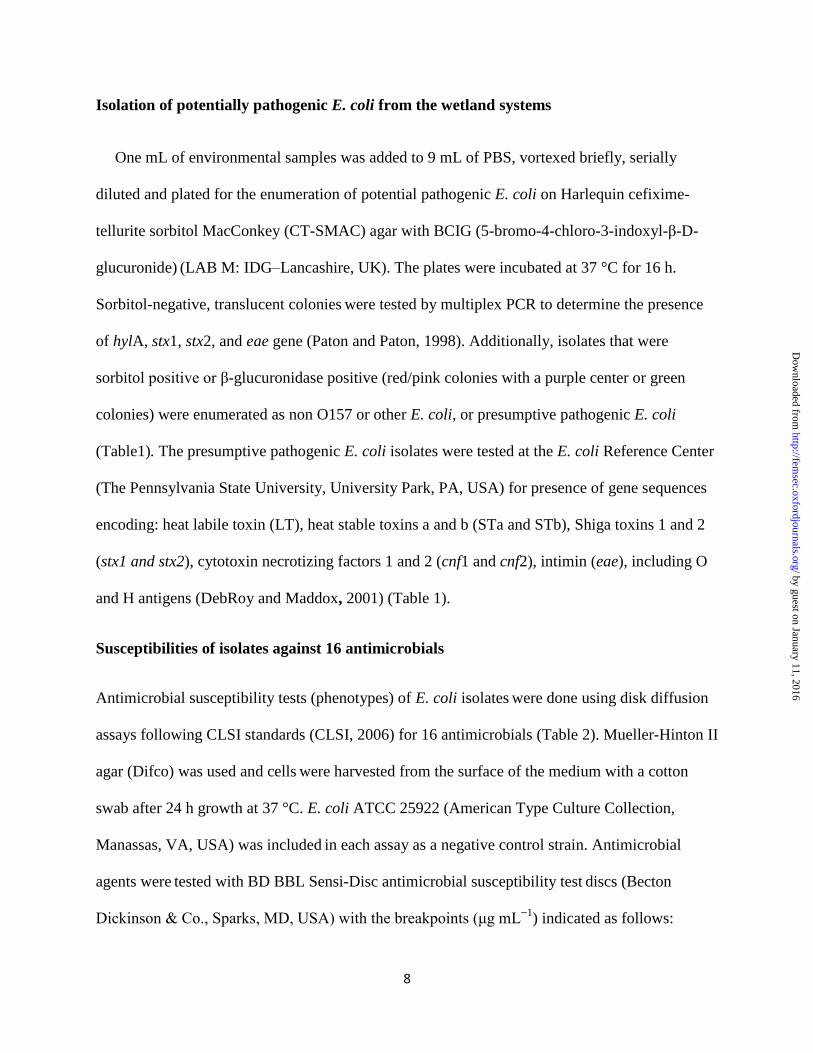
Isolation of potentially pathogenic E. coli from the wetland systems
One mL of environmental samples was added to 9 mL of PBS, vortexed briefly, serially
diluted and plated for the enumeration of potential pathogenic E. coli on Harlequin cefixime-
tellurite sorbitol MacConkey (CT-SMAC) agar with BCIG (5-bromo-4-chloro-3-indoxyl-β-D-
glucuronide) (LAB M: IDG–Lancashire, UK). The plates were incubated at 37 °C for 16 h.
Sorbitol-negative, translucent colonies were tested by multiplex PCR to determine the presence
of hylA, stx1, stx2, and eae gene (Paton and Paton, 1998). Additionally, isolates that were
sorbitol positive or β-glucuronidase positive (red/pink colonies with a purple center or green
colonies) were enumerated as non O157 or other E. coli, or presumptive pathogenic E. coli
(Table1). The presumptive pathogenic E. coli isolates were tested at the E. coli Reference Center
(The Pennsylvania State University, University Park, PA, USA) for presence of gene sequences
encoding: heat labile toxin (LT), heat stable toxins a and b (STa and STb), Shiga toxins 1 and 2
(stx1 and stx2), cytotoxin necrotizing factors 1 and 2 (cnf1 and cnf2), intimin (eae), including O
and H antigens (DebRoy and Maddox, 2001) (Table 1).
Susceptibilities of isolates against 16 antimicrobials
Antimicrobial susceptibility tests (phenotypes) of E. coli isolates were done using disk diffusion
assays following CLSI standards (CLSI, 2006) for 16 antimicrobials (Table 2). Mueller-Hinton II
agar (Difco) was used and cells were harvested from the surface of the medium with a cotton
swab after 24 h growth at 37 °C. E. coli ATCC 25922 (American Type Culture Collection,
Manassas, VA, USA) was included in each assay as a negative control strain. Antimicrobial
agents were tested with BD BBL Sensi-Disc antimicrobial susceptibility test
discs (Becton
Dickinson & Co., Sparks, MD, USA) with the breakpoints (μg mL−1
) indicated as follows:
by guest on January 11, 2016http://fem
sec.oxfordjournals.org/D
ownloaded from

9
amoxocillin/clavulanic acid, 20/10 μg mL−1
, ampicillin, 10 μg mL−1
, azithromycin, 15 μg mL−1
,
cefoxitin, 30 μg mL−1
, ceftriaxone, 30 μg mL−1
, ceftiofur 30 μg mL−1, cephalothin, 30 μg mL−1
,
erythromycin, 15 μg mL−1
, gentamicin 120/10 μg mL−1
, penicillin, 10 μg mL−1
, kanamycin, 30
μg mL−1
, trimethoprim/sulfamethoxazole, 1.25/23.75 μg mL−1
, sulfisoxaxole, 250 μg mL−1
,
ciprofloxacin, 5 μg mL−1
, streptomycin, 10 μg mL−1
, and tetracycline, 30 μg mL−1
.
Antimicrobial resistance gene detection
Multiplex PCR screens were performed on the E. coli isolates targeting sequences of genes
encoding for ampicillin resistance (blaTEM, blaSHV, blaCMY-2), tetracycline resistance (tetA, tetB,
and tetC), streptomycin resistance (aadA, StrA/B), erythromycin (mph(A)), and sulfisoxazole
(sul1, sul2, and sul3). Details of primers, annealing temperatures, and amplicon sizes are as
previously provided (Kozak et al., 2009; Nguyen et al., 2009). The multiplex PCR screens were
performed using 25 μl mixtures and Ready-To-Go PCR beads (Pharmacia Biotech Inc. NJ).
Typing of E. coli using BOXAIR-1
Genomic DNA fingerprinting of E. coli isolates was performed using procedures described
previously by others (Dombek et al., 2000; Lyautey et al., 2010; Chandran and Mazumder, 2015).
Box-PCR fingerprints were obtained by using primer BOX AIR (Versalovic et al., 1998;
Rademaker and de Bruijn, 1997). Following amplification, the PCR amplicons were
electrophoresed, and the gel images were obtained using a quality one gel imaging system (Bio-
Rad Lab., Hercules, CA, USA). Comparison of restriction enzyme digestion patterns and cluster
analysis was performed with the BioNumerics software, version 5.0 (Applied Maths, Austin, TX,
USA). Fingerprints were clustered using the Jaccard similarity coefficients evaluated by the
unweighted pair-group method using arithmetic averages (UPGMA).
by guest on January 11, 2016http://fem
sec.oxfordjournals.org/D
ownloaded from

10
Analysis of E. coli genotyping
E. coli isolates were analyzed temporally and spatially as previously described (Goto and Yan,
2011; Chandran and Mazumder, 2015) using BOX AIR -PCR DNA fingerprinting. Briefly, the
total number of unique E. coli genotypes was calculated, the distribution of the genotypes,
Shannon diversity indices (H'), and the occurring frequencies in the wetland samples were
determined using Jaccard similarity coefficients and UPGMA. The BOX AIR -PCR DNA
fingerprints of E. coli isolates at all sampling sites over the sampling period were used in a single
clustering analysis to identify unique genotypes and Shannon diversity indices (H'). The level of
reoccurrence of particular genotypes at the same sampling sites at different sampling dates was
determined. To construct genotype accumulation curves, the unique genotypes and their
abundances (i.e., how many isolates share the same genotypes) were calculated and analyzed.
Statistical analysis
All analyses were performed in duplicate, and analysis of variance (ANOVA) was conducted
with log10-transformed density of E. coli bacteria using SAS version 9.1 (SAS, 2009) to
determine statistically significant differences, and Tukey’s studentized test range (HSD) was
used for mean separation. Shannon diversity index (H') was used to calculate genetic diversity as
previously described (Chandran and Mazumder, 2015):
by guest on January 11, 2016http://fem
sec.oxfordjournals.org/D
ownloaded from

11
where S is the number of unique genotypes and pi is the number of isolates sharing the same
genotype, i, over the total number of isolates.
Results
E. coli isolates from wetland samples.
To assess the spatial and temporal variations of E. coli populations, isolates were obtained from
effluent from the swine house (S1) and wetland effluent (S2-S8) during March, August, and
November from a surface flow constructed wetland (Fig. S1A) with continuous marsh (CM-
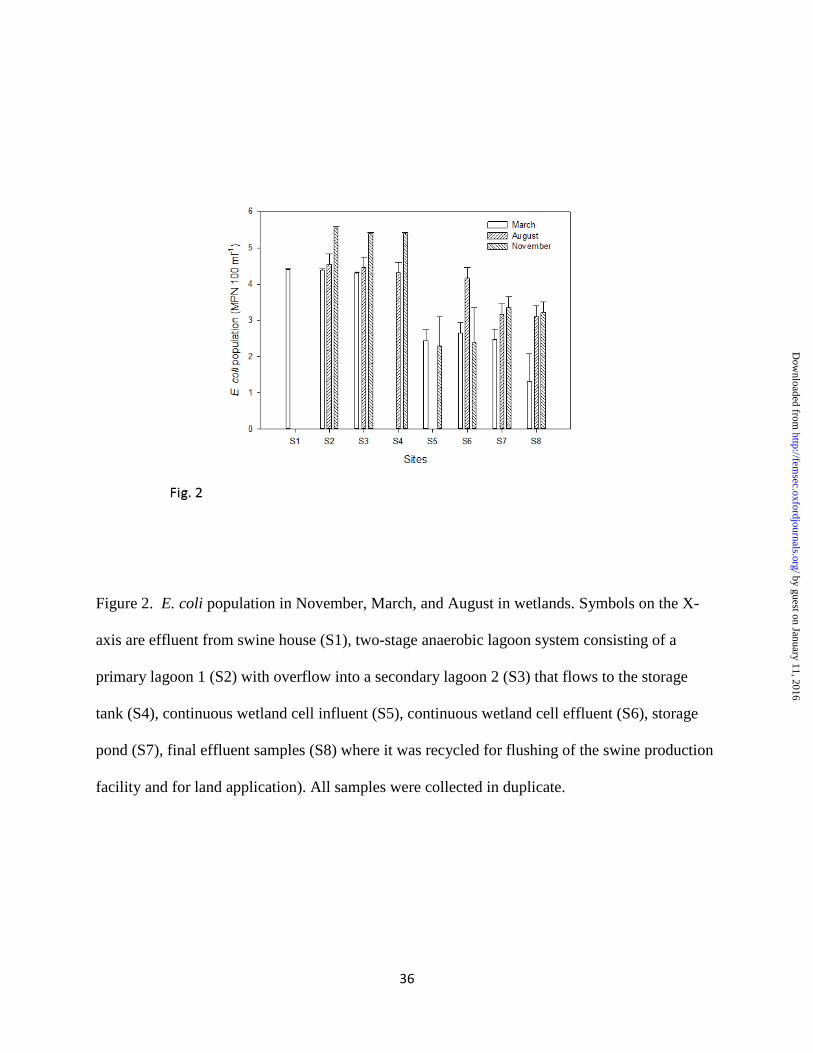
Fig.1B). E. coli populations were significantly (P = 0.022) higher in November than in March
and August (Fig.2) in the lagoon 1 &2 (S2 & S3), and storage tank (S4). However, no significant
differences were found in other cells. Spatially, there was a significant drop in E. coli
populations from wetland influent (S1- swine house) to the final effluent (S8 - final effluent).
Potential pathogenic E. coli
A total of 72 isolates (Table 1) were screened with Harlequin cefixime-tellurite sorbitol
MacConkey (CT-SMAC) agar with BCIG (5-bromo-4-chloro-3-indoxyl-β-D-glucuronide) to
enumerate potentially pathogenic E. coli isolates, and these isolates were rescreened by PCR for
various virulence factors. These isolates were sent to Pennsylvania State University E. coli
Reference Center for complete typing (Table 1). Only 15% of the isolates (11) carried the stx2
gene, none carried stx1 and 20% of the isolates (15) carried eae genes. However, none of the
isolates with eae genes co-carried stx2 genes. The rest were classified as other pathotypes, such
as enterotoxigenic E. coli (ETEC) due to the presence of heat labile or heat stable genes.
by guest on January 11, 2016http://fem
sec.oxfordjournals.org/D
ownloaded from

12
Furthermore, 72% of the isolates carried either/or the heat stable toxins a and b (sta/stb) genes
reflecting that these are enterotoxigenic strains.
When the 72 isolates were analyzed for the presence of resistance genes in relation to
various virulence factors, 66 isolates (92%) with the H antigen were resistant to at least one out
of the twelve resistant genes tested (Table 1). For example, 11 isolates were positive for stx2 and
all were positive to genes for ampicillin resistance blaCMY-2
, 8 were positive to genes for
streptomycin resistance (aadA), and 9 were positive to tetA. Overall, 40.2% of the 72 isolates
were resistant to blaTEM, 44.4% to aadA, 53% to tetB, and 18% to strA/B.
Antimicrobial susceptibility profiles of E. coli isolates from wetland
Sixteen antimicrobials were used for susceptibility tests of the remaining 421 E. coli isolates.
Most isolates were resistant to tetracycline (67.46%), followed by erythromycin (25.42%),
ampicillin (22.33%), streptomycin (18.53%), sulfisoxazole (16.63%), and kanamycin (6.89%)
(Fig. 3). The rest of the antibiotics had <5% resistance rates. E. coli isolates were subsequently
characterized for MDR profiles, i.e., resistance to more than one antimicrobial (Table 2). The
antimicrobials associated with most MDR were tetracycline with 195 isolates (46.3%),
ampicillin with 88 isolates (20.9%), erythromycin with 85 isolates (20.2%), streptomycin with 77
isolates (18.3%), and sulfisoxazole with 69 isolates (16.4%). Isolates resistant to the rest of the
antibiotics were <10%. Detailed examination of each section of the wetland and the number of E.
coli isolates resistant to more than one antimicrobial showed that 42.1 % (24) of E. coli isolates
showed resistance to tetracycline and other antimicrobials in the swine house effluent and the
high resistant levels of isolates to tetracycline continued to the final effluent (11.8). Based on
our data, tetracycline produced the highest percent resistant phenotype in this wetland in the final
by guest on January 11, 2016http://fem
sec.oxfordjournals.org/D
ownloaded from

13
effluent followed by erythromycin (8.8%), and streptomycin (5.9%). One isolate (2.9%) each
were resistant to sulfisoxazole and nalidixic acid at the wetland effluent. The final effluent did
not contain isolates carrying resistance to ampicillin and kanamycin as did many isolates with
MDR at the swine house effluent.
Prevalence of antimicrobial resistance genes
Antimicrobial resistance genes were analyzed in 421 E. coli isolates collected from the
wetland (Fig. 4). Multiplex PCR detected resistance genes for ampicillin (blaTEM, blaSHV, blaCMY-
2), tetracycline (tetA, tetB, and tetC), streptomycin (aadA, StrA/B), erythromycin (mphA), and
sulfisoxazole (sul1, sul2, and sul3) in some of the isolates (Fig.4). Antibiotic resistant E. coli
isolates predominantly carried tetB (51%), and tetA (27%) genes. The second most predominant
resistance genes were for streptomycin, with 33% of isolates carrying aadA gene and 28 %,
StrA/B genes. About 27% of the isolates carried genes for ampicillin resistance (blaTEM) and
12% for blaCMY-2 while none had sequences for blaSHV. Sulfisoxazole (sul2, sul3) genes were
detected at lower levels than genes for tetracycline, streptomycin, and ampicillin (Fig 4).
Genetic diversity of E. coli isolates with BOX AIR-PCR.
E.coli isolates with fingerprint patterns similarity above 90% were considered clonal populations
and were subtyped using BOX AIR DNA fingerprinting with Jaccard similarity coefficients and
UPGMA (Fig. 5 with the dotted line representing the 90% cutoff point). All isolates (n = 421)
were grouped into 176 unique genotypes with Shannon diversity index (H') of 4.78 (Table 3).
The distributions of 176 unique genotypes and their detection frequencies, i.e., number of
by guest on January 11, 2016http://fem
sec.oxfordjournals.org/D
ownloaded from

14
isolates per genotype is shown in Figure 6. Temporal variation of E. coli genotypes showed
samples collected during March, August, and November from wetland effluent and analyzed by
BOX AIR-PCR (Fig.7). The E. coli isolates were fingerprinted and clustered to identify unique
genotypes and their diversity. During late winter (March) 244 isolates with 83 unique genotypes
were obtained with genetic diversity (H') of 3.96, followed by autumn sampling in November,
with 111 isolates, 60 unique genotypes, and H' of 3.93. However, during the summer (August)
fewer numbers of isolates (57) were obtained with 41 unique genotypes and a Shannon diversity
index (H') of 3.58 (Table 3). The frequencies of obtaining a unique E. coli genotype, as indicated
by ratios of genotypes versus isolates, were 0.32, 0.67 and 0.54 for isolates collected in March,
August and November, respectively.
In order to determine spatial variations of E. coli genotypes, distribution of genotypes among the
eight sampling point and their detection frequencies (i.e., the number of isolates per genotype) at
different point and their diversities were obtained (Table 4). A total of 135 isolates were
analyzed from swine house effluent (S1) with 69 unique genotypes and H' of 3.96. The
frequencies of obtaining a unique E. coli genotype, as indicated by ratios of genotypes versus
isolates (Goto and Yan, 2011), were 0.51(H' 3.96) for isolates from S1, 0.63 for isolates from S2,
0.73 for isolates from S3), 0.73 for isolates from S4, 0.25 for isolates from S5, 0.37 for isolates
from S6 0.47 for storage pond isolates (S7), and 0.21 for the final effluent isolates that was
spread on land (S8). Genetic diversity of E. coli isolates decreased from the swine house to the
final effluent (Table 4). As shown, genetic diversity was lower from continuous marsh influent
(S5) to the final effluent (S8) than from the swine house to the storage tank. There was a two to
three fold reduction in the number of unique genotypes and diversity between the storage tank
and the final effluent in comparison to genotype ration obtained from the first four sampling
by guest on January 11, 2016http://fem
sec.oxfordjournals.org/D
ownloaded from

15
points of the wetland. The net effect of the wetland seems to suggest a more clonal population
towards the final effluent with low diversity and low frequency ration (Table 4).
Discussion
Pathogenicity and antimicrobial characteristics
Constructed wetlands are known to reduce E. coli populations between the wetland influent
and effluent significantly. Higher bacterial removal in constructed wetlands, therefore, means
much lower antibiotic resistant bacteria loadings to the environment (Sidrach-Cardona and
Bécares, 2013). This may result in significant reduction in the emergence of pathogenic MDR
bacteria (Frigon et al., 2013; Call et al., 2003), contamination of ground and surface waters, soils,
and crops by waste containing antimicrobials and resistant microorganisms. Many E. coli strains
isolated from our wetland carried heat-stable enterotoxin a and b (STa and STb)-encoding genes
which are characteristic of ETEC (Table 1). Other studies have shown high prevalence of STa
and STb-encoding genes from E. coli samples isolated from swine (Chapman et al., 2006) and
greater reduction of potentially pathogenic E. coli from waste water treatment (Frigon et al.,
2013; Pereira et al., 2013).
Most fecal bacteria released by animals into the environment may carry antibiotic resistance
genes (Durso et al., 2012). Their fate and the transfer of antibiotic resistances by gene transfer to
other bacteria are of great concern to human health (Normark and Normark, 2002). A number of
studies have measured antibiotic resistance in animal production environments (Haley at al.,
2012; Brichta-Harhay et al., 2011), and the general public perception is that agricultural
environments have more antibiotic resistance than natural and non-agricultural
by guest on January 11, 2016http://fem
sec.oxfordjournals.org/D
ownloaded from

16
environments. However, a close examination of current research data suggests that these may all
be perceptions, and that in many watersheds non-agricultural environments may produce the
same or higher antibiotic resistant bacteria (Ibekwe et al., 2011; Storteboom et al., 2010ab;
Pruden et al., 2006; Pruden et al., 2012; McKinney et al., 2012; Berendonk et al., 2015) in the
absence of antibiotic challenges. Pathogens with increased resistances may be transported from
the animal via feces or other mechanisms into rivers and groundwater (Aarestrup et al., 2000)
where the water is used as a source for domestic water supply. This was confirmed by our recent
study with 600 isolates of generic E. coli from a southern California watershed (Ibekwe et al.,
2011). Resistance genes are often associated with integrons or mobile DNA elements such as
plasmids and transposons that facilitate the integration and spread of resistance genes (Jacoby.
1994; Murinda et al., 2005; Tenover and Rasheed, 1998). More often, there is a linkage between
many of these resistance genes on mobile elements and the distribution of antibiotic resistant
bacteria in the environment (Gow et al., 2008; Sharma et al., 2008; Smith et al., 2002).
Therefore, pathogens with increased resistances may be transported from animals via feces into
rivers and ground water (Baquero et al., 2008).
In a study to determine the impact of nontherapeutic use of antibiotics on swine manure-
impacted water sources, surface water and groundwater situated up and down the gradient from a
swine facility were assessed for antibiotic-resistant enterococci and other fecal indicators
(Sapkota et al., 2007). The median concentrations of enterococci, fecal coliforms, and
Escherichia coli were 4 to 33 fold higher in down-gradient versus up-gradient surface water and
groundwater. Higher numbers of erythromycin- and tetracycline-resistant enterococci were
detected in down-gradient surface waters. These findings demonstrated that water contaminated
with swine manure could contribute to the spread of antibiotic resistance in the environment. We
by guest on January 11, 2016http://fem
sec.oxfordjournals.org/D
ownloaded from

17
also observe high levels of resistance to tetracycline and streptomycin in our study from the
swine wetlands, suggesting the need for the treatment of swine waste before disposal. Other
antibiotics that showed high resistance rates in our isolates were sulfisoxazole and ampicillin
(Fig. 4). In general, swine exposed to antibiotic treatments seem to show higher percentages of
E. coli isolates resistant to one or more antibiotics (Anderson et al., 2003). However, many
efforts have been undertaken to control the spread of contaminants from animal waste to surface
and ground waters, especially where concentrated animal feeding operations are located (Ibekwe
et al., 2012).
Genetic diversity of E. coli population
E. coli were enumerated throughout the wetland during March, August, and November to capture
the population densities and genetic structure during winter, summer, and autumn seasons. The
data obtained showed both spatial and temporal behavior of E. coli throughout the three seasons
in the wetland (Fig. 2). E. coli populations from influent were significantly higher than those
from effluent of the wetland ranging from 5·5 log10 MPN 100 ml−1
for influent and 3.5 log10
MPN 100 ml−1
for the final effluent. Others have reported the typical enteric bacteria removal
between 1 and 3 log10 from constructed wetlands (Vymazal and Kropfelova 2008; Graves and
Weaver, 2010; Steer et al., 2002). Our results are in agreement with the above studies from the
wetland described (Reddy et al., 2001; Dong and Reddy, 2010; Poach et al., 2004). Previous
authors using this wetland associated the decreased bacterial counts with spatial nutrient content
differences in the wetland where the concentrations of TN, NH+
4, TP and PO3-
4 decreased from
influent to effluent of the wetland. Our previous study with subsurface constructed wetland also
showed a 99% decrease in total and fecal coliform and a 98% decrease in E. coli, and these
by guest on January 11, 2016http://fem
sec.oxfordjournals.org/D
ownloaded from

18
reductions were significantly correlated with decreases in TN, NH+
4, TP and PO3-
4 from influent
to effluent in the wetland (Ibekwe et al., 2003). The most significant reduction started occurring
in continuous mash wetland cells (S5) where there are likely interactions of microbial activities
with wetland plants where most of the nutrients like N and P are broken down through
nitrification and other processes. The concentration of E. coli in the final effluent (S7) was
significantly lower especially during March for final application to pasture or to recycle into the
swine house.
E. coli isolates used in this study were subsequently characterized temporally and
spatially to understand the effects of season and wetland cells on genetic diversity of the
population. It has been reported that at the temporal scale, changes in E. coli composition in
surface water could be a consequence of seasonal fecal population structure change with summer
populations derived from numerous sources than winter populations (Whitman et al., 2008;
Lyautey et al., 2010). More importantly, fecal E. coli communities are known to change during
the lifetime of animals, or to be influenced by diet which may also vary with seasons. In this
study higher diversity was observed in spring and autumn months (March and November) than
during the summer month (March). However, in March higher numbers of isolates were found in
each genotype than in August and November (Table 3). Changes in E. coli diversity associated
with seasons had been well documented in water communities (Goto and Yan, 2011; Duriez and
Top, 2007; Russell et al., 2000), but little has been done in constructed wetlands. In fact, most of
the studies in constructed wetlands seem to focus on enteric bacterial populations at the effluent
level since this is used for water quality measurements.
In summary, constructed wetlands may provide adequate means to minimize pathogens in
waste water and to minimize their cell numbers in rivers and groundwater and to improve water
by guest on January 11, 2016http://fem
sec.oxfordjournals.org/D
ownloaded from

19
quality as a whole. In this study, the significant reduction of E. coli between influent and effluent
water samples is a prime example, and this will also reduce the number of pathogens/bacteria
with ARGs that may enter surface water from animal waste. Their fate and transfer of antibiotic
resistances by gene transfer to other bacteria are of great concern to human health, and therefore,
any strategy that reduces the transfer of antibiotics or ARGs from sources should be the first
option in any mitigation program. Therefore, the use of low-cost technical solutions, such as
constructed wetlands and other educational activities for water quality improvements must be
encouraged at all levels in every society from developed to developing countries.
Acknowledgment
We thank Damon Baptista for technical assistance.
FUNDING
This research was supported by the 214 Manure and Byproduct Utilization Project of the USDA-
ARS. Mention of trademark or proprietary products in this manuscript does not constitute a
guarantee or warranty of the product by the USDA and does not imply its approval to the
exclusion of other products that may also be suitable.
References
Anderson AD, Nelson JM, Rossiter S, and Angulo FJ. 2003. Public health consequences of
use of antimicrobial agents in food animals in the United States. Microbial Drug Resist
2003; 9: 373-379.
Aarestrup FM, Kruse H, Tast E, Hammerum AM, Jensen LB. Associations between the use
by guest on January 11, 2016http://fem
sec.oxfordjournals.org/D
ownloaded from
20
of antimicrobial agents for growth promotion and the occurrence of resistance among
Enterococcus faecium from broilers and pigs in Denmark, Finland, and Norway.
Microbial Drug Resist 2000; 6: 63–70.
Baquero F, Martınez J-L, Canton R. Antibiotics and antibiotic resistance in water
environments. Current Opinion Biotech 2008; 9:260–265.
Berendonk TU, Manaia CM, Merlin C, Fatta-Kassinos D, Cytryn E, Walsh F, et al.
Tackling antibiotic resistance: the environmental framework. Nat Rev Microbiol
2015; 13:310-7. doi: 10.1038/nrmicro3439.
Brichta-Harhay DM, Arthur TM, Bosilevac JM, Kalchayanand N, Shackelford SD et al.
Diversity of multidrug-resistant Salmonella enterica strains associated with cattle at
harvest in the United States. Appl Environ Microbiol 2011; 77: 1783–1796.
Call DR, Borucki MK and Loge FJ. Detection of bacterial pathogens in environmental
samples using DNA microarrays. J Microbiol Methods 2003; 53:235-243.
Casteel MJ, Sobsey MD, Mueller JP. Fecal contamination of agricultural soils before and
after hurricane-associated flooding in North Carolina, J. Environ.Sci. Health, Part A
2006; 41: 173-184
Chandran A, Mazumder A. Pathogenic potential, genetic diversity, and population structure
by guest on January 11, 2016http://fem
sec.oxfordjournals.org/D
ownloaded from

21
of Escherichia coli strains isolated from a forest-dominated watershed (Comox Lake) in
British Columbia, Canada. App. Environ. Microbiol. 2015; 81:1788-1798.
Chapman TA, Wu X-Y, Barchia I, Bettelheim KA, Driesen S et al. Comparison of virulence
gene profiles of Escherichia coli strains isolated from healthy and diarrheic swine. Appl.
Environ. Microbiol 2006; 72:4782–4795.
Clinical and Laboratory Standard Institute. Performance Standards for Antimicrobial
Susceptibility Tests—Ninth Edition: Approved Standard M02-A9; Clinical and
Laboratory Standards Institute: Wayne, PA, USA, 2006.
DebRoy C, Maddox CW. Identification of virulence attributes of gastrointestinal Escherichia
coli isolates of veterinary significance. Anim. Health Res. Rev 2001;1: 129-140.
Dombek PE, Johnson L K, Zimmerley ST, Sadowsky MJ. Use of repetitive DNA sequences
and the PCR to differentiate Escherichia coli isolates from human and animal sources.
Appl. Environ. Microbiol 2000; 66:2572–2577.
Dong X, Reddy GB. Soil bacterial communities in constructed wetlands treated with swine
wastewater using PCR-DGGE technique. Biores. Tech. 2010;101: 11541–11549.
Duriez P, Topp E. Temporal dynamics and impact of manure storage on antibiotic resistance
patterns and population structure of Escherichia coli isolates from a commercial farm.
Appl. Environ. Microbiol 2007; 73:5486-5493.
Durso LM, Miller DN, Wienhold BJ. Distribution and Quantification of Antibiotic Resistant
by guest on January 11, 2016http://fem
sec.oxfordjournals.org/D
ownloaded from

22
Genes and Bacteria across Agricultural and Non-Agricultural Metagenomes. PLoS ONE
2012.;7: e48325. doi:10.1371/journal.pone.0048325.
Eaton AD, Clesceri LS, Greenberg AE, Franson MAH. Standard Method for Examination of
Water and Wastewater; American Public Health Association: Washington, DC, USA.
1998.
Fatta-Kassinos D, Meric S, Nikolaou A. Pharmaceutical residues in environmental waters
and wastewater: current state of knowledge and future research. Analyt Bioanalyt Chem
2011; 399: 251e275.
Food and Drug Administration. Guidance for Industry #152: Evaluating the safety of
antimicrobial new animal drugs with regard to their microbiological effects on bacteria of
human health concern. Rockville, MD. 2003. http://www.fda.gov/cvm.
Forbes DA, Reddy GB, Hunt PG, Poach ME, Ro KS et al. Comparison of aerated marsh-
pond-marsh and continuous marsh constructed wetlands for treating swine wastewater. J
Environ Sc. Health 2010; 45: 803-809.
Frigon D, Biswal BK, Masson A, Gehr R. Biological and physicochemical wastewater
treatment Processes processes reduce the prevalence of virulent Escherichia coli. Appl.
Environ. Microbiol 2013; 79:835-844.
Goto k, Yan TGenotypic diversity of Escherichia coli in the water and soil of tropical
watersheds in Hawaii. Appl. Environ. Microbiol 2011; 77. 3988-3997.
Gow SP, Waldner CL, Harel J, Boerlin P. Associations between antimicrobial resistance
by guest on January 11, 2016http://fem
sec.oxfordjournals.org/D
ownloaded from

23
genes in fecal generic Escherichia coli isolates from cow-calf herds in Western Canada.
Appl. Environ. Microbiol 2008; 74: 3658-3666.
Graves AK, Hagedorn C, Brooks A, Hagedorn RL, Martin E. Microbial source tracking in a
rural watershed dominated by cattle. Water Res 2007; 41: 3729-3739.
Graves AK, Hagedorn C, Teetor A, Mahal M, Bowman AM et al. Antibiotic resistance
profiles to determine sources of fecal contamination in a rural Virginia watershed. J
Environ Qual 2002; 31: 1300–1308.
Graves AK, Weaver RW. Characterization of enterococci populations collected from a
subsurface flow constructed wetland. J. Appl. Microbiol 2010; 108:1226-1234.
Haley CA, Dargatz DA, Bush EJ, Erdman MM, Fedorka-Cray PJ. Salmonella prevalence and
antimicrobial susceptibility from the National Animal Health Monitoring System Swine
2000 and 2006 studies. J Food Prot 2012; 75: 428–436.
Ibekwe AM, Murinda SE, Graves AK. Genetic diversity and antimicrobial resistance of
Escherichia coli from human and animal sources uncovers multiple resistances from
human sources. PLoS ONE 2011; 6 e20819. doi:10.1371/journal.pone.0020819
Ibekwe AM, Grieve CM, Lyon SR. Characterization of microbial communities and
composition in constructed dairy wetland wastewater effluent. Appl Environ Microbiol
2003; 69: 5060–5069.
Ibekwe AM, Lyon SR, Leddy M, Jacobson-Meyer M. Impact of plant density and
by guest on January 11, 2016http://fem
sec.oxfordjournals.org/D
ownloaded from

24
microbial composition on water quality from a free water surface constructed wetlands. J.
Appl. Microbiol 2007; 102: 921-936.
Ibekwe AM, Leddy MB, Bold RM, Graves AK. Bacterial community composition in low-
flowing river water with different sources of pollutants. FEMS Microbiol. Ecol 2012;
79:155-166.
Ishii S, Sadowsky MJ. Escherichia coli in the environment: Implication for water quality and
human health. Microbes and Environ 2008; 23:101-108.
Jacoby GA. Extrachromosomal resistance in gram-negative organisms: the evolution of beta-
lactamase. Trends in Microbiol 1994; 2: 357-360.
Kadlec RH, Knight R L. Treatment wetlands. Lewis Publishers, New
York. 1996.
Kolpin DW, Furlong ET, Meyer MT, Thurman EM, Zaugg SD, Barber LB, Buxton HT.
Pharmaceuticals, hormones, and other organic wastewater contaminants in U.S. streams,
1999-2000: a national reconnaissance. Environ Sci Technol 2002;15: 1202-1211.
Kozak GK, Boerlin P, Janecko N, Reid-Smith RJ, Jardine C. Antimicrobial Resistance in
Escherichia coli Isolates from Swine and Wild Small Mammals in the Proximity of
Swine Farms and in Natural Environments in Ontario, Canada. Appl. Environ. Microbiol
2009; 75:559-566.
Kummerer K. Antibiotics in the aquatic environment: a review: Part II. Chemosphere 2009;
75: 435-443.
by guest on January 11, 2016http://fem
sec.oxfordjournals.org/D
ownloaded from

25
Lyautey E, Lu Z. Lapen DA, Wilkes G, Scott A et al. Distribution and diversity of
Escherichia coli populations in the South Nation river drainage basin, eastern Ontario,
Canada. Appl. Environ. Microbiol 2010; 76:1486–1496.
McKinney CW, Loftin KA, Davis JG, Meyer MT, Pruden A. tet and sul antibiotic resistance
genes in livestock lagoons of various operation type, configuration, and antibiotic
occurrence. Environ. Sci. Technol 2012; 44: 6102−6109.
Mathew AG, Cissell R, Liamthong S. Antibiotic resistance in bacteria associated with food
animals: A United States perspective of livestock production. Foodborne Path. Dis 2007;
4: 115-133.
Murinda SE, Ebner PD, Nguyen LT, Mathew AG, Oliver SP. Anitimicrobial resistance and
class 1 integrons in pathogenic Escherichia coli from dairy farms. Foodborne Path. Dis
2005; 2: 348-352.
Michael I, Rizzo L, McArdellc CS, Manaia CM, Merlin C et al. Urban wastewater treatment
plants as hotspots for the release of antibiotics in the environment: A review. Water Res.
2013; 47: 957-995.
Nguyen MCP, Woerther P-L, Bouvet M, Andremont A, Leclercq R et al. Escherichia coli as
reservoir for macrolide resistance genes. Emerg Infect Dis 2009; 15:1648-1650.
Normark BH, Normark S. Evolution and spread of antibiotic resistance. J. Intern. Med. 2002;
252: 91–106.
Paton JC, Paton AW. Pathogenesis and diagnosis of Shiga toxin-producing Escherichia coli
infections. Clin Microbiol Rev 1998; 11: 450-79.
by guest on January 11, 2016http://fem
sec.oxfordjournals.org/D
ownloaded from
26
Pereira A, Santos A, Tacao M, Alves A, Henriques I et al. Genetic diversity and
antimicrobial resistance of Escherichia coli from Tagus estuary (Portugal). Science Total
Environ 2013; 461-462:65-71.
Poach ME, Hunt PG, Reddy GB, Stone KC, Johnson MH, Grubbs A. Swine wastewater
treatment by marsh-pond-marsh constructed wetlands under varying nitrogen loads. Ecol.
Eng 2004; 23: 165–175.
Pruden A, Pei R, Storteboom HN, Carlson KH. Antibiotic resistance genes as emerging
contaminants: studies in northern Colorado. Environ. Sci. Technol 2006; 40: 7445−7450.
Pruden A, Arabi M, Storteboom HN. Correlation between upstream human Activities and
riverine antibiotic resistance Genes. Environ. Sci. Technol 2012; 46: 6102−6109.
Rademaker JLW, de Bruijn FJ. Characterization and classification of microbes by rep-PCR
genomic fingerprinting and computer-assisted pattern analysis. in DNA markers:
protocols, applications, and overviews. J. eds Caetano-Anollés G., Gresshoff P. M.
(Wiley and Sons, New York, N.Y), pp 151–171. 1997.
Reddy G B, Hunt RG, Phillips R, Stone K, Grubbs A. Treatment of swine wastewater in
marsh-pond-marsh constructed wetlands. Water Sci. Technol 2001.44: 545–550.
Russell JB, Diez-Gonzalez F, Jarvis GN. Effects of diet shifts on Escherichia coli in cattle. J.
Dairy Sci 2000; 83:863-873.
Sapkota AR, Curriero FC, Gibson KE, Schwab KJ. Antibiotic-resistant enterococci and fecal
indicators in surface water and groundwater impacted by a concentrated swine feeding
operation. Environ. Health Perspectives 2007; 115: 1040–1045.
by guest on January 11, 2016http://fem
sec.oxfordjournals.org/D
ownloaded from

27
SAS Institute Inc. SAS/STAT User’s Guide, Release 9.1. Cary, NC. 2009
Schwartz T, Kohnen W, Jansen B, Obst U. Detection of antibiotic-resistant bacteria and their
resistance genes in wastewater, surface water and drinking water biofilms. FEMS
Microbiol. Ecol 2006; 43: 325-335.
Sharma R, Munns K, Alexander T, Entz T, Mirzaagha P et al. Diversity and distribution of
commensal fecal Escherichia coli bacteria in beef cattle administered selected sub
therapeutic antimicrobials in a feedlot setting. Appl. Environ. Microbiol 2008; 74: 6178-
6186.
Sidrach-Cardona R, Bécares E. Fecal indicator bacteria resistance to antibiotics in
experimental constructed wetlands. Ecol. Eng 2013; 50:107-111.
Servais P, Passerat J. Antimicrobial resistance of fecal bacteria in waters of the Seine river
watershed (France). Sci. Total Environ 2009; 408: 365-372.
Smith DL, Harris AD, Johnson JA, Silbergeld EK, Morris JG. Animal antibiotic use has an
early but important impact on the emergence of antibiotic resistance in human
commensal bacteria. PNAS 2002; 99: 6434-6439.
Steer D, Fraser L, Boddy J, Seibert B. Efficiency of small constructed wetlands for
subsurface treatment of single-family domestic effluent. Ecol. Eng 2002; 18: 429–440.
Stern MJ, Ames GF-L, Smith NH, Robinson EC, Higgins CF. Repetitive extragenic
palindromic sequences: a major component of the bacterial genome. Cell 1984; 37:1015–
1026.
Storteboom HN, Arabi M, Davis JG, Crimi B, Pruden A. Tracking antibiotic resistance genes
by guest on January 11, 2016http://fem
sec.oxfordjournals.org/D
ownloaded from

28
in the South Platte River basin using molecular signatures of urban, agricultural, and
pristine sources. Environ. Sci. Technol 2010; 44: 7397−7404.
Storteboom HN, Arabi M, Davis JG, Crimi B, Pruden A. Identification of antibiotic
resistance gene molecular signatures suitable as tracers of pristine river, urban, and
agricultural sources. Environ. Sci. Technol 2010; 44: 1947−1953.
Tenover FC, Rasheed JK. Genetic methods for detecting antimicrobial and antiviral
resistance genes, p. 1578-1592. In PR Murray, EJ Baron, MA Pfaller, FC, Tenover, and
RH Yolken (ed.), Manual of clinical microbiology, 7th ed., Washington, D.C. 1998.
Versalovic J, de Bruijn FJ, Lupski JR. Repetitive sequence-based PCR (rep-PCR) DNA
fingerprinting of bacterial genomes. in Bacterial genomes: physical structure and
analysis. eds de BruijnF. J., LupskiJ. R., Weinstock G. M. (Chapman and Hall, New
York, N.Y), pp 437–454. 1998.
Vymazal, J. and Kropfelova, L. Wastewater treatment in constructed wetlands with
horizontal sub-surface flow. Dordrecht: Springer. 2008
Whitman RL, Przybyla-Kelly K, Shively AD, Nevers MB, Byappanahalli MN. Sunlight,
season, snowmelt, storm, and source affect E. coli populations in an artificially ponded
stream. Sci. Total Environ. 2008; 390:448-455.
by guest on January 11, 2016http://fem
sec.oxfordjournals.org/D
ownloaded from

29
Table 1. Virulence gene and antibiotic resistance genotypes of potentially pathogenic E. coli from swine constructed
wetland
Sample
names Serotype Virulence genes encoding Antibiotic resistance genes
O
type H
type LT STa STb Stx1 Stx2 EAE CNF
1 CNF
2 Sul1 Sul2 Sul3 blaTEM blaSHV blaCMY-2 mphA
aad
A StrA/
B tetA tetB tetC
W1C - 43 - - - - - - - - - - - + - - - - - - - -
W1F - 43 - - - - - - - - - - - + - - - - - - - -
W1G - 43 - - - - - - - - - - - + - - - - - - - -
W1U - 19 - + + - - - - - - - - + - - - + - - + -
W1W - 4 - + + - - - - - - - - - - - - - - - + -
W2C - 11 - - - - - + - - - + - - - - - - + - + -
W2D - 11 - - - - - + - - - + - - - - - - + - + -
W2E - 11 - - - - - + - - - - - - - - - - - - - -
W2K - 43 - - - - - - - - - - - + - - - - - - - -
W2P 88 38 - - - - - - - - - - - - - - - + - - + -
W2Y - 4 - + + - - - - - - - - - - + - - - - + -
W2Z - 4 - + + - - - - - - - - - - + - - - - + -
W2AA - 4 - + + - - - - - - - - - - - - - - - + -
W2AB - 4 - + + - - - - - - - - - - - - - - - + -
W2AC - 4 - + + - - - - - - - - - - - - - - - + -
W3W - 4 - + + - - - - - - - - - - + - - - - + -
W3X - 9 - + - - - - - - - + - - - - - - + - + -
W3Y - 4 - + + - - - - - - - - - - + - - - - + -
SM1A - 36 - + + - + - - - - - + - - + - + - + - -
SM1C - 36 - + + - + - - - - - + - - + - + - + - -
SM1T - 36 - + + - + - - - - - + - - + - + - + - -
SM1U - 36 - + + - + - - - - - + - - + - - - + - -
SM1V - 36 - + + - + - - - - - + - - + - + - + - -
SM2N 98 5 - - + - - - - - - - + + - - - + - + - -
SM2U - 36 - + + - + - - - - - + - - + - + - + - -
SM2V - 36 - + + - + - - - - - + - - + - + - + - -
SM2W - 11 - - - - - + - - - - - - - - - - - - - -
SM2X - 36 - + + - + - - - - - + + - + - + - + - -
SM2Y - 11 - - - - - + - - - - - - - - - - - - - -
SM2Z - 19 - + + - - - - - - - - + - - - + - - + -
PW1A - 19 - + + - - - - - - - - + - - - + - - + -
PW1B - 19 - + + - - - - - - - - + - - - + - - + -
PW1C - 19 - + + - - - - - - - - + - - - + - - + -
PW1D - 19 - + + - - - - - - - - + - - - + - - + -
PW2A - 19 - + + - - - - - - - - + - - - + - - + -
PW2B - 19 - + + - - - - - - - - + - - - + - - + -
PW2C - 19 - + + - - - - - - - - + - - - + - - + -
PW2D - 19 - + + - - - - - - - - + - - - + - - + -
PW2E - 19 - + + - - - - - - - - + - - - + - - + -
PW3A - 19 - + + - - - - - - - - + - - - + - - + -
PSM2E - 19 - + + - - - - - - - - + - - - + - - + -
PSM2F - 19 - + + - - - - - - - - + - - - + - - + -
PSM2G - 19 - + + - - - - - - - - + - - - + - - + -
PSM2H - 19 - + + - - - - - - - - + - - - + - - + -
PSM2I - 19 - + + - - - - - - - - + - - - + - - + -
PSM2J - 19 - + + - - - - - - - - + - - - - - - + -
PSM2K - 19 - + + - - - - - - - - + - - - + - - + -
PSM2L - 19 - + + - - - - - - - - + - - - + - - + -
PSM2M - 19 - + + - - - - - - - - + - - - + - - + -
PSM2N - 19 - + + - - - - - - - - + - - - + - - + -
PSM2O - 19 - + + - - - - - - - - + - - - + - - + -
PSM2P - 19 - + + - - - - - - - - + - - - + - - + -
by guest on January 11, 2016http://fem
sec.oxfordjournals.org/D
ownloaded from

30
W1C - 11 - - - - - + - - - + - - - - - - + - + -
W1H - 11 - - - - - + - - - + - - - - - - + - + -
W1J - 11 - - - - - + - - - + - - - - - - + - + -
W1K - 11 - - - - - + - - - + - - - - - - + - + -
W2B - 32 - - - - - - - - - - - - - - - - + - + -
W3E 178 + - - - - - - - - - - - - - - - - - - + -
W1L - 11 - - - - - + - - - + - - - - - - + - + -
W2K - 11 - - - - - + - - - + - - - - - - + - + -
W2L - 11 - - - - - + - - - + - - - - - - + - + -
W3A - + - - - - - - - - - - - - - - - - - - - -
W3B 2 + - - - - - - - - - - - - - - - - - - - -
W3C - 4 - - - - - - - - - - - - - - - - - - - -
W3G - 11 - - - - - + - - - + - - - - - - + - + -
W3H - 11 - - - - - + - - - + - - - - - - + - + -
W3J - 11 - - - - - + - - - + - - - - - - + - + -
W3O - 4 + + - - - - - - - - - - - + - - - - + -
W6K - 11 - - - - - + - - - + - - - - - - + - + -
SM1G - 30 - + - - + - - - - + - - - + - - + - + -
SM1H - 30 - + - - + - - - - + - - - + - - + - + -
SM1L - 30 - + - - + - - - - + - - - + - - + - + -
by guest on January 11, 2016http://fem
sec.oxfordjournals.org/D
ownloaded from

31
Table 2. Multiple antimicrobial resistant E. coli isolates from swine wetland
Antimicrobial Total
isolates*
421
swine
house
effluent
S1- 135
primar
y
lagoon
1 (S2)-
57
seconda
ry
lagoon 2
(S3)- 57
storage
tank
(S4)-48
continuo
us
wetland
influent
(S5)-24
continuo
us
wetland
effluent
(S6)-30
storage
pond
(S7)-36
land
applicati
on (S8)
-34
Azithromycin 1.2 (5) 0 (0) 1.8 (1) 0 (0) 6.3 (3) 4.2 (1) 0 (0) 0 (0) 0 (0)
Nalidixic Acid 1 (4) 1.5 (2) 1.8 (1) 0 (0) 0 (0) 0 (0) 0 (0) 0 (0) 2.9 (1)
Cefoxitin 0.2 (1) 0 (0) 1.8 (1) 0 (0) 0 (0) 0 (0) 0 (0) 0 (0) 0 (0)
Ceftiofur 0.2 (1) 0 (0) 1.8 (1) 0 (0) 0 (0) 0 (0) 0 (0) 0 (0) 0 (0)
Ceftriaxone 0 (0) 0 (0) 0 (0) 0 (0) 0 (0) 0 (0) 0 (0) 0 (0) 0 (0)
Kanamycin 6.9 (29) 2.2 (3) 14 (8) 15.8 (9) 14.6
(7)
4.2 (1) 0 (0) 2.8 (1) 0 (0)
Trimethoprim/
sulfamethoxaz
ole
0.5 (2) 0 (0) 1.8 (1) 1.8 (1) 0 (0) 0 (0) 0 (0) 0 (0) 0 (0)
Sulfisoxazole 16.4
(69)
19.3
(26)
15.8
(9)
17.5
(10)
25 (12) 4.2 (1) 16.7 (5) 13.9
(5)
2.9 (1)
Amoxicillin/
Clavulanic
Acid
1.7 (7) 0 (0) 1.8 (1) 0 (0) 2.1 (1) 0 (0) 0 (0) 13.9
(5)
0 (0)
Ampicillin 20.9
(88)
20 (27) 24.6
(14)
28.1
(16)
18.8
(9)
4.2 (1) 20 (6) 41.7
(15)
0 (0)
Chlorampheni
col
5 (21) 10.4
(14)
1.8 (1) 1.8 (1) 4.2 (2) 0 (0) 0 (0) 8.3 (3) 0 (0)
Ciprofloxacin 0 (0) 0 (0) 0 (0) 0 (0) 0 (0) 0 (0) 0 (0) 0 (0) 0 (0)
Erythromycin 20.2
(85)
14.8
(20)
17.5
(10)
29.8
(17)
33.3
(16)
4.2 (1) 16.7 (5) 36.1
(13)
8.8 (3)
Gentamicin 0 (0) 0 (0) 0 (0) 0 (0) 0 (0) 0 (0) 0 (0) 0 (0) 0 (0)
Streptomycin 18.3
(77)
19.3
(26)
12.3
(7)
22.8
(13)
18.8
(9)
4.2 (1) 50 (15) 11.1
(4)
5.9 (2)
Tetracycline 46.3
(195)
49.6
(67)
42.1
(24)
63.2
(36)
56.3
(27)
8.3 (2) 50 (15) 55.6
(20)
11.8 (4)
by guest on January 11, 2016http://fem
sec.oxfordjournals.org/D
ownloaded from

32
*Represents number of isolate
by guest on January 11, 2016http://fem
sec.oxfordjournals.org/D
ownloaded from

33
Table 3. Temporal variations of Shannon diversity indices (H') of E. coli isolate based of BOX PCR
Season
No. of isolates No. of Unique
genotypes H' index Frequency ratio
March 244 83 3.96 0.34
August 57 41 3.58 0.72
November 111 60 3.93 0.54
Total 421 176 4.78 0.42
Table 4. Shannon diversity indices (H') of E. coli isolates based on BOX PCR from different locations
within the wetland
Sampling
locations
No. of isolates No. of Unique
genotypes
H index Frequency ratio
swine house
effluent (S1)
133 69 3.96 0.51
primary lagoon 1
(S2)
57 39 3.55 0.63
secondary lagoon
2 (S3)
44 23 2.97 0.73
storage tank (S4) 47 35 3.48 0.73
continuous
wetland influent
(S5)
24 6 1.06 0.25
continuous
wetland effluent
(S6)
30 11 2.05 0.37
storage pond
(S7)
35 17 2.55 0.47
land application
(S8)
34 7 1.11 0.21
by guest on January 11, 2016http://fem
sec.oxfordjournals.org/D
ownloaded from
34
FIGURES
Figure 1. Constructed wetland located at a swine research facility at North Carolina Agricultural
and Technical State University farm in Greensboro, NC, USA. (A) S1 indicates effluent from the
from the swine house into a two-stage anaerobic lagoon system consisting of a primary lagoon 1
by guest on January 11, 2016http://fem
sec.oxfordjournals.org/D
ownloaded from

35
(S2) with overflow into a secondary lagoon 2 (S3) that flows to the storage tank (S4).
Wastewater flows from the 8000 L storage tank by gravity to each continuous wetland cell
influent for sampling point S5. The final effluent samples (S6) from the continuous marsh cells
are discharged into a storage pond (S7) and recycled for flushing of the swine production facility
and for land application (S8) (B) continuous mash flow section used for this study.
by guest on January 11, 2016http://fem
sec.oxfordjournals.org/D
ownloaded from
36
Figure 2. E. coli population in November, March, and August in wetlands. Symbols on the X-
axis are effluent from swine house (S1), two-stage anaerobic lagoon system consisting of a
primary lagoon 1 (S2) with overflow into a secondary lagoon 2 (S3) that flows to the storage
tank (S4), continuous wetland cell influent (S5), continuous wetland cell effluent (S6), storage
pond (S7), final effluent samples (S8) where it was recycled for flushing of the swine production
facility and for land application). All samples were collected in duplicate.
by guest on January 11, 2016http://fem
sec.oxfordjournals.org/D
ownloaded from

37
Figure 3. Percent susceptibility of 421 E. coli isolates against 16 antibiotics.
by guest on January 11, 2016http://fem
sec.oxfordjournals.org/D
ownloaded from

38
Figure 4. Percent of bacterial isolates carrying selected antimicrobial resistant genes.
by guest on January 11, 2016http://fem
sec.oxfordjournals.org/D
ownloaded from

39
Figure 5. Representative dendrogram showing the genetic relatedness of E. coli from wetland
based on their BOX-PCR DNA fingerprints. The red vertical line indicates the cutoff value of
90% for identifying unique genotypes.
by guest on January 11, 2016http://fem
sec.oxfordjournals.org/D
ownloaded from

40
Figure 6. A total of 415 E. coli isolates from swine wetland were analyzed by BOX-PCR DNA
fingerprinting and then grouped into 176 unique genotypes based on cluster analysis.
by guest on January 11, 2016http://fem
sec.oxfordjournals.org/D
ownloaded from

41
Figure 7. Temporal variations of E. coli isolates based on Box-PCR in wetland for March,
August, and November.
by guest on January 11, 2016http://fem
sec.oxfordjournals.org/D
ownloaded from