POTENTIAL OF SMALL SCALE BIOREFINERIES IN TROPICAL...
56
POTENTIAL OF SMALL SCALE BIOREFINERIES IN TROPICAL COUNTRIES CARLOS ARIEL CARDONA ÁLZATE M.Sc. PhD. RESEARCH GROUP OF CHEMICAL, CATALYTIC AND BIOTECHNOLOGICAL PROCESSES UNIVERSIDAD NACIONAL DE COLOMBIA SEDE MANIZALES
Transcript of POTENTIAL OF SMALL SCALE BIOREFINERIES IN TROPICAL...
POTENTIAL OF SMALL SCALE BIOREFINERIES IN TROPICAL COUNTRIES
CARLOS ARIEL CARDONA ÁLZATE M.S c . PhD.
RESEARCH GROUP OF CHEMICAL , CATALYTIC AND B IOTECHNOLOGICAL
PROCESSES
UNIVERSIDAD NACIONAL DE COLOMBIA SEDE MANIZALES

Project Partners
RESEARCH GROUP OF CHEMICAL, CATALYTIC AND BIOTECHNOLOGICAL PROCESSES 2
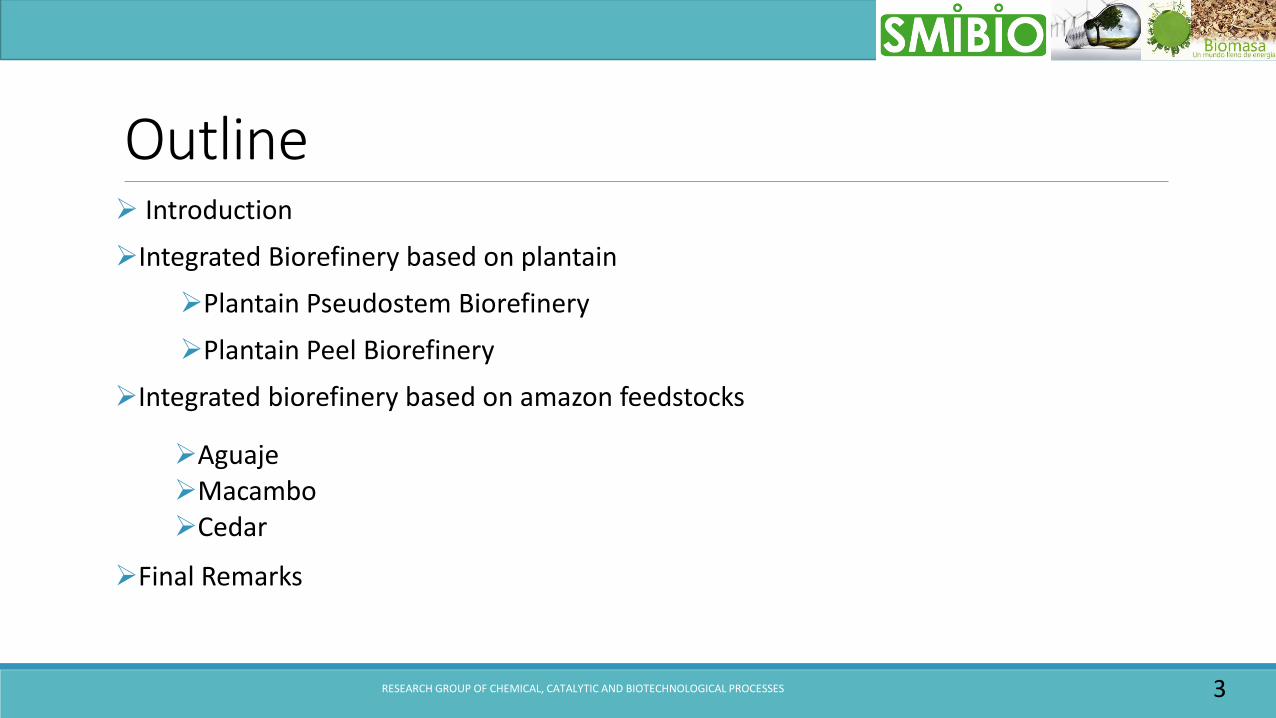
Outline➢ Introduction
➢Integrated Biorefinery based on plantain
➢Plantain Pseudostem Biorefinery
➢Plantain Peel Biorefinery
➢Integrated biorefinery based on amazon feedstocks
➢Aguaje➢Macambo➢Cedar
➢Final Remarks
RESEARCH GROUP OF CHEMICAL, CATALYTIC AND BIOTECHNOLOGICAL PROCESSES 3
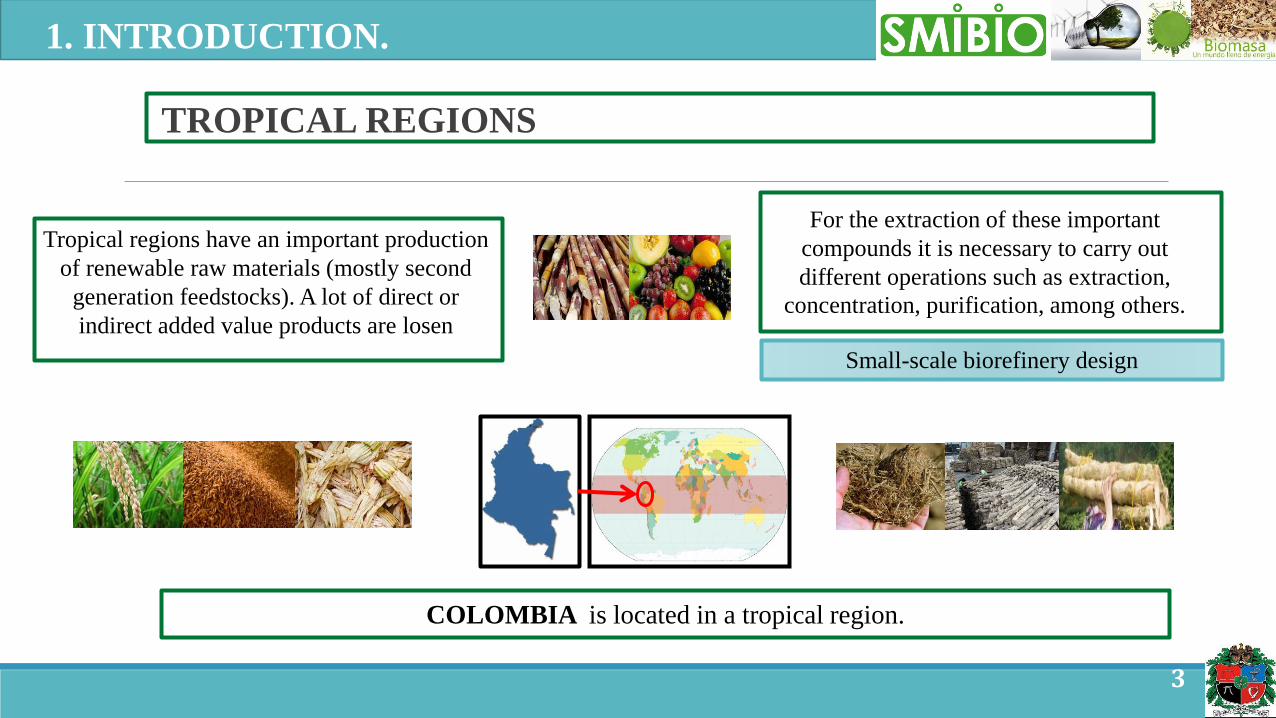
TROPICAL REGIONS
3
1. INTRODUCTION.
COLOMBIA is located in a tropical region.
Tropical regions have an important production
of renewable raw materials (mostly second
generation feedstocks). A lot of direct or
indirect added value products are losen
For the extraction of these important
compounds it is necessary to carry out
different operations such as extraction,
concentration, purification, among others.
Small-scale biorefinery design
2
1. INTRODUCTION
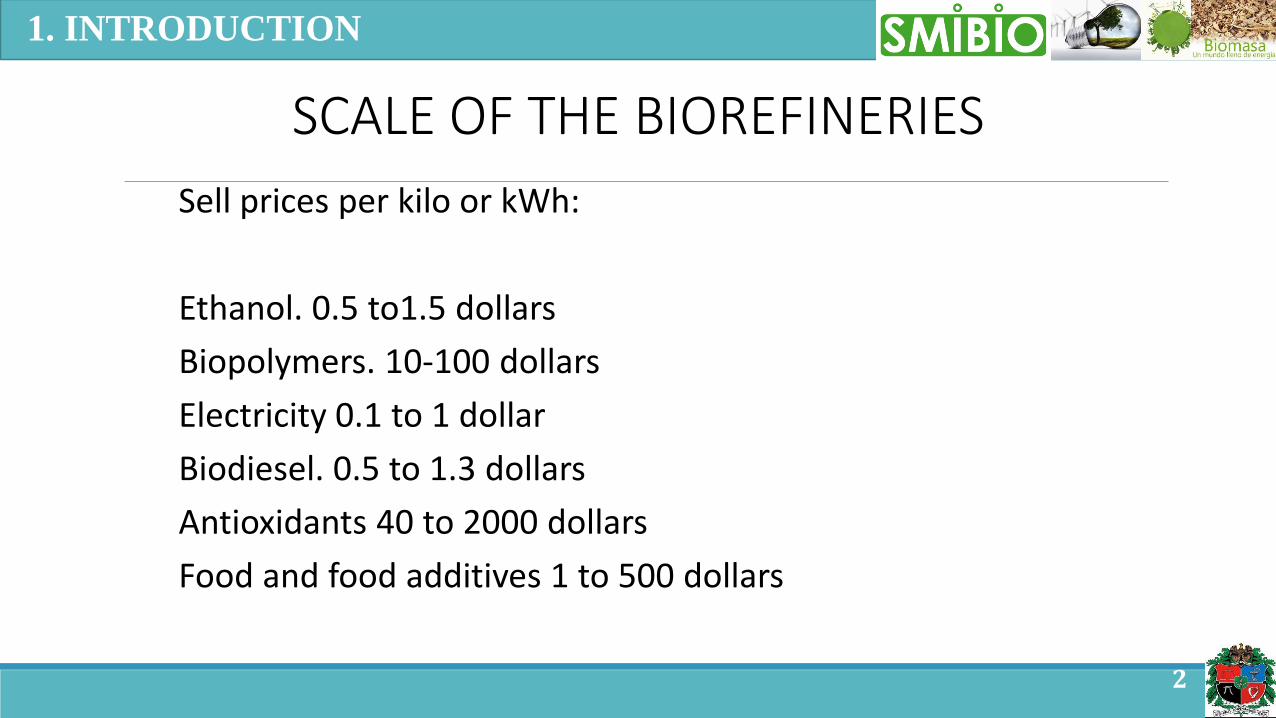
Sell prices per kilo or kWh:
Ethanol. 0.5 to1.5 dollars
Biopolymers. 10-100 dollars
Electricity 0.1 to 1 dollar
Biodiesel. 0.5 to 1.3 dollars
Antioxidants 40 to 2000 dollars
Food and food additives 1 to 500 dollars
SCALE OF THE BIOREFINERIES
5
1. INTRODUCTION.
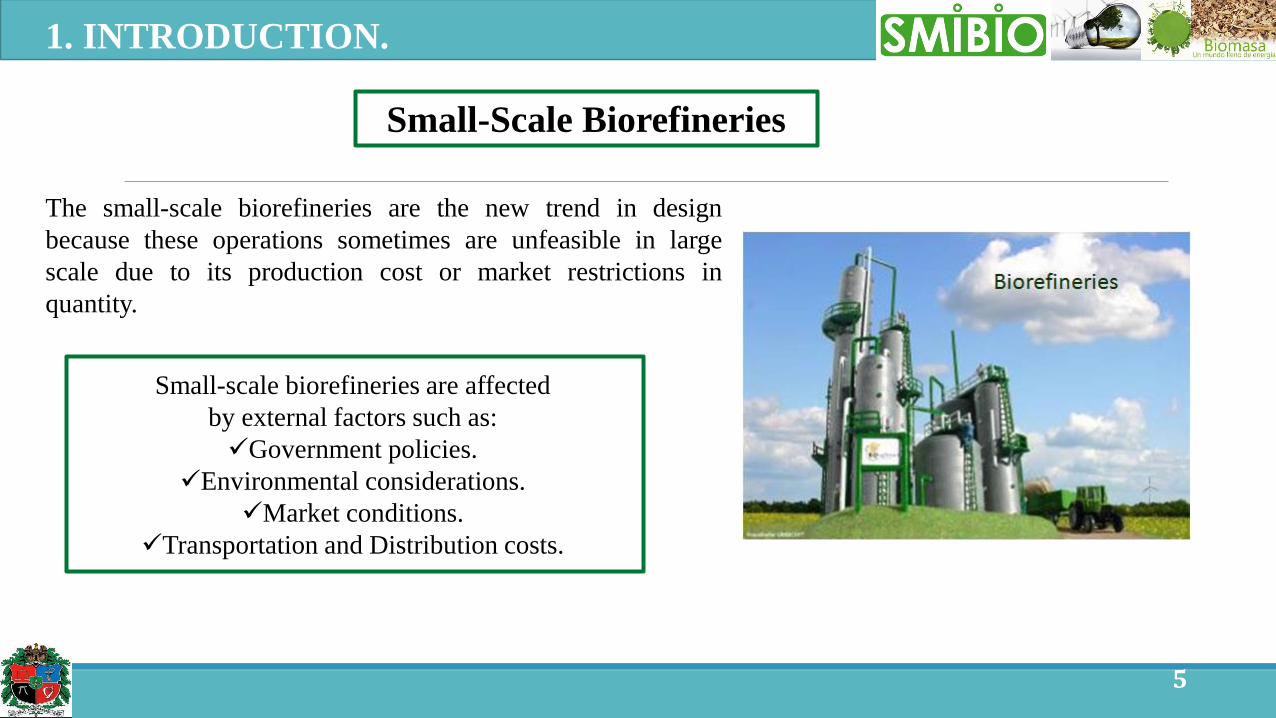
Small-Scale Biorefineries
Small-scale biorefineries are affected
by external factors such as:
✓Government policies.
✓Environmental considerations.
✓Market conditions.
✓Transportation and Distribution costs.
The small-scale biorefineries are the new trend in design
because these operations sometimes are unfeasible in large
scale due to its production cost or market restrictions in
quantity.

How to define the small or high scalebiorefinery. A technical approach.
Algorithm
1. Calculate your desired biorefinery at any scale.
2. Analyze the production costs, profit and net present value (NPV)
3. Develop the point 2 at different scales and fix the profit or NPV you want.
4. Define in the obtained graphic the cases below the fixed profit or NPV as “small scale” and higher as “high scale”.
7
NPV
The lowest scale high scale
scale
No scale to analyze
Fixed NPV
practically any scale
fixed scale
needed scale
1. INTRODUCTION.
How to define the small or high scalebiorefinery. A technical approach.
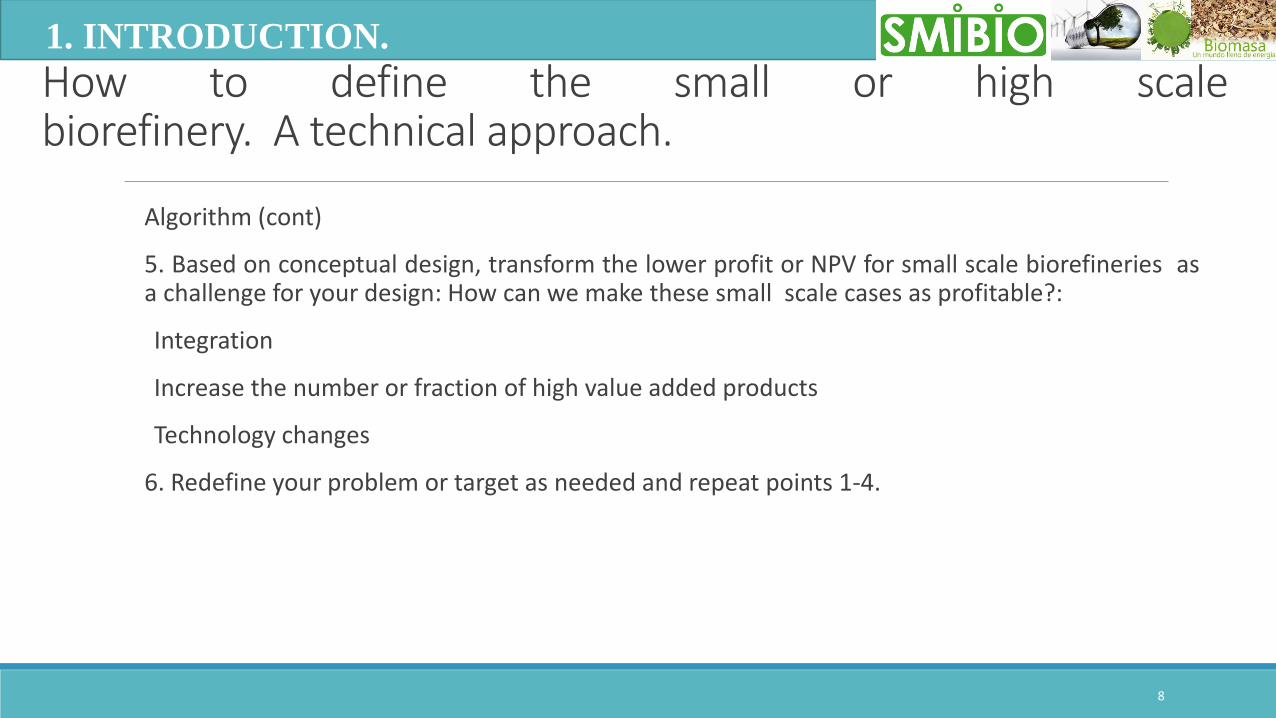
Algorithm (cont)
5. Based on conceptual design, transform the lower profit or NPV for small scale biorefineries asa challenge for your design: How can we make these small scale cases as profitable?:
Integration
Increase the number or fraction of high value added products
Technology changes
6. Redefine your problem or target as needed and repeat points 1-4.
8
1. INTRODUCTION.

Methodology
Fig 8. Methodology steps
Economic assessment using Aspen Process Economic Analyzer
Environmental assessment using WAR GUI software
Raw material selection
Experimental section
Process design according to the raw material potential
Technical simulation using Aspen

Plantain Pseudostem (PP)
RESEARCH GROUP OF CHEMICAL, CATALYTIC AND BIOTECHNOLOGICAL PROCESSES
10
CASE 1. PLANTAIN
Table 1. Chemical Composition PPThe plantain pseudostem is the non-edible part of
the plantain plant, it represent the 50 % of total
biomass
7.3 million tons of plantain pseudostem wes
produced in 2014
Plantain Pseudostem is used for nutrient
assistance of new plants. But also in the paper
fabrication and currently, as raw material for the
production of sugars to obtain other added-value
products
Component % dry basis
Cellulose 43.46
Hemicellulose 33.77
Lignin 20.14
Extractives 2.5
Ash 0.14
Figure 2. Plantain Pseudostem
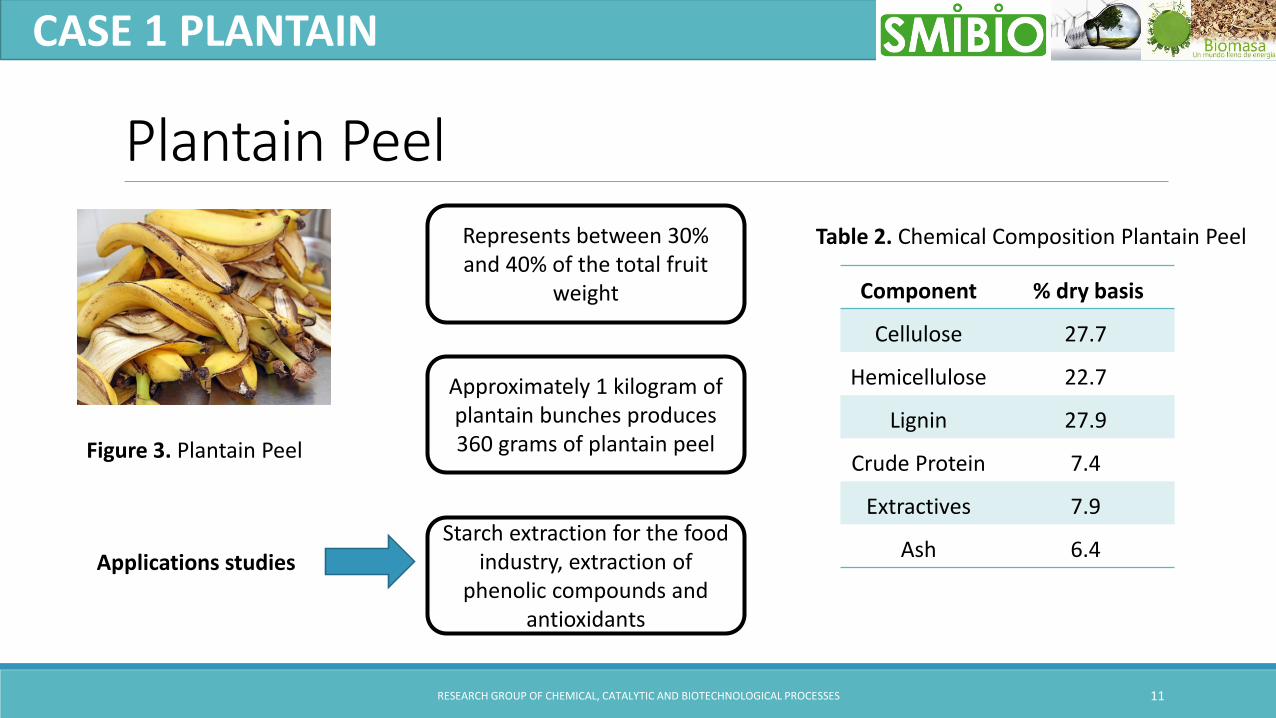
Plantain Peel
RESEARCH GROUP OF CHEMICAL, CATALYTIC AND BIOTECHNOLOGICAL PROCESSES 11
Applications studiesStarch extraction for the food
industry, extraction of phenolic compounds and
antioxidants
CASE 1 PLANTAIN
Figure 3. Plantain Peel
Table 2. Chemical Composition Plantain PeelRepresents between 30% and 40% of the total fruit
weight
Approximately 1 kilogram of plantain bunches produces 360 grams of plantain peel
Component % dry basis
Cellulose 27.7
Hemicellulose 22.7
Lignin 27.9
Crude Protein 7.4
Extractives 7.9
Ash 6.4

Acid HydrolysisSulfuric Acid 2%w/wTemperature = 122°C
Water to Solid Ratio (WSR) = 8g/g
DetoxificationOverliming with LimeTemperature = 60°C
Enzymatic SaccharificationCelluclast 1.5L
Temperature = 45°CBiomass to Enzyme Ratio = 2% w/v
RESEARCH GROUP OF CHEMICAL, CATALYTIC AND BIOTECHNOLOGICAL PROCESSES 12
2. PROCESS DESCRIPTION
Figure 4. Pretreatment Process Scheme
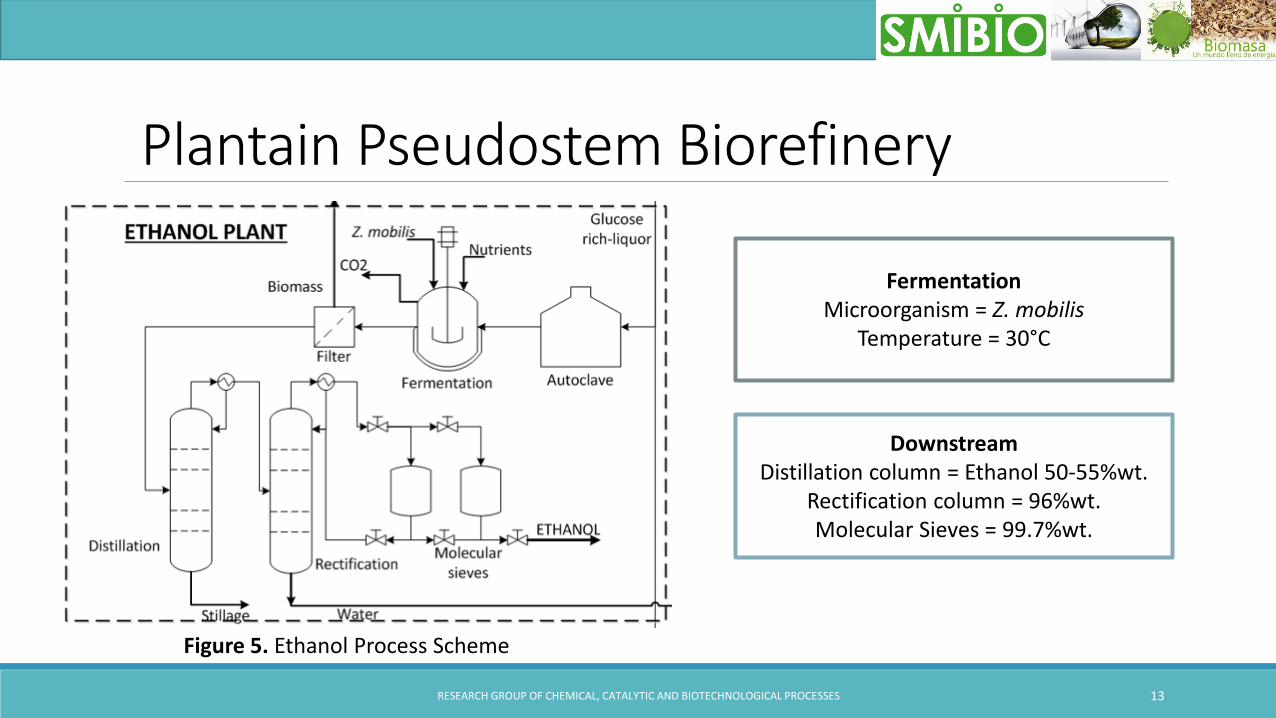
Plantain Pseudostem Biorefinery
Alkaline treatmentNaOH 2 %w/v
Temperature = 120°CWater to Solid Ratio = 10 g/g
RESEARCH GROUP OF CHEMICAL, CATALYTIC AND BIOTECHNOLOGICAL PROCESSES 13
FermentationMicroorganism = Z. mobilis
Temperature = 30°C
DownstreamDistillation column = Ethanol 50-55%wt.
Rectification column = 96%wt.Molecular Sieves = 99.7%wt.
Figure 5. Ethanol Process Scheme
Plantain Pseudostem Biorefinery

Anaerobic DigestionInoculum = Pig ManureSubstrate to Inoculum Ratio = 1:2Temperature = 37°CElectricity generation from biogas = 1.7 kWh/cum biogas
RESEARCH GROUP OF CHEMICAL, CATALYTIC AND BIOTECHNOLOGICAL PROCESSES 14
2. PROCESS DESCRIPTION
Figure 6. Anaerobic Digestion Process Scheme
Plantain Pseudostem Biorefinery

RESEARCH GROUP OF CHEMICAL, CATALYTIC AND BIOTECHNOLOGICAL PROCESSES 15
2. PROCESS DESCRIPTION
Plantain Peel BiorefineryAcid Hydrolysis
Sulfuric Acid 2%w/wTemperature = 122°C
Water to Solid Ratio (WSR) = 10 g/g
DetoxificationOverliming with LimeTemperature = 60°C
Alkaline treatmentNaOH 1 %w/v
Temperature = 121 °CWater to Solid Ratio (WSR) = 8 g/g Figure 7. Pretreatment Process Scheme

RESEARCH GROUP OF CHEMICAL, CATALYTIC AND BIOTECHNOLOGICAL PROCESSES 16
2. PROCESS DESCRIPTION
Plantain Peel Biorefinery
Simultaneous saccharification and fermentation
Enzyme = Celluclast 1.5LTemperature = 40°C
Biomass to Enzyme Ratio = 2% w/vMicroorganism (ethanol) = Saccharomyces
Cerevisiae
Figure 8. Simultaneous saccharification and fermentation Process Scheme

RESEARCH GROUP OF CHEMICAL, CATALYTIC AND BIOTECHNOLOGICAL PROCESSES 17
2. PROCESS DESCRIPTION
Plantain Peel Biorefinery
Anaerobic DigestionInoculum = Pig Manure
Substrate to Inoculum Ratio = 1:2Temperature = 37°C
Electricity generation from biogas = 1.7 kWh/cum biogas
Figure 9. Anaerobic Digestion Process Scheme

RESEARCH GROUP OF CHEMICAL, CATALYTIC AND BIOTECHNOLOGICAL PROCESSES 18
2. PROCESS DESCRIPTION
Plantain Peel Biorefinery
Biogas Upgrading (Absorption and Stripping)
AbsorberPressure = 10 bar
Temperature = 20°CAbsorption agent = Water
StripperPressure = 1 bar
Temperature = 20°CStripping Agent = Air
Figure 10. Biomethane Process Scheme

Biomass integrated gasification combined cycle (BIGCC)
RESEARCH GROUP OF CHEMICAL, CATALYTIC AND BIOTECHNOLOGICAL PROCESSES 19
Biomass dryer, gasification chamber, gas turbine and heat steam recovery generator (HRSG)
2. PROCESS DESCRIPTION
Figure 11. Cogeneration Process Scheme

Process Simulation plantain
RESEARCH GROUP OF CHEMICAL, CATALYTIC AND BIOTECHNOLOGICAL PROCESSES 20
3. RESULTS
ProductsProductivity Yield
Value Unit Value Unit
Plantain
Pseudostem148.31 m3/day 102.85 L/ton
Plantain Peel 17.62 m3/day 0.29 L/ton
Table 3. Bioethanol productivity and yield of the integrated biorefinery

Economic Assessment
RESEARCH GROUP OF CHEMICAL, CATALYTIC AND BIOTECHNOLOGICAL PROCESSES 21
3. RESULTS
800
850
900
950
1000
1050
1100
1150
1200
1250
0 500 1000 1500 2000 2500 3000 3500 4000 4500
Pro
du
ctio
n C
ost
(U
SD
/to
n)
Plant Capacity (ton/day)
P. Pseudostem P. Peel Market Price
Figure 12. Effect of each plant processing capacity in the production cost of the bioethanol.

Economic Assessment
RESEARCH GROUP OF CHEMICAL, CATALYTIC AND BIOTECHNOLOGICAL PROCESSES 22
3. RESULTS
Figure 13. Effect of the process scale in the contribution of the main economic parameters of the pseudostem biorefinery
Figure 14. Effect of the process scale in the contribution of the main economic parameters of the plantain peel biorefinery
RESEARCH GROUP OF CHEMICAL, CATALYTIC AND BIOTECHNOLOGICAL PROCESSES 23
-80
-60
-40
-20
0
20
40
60
80
100
120
-4 -2 0 2 4 6 8 10 12
NP
V (
Mil
lion
US
D/y
ear)
Project Life (years)
A 400 ton/day 2000 ton/day 4000 ton/day
-50
-40
-30
-20
-10
0
10
20
30
40
50
60
-2 0 2 4 6 8 10
NP
V (
Mil
lion
US
D/y
ear)
Project Life (years)
B 400 ton/day 2000 ton/day 4000 ton/day
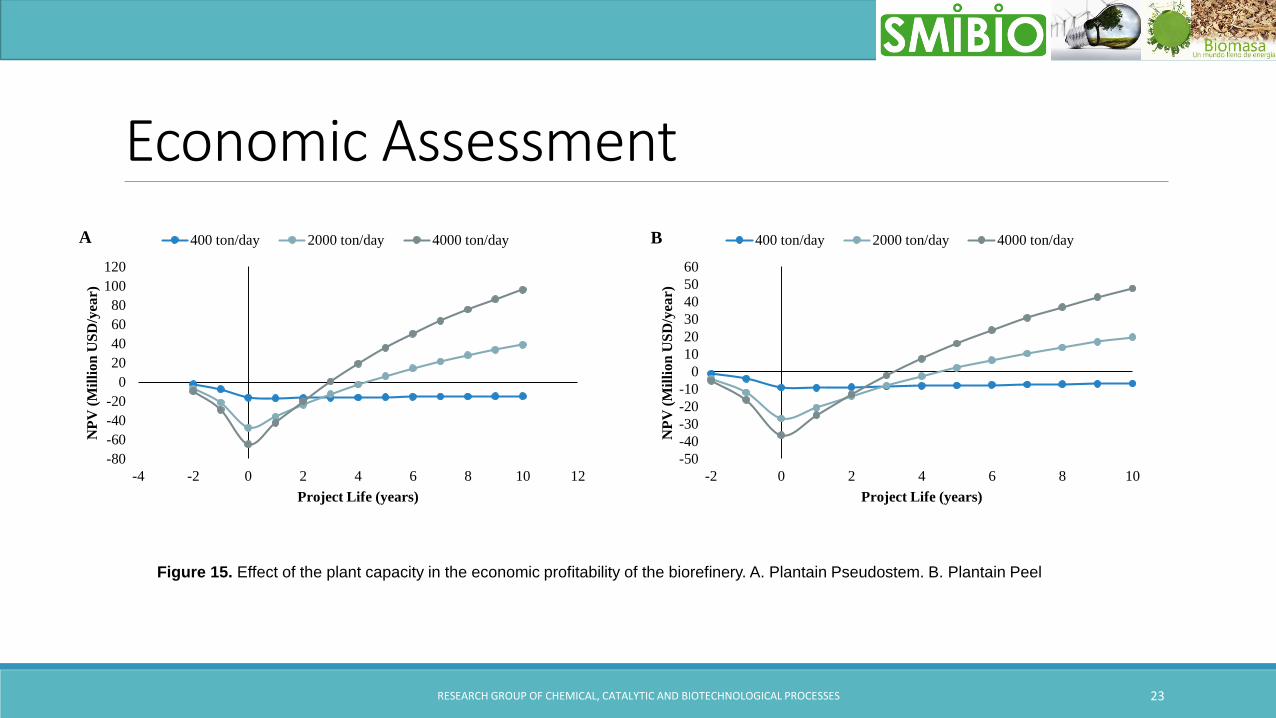
Figure 15. Effect of the plant capacity in the economic profitability of the biorefinery. A. Plantain Pseudostem. B. Plantain Peel
Economic Assessment

Market Price Sensibility Analysis: Pseudostem
RESEARCH GROUP OF CHEMICAL, CATALYTIC AND BIOTECHNOLOGICAL PROCESSES 24
3. RESULTS
Figure 16. Market Price Variations of low-scalebiorefinery (200 ton/day)
Figure 17. Market Price Variations of high-scalebiorefinery (2,000 ton/day)
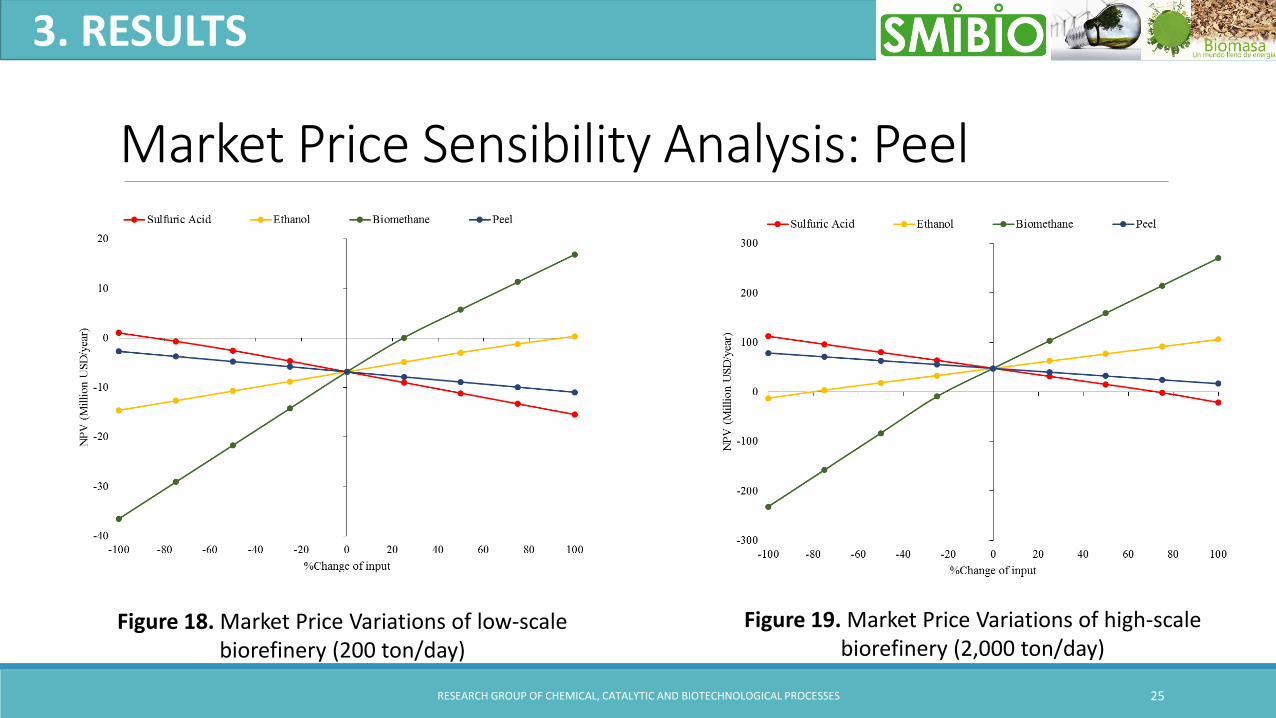
Market Price Sensibility Analysis: Peel
RESEARCH GROUP OF CHEMICAL, CATALYTIC AND BIOTECHNOLOGICAL PROCESSES 25
3. RESULTS
Figure 18. Market Price Variations of low-scalebiorefinery (200 ton/day)
Figure 19. Market Price Variations of high-scalebiorefinery (2,000 ton/day)

Environmental Assessment
RESEARCH GROUP OF CHEMICAL, CATALYTIC AND BIOTECHNOLOGICAL PROCESSES 26
3. RESULTS
Figure 20. Potential Environmental Impact of theIntegrated Biorefinery
LD50 (Lethal Dose)Xylose = 23,000 mg/kg
Glucose = 25,800 mg/kg
High Contribution to PEIHuman Toxicity by Ingestion (HTPI) and
Terrestrial Toxicity Potential (TPP)
0
0.1
0.2
0.3
0.4
0.5
0.6
HTPI HTPE TTP PCOP TOTAL
En
viro
nm
en
tal Im
pa
ct (P
EI/
kg
)
Pseudostem Peel
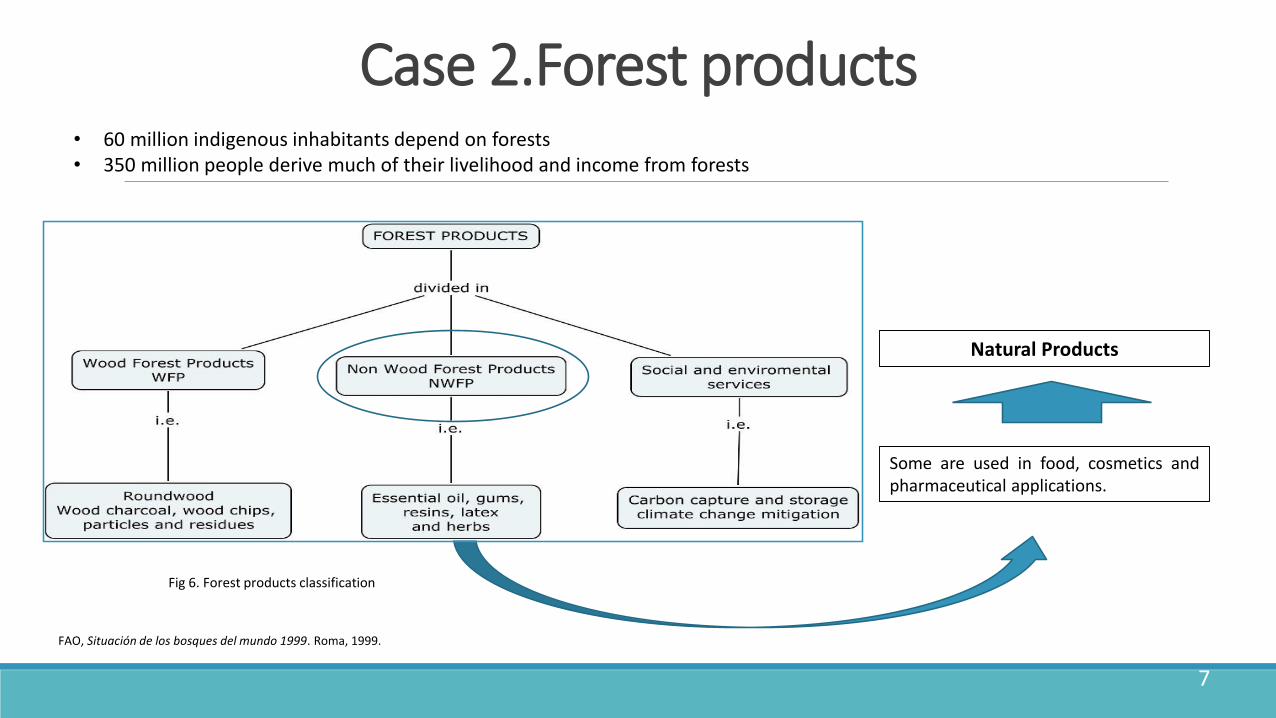
Case 2.Forest products
Fig 6. Forest products classification
7
• 60 million indigenous inhabitants depend on forests• 350 million people derive much of their livelihood and income from forests
Some are used in food, cosmetics andpharmaceutical applications.
Natural Products
FAO, Situación de los bosques del mundo 1999. Roma, 1999.
8
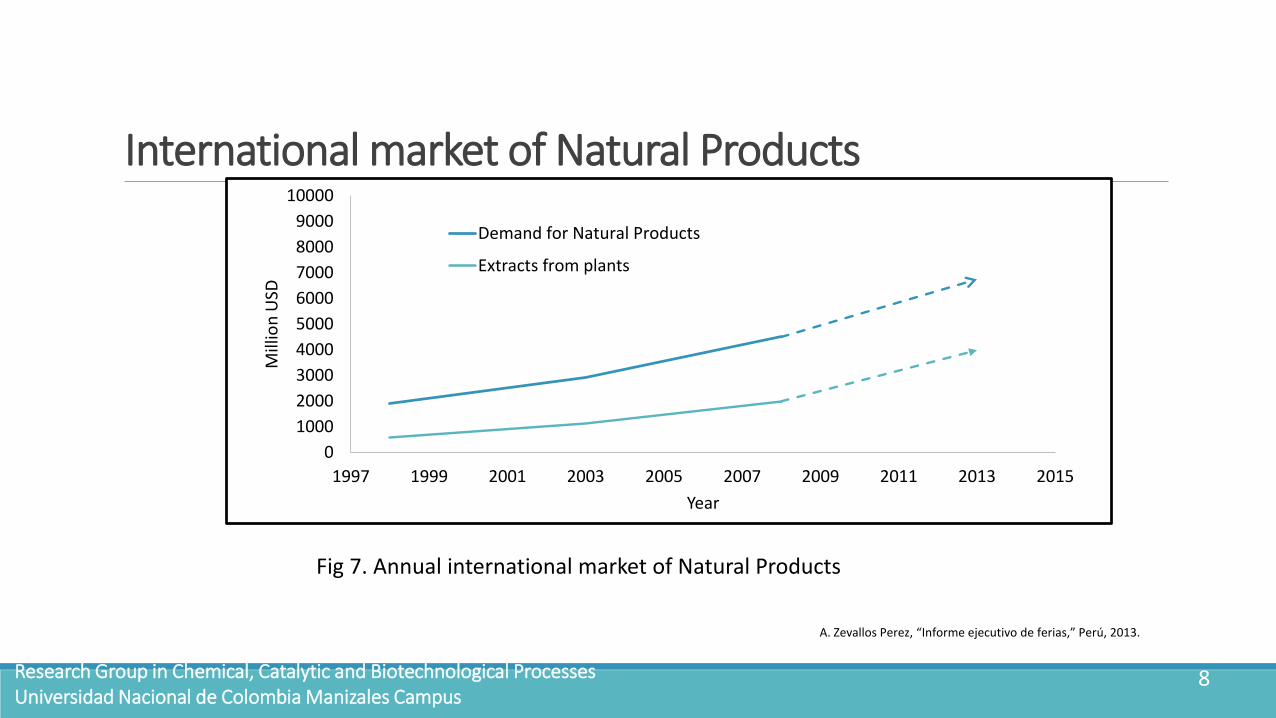
Fig 7. Annual international market of Natural Products
International market of Natural Products
0
1000
2000
3000
4000
5000
6000
7000
8000
9000
10000
1997 1999 2001 2003 2005 2007 2009 2011 2013 2015
Mill
ion
USD
Year
Demand for Natural Products
Extracts from plants
A. Zevallos Perez, “Informe ejecutivo de ferias,” Perú, 2013.
Research Group in Chemical, Catalytic and Biotechnological ProcessesUniversidad Nacional de Colombia Manizales Campus

Experimental yields
SFE
IBA - Universidad Nacional Manizales Campus
18
Experimental section
1. Stainless steel cylinder.2. Pump system. 3. Fluid CO2. 4. Collector tank.Figure 11. Supercritical extractor
Figure 12. Simplified super critical extractor
METHODOLOGY
Research Group in Chemical, Catalytic and Biotechnological ProcessesUniversidad Nacional de Colombia Manizales Campus

Experimental yields
Mechanical “butter”
extraction
IBA - Universidad Nacional Manizales Campus
19
Experimental section
Figure 13. Mechanical press
Temperature: 40°C and 70°C Pressure: and 700 psi
METHODOLOGY
Research Group in Chemical, Catalytic and Biotechnological ProcessesUniversidad Nacional de Colombia Manizales Campus
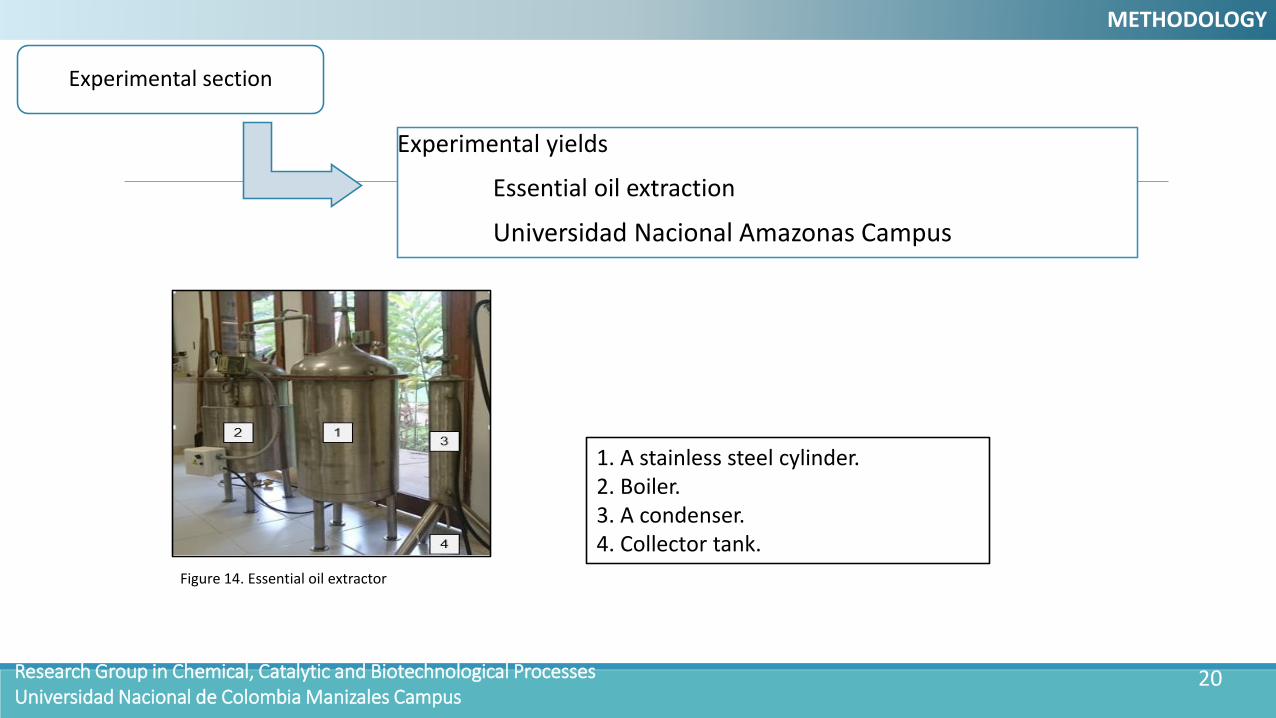
Experimental yields
Essential oil extraction
Universidad Nacional Amazonas Campus
20
Experimental section
1. A stainless steel cylinder.2. Boiler.3. A condenser.4. Collector tank.
Figure 14. Essential oil extractor
METHODOLOGY
Research Group in Chemical, Catalytic and Biotechnological ProcessesUniversidad Nacional de Colombia Manizales Campus

Products selection:
Chemical characterization and published data.
Technology selection:
Logistical context of the region.
Scenarios definition:
Two process configuration (scenarios).
Scenario 1: base case.
Scenario 2: Extension of Sc 1 with wastes reduction. – Biorefinery concept.
21
Process design according to the raw material potential
Scenario 1 - rural areas.
Figure 15. Simplified process-flow Scenario 1
Figure 16. Simplified process-flow Scenario 2
Scenario 2 - Leticia. Process extraction associated with the solvent use had to be limited due to the constraints attached with illicit traffic.
METHODOLOGY
Research Group in Chemical, Catalytic and Biotechnological ProcessesUniversidad Nacional de Colombia Manizales Campus

Technologic assessment:
Mass and energy balances.
Economic assessment:Period:10 years.Amazonas context.8 Categories: raw material, operating labor, maintenance, utilities, operating charges, plant overhead, general and administrative and capital depreciation cost.Economic metrics: Net present value, profitability index, payout period.Individual production cost: Allocation factor.Sensitivity analysis: 50% above and below of prices.Production capacity: 1 tonne (base case), 3, 5, 7 and 10 tonne/day.
Environmental assessment:Potential Environmental Impact (PEI):
HTPI: Human Toxicity Potential by Ingestion, HTPE: Human Toxicity Potential by Exposure,TTP: Terrestrial Toxicity Potential, ATP: Aquatic Toxicity Potential, GWP: Global WarmingPotential, ODP: Ozone Depletion Potential, PCOP: Smog Formation Potential, AP: Acidification Potential.
22
Process simulation
METHODOLOGY
Research Group in Chemical, Catalytic and Biotechnological ProcessesUniversidad Nacional de Colombia Manizales Campus
25
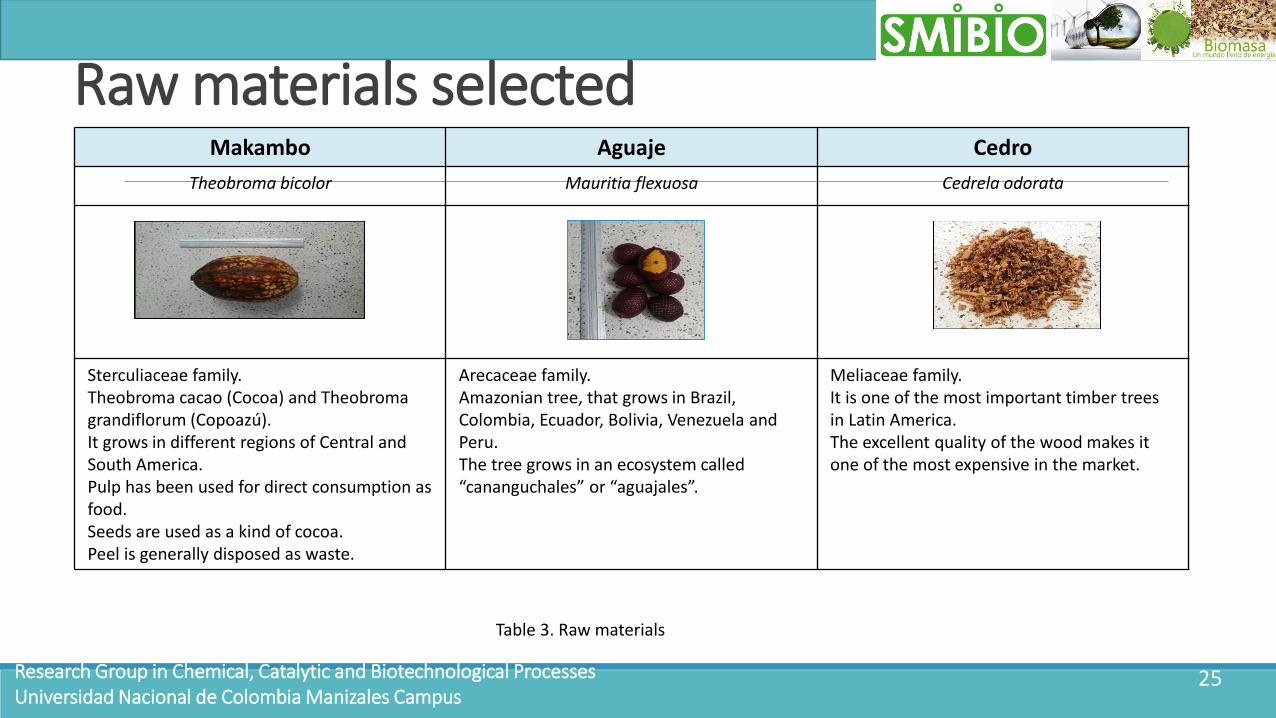
Raw materials selectedMakambo Aguaje Cedro
Theobroma bicolor Mauritia flexuosa Cedrela odorata
Sterculiaceae family. Theobroma cacao (Cocoa) and Theobroma grandiflorum (Copoazú).It grows in different regions of Central and South America. Pulp has been used for direct consumption as food. Seeds are used as a kind of cocoa.Peel is generally disposed as waste.
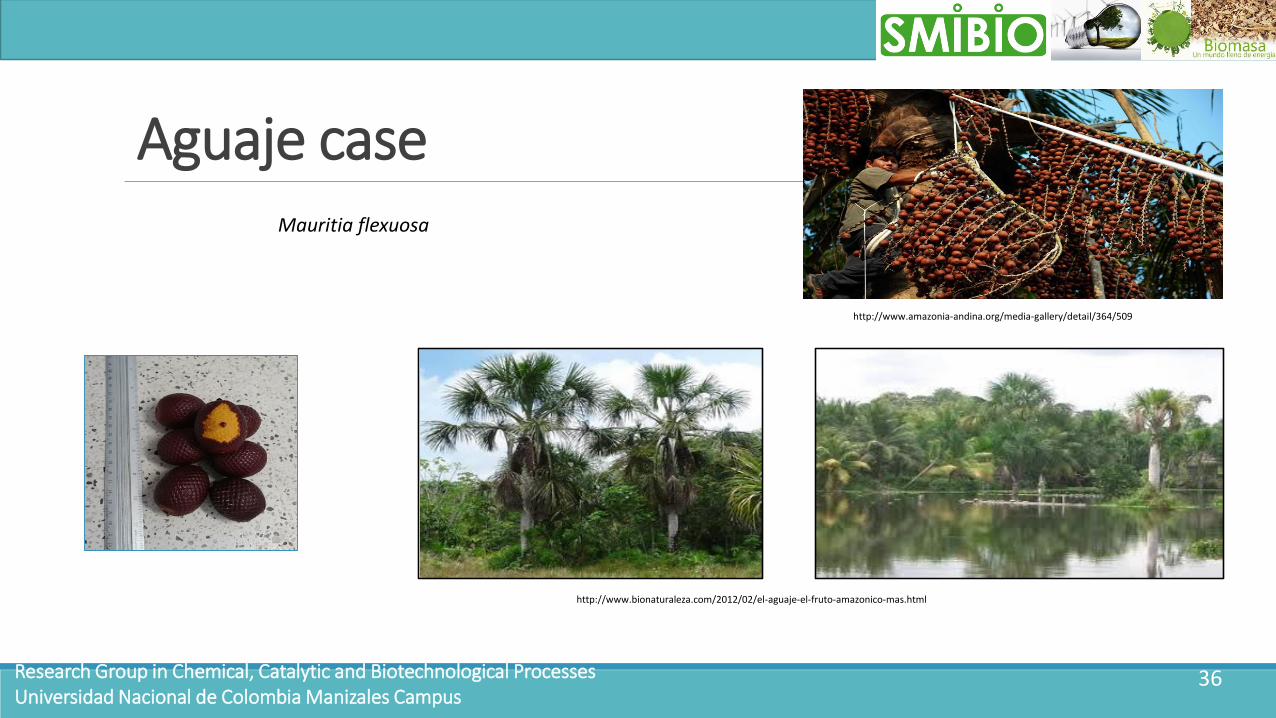
Arecaceae family.Amazonian tree, that grows in Brazil, Colombia, Ecuador, Bolivia, Venezuela and Peru. The tree grows in an ecosystem called “cananguchales” or “aguajales”.
Meliaceae family.It is one of the most important timber trees in Latin America. The excellent quality of the wood makes it one of the most expensive in the market.
Table 3. Raw materials
Research Group in Chemical, Catalytic and Biotechnological ProcessesUniversidad Nacional de Colombia Manizales Campus

26
Makambo caseTheobroma bicolor
Research Group in Chemical, Catalytic and Biotechnological ProcessesUniversidad Nacional de Colombia Manizales Campus
http://foro.portalplantas.com/plantas-en-general/4613-plantas-y-flores-curiosas-11.html http://aplicaciones2.colombiaaprende.edu.co/concursos/expediciones_botanicas/fotos/918_6316_1.jpg
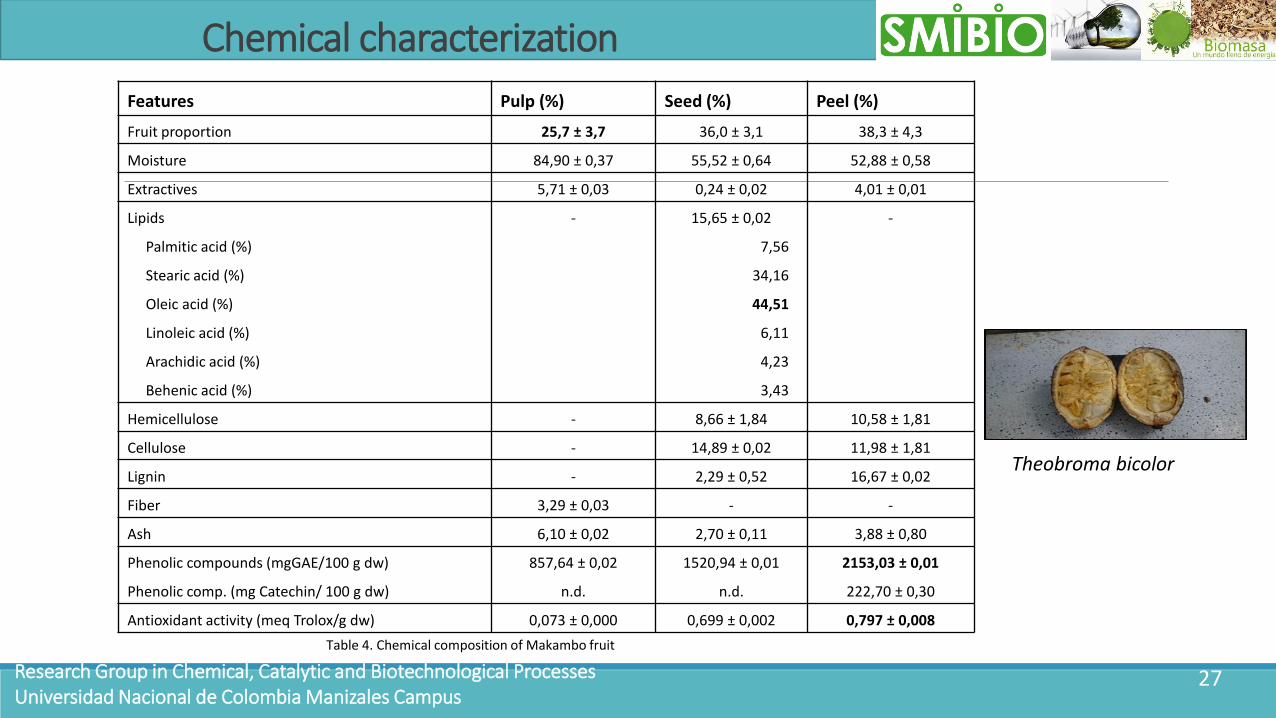
Chemical characterization
Table 4. Chemical composition of Makambo fruit
27
Features Pulp (%) Seed (%) Peel (%)
Fruit proportion 25,7 ± 3,7 36,0 ± 3,1 38,3 ± 4,3
Moisture 84,90 ± 0,37 55,52 ± 0,64 52,88 ± 0,58
Extractives 5,71 ± 0,03 0,24 ± 0,02 4,01 ± 0,01
Lipids
Palmitic acid (%)
Stearic acid (%)
Oleic acid (%)
Linoleic acid (%)
Arachidic acid (%)
Behenic acid (%)
- 15,65 ± 0,02
7,56
34,16
44,51
6,11
4,23
3,43
-
Hemicellulose - 8,66 ± 1,84 10,58 ± 1,81
Cellulose - 14,89 ± 0,02 11,98 ± 1,81
Lignin - 2,29 ± 0,52 16,67 ± 0,02
Fiber 3,29 ± 0,03 - -
Ash 6,10 ± 0,02 2,70 ± 0,11 3,88 ± 0,80
Phenolic compounds (mgGAE/100 g dw)
Phenolic comp. (mg Catechin/ 100 g dw)
857,64 ± 0,02
n.d.
1520,94 ± 0,01
n.d.
2153,03 ± 0,01
222,70 ± 0,30
Antioxidant activity (meq Trolox/g dw) 0,073 ± 0,000 0,699 ± 0,002 0,797 ± 0,008
Theobroma bicolor
Research Group in Chemical, Catalytic and Biotechnological ProcessesUniversidad Nacional de Colombia Manizales Campus
28
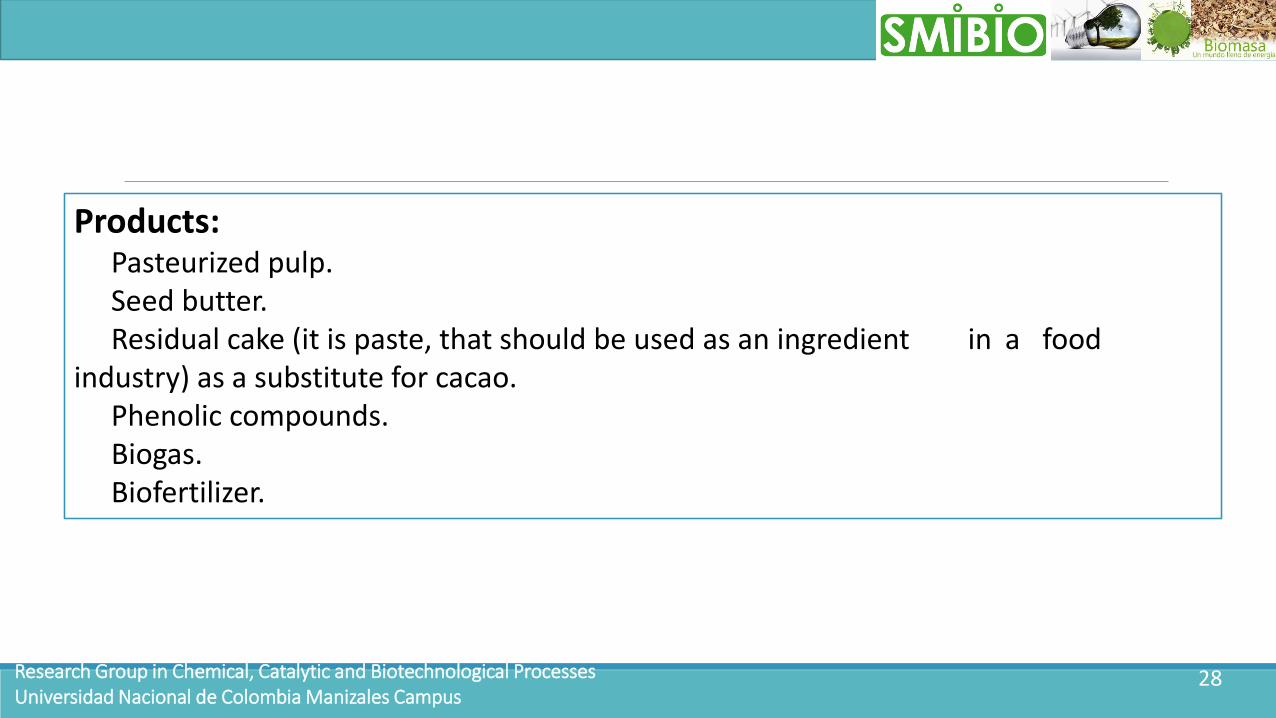
Products:Pasteurized pulp.Seed butter.Residual cake (it is paste, that should be used as an ingredient in a food
industry) as a substitute for cacao.Phenolic compounds.Biogas.Biofertilizer.
Research Group in Chemical, Catalytic and Biotechnological ProcessesUniversidad Nacional de Colombia Manizales Campus
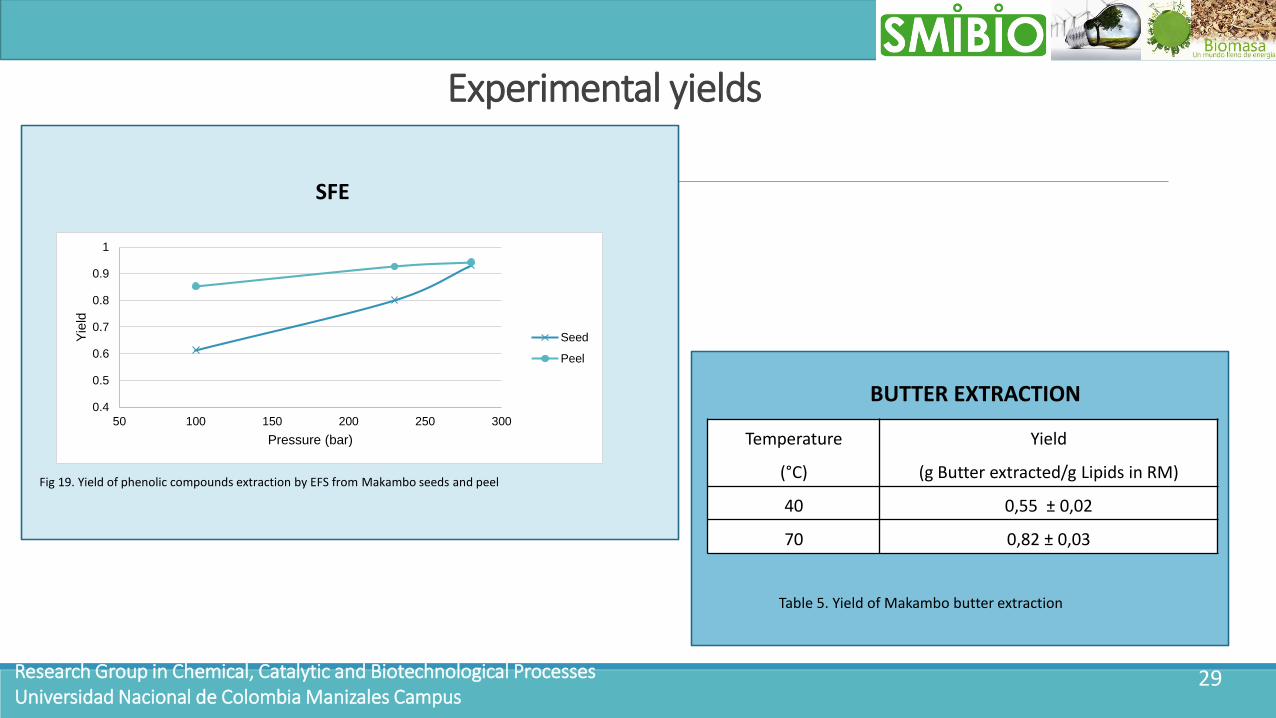
Experimental yields
29
0.4
0.5
0.6
0.7
0.8
0.9
1
50 100 150 200 250 300
Yie
ld
Pressure (bar)
Seed
Peel
SFE
Fig 19. Yield of phenolic compounds extraction by EFS from Makambo seeds and peel
BUTTER EXTRACTION
Temperature
(°C)
Yield
(g Butter extracted/g Lipids in RM)
40 0,55 ± 0,02
70 0,82 ± 0,03
Table 5. Yield of Makambo butter extraction
Research Group in Chemical, Catalytic and Biotechnological ProcessesUniversidad Nacional de Colombia Manizales Campus
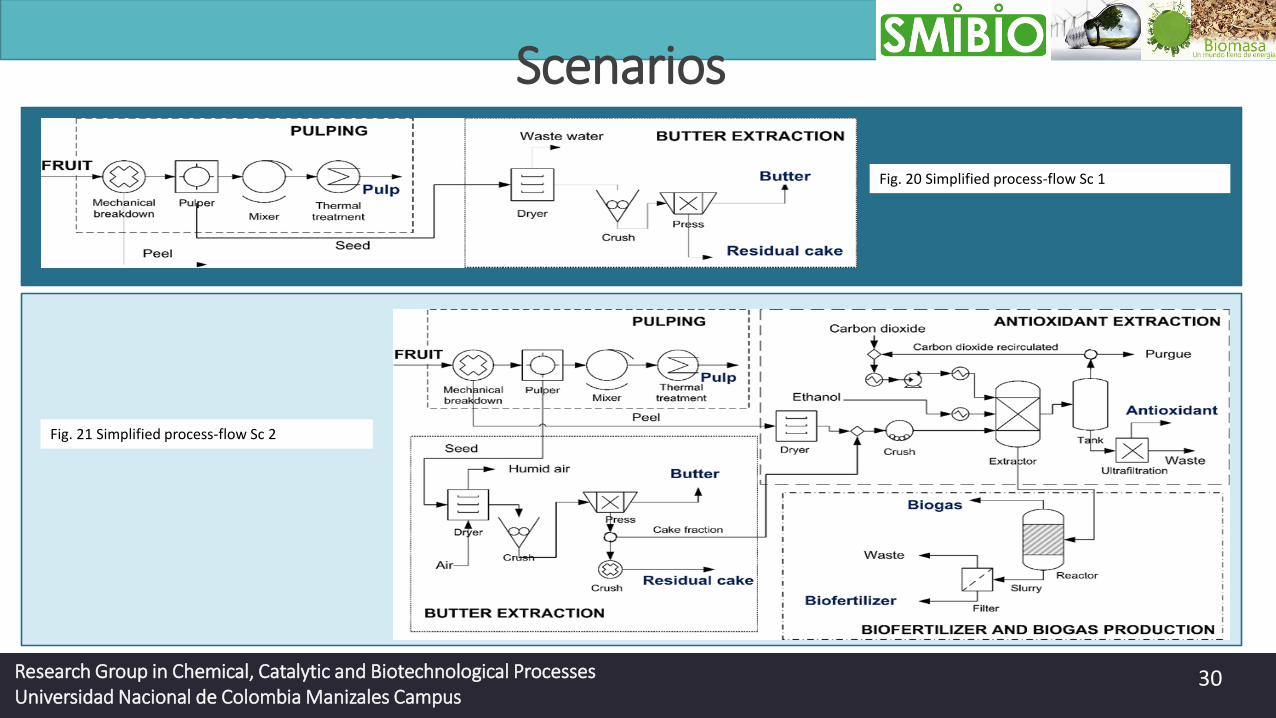
Scenarios
30
Fig. 20 Simplified process-flow Sc 1
Fig. 21 Simplified process-flow Sc 2
Research Group in Chemical, Catalytic and Biotechnological ProcessesUniversidad Nacional de Colombia Manizales Campus

Mass balance
31
Fig. 22 Material balance for Sc. 1
Fig. 23 Material balance for Sc. 2
Research Group in Chemical, Catalytic and Biotechnological ProcessesUniversidad Nacional de Colombia Manizales Campus

Scale production assessment
34
Figure 26. Annualized cost for different production scale
0
500
1000
1500
2000
2500
3000
1.0 2.0 3.0 4.0 5.0 6.0 7.0 8.0 9.0 10.0Pro
du
ctio
n c
ost
(U
SD/T
on
ne
RM
)Plant Capacity (Tonne/day RM)
Scenario 1 Scenario 2
Figure 27. Annual cost distribution for different production scale for Sc 1 Figure 28. Annual cost distribution for different production scale for Sc 2
Research Group in Chemical, Catalytic and Biotechnological ProcessesUniversidad Nacional de Colombia Manizales Campus
0%
10%
20%
30%
40%
50%
60%
70%
80%
90%
100%
1 3 5 7 10
Dis
trib
uti
on
co
st
Capacity of plant (tonn/day)
Capital Depreciation
Operating cost
Utilities
Raw Materials
0%
10%
20%
30%
40%
50%
60%
70%
80%
90%
100%
1 3 5 7 10
Dis
trib
uti
on
co
st
Capacity of plant (tonn/day)
Capital Depreciation
Utilities
Operating cost
Raw Materials

Environmental assessment
Fig. 29 Potential Environmental Impact generated per Scenario
35
0
0.01
0.02
0.03
0.04
0.05
0.06
HTPI HTPE TTP ATP GWP ODP PCOP AP Total
PEI
/kg
pro
du
ct
Scenario 1 (PEI/kg) Scenario 2 (PEI/kg)
Research Group in Chemical, Catalytic and Biotechnological ProcessesUniversidad Nacional de Colombia Manizales Campus
36
Aguaje caseMauritia flexuosa
Research Group in Chemical, Catalytic and Biotechnological ProcessesUniversidad Nacional de Colombia Manizales Campus
http://www.bionaturaleza.com/2012/02/el-aguaje-el-fruto-amazonico-mas.html
http://www.amazonia-andina.org/media-gallery/detail/364/509

Chemical characterization
Table 8. Chemical composition of Aguaje fruit
37
Features Pulp (%) Seed (%) Peel (%)
Fruit proportion 25,7± 2,06 51,8 ± 0,46 22,5 ± 1,60
Moisture 55,84 ± 0,81 50,32 ± 0,37 56,39 ± 0,25
Extractives 4,82 ± 0,34 1,14 ± 0,78 4,36 ± 0,15
Lipids 18,52 ± 0,38 - -
Hemicellulose - 22,86 ± 0,82 18,11 ± 0,95
Cellulose - 17,38 ± 0,42 11,68 ± 0,32
Lignin - 5,29 ± 0,51 6,62 ± 0,93
Fiber 17,15 ± 0,71 - -
Ash 3,71 ± 0,99 3,03 ± 0,18 2,83 ± 0,03
Phenolic compounds (mgGAE/100 g dw)
mg Cathechin/ 100 g dw
451,72 ± 0,00
n.d.
176,63 ±0,00
n.d.
3400,59 ± 0,01
204,86 ± 3,39
Antioxidant activity (m eq Trolox/ g dw) 0,051 ± 0,000 0,048 ± 0,000 1,443± 0,003
Research Group in Chemical, Catalytic and Biotechnological ProcessesUniversidad Nacional de Colombia Manizales Campus

38
Products:Pasteurized pulpPulp OilFlour for animal mealPhenolic compoundsBiogasBiofertilizer
Research Group in Chemical, Catalytic and Biotechnological ProcessesUniversidad Nacional de Colombia Manizales Campus

Experimental yields
39
SFE
Fig 30. Yield of phenolic compounds extraction by SFFE from residual cake
40
50
60
70
80
90
100 150 200 250 300
Yie
ld (
%)
Pressure (bar)
Research Group in Chemical, Catalytic and Biotechnological ProcessesUniversidad Nacional de Colombia Manizales Campus
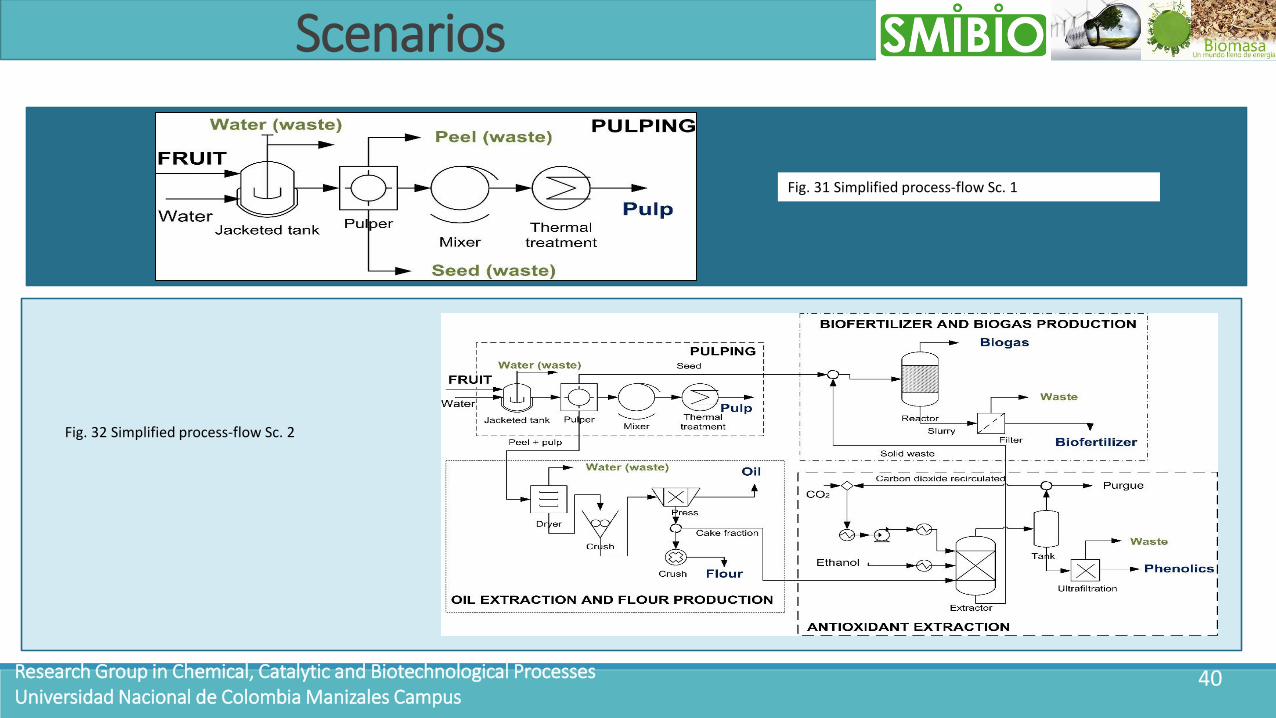
Scenarios
40
Fig. 31 Simplified process-flow Sc. 1
Fig. 32 Simplified process-flow Sc. 2
Research Group in Chemical, Catalytic and Biotechnological ProcessesUniversidad Nacional de Colombia Manizales Campus
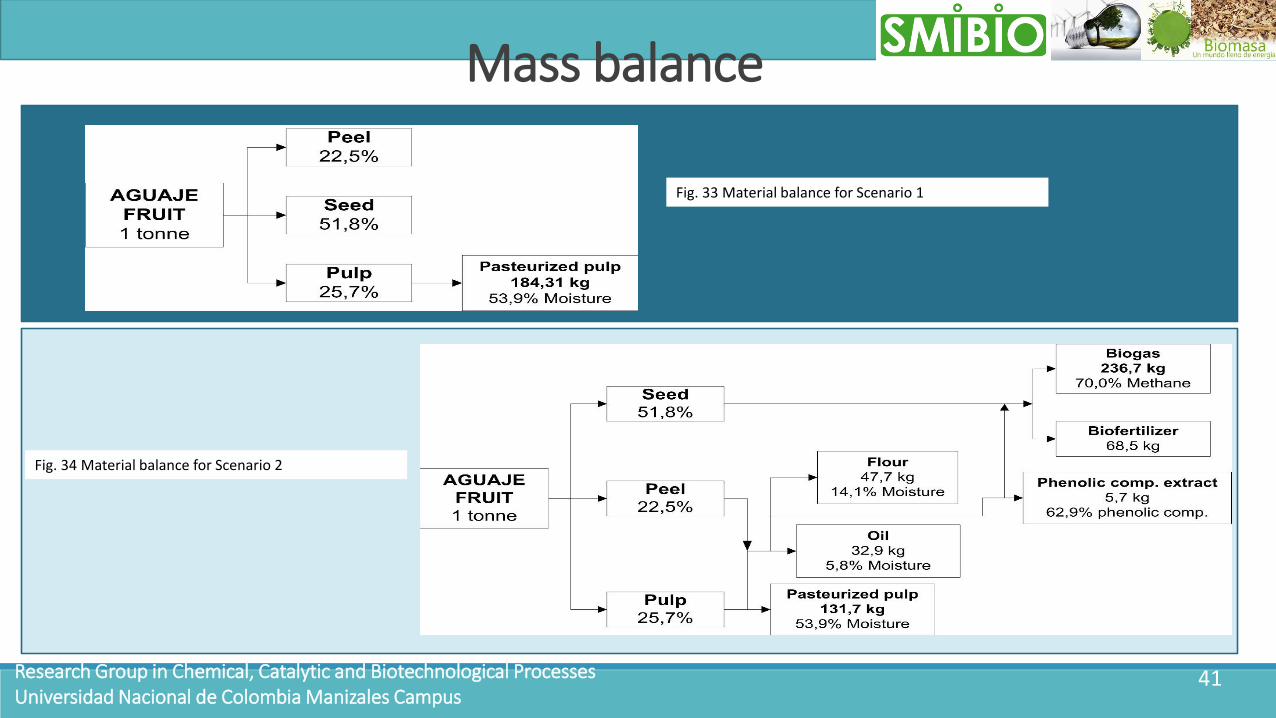
Mass balance
41
Fig. 33 Material balance for Scenario 1
Fig. 34 Material balance for Scenario 2
Research Group in Chemical, Catalytic and Biotechnological ProcessesUniversidad Nacional de Colombia Manizales Campus
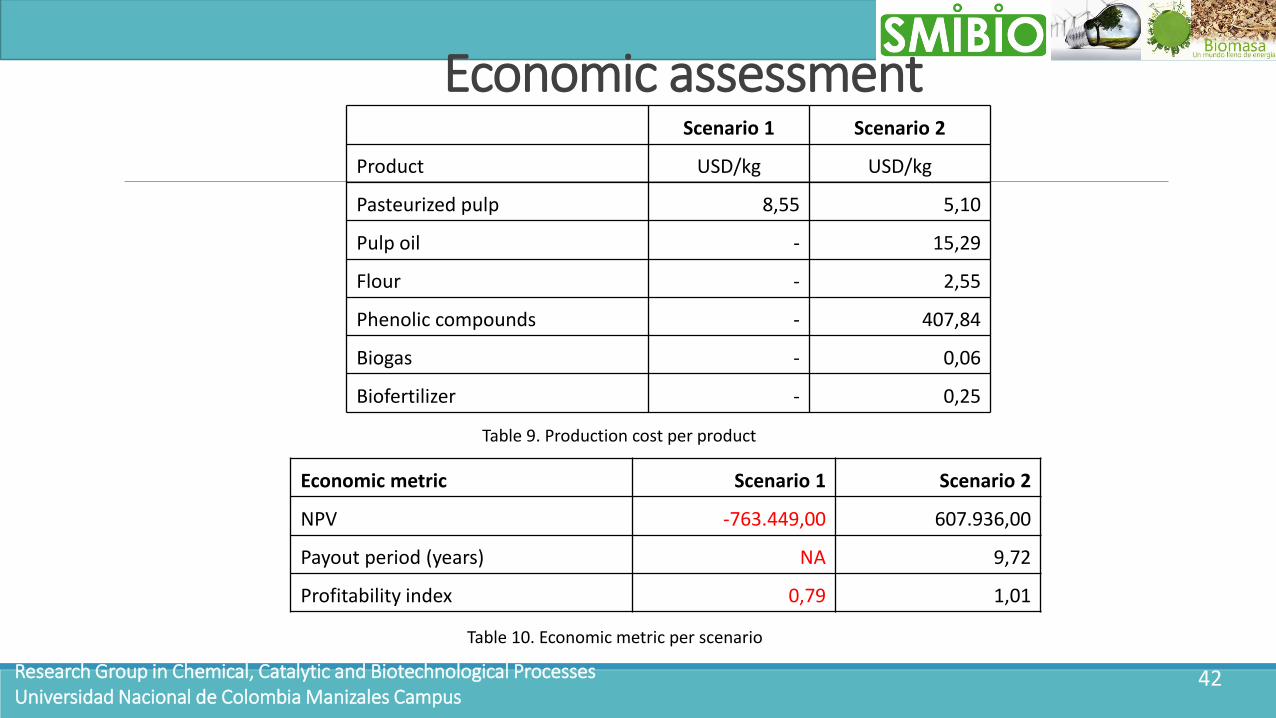
Economic assessment
42
Table 9. Production cost per product
Scenario 1 Scenario 2
Product USD/kg USD/kg
Pasteurized pulp 8,55 5,10
Pulp oil - 15,29
Flour - 2,55
Phenolic compounds - 407,84
Biogas - 0,06
Biofertilizer - 0,25
Research Group in Chemical, Catalytic and Biotechnological ProcessesUniversidad Nacional de Colombia Manizales Campus
Economic metric Scenario 1 Scenario 2
NPV -763.449,00 607.936,00
Payout period (years) NA 9,72
Profitability index 0,79 1,01
Table 10. Economic metric per scenario
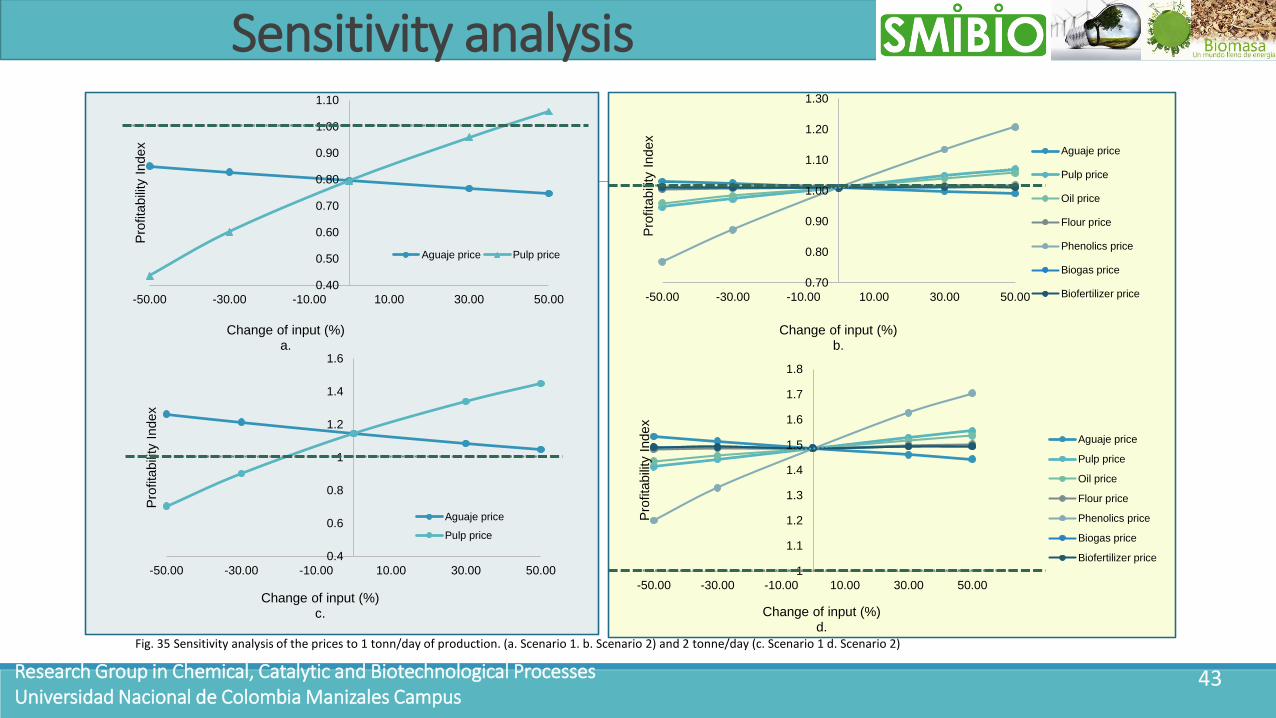
Sensitivity analysis
43
0.40
0.50
0.60
0.70
0.80
0.90
1.00
1.10
-50.00 -30.00 -10.00 10.00 30.00 50.00
Pro
fita
bili
ty I
ndex
Change of input (%)a.
Aguaje price Pulp price
0.70
0.80
0.90
1.00
1.10
1.20
1.30
-50.00 -30.00 -10.00 10.00 30.00 50.00
Pro
fita
bili
ty I
ndex
Change of input (%)b.
Aguaje price
Pulp price
Oil price
Flour price
Phenolics price
Biogas price
Biofertilizer price
0.4
0.6
0.8
1
1.2
1.4
1.6
-50.00 -30.00 -10.00 10.00 30.00 50.00
Pro
fita
bili
ty I
ndex
Change of input (%)c.
Aguaje price
Pulp price
1
1.1
1.2
1.3
1.4
1.5
1.6
1.7
1.8
-50.00 -30.00 -10.00 10.00 30.00 50.00
Pro
fita
bili
ty I
ndex
Change of input (%)d.
Aguaje price
Pulp price
Oil price
Flour price
Phenolics price
Biogas price
Biofertilizer price
Fig. 35 Sensitivity analysis of the prices to 1 tonn/day of production. (a. Scenario 1. b. Scenario 2) and 2 tonne/day (c. Scenario 1 d. Scenario 2)
Research Group in Chemical, Catalytic and Biotechnological ProcessesUniversidad Nacional de Colombia Manizales Campus

Scale production assessment
44
Figure 36. Annualized cost for different production scale
0
500
1000
1500
2000
2500
3000
3500
4000
1.0 2.0 3.0 4.0 5.0 6.0 7.0 8.0 9.0 10.0
Pro
duction c
ost (U
SD
/Tonne R
M)
Plant Capacity (Tonne/day RM)
Scenario 1 Scenario 2
Figure 37. Annual cost distribution for different production scale for Sc 1 Figure 38. Annual cost distribution for different production scale for Sc 2
Research Group in Chemical, Catalytic and Biotechnological ProcessesUniversidad Nacional de Colombia Manizales Campus
0%
10%
20%
30%
40%
50%
60%
70%
80%
90%
100%
1 3 5 7 10
Dis
trib
uti
on
co
st
Capacity of plant (tonn/day)
Capital Depreciation
Operating cost
Utilities
Raw Materials
0%
10%
20%
30%
40%
50%
60%
70%
80%
90%
100%
1 3 5 7 10
Dit
rib
uti
on
co
st
Capacity of plant (tonn/day)
Capital Depreciation
Operating cost
Utilities
Raw Materials
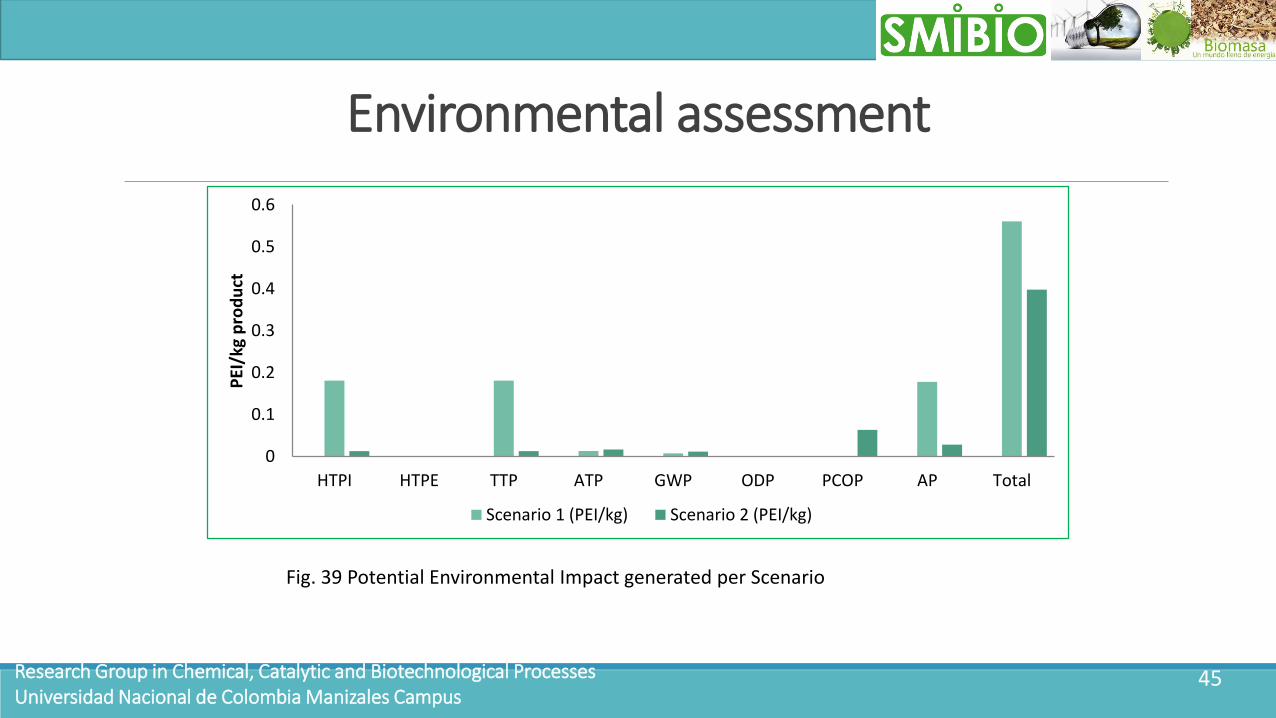
Environmental assessment
Fig. 39 Potential Environmental Impact generated per Scenario
45
0
0.1
0.2
0.3
0.4
0.5
0.6
HTPI HTPE TTP ATP GWP ODP PCOP AP Total
PEI
/kg
pro
du
ct
Scenario 1 (PEI/kg) Scenario 2 (PEI/kg)
Research Group in Chemical, Catalytic and Biotechnological ProcessesUniversidad Nacional de Colombia Manizales Campus

Overall results
Table 14 Overall results, risk and advantages associated with the raw materials
55Research Group in Chemical, Catalytic and Biotechnological ProcessesUniversidad Nacional de Colombia Manizales Campus
Capacity(tonne/day)
Makambo Aguaje Cedro
Sc 1 Sc 2 Sc 1 Sc 2 Sc 1 Sc 2
1
2
5
Risk
SeasonalityNew fruit into the market
New productsSeasonality
Absence the agronomic package Harvesting is a destructive practice
Natural demandWaste
Advantages
Domestic fruitVersatility of products
Exotic fruitAmazonian
Agronomic package
Recognized products into the market
Most important fruit in South Amazonian
High quality woodAgronomic package

Stand alone processes “working” at small scale thatshould adopt the biorefinery concept in Colombia
➢ 10-20 kWh gasification for electricity in not interconnected rural areas
➢ Metabolites extraction processes
➢ Small dairy plants , for example the milk whey problem
➢ Small coffee pretreatment plantes
RESEARCH GROUP OF CHEMICAL, CATALYTIC AND BIOTECHNOLOGICAL PROCESSES 54

Conclusions
Small scale, lower scale and available scale are the real questions.
Only High added value products can make very small scale biorefineriesfeasible.
The biorefineries scales can demonstrate the advantages over any stand alone only after a deep technical and economic analysis.
The logistics however finally will reduce the scale possibilities.
RESEARCH GROUP OF CHEMICAL, CATALYTIC AND BIOTECHNOLOGICAL PROCESSES 55

Thanks for your attention
Carlos Ariel Cardona Alzate M.Sc. Ph.DE-mail: [email protected] Nacional de Colombia Sede Manizales
RESEARCH GROUP OF CHEMICAL, CATALYTIC AND BIOTECHNOLOGICAL PROCESSES 56