Potential of Sewage Treatment Plants in Bangalore_V C Kumar_2013
56
POTENTIAL OF STP’S IN BANGALORE By V. C. Kumar Executive Engineer, BWSSB
-
Upload
india-water-portal -
Category
Education
-
view
2.518 -
download
4
description
This presentation gives comprehensive information on the various STPs in Bangalore
Transcript of Potential of Sewage Treatment Plants in Bangalore_V C Kumar_2013

POTENTIAL OF STP’S IN
BANGALORE
By
V. C. Kumar
Executive Engineer, BWSSB

A statutory organization set up in 1964under the BWSSB Act whose corefunctions & responsibilities include :
Providing water supply & sewerage andsewage disposal systems
Ensuring sufficient of domestic watersupply to the required standards.
Levying & collecting water/sanitationcharges on a no loss/no profit basis.
Bangalore Water Supply and Sewerage Board

BMRDA
Boundary
1306 Sq. Kms
CDP Boundary
594 Sq. Kms
Core Area
226 Sq. Kms
S.No. Boundaries
Sq.K
m
1 BMA 1306
2 Bruhath Bangalore 810
i) Core Area Sewerage
Catchments 245
ii)7-CMCs & 1-TMC 250
iii) 111 Villages around
Bangalore 315
Bruhath Bangalore Mahanagara Palike

B B M P
###
#####
##
###
# # ## ####
#
##
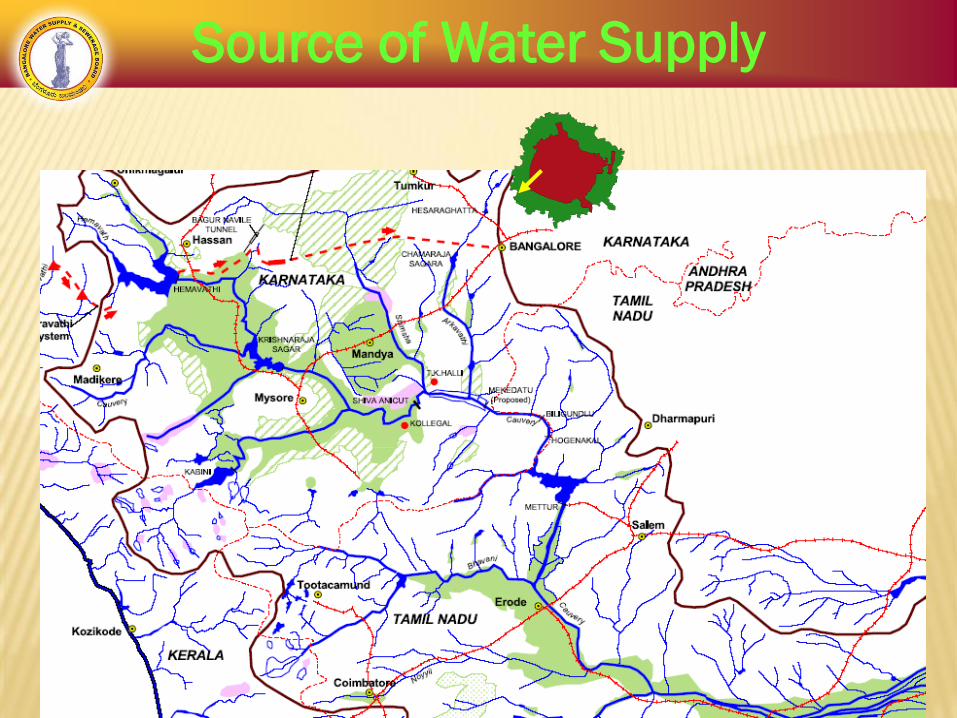
Source of Water Supply

Source of Water Supply

1891-1900 1896- Hesargatta WSS – untreated water
1921-1930 Hesargatta – Combined jewel filters
1931-1940 T G Halli Arkavathi WSS-27 MLD
1951-1960 1952-T G Halli – 45 MLD added
1961-1970 1964 – T G Halli – 135 MLD
1971-1980 1974 – CWSS I Stage – 135 MLD
1981-1990 1882- CWSS Stage II – 135 MLD
1991-2000 1993- CWSS Stage III – 270 MLD
2001-2010
2011-2020
2002 – CWSS Stage IV phase I -270 MLD
Proposed CWSS Stage IV Phase II – 500
MLD
Bangalore Water Supply

ProjectsYear of
commissioning
Installed
Capacity
(MLD)
Present
Supply
(MLD)
Arkavathy (TG Halli) 1933 149 0
Cauvery Stage I 1974 135 135
Cauvery Stage II 1983 135 135
Cauvery Stage III 1993 270 270
Cauvery Stage IV, Phase – I 2002 270 300
Cauvery Stage IV, Phase – II 2012 500 300
Total Supply 1459 1140
Present Water Supply
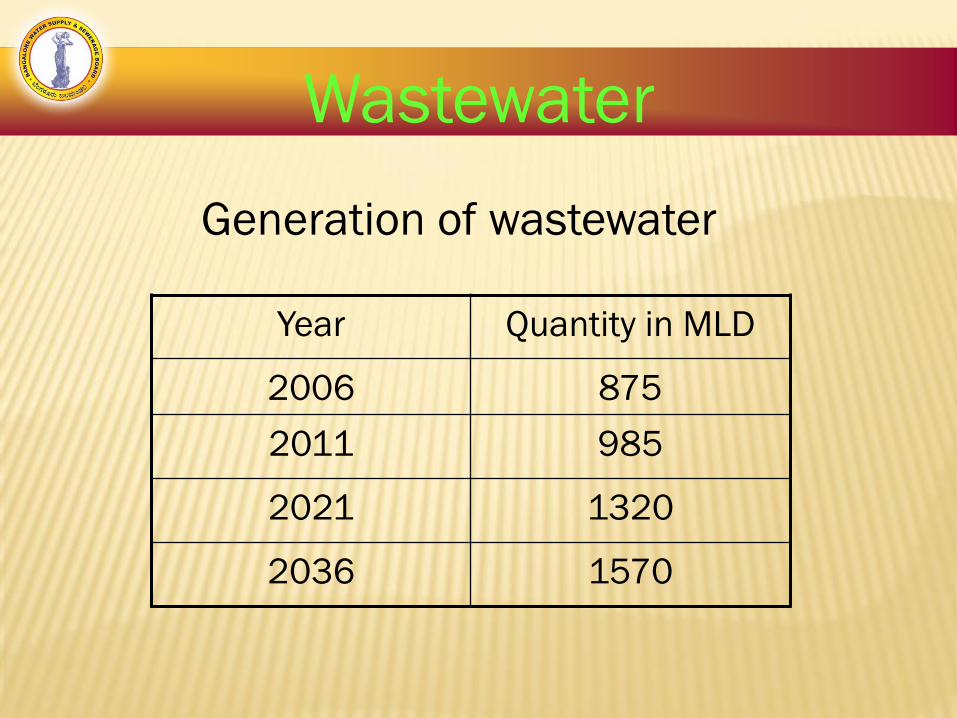
Year Quantity in MLD
2006 875
2011 985
2021 1320
2036 1570
Generation of wastewater
Wastewater

BANGALORE SANITATION
Bangalore is blessed with undulated terrain having natural gradient
Wastewater generated flows out of the city in all the four directions
Wastewater generated is collected and conveyed through the sewerage network to the treatment plants for treatment up to Secondary level and disposed to the natural course
BWSSB has setup 14 treatment plants of secondary and Tertiary level of various capacities all-round the city – 721 MLD Capacity
Four Tertiary treatment plants of total capacity 73 MLD has been established and treated water is reused for non potable purposes
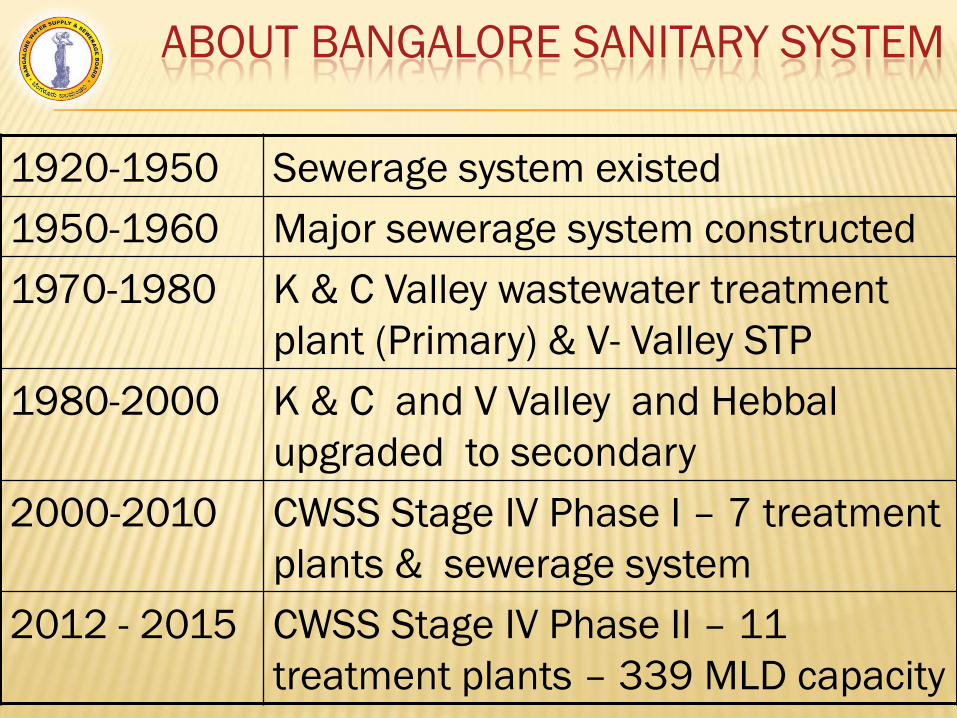
ABOUT BANGALORE SANITARY SYSTEM
1920-1950 Sewerage system existed
1950-1960 Major sewerage system constructed
1970-1980 K & C Valley wastewater treatment
plant (Primary) & V- Valley STP
1980-2000 K & C and V Valley and Hebbal
upgraded to secondary
2000-2010 CWSS Stage IV Phase I – 7 treatment
plants & sewerage system
2012 - 2015 CWSS Stage IV Phase II – 11
treatment plants – 339 MLD capacity
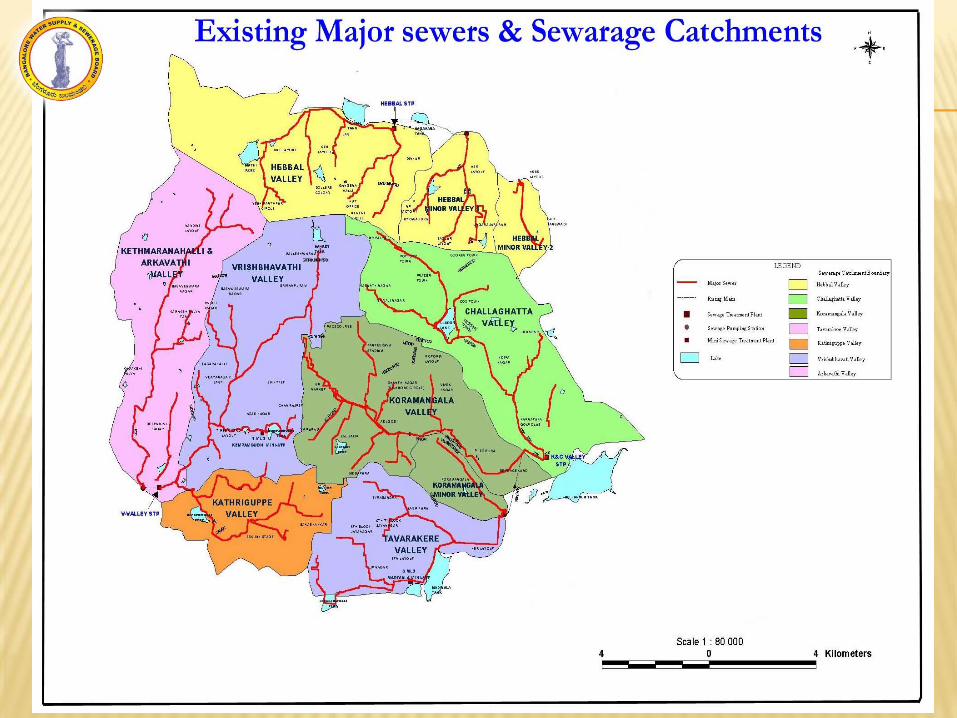
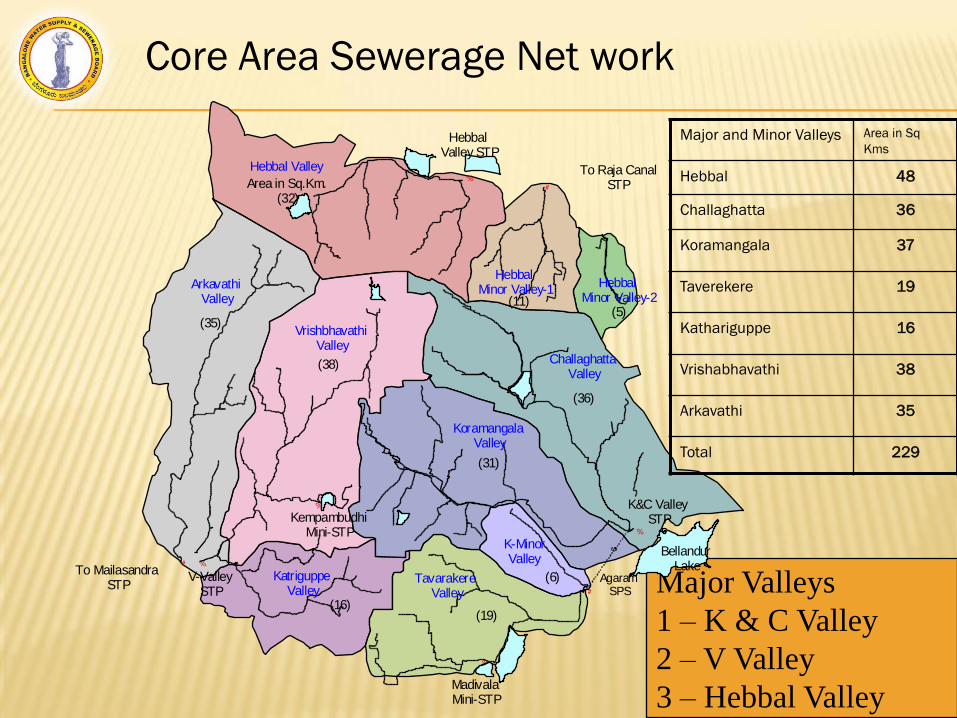
Core Area Sewerage Net work
Major Valleys
1 – K & C Valley
2 – V Valley
3 – Hebbal Valley
#
#
#
%
%
%
%
%
Hebbal Valley
ArkavathiValley
VrishbhavathiValley
ChallaghattaValley
KoramangalaValley
TavarakereValley
KatriguppeValley
HebbalMinor Valley-1
HebbalMinor Valley-2
AgaramSPS
V-ValleySTP
MadivalaMini-STP
K&C ValleySTPKempambudhi
Mini-STP
HebbalValley STP
(38)
(36)
(35)
Area in Sq.Km.(32)
(31)
(19)(16)
(6)
(11)(5)
K-MinorValley
To MailasandraSTP
To Raja CanalSTP
BellandurLake
$
Major and Minor Valleys Area in Sq
Kms
Hebbal 48
Challaghatta 36
Koramangala 37
Taverekere 19
Kathariguppe 16
Vrishabhavathi 38
Arkavathi 35
Total 229

•150 mm dia – 1490 Kms
•175 mm dia – 450 Kms
•225 mm dia – 1600 Kms
•300 mm dia – 275 Kms
•Total No. of Manholes –1,28,000
Abstract of sewer statistics < 400mm
Core Area
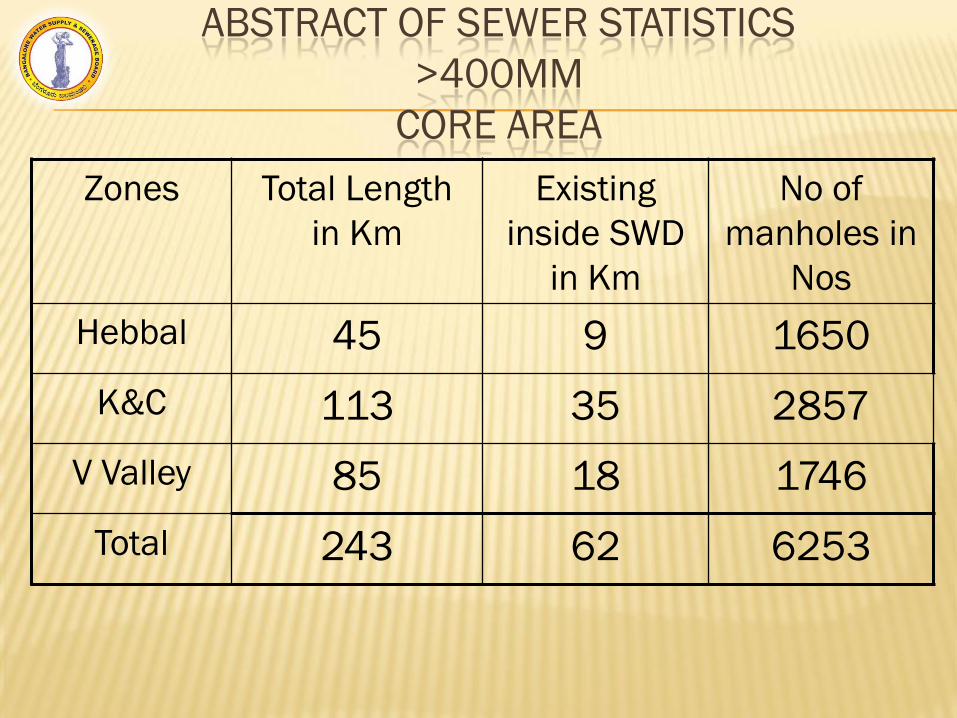
ABSTRACT OF SEWER STATISTICS
>400MM
CORE AREA
Zones Total Length
in Km
Existing
inside SWD
in Km
No of
manholes in
Nos
Hebbal 45 9 1650
K&C 113 35 2857
V Valley 85 18 1746
Total 243 62 6253

Wastewater Treatment Plants Sl.
No.Location
Capacity in
MLDTreatment Facility
Under CWSS I, II, III stages
1. Vrishabhavathi Valley 180 Secondary – Trickling filters
2. K & C Valley I 248Secondary: Activated sludge
process
3. Hebbal Valley 60Secondary: Activated sludge
process
4. Madivala 04Secondary: UASB + oxidation
ponds+ constructed wetlands
5. Kempambudhi 01 Secondary: extended Aeration
6. Yelahanka 10Activated sludge process +
filtration+ chlorination (Tertiary)

Wastewater Treatment Plants
Sl. No. LocationCapacity
in MLDTreatment Facility
7. Mylasandra 75 Secondary – Extended aeration
8. Nagasandra 20 Secondary -Extended aeration
9. Jakkur 10 Secondary – UASB +Extended aeration
10. K. R. Puram 20 Secondary – UASB +Extended aeration
11. Kadabeesanahalli 50 Secondary-Extended aeration
12. Rajacanal 40 Secondary- Extended aeration
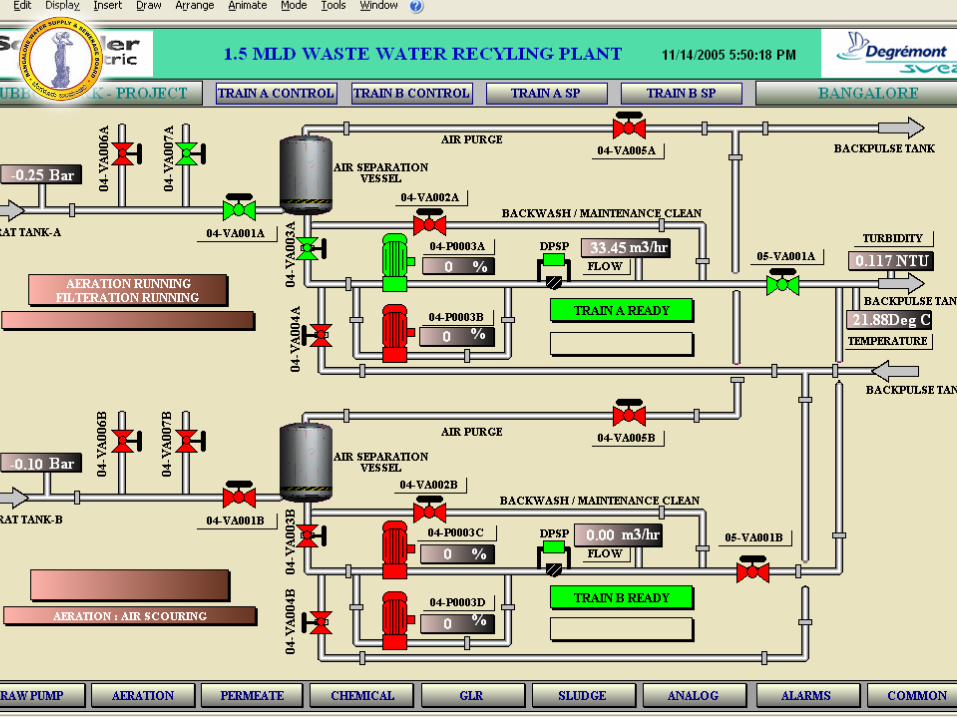
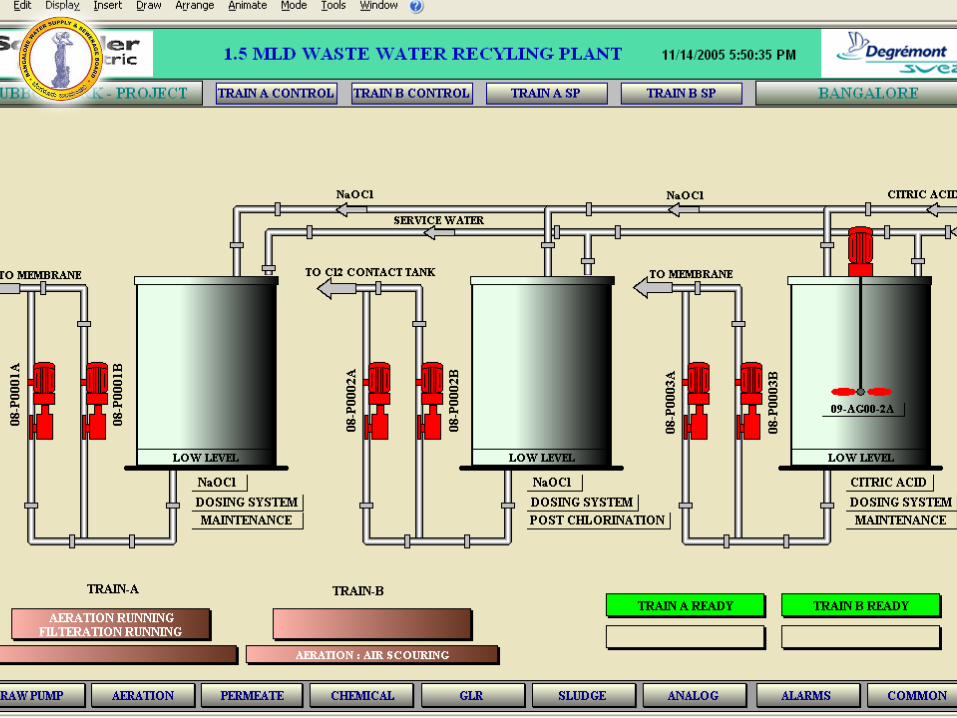
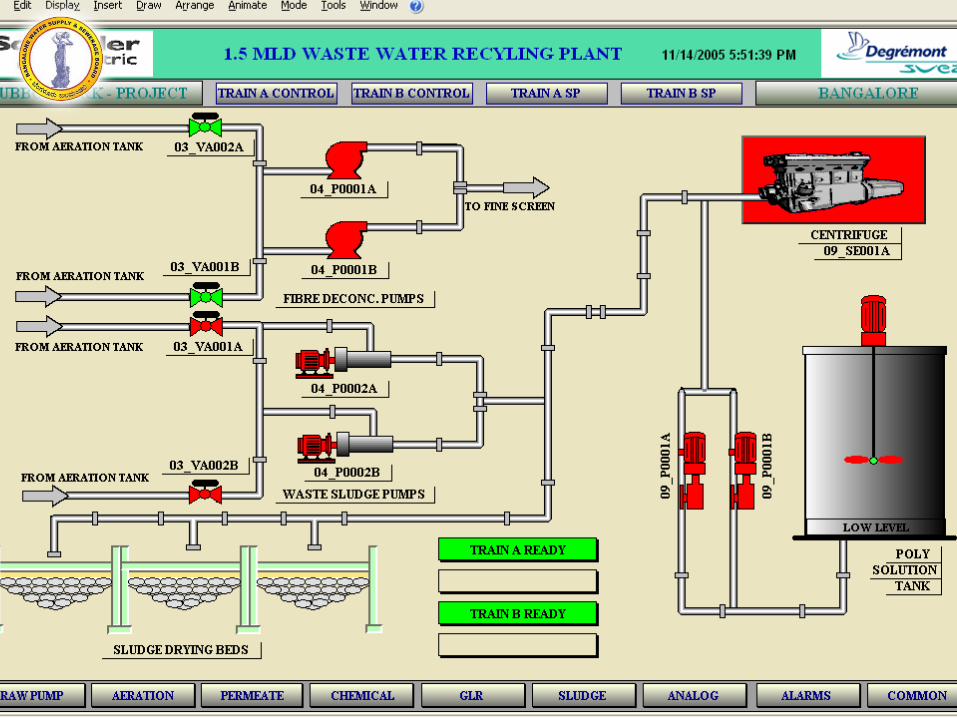
13. Cubbon Park 1.5 Membrane
14. Lalbagh 1.5Extended Aeration + Plate Settlers + UV
disinfection
Grand Total 721

Treatment plants proposed under CWSS Stage IV Phase II
Name Capacity in MLD Process (Including BNR)
Raja Canal 40 Extended Aeration (EA)
Horamavu Agara 20 Sequential Batch Reactor (SBR)
Nagasandra 20 SBR
Chikkabanavara 5 SBR
Kadugodi 6 SBR
Kachohalli 3 Membrane Bio – Reactor
Kengeri 60 Activated Sludge Process (ASP)
K & C Valley 60 ASP
Bellandur Amanikere 90 ASP
Doddabele 20 SBR
Yellemallappa Chetty Kere 15 SBR
Total 339
Wastewater Treatment Plants
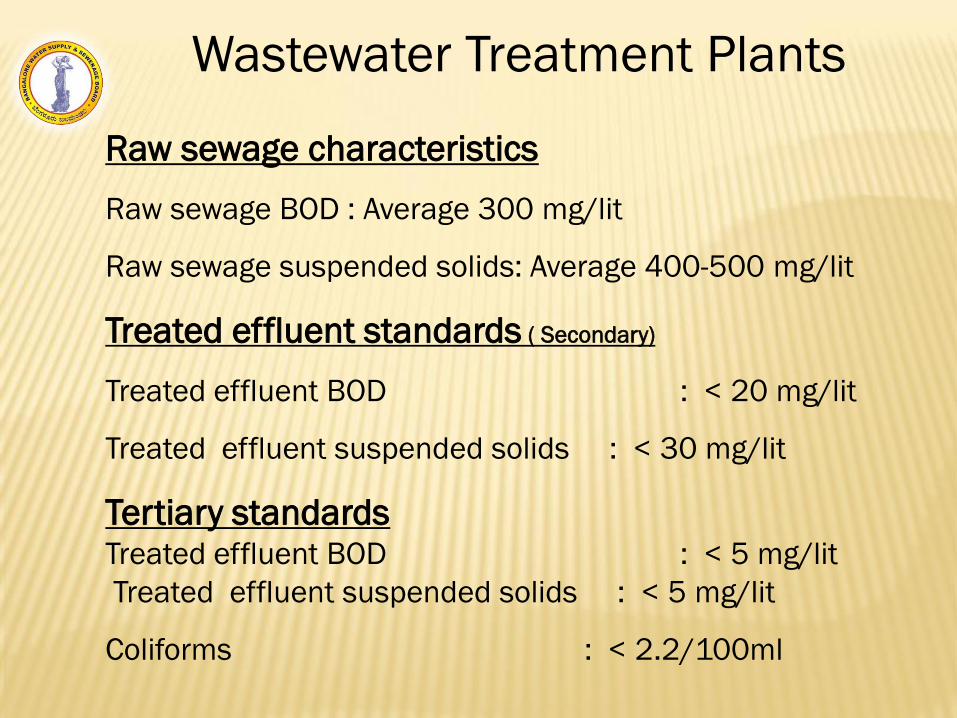
Raw sewage characteristics
Raw sewage BOD : Average 300 mg/lit
Raw sewage suspended solids: Average 400-500 mg/lit
Treated effluent standards ( Secondary)
Treated effluent BOD : < 20 mg/lit
Treated effluent suspended solids : < 30 mg/lit
Tertiary standardsTreated effluent BOD : < 5 mg/lit
Treated effluent suspended solids : < 5 mg/lit
Coliforms : < 2.2/100ml
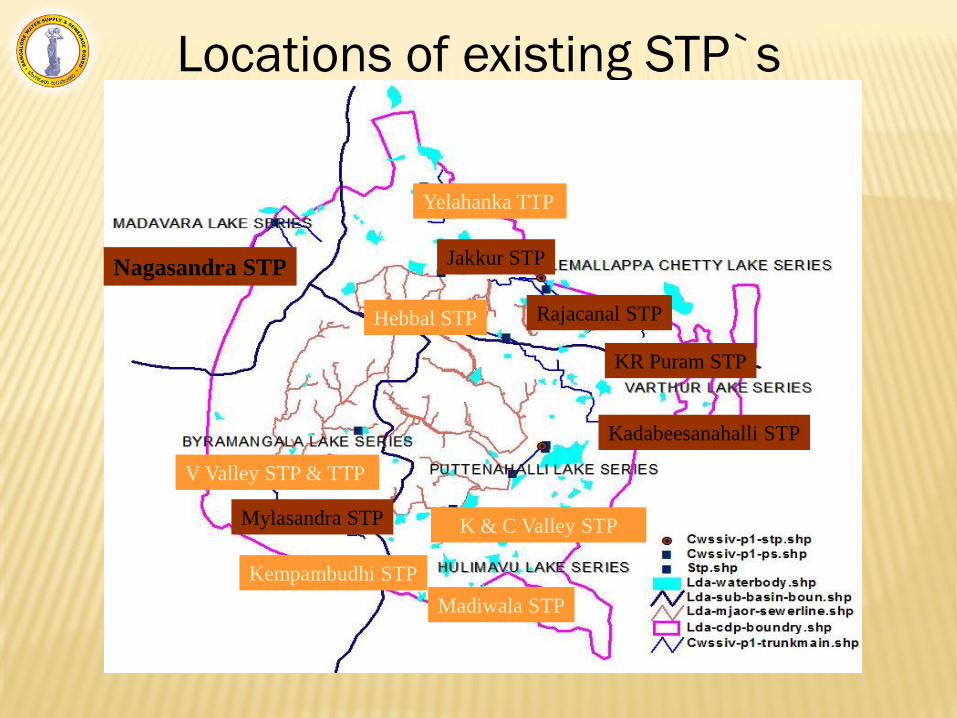
Locations of existing STP`s
Yelahanka TTP
Jakkur STP
Hebbal STP
KR Puram STP
Kadabeesanahalli STP
K & C Valley STP
Madiwala STP
Kempambudhi STP
Mylasandra STP
V Valley STP & TTP
Nagasandra STP
Rajacanal STP

K & C Valley STP (Activated Sludge Process)
Capacity 163 MLD
Capital cost 602 Lakhs
Installed capacity of power 1475 KVA
Power Charges 50 Lakhs per year
Cost of Man power utilised 25 Lakhs per year
Total O & M charges 75.60 lakhs per year
K & C Valley STP
Capacity 55 MLD additional module
Capital cost 2900 Lakhs
K & C Valley STP (Extended Aeration Process)
Capacity 30 MLD
Capital cost 2700
Lakhs
Installed capacity of power 750 KVA
K & C Valley Sewage Treatment Plant

Koramangala And Challaghatta
Valley Treatment Plant – 30 MLD
Plant
Agaram Pump House
K & C Valley treatment plant

Koramangala And Challaghatta Valley
Treatment Plant – 30 MLD Plant
Aeration Tank

Madiwala Water Reclamation Plant
Name of the STP : Madiwala STP
Location : Madiwala
Capacity : 4 MLD capacity
Treatment Process : First & Secondary
Year of Construction : 1998
Capital cost : 121 Lakhs
Catchment Area : Tavarekere
Effluent characteristics : BOD < 20m g/L & SS <30 mg/L
Installed Capacity of power : 35 KVA
Power Charges : 3.7 Lakhs per year
Cost of Man power utilised : 10.0 Lakhs per year
Total O & M charges : 13.7 lakhs per year
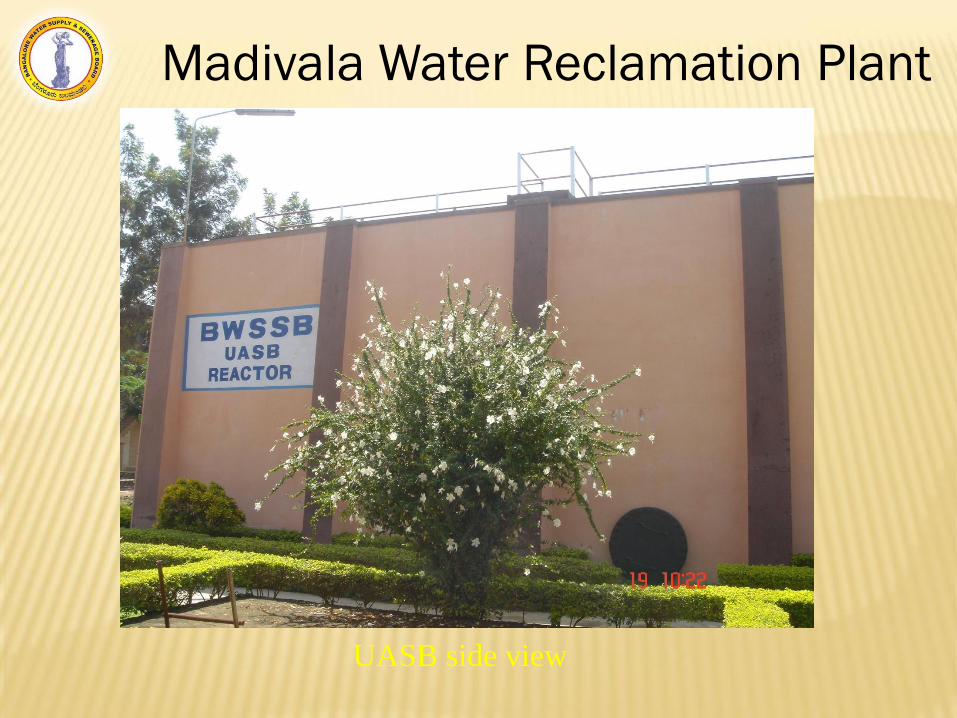
Madivala Water Reclamation Plant
UASB side view

Madivala Water Reclamation Plant
UASB with sludge withdrawal piping arrangement
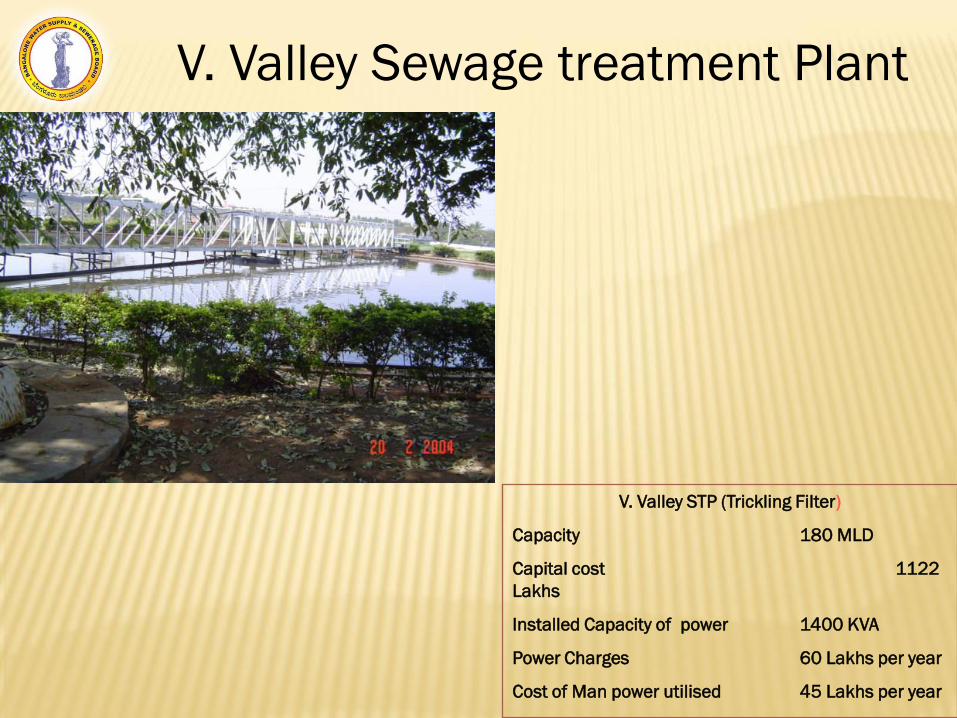
V. Valley STP (Trickling Filter)
Capacity 180 MLD
Capital cost 1122
Lakhs
Installed Capacity of power 1400 KVA
Power Charges 60 Lakhs per year
Cost of Man power utilised 45 Lakhs per year
Total O & M charges 105 lakhs per year
V. Valley Sewage treatment Plant

V. Valley Tertiary Treatment plant ( Trickling filter followed by
Densadeg and Flopac & disinfectin by Chlorination)
Capacity 60 MLD
Capital cost 3873 Lakhs
Power Charges 84 Lakhs per year
Cost of Man power utilised 37 Lakhs per year
Chemical Charges if any 36 Lakhs per year
Total O & M charges 157 lakhs per year
V. Valley Sewage treatment Plant - Recycling Plant
Effluent Standards
- BOD < 5 mg/ L
- SS < 5 mg/ L
- Turbidity < 2 NTU

V. Valley Sewage treatment Plant - Recycling Plant

V. Valley Sewage treatment Plant - Recycling Plant
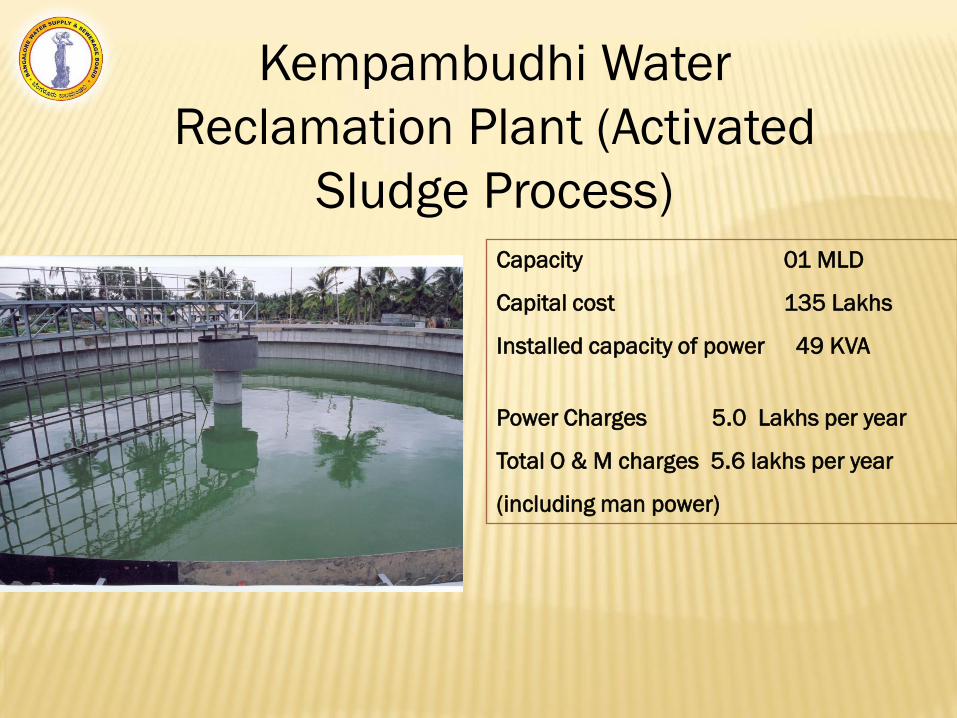
Capacity 01 MLD
Capital cost 135 Lakhs
Installed capacity of power 49 KVA
Power Charges 5.0 Lakhs per year
Total O & M charges 5.6 lakhs per year
(including man power)
Kempambudhi Water
Reclamation Plant (Activated
Sludge Process)

Hebbal Sewage
Treatment Plant (Activated Sludge
Process)
Capacity 60 MLD
Capital cost 1100 Lakhs
Installed capacity of power 975 KVA
Power Charges 114 Lakhs per year
Cost of Man power utilised 40 Lakhs per year
Total O & M charges 154 lakhs per year

YELAHANKA Tertiary
Treatment plant
(Conventional ASP followed
with filtration by
Chlorination)Capacity 10 MLD
Capital cost 3873 Lakhs
Installed capacity of power 500 KVA
Power Charges 84 Lakhs per year
Cost of Man power utilised 37 Lakhs per year
Chemical Charges if any 36 Lakhs per year
Total O & M charges 157 lakhs per year
Supplied to International Airport, BEL,
Wheel and Axle and other industries
Effluent Standards
- BOD < 5 mg/ L
- SS < 5 mg/ L
- Turbidity < 2 NTU

Capacity 1 MLD
Capital cost 135 Lakhs
Installed capacity of power 49 KVA
Power Charges 5.0 Lakhs / Year
Total O & M charges 5.6 lakhs / Year
(including man power)
Kempambudhi Water Reclamation
(Activated Sludge Process)

Capacity 75 MLD
Capital cost : 5200 Lakhs
MAILASANDRA STP
(Extended Aeration Process)

Capacity 50 MLD
Kadabeesanahalli STP
(Extended Aeration Process)
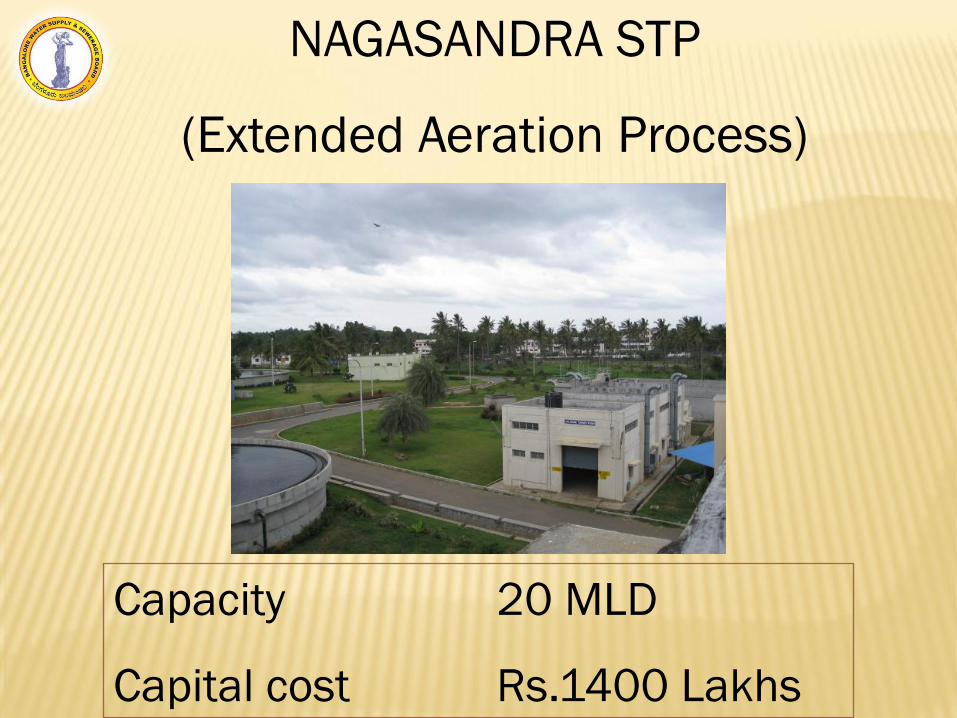
NAGASANDRA STP
(Extended Aeration Process)
Capacity 20 MLD
Capital cost Rs.1400 Lakhs
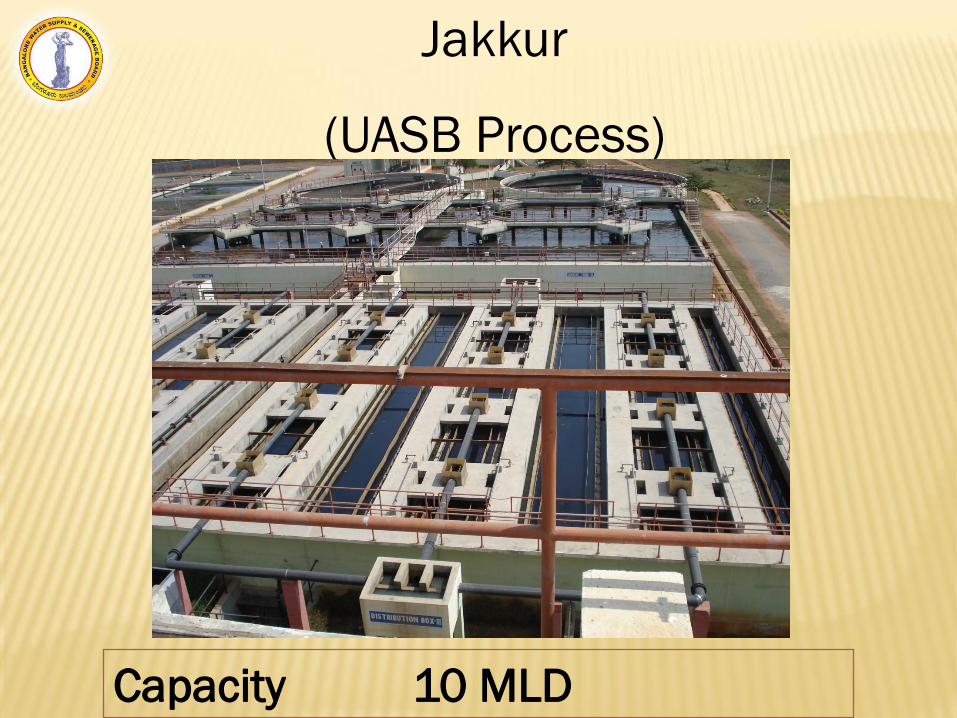
Jakkur
(UASB Process)
Capacity 10 MLD

K R Purum
(UASB Process)
Capacity 20 MLD

Rajacanal
(Extended Aeration Process)
Capacity 40 MLD

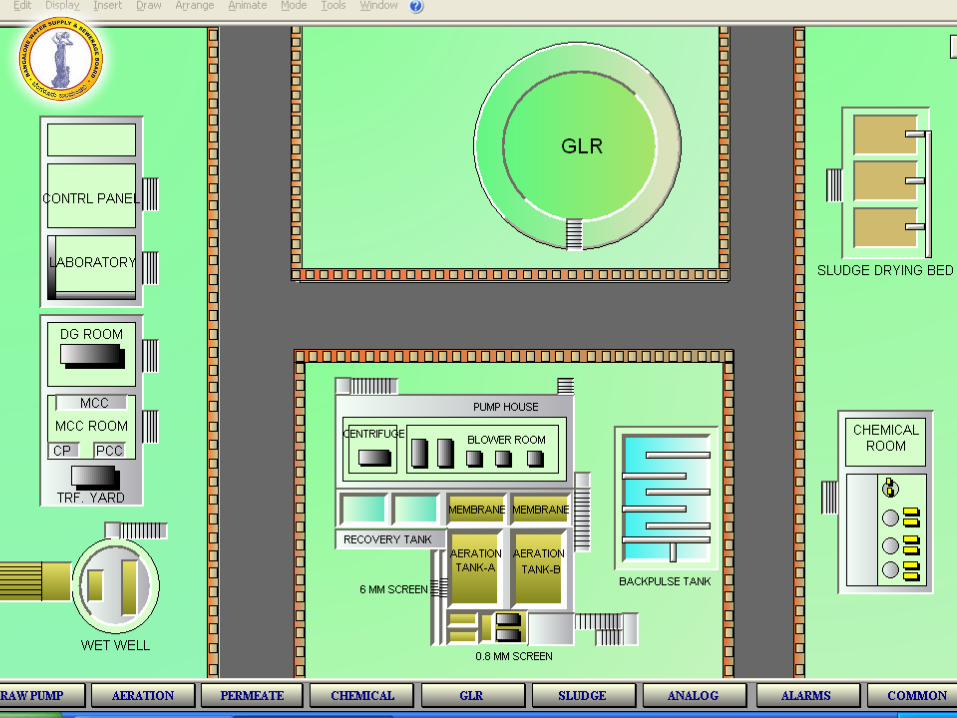
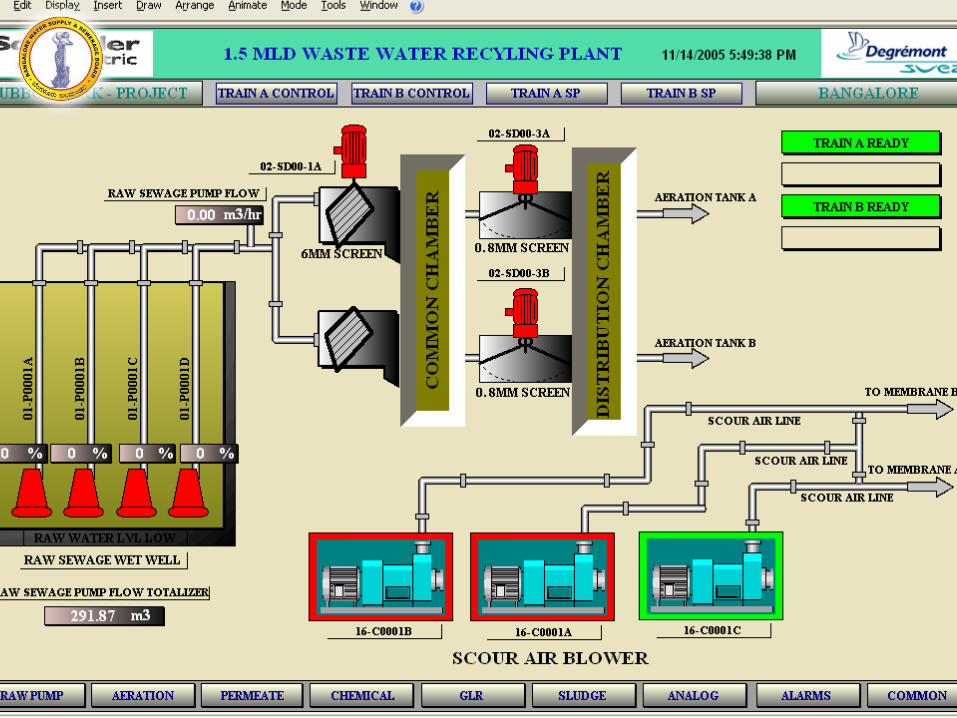
Cubbon Park
(Membrane Process)
Capacity 1.50 MLD
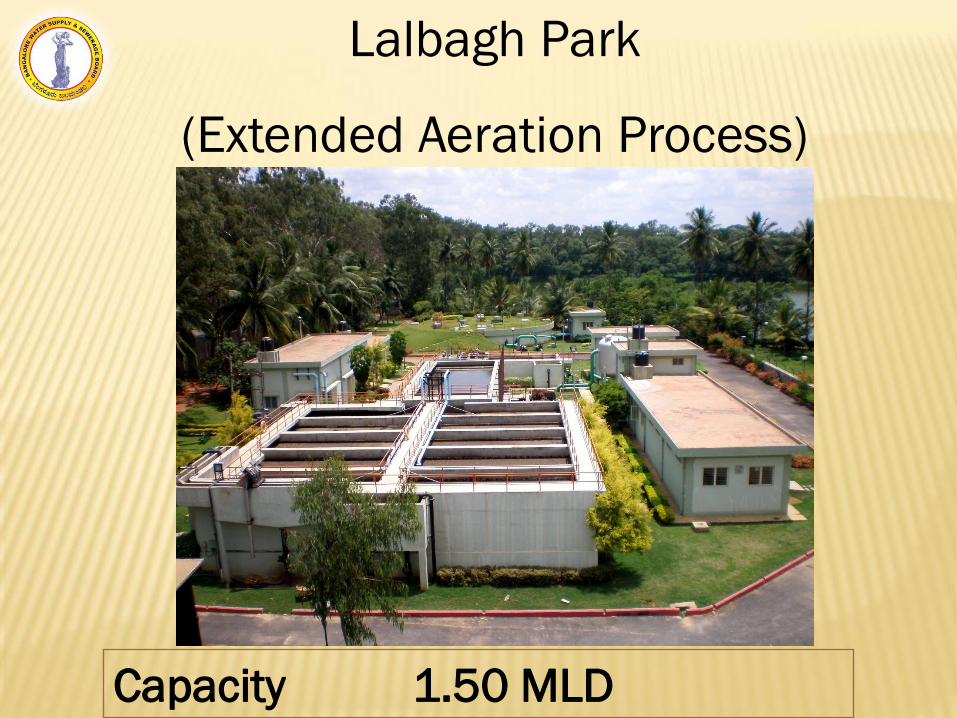
Lalbagh Park
(Extended Aeration Process)
Capacity 1.50 MLD

Tertiary Treated Water Utilizations
Sl. No. Consumer Wastewater
in KLD
1. International Airport 1000
2 BEL 1200
3. Wheel and Axle Plant – Railway 300
4. ITC Limited 300
5. IAF 200
6. Aravind Mills 1000
7. Cubbon Park 1500
8. Lalbagh 1500
TOTAL 7000
Selling rate - Rs.25/- per KL
Revenue - 4.50 Crores per year
Cubbon Park
Tertiary
Treatment Plant
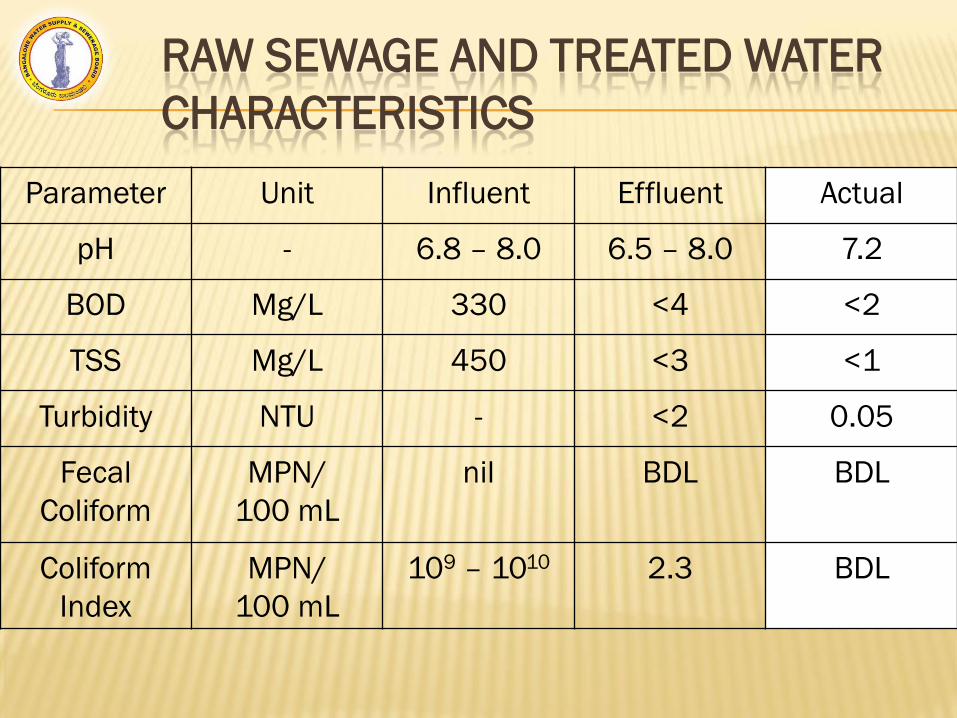
RAW SEWAGE AND TREATED WATER
CHARACTERISTICS
Parameter Unit Influent Effluent Actual
pH - 6.8 – 8.0 6.5 – 8.0 7.2
BOD Mg/L 330 <4 <2
TSS Mg/L 450 <3 <1
Turbidity NTU - <2 0.05
Fecal
Coliform
MPN/
100 mL
nil BDL BDL
Coliform
Index
MPN/
100 mL
109 – 1010 2.3 BDL


Treated wastewaterRaw Sewage
Quality of treated wastewater