Potential of Reclaimed Mine-land Habitat to Support ...
35
1 Final Report Potential of Reclaimed Mine-land Habitat to Support Northern Bobwhite – a pilot study Dean F. Stauffer Professor of Wildlife Science Department of Fisheries and Wildlife Sciences Virginia Tech, Blacksburg, VA 540-231-7349; [email protected] October 2011
Transcript of Potential of Reclaimed Mine-land Habitat to Support ...
1
Final Report
Potential of Reclaimed Mine-land Habitat to Support Northern Bobwhite – a pilot study
Dean F. Stauffer Professor of Wildlife Science
Department of Fisheries and Wildlife Sciences Virginia Tech, Blacksburg, VA
540-231-7349; [email protected] October 2011

2
Potential of Reclaimed Mine-land Habitat to Support Northern Bobwhite – a pilot study
Northern bobwhite populations are declining range-wide, and have been dramatically reduced in Virginia. A diversity of factors has been suggested as causes, but it is clear that habitat loss and modification have been a substantial contributor to this decline. Restoration, rehabilitation, and creating the early successional habitat conditions necessary for bobwhite have been promoted as potential management actions. The Virginia Quail Action Plan has set forth a number of goals, including managing for early-successional habitats to benefit quail. A stated goal for the Appalachian Mountains area of Virginia is a gain of about 15,000 coveys, to be achieved primarily through enhancement of agricultural lands. In far southwest Virginia, a substantial area of forested mountains has been and will continue to be disturbed during the process of surface coal mining. Under the guidelines of the Surface Mining Control and Reclamation Act of 1977, mine operators are required to reclaim mined lands to the approximate previous contours and to an equal or better land use. Much reclaimed land formerly was established as pastureland or placed into pines. More recently, the Forest Reclamation Approach (FRA) has been vigorously promoted and accepted by mine operators as the preferred means of reclamation (Burger et al 2005). These reclamation efforts result in a diversity of early successional habitats that might have the potential to support quail populations. If suitable conditions exist, there is the potential for the establishment of quail populations through translocation of individuals from established populations. However, it would not be efficient use of resources unless there was some certainty of success in the translocated individuals. Thus, it is reasonable to undertake a pilot study to evaluate the quality of the reclaimed mine lands in early successional ages in the context of quail habitat needs. The proposed goals of this pilot study were to: 1. Inventory habitat conditions that exist on reclaimed mine lands in Wise and Dickinson Counties, VA, focusing on habitat features known to be important to quail. 2. Summarize the data collected in #1 and apply to existing quail habitat suitability models and compare to studies that report habitat conditions in high quality quail habitat. 3. Based on the results from #3, provide recommendations as to the feasibility of translocation quail to reclaimed mine lands in southwest Virginia. Study Area Study sites were selected from available reclaimed mine lands in Lee, Wise and Dickenson Counties in southwest Virginia. The primary sites selected were located on the Powell River Project (PRP) area in Wise County and on the Public Access Lands for Sportsmen (PALS) in Dickenson County. The PRP is a cooperative mine reclamation research program. The goal is to conduct research and education programs that will enhance the restoration of mine lands. The PRP site has a diversity of habitat conditions including pasture, mid-successional pine/locust stands, and areas reclaimed with the FRA.
3
The PALS site is owned and managed by the Forestland Group, LLC in cooperation with the Virginia Department of Game and Inland Fisheries. Some areas on this site have been reclaimed to pastureland, while others are representative of typical early to mid-successional habitats on reclaimed benches. In addition, we secured additional study sites on recently reclaimed mine lands by contacting mine operators in the area. The location of sites selected for study is in Appendix 1. We sampled from sites that had been reclaimed within the last 10 years, emphasizing securing study sites reclaimed with the FRA approach. FRA sites typically are reclaimed with less emphasis on herbaceous cover establishment, and are planted to hardwoods. Some sites qualified as “FRA-compliant” that had hardwoods planted on them, even though they were not strictly reclaimed under the FRA approach. For comparison, we also sampled from traditionally reclaimed sites, sites reclaimed to pasture, sites that had gone through natural succession, and sites from the pre-SMCRA era when active reclamation was not practiced. Table 1 has general descriptions of the sites and acronyms to be found in the data sets. METHODS Field A number of habitat features have been determined to be important to northern bobwhite (Schroeder 1985, Barnes et al. 1995). The Habitat Suitability Index model (Schroeder 1985) represents a synthesis of all studies available at the time of habitat characteristics important to quail. A subsequent evaluation of the bobwhite HSI model showed that the cover and brood components of the model modified by the USFWS for application to CRP lands in the Southeast reasonably predicted habitat quality (Tonkovich 1995). Based on habitat features shown in the literature and the HSI model to be important to quail, and from discussions with Marc Puckett of DGIF, we selected the following characteristics to measure to evaluate habitat (estimation method in parentheses): - Percent cover of herbaceous canopy (point intercept) - Percent cover of grass (point intercept) - Percent cover of woody vegetation < 2 m tall (point intercept) - Percent bare ground (point intercept) - Percent open ground (point intercept) - Percent cover of litter (point intercept) - Percent cover of quail foods (0.25m2 plots) - Percent of herbaceous cover that is grass (calculated from data) - Percent of area within 100m than is composed of woody thickets (estimated from transect center in Daubenmire classes) - Distance to nearest woody thicket (estimated from transect center) - Height of herbaceous cover (measured with meter stick) On each sampling area we located as many individual sites as possible that were less than 10 years old and superficially appeared to have the potential to serve as quail habitat. The number of sites on a study area ranged from 3 to 14 (Table 1). On each site within study areas, we established 40-m transects as sampling frames for habitat data collection. The number of transects sampled at each site ranged from 2 to 15, depending on the extent of the reclaimed patch. Ttransects constituted the basic sampling unit for the study and were located at least 50 m

4
apart. Using the point-intercept method we recorded the presence/absence at 2-m intervals (20 points) along the transects of bare ground, herbaceous cover, grass, woody vegetation < 2m in height, open ground and litter. These data allowed calculating the percent cover along the transect. We recorded the herbaceous vegetation height at each of the 20 points sampled along the 40 m transect and averaged these measurements to get a value for the transect. From the center of each transect we estimated the distance to the nearest wood covert at least 15 m across, and estimated the percent cover of woody vegetation within 100 m of the transect center. At the 0, 10, 20, 30 & 40 m intervals on the transect we established 0.25 m2 plots (0.5m X 0.5m). We estimated the percent cover of all plant species that could serve as quail food within the plot using Daubenmire (1959) classes: <1%, 1-5%, 5-25%, 25-50%, 50-75%, 75-95%, 95-100%. These data allowed estimation of the cover of all quail food plants. The GPS coordinates of each transect were recorded along with a description of the covertype. We will locate sampling transects randomly within each of the reclaimed patches being sampled at an approximate density of 4 transects / ha. After we have collected preliminary data from 25 transects, we will summarize the data and determine the number of samples necessary to be 90% confident we are within 5% and 10% of the true mean values for each variable. This sample size was then used to guide subsequent sampling. All Field data were collected June and July 2010. QUAIL HSI MODEL The initial USFWS Northern Bobwhite HSI model (Schroeder 1985) was relatively complex and designed to accommodate a diversity of cover types. In 1989 the USFWS developed a simplified version of the model intended for use specifically to evaluate quail habitat on Conservation Reserve Lands in the southeast. Tonkovich (1995) conducted a field evaluation of this model and suggested revisions based on data collected in Halifax County, VA. I used a modified version of this model to evaluate habitat potential on the reclaimed mine lands. Details of the model components can be found in Schroeder (1985) and Tonkovich (1995); I here provide an overview of the concept and structure of HSI models. Habitat Suitability Index models are based on the assumption that animal populations are linked in some way to habitat features, and that this relationship can be analyzed and integrated to provide an index to habitat quality. The output of the model ranges from 0.0 (no habitat quality) to 1.0 (optimal habitat). The initial step of developing an HSI model includes the basic life requisites (LR) that are necessary to meet the needs of the species being modeled. For quail, the identified life requisites are: cover (escape & winter), food and nesting cover. Once life requisites are identified, specific variables are identified that can be used to evaluate the ability of habitat to meet these life requisites. These variables are represented in Suitability Index (SI) models, which can take the form of graphs, equations, menus, or other model forms. Ideally, each SI will reflect a synthesis of all the best available data and knowledge about how habitat suitability varies with each variable for the species of interest. I here review the life requisites, SI curves, and rationale for the quail HSI model. COVER Life Requisite The cover life requisite is represented by the percent the area that has woody cover up to 2
5
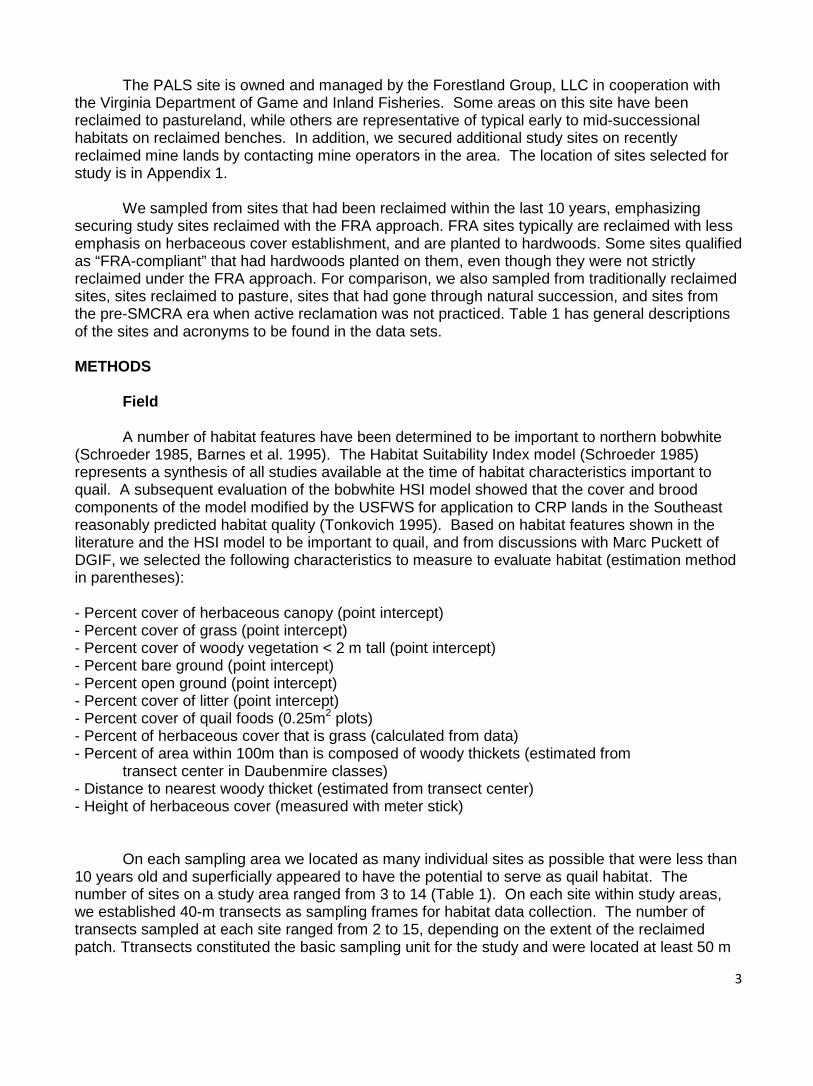
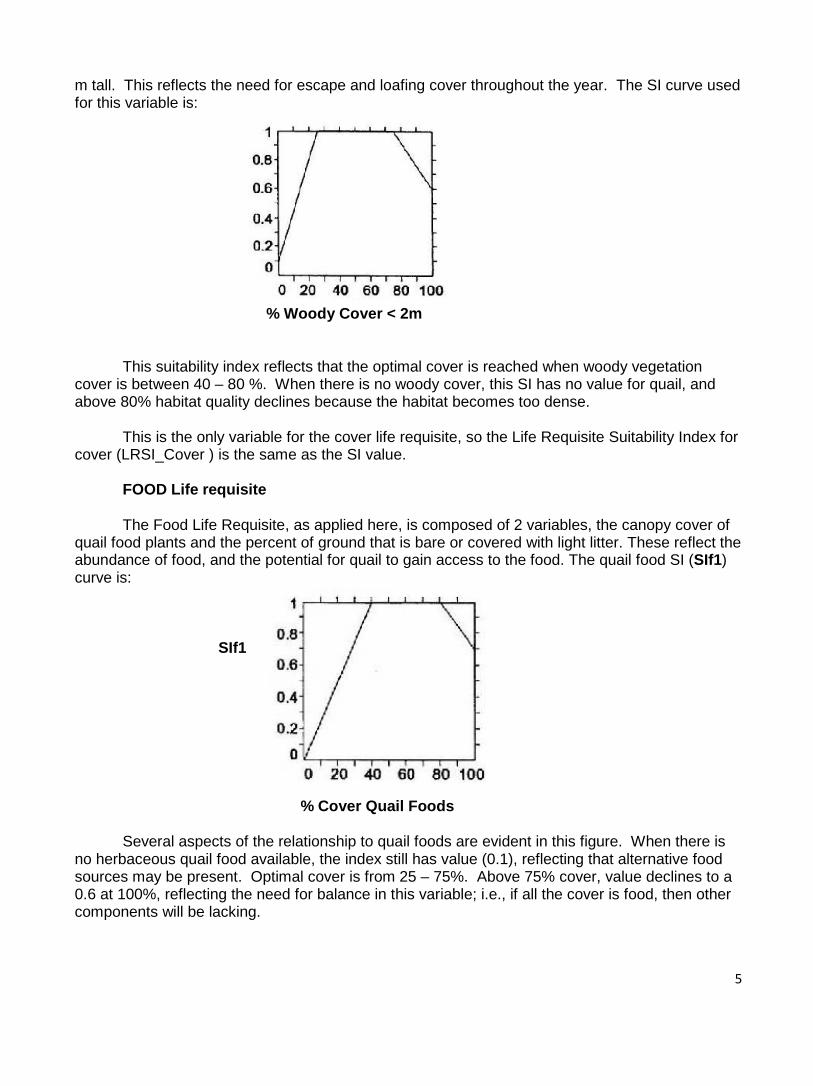
m tall. This reflects the need for escape and loafing cover throughout the year. The SI curve used for this variable is: % Woody Cover < 2m This suitability index reflects that the optimal cover is reached when woody vegetation cover is between 40 – 80 %. When there is no woody cover, this SI has no value for quail, and above 80% habitat quality declines because the habitat becomes too dense. This is the only variable for the cover life requisite, so the Life Requisite Suitability Index for cover (LRSI_Cover ) is the same as the SI value. FOOD Life requisite The Food Life Requisite, as applied here, is composed of 2 variables, the canopy cover of quail food plants and the percent of ground that is bare or covered with light litter. These reflect the abundance of food, and the potential for quail to gain access to the food. The quail food SI (SIf1) curve is: SIf1 % Cover Quail Foods Several aspects of the relationship to quail foods are evident in this figure. When there is no herbaceous quail food available, the index still has value (0.1), reflecting that alternative food sources may be present. Optimal cover is from 25 – 75%. Above 75% cover, value declines to a 0.6 at 100%, reflecting the need for balance in this variable; i.e., if all the cover is food, then other components will be lacking.

6
The second food variable is the percent of open ground, or ground with light litter. This is used to represent the ability of quail to forage effectively on the ground. Because they do not “scratch” when foraging, they need to be able to see the seeds on the ground they forage on. The SI curve for this variable (SIf2) is: SIf2 % Open Ground Optimal open ground occurs from 30 – 60% open. Above 60% open ground, suitability declines as the cover becomes too open. Even at 0% open ground, the SI is 0.1 since a quail may be able to minimally forage under those conditions. The two SI values are combined at a geometric mean to derive the Life Requisite SI for Food as: LRSI_Food = (SIf1 * SIf2)1/2 NESTING Life Requisite The life requisite for nesting (LRSI_Nest) comprises 3 habitat components. The first component is the percent canopy cover of herbaceous plants. The SI curve for this variable (SIn1) is: SIn1 % herbaceous canopy cover Sites with < 10% herbaceous canopy cover have no suitability for this variable. Optimal cover is between 40% - 60%, and when herbaceous cover exceeds 60% suitability declines to a level of 0.4 when herbaceous cover is 100%. Basically, moderate herbaceous canopy cover is optimal for quail nesting.

7
The second variable used to assess nesting cover suitability is the proportion of the herbaceous cover that is composed of grasses or graminoids (SIn2) : SIn2 % of Herbaceous Cover Comprising grass The optimal situation is when approximately 50% (40-60) of the herbaceous vegetation is composed of grass or graminoids. Areas with less or greater grass proportions have lower suitability. At the low end, even if 100% of the herbaceous cover is forbs (i.e., 0% grass), there is still some suitability (0.1) since quail can nest under these conditions. As cover becomes quite dense, the suitability also declines. The last variable used to assess nesting cover is the proportion of open area at ground level. The SI curve for this variable (SIn3) is: SIn3 % open area at ground level When the area at ground level is about 30% - 60% open conditions are optimal as there is enough cover for nesting, yet it is open enough for easy movement. If < 5% of the area is open there is no value, and suitability declines as % open area increases from 60% to 100%.

8
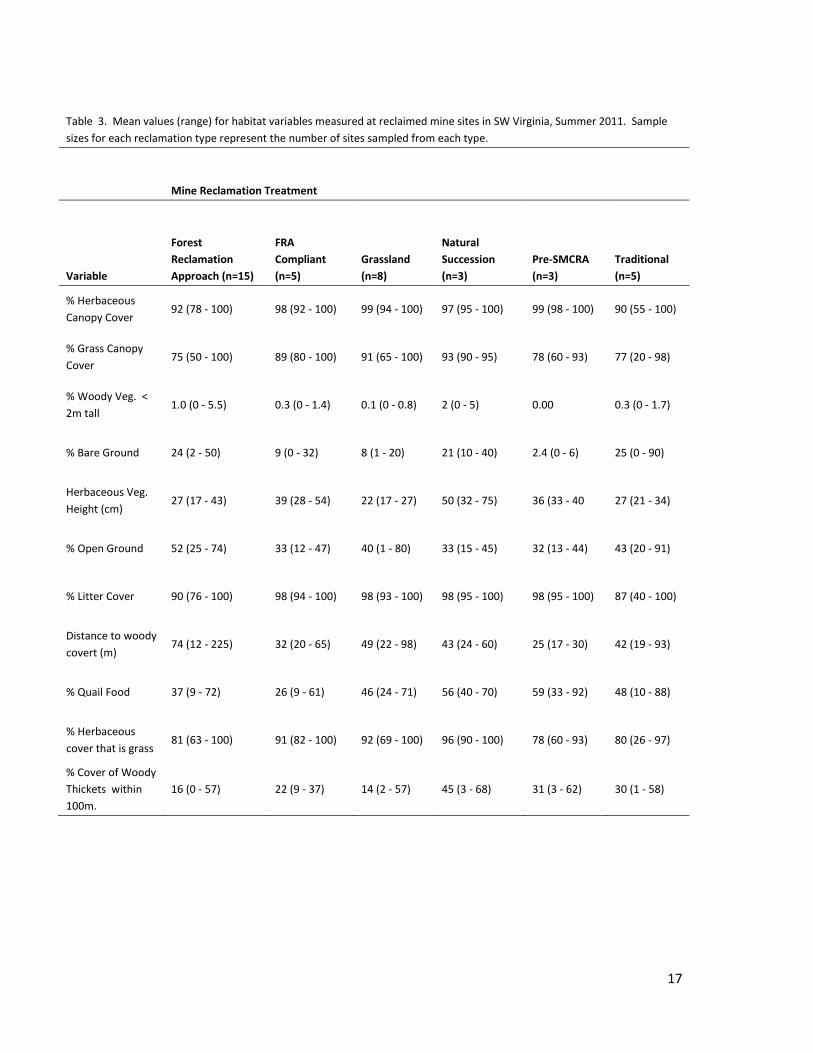
These three SI values are combined in a modified geometric mean to derive the life requisite for nesting: LRSI_Nest = (SIn1*SIn2*SIn3)1/2 HSI Calculation It is assumed that any of the 3 life requisites can be limiting on a site. Thus, by applying Liebig’s Law of the Minimum we derive the overall HSI value as the minimum of the life requisite values: HSI = minimum (LRSI_Cover, LRSI_Food, LRSI_Nest) DATA ANALYSIS All data were entered into EXCEL data bases, cleaned, and then imported into SAS for analysis. Transects constituted the basic sampling unit, and all variables estimated at intervals along the 229 transects sampled were summarized at the transect level. Once transect data were summarized, all data were averaged by study site & cover type (reclamation type) combinations. These samples constitute the basic analysis units for the survey as transects sampled within a site treated in the same manner cannot truly be considered to be independent samples; however, sites were separated by at least several hundred m, and can considered independent of one another. I applied the HSI model to the data summarized at the site/treatment level to provide an overview of the habitat potential for each sample. These data were further summarized to provide an overall mean value and range of data values for each of the reclamation treatments evaluated. RESULTS AND DISCUSSION Vegetation characteristics The mean values of habitat variables for each of the individual sampling units can be found in Table 2. The summary data are located in Table 3, and this is the more informative one for discussion. It is evident that all of the reclamation treatments had quite high herbaceous cover, being above 90% on all sites. The lowest cover recorded on any site was 55%. The percent grasses/graminoids (non grasses were typically Carex spp. or Juncus spp.) cover ranged from 75% to 93% on average and was lowest on FRA and Traditionally reclaimed sites (Table 3). The percent of all herbaceous cover that was composed of grasses ranged from 78% - 98%; clearly, grasses are a dominant component of the herbaceous cover on reclaimed sites. The percent cover of bare ground was relatively low, ranging from 2.4% to 25%, on average. This may be important in terms of a quail’s ability to forage efficiently for seeds. The litter cover on the ground ranged from 87% - 90% across reclamation types. While this may initially seem contradictory to the bare ground cover, we often encountered areas that had very light litter, with bare ground beneath, so the point could be classified in both categories. We also estimated the % open ground at the points, with “open ground” being defined as being open enough for a quail to move through. This was an attempt to evaluate how easily quail might be able to travel through these areas. The % open ground ranged from 33% on FRA

9
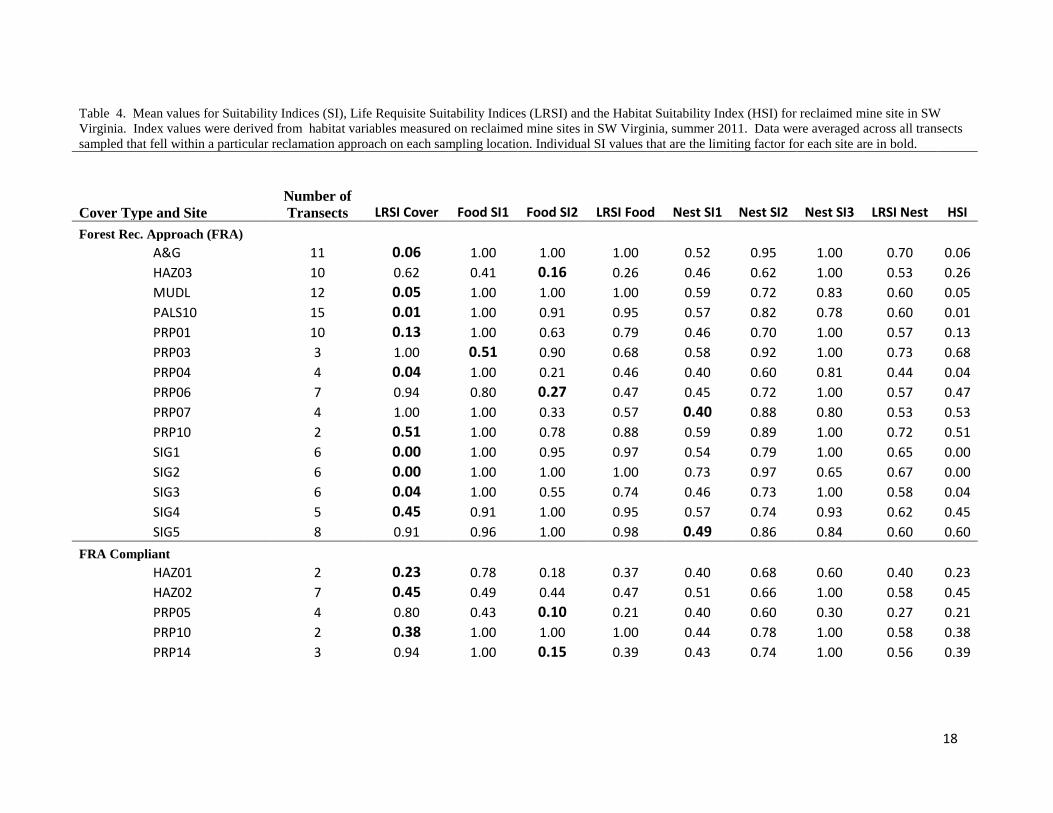
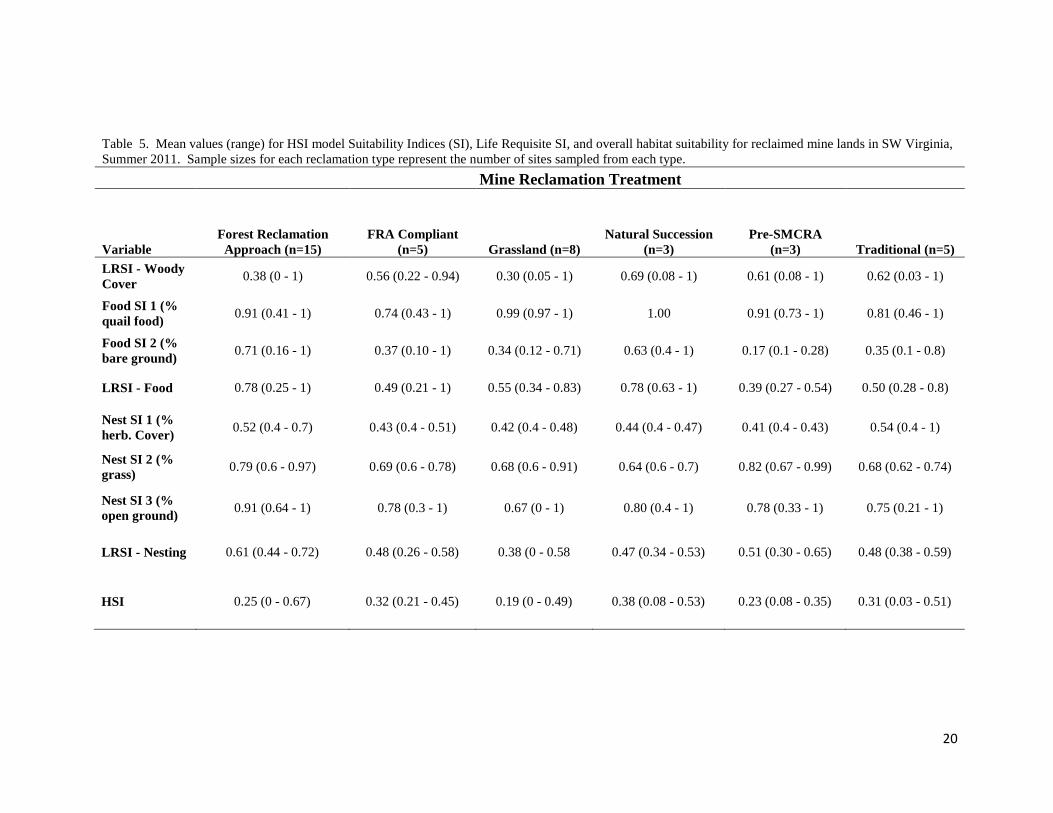
compliant, natural succession and Pre-SMCRA sites to around 50% on FRA sites. The cover of woody vegetation along transects on the sites was quite low, being under 5% in all cases. This reflects the selection of transects to fall within the reclaimed site, where the trees that had been planted would be relatively young and canopy cover low. The percent woody thicket cover within 100m of transects tended to be higher, ranging from 14% on grassland sites to 45% on areas that had undergone natural succession. Generally this indicates that potential loafing and hiding cover is relatively close to most areas that have been reclaimed. Habitat Suitability Index Model Detailed data for the HSI model results on each site sampled are summarized in Table 4. I here discuss the summary of these values presented for each reclamation approach as presented in Table 5. When evaluating the results from an HSI model, it is often quite useful to inspect the individual Suitability Index (SI) values along with the Life Requisite Suitability Index values (LRSI) in addition to the overall HSI value. Cover Life Requisite-- The cover life requisite is based on only the variable of percent cover of woody vegetation, reflecting the potential for loafing, hiding and escape cover. The average cover LRSI values ranged from 0.38 on FRA sites to 0.69 on sites subject to natural succession. The range in values on individual sites was considerable, covering the potential range from 0.0 to 1.0. The conclusion is that most sites on average provide moderate to good cover, with some individual sites being excellent while some have little potential for cover. Food Life Requisite-- The food life requisite reflects the combination of the percent cover of quail foods, and the percent bare ground that allows efficient foraging by quail. The Food SI 1 (quail foods) ranged in value from 0.91 to 1.0 on average, indicating that there was excellent availability of potential quail foods on the reclaimed sites. The lowest SI value observed for this variable was a 0.41 on an FRA site. This value may be somewhat misleading, however. We were relatively liberal in our definitions of quail foods, and included any species that produced seeds known to be eaten by quail. Thus, while many of the plant species encountered do have seeds that in fact are eaten by quail, they may not necessarily be high-quality or highly preferred species. Details on the species composition are presented in the next section. The bare ground SI showed more variation than did the food SI, ranging from an average low of 0.17 on pre-SMCRA sites to 0.71 on FRA sites. The higher quality of open ground on the FRA sites likely reflects their relative “newness” and that the vegetation had not had many growing seasons to form a thick layer of litter on the ground that would preclude quail foraging. The overall LRSI for food ranged from fair to good across the reclamation types. It was highest on FRA sites and those subject to natural succession (0.78 in both cases). Food suitability was lowest on pre-SMCRA sites, reflecting the very low amount of bare ground found on these sites (Table 2). Thus, it appears that food may be adequate for quail, assuming the plant species producing seeds are actually preferred by quail. Nesting Life Requisite-- The nesting LRSI is composed of three variables. The first reflects the quality of herbaceous cover. This SI was uniformly moderate across all sites sampled, ranging from 0.41 on pre-SMCRA sites to 0.52 on sites subject to traditional reclamation. The values of SI2, the percent of herbaceous cover composed of grass, tended to be

10
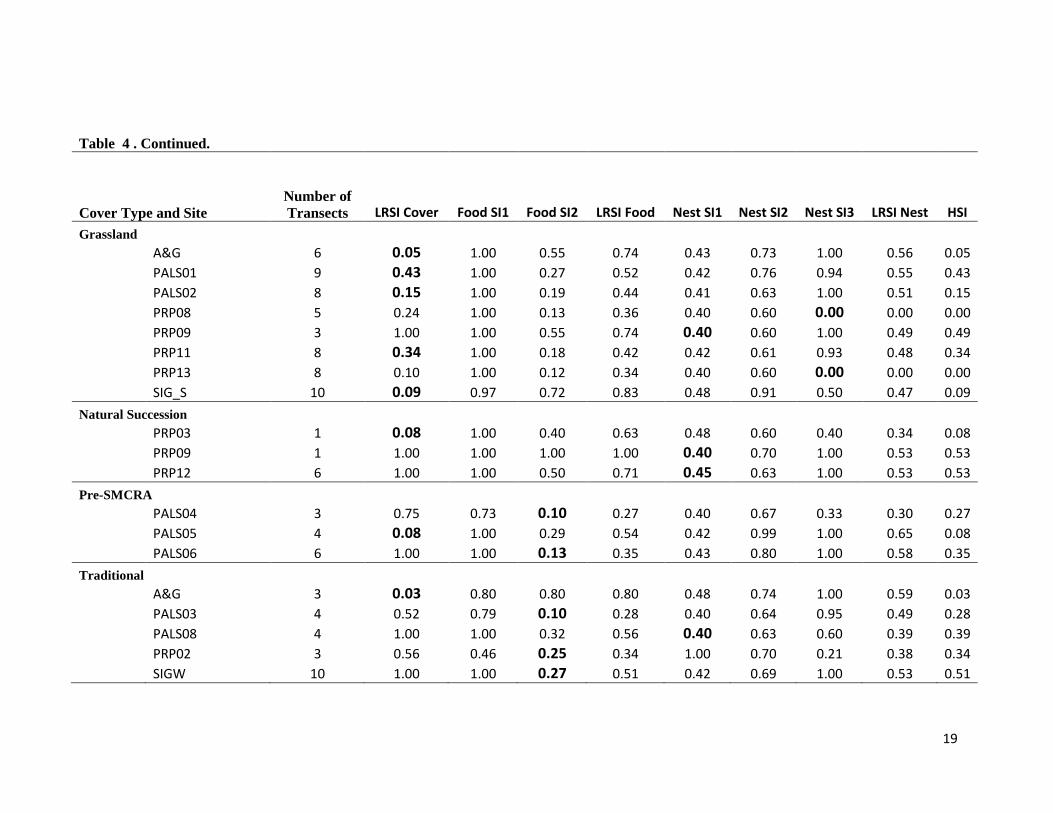
moderate to good, with values ranging from 0.64 on natural succession to 0.82 on pre-SMCRA; FRA sites were also high with an average SI of 0.79. Overall, this indicates that the mix of grass and forbs is generally good on most sites, but none of the sites fell within the optimal range of 40%-60% of the herbaceous vegetation being grass. In all cases, the percent of herbaceous cover that is grass was quite high (Table 3), and sites with a more even mix of grasses and forbs would be more suitable for nesting. The third component for the nesting LRSI (SI3) is a function of the amount of open cover at ground level, allowing movement of hens and their broods. SI values for this variable ranged from 0.67 on grassland areas to 0.91 on FRA sites. This likely reflects the relative lack of vegetation development on the FRA sites, hence a more open stratum at ground level allowing easier quail movement. To determine the overall HSI the model takes the minimum of the three life requisites under the assumption that the habitat component that has the lowest value will be the most limiting to the animal. Because the HSI values in Table 5 represent the means taken of the site-specific HSI values presented in Table 4, the mean HSI value will not necessarily be the minimum mean LRSI value for a cover type. Overall, the potential of reclaimed mine sites to support quail is poor to fair; the mean HSI values ranged from 0.19 for grassland sites to 0.38 for the three sites representing natural succession. The site with the highest HSI value of 0.68 was an FRA site on the Powell River Project (PRP03, Table 4). It is more informative to consider the distribution of HSI values across the sites that were sampled. These data from Table 4 are presented in Figure 1. Figure 1. Distribution of HSI values across 39 sites sampled on reclaimed mine lands to assess potential as quail habitat. It is clear that the majority of sites have quite low potential to support quail at this time,
11
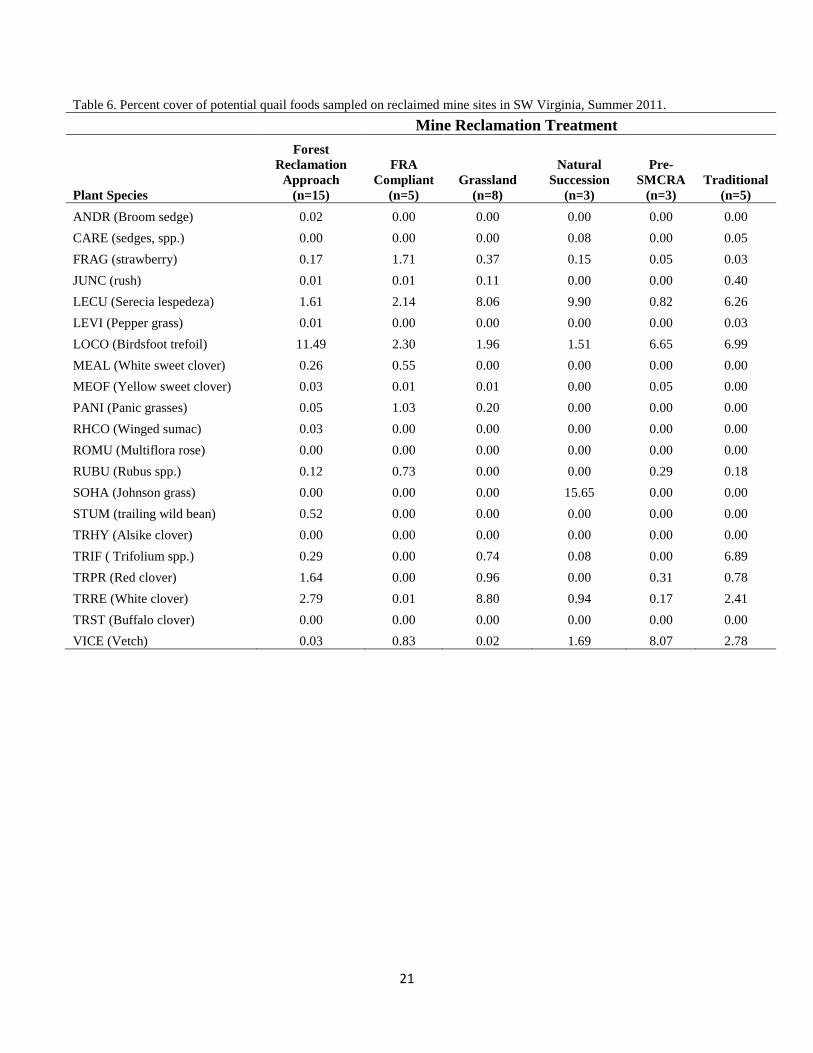
based on the HSI values. Seven sites had an HSI > 0.50, and these do have the potential for supporting modest numbers of quail. Of these sites, 4 were on FRA sites, 2 were natural succession, and 1 was on a traditionally reclaimed site. Perhaps one take-home message from this is that of the reclamation approaches used, the FRA has the most potential for providing quail habitat. Limiting Factors One aspect that can complicate the interpretation of models is that they represent the synthesis of multiple factors in a non-linear fashion. As a result, while we might have two areas with similar HSI values, it doesn’t mean they are totally similar, because different factors might be the limiting factor on the sites. Thus, it is instructive to inspect individual sites and evaluate which habitat component is the most limiting. In Table 4 the individual SI values that are most limiting or restrictive and responsible for the HSI value are indicated in bold. Over 50% of the 39 sites sampled had escape/loafing/hiding cover as the most limiting factor. Optimal habitat has 40% to 80% cover, and cover was lower on all the sites sampled. At a landscape scale, quail habitat can be optimal for this factor if 20% of the total area within a typical covey range (say 20 ha or so) has optimal cover (Tonkovich 1995); this might be met within the mining landscape, but a geospatial analysis was not conducted for this survey. The next most limiting factors were related to quail foods. For 9 sites Food SI2, the cover of bare ground, was most limiting. In all cases, the bare ground was quite low, indicating that quail would have a difficult time foraging for seeds. The variable reflecting cover of quail foods was limiting in 1 instance. For 8 sites nesting cover was limiting. For 6 of these, Nest SI1, percent herbaceous cover, was the limiting factor. For all 6 of these cases the herbaceous cover was limiting because it was too dense. Percent of open area was limiting for the other 2 cases. Food We collected data on cover of plant species known to be eaten by quail. This does not necessarily mean, however, that these are necessarily high-quality or preferred foods. The foods that appear in the sample are primarily a function of the seed mixes planted when the sites are reclaimed. The most common and dominant species encountered were strawberry, sericea lespedeza, birdsfoot trefoil, clovers and vetch (Table 6). With the exception of birdsfoot trefoil on FRA sites and Johnsongrass on natural selection, no food item had greater than 10% cover. None of the potential food species we encountered, while eaten by quail, have particularly high value as food sources. Thus, while the cover of food items was the limiting factor for the HSI model at only 1 of 39 sites, I believe this may be misleading, and that the availability of suitable quail foods may a significant limiting factor for the potential of these sites to support quail.

12
CONCLUSIONS
• Based primarily upon the application of the modified quail habitat suitability index (HSI) model, the potential of reclaimed mine lands in SW Virginia to support quail is poor to moderate, with only about 30% (12 out of 39) sites showing the potential to support moderate quail numbers.
• The apparent limiting factors to these sites for quail include:
low cover of woody thickets providing escape/hiding/loafing cover Lack of bare ground providing efficient foraging Low cover of plant species providing high-quality foods Vegetation that is quite dense at ground level, limiting the suitability for quail.
• These limiting factors are primarily a function of the approach to reclaiming these sites, the seed mixes promoted, and the desire to establish dense vegetation cover quickly to meet guidelines for bond release.
• Under the current approaches, the potential for these sites to support quail is likely to be
modest at best. In spite of these limitations on the sites currently, I believe there is potential to create
suitable habitat on these areas with minimal changes in the approach taken to restoration. Some suggestions include:
• Coordinate with DGIF and others to develop seed mixes that have a high representation of herbaceous species known to be preferred and beneficial to quail.
• Consideration could be given to planting herbaceous cover at a lighter rate to promote more open ground for quail to forage and move about.
• Seek to integrate existing woody vegetation into restoration efforts, or plant some areas to woody shrubs to provide escape/loafing/hiding cover.
• Consider management activities on the areas to arrest succession on selected sites to retain quail habitat for a longer period of time.
• While quail populations will never likely be high on these areas, I do believe that there is
potential to establish sustainable populations on reclaimed mine lands in SW Virginia. The FRA has the potential with some modest modification to provide suitable quail habitat, and with planning can be used to generate habitat.

13
Literature cited: Barnes, T.G, L. A. Madison, J. D. Sole and M. J. Lacki. 1995. An assessment of habitat quality
for northern bobwhite in tall fescue-dominated fields. Wildlife Society Bulletin. 23:231-237. Burger, J.A., D. Graves, P. Angel, V. D., And C. Zipper. 2005. The Forest Reclamation Approach.
U.S. Office of Surface Mining. Forest Reclamation Advisory number 2. Daubenmire, R. F. 1959. Canopy coverage method of vegetation analysis. Northwest Science.
33:43-54. Robel, R. J., J. N. Briggs, A.D. Dayton, and L. C. Hulbert. 1970. Relationships between visual
obstruction measurements and weight of grassland vegetation. Journal of Range Management. 23:295-297.
Schroeder, R. l. 1985. Habitat suitability index models: Northern bobwhite. U.S. Fish. Wildl. Serv.
Biol. Rep. 82 (10.104). 32 pp. Tonkovich, M. E. 1995. Field evaluation of the Northern Bobwhite habitat suitability index model
with implications for the conservation reserve program. July 1995
14
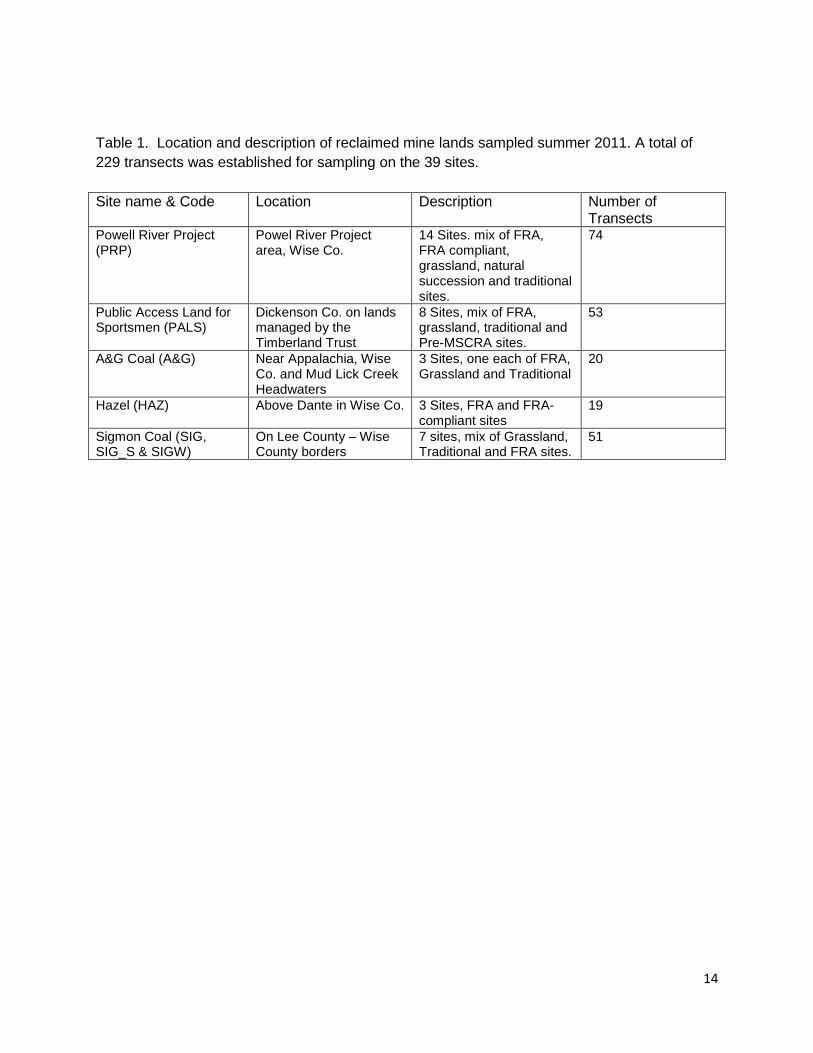
Table 1. Location and description of reclaimed mine lands sampled summer 2011. A total of 229 transects was established for sampling on the 39 sites. Site name & Code Location Description Number of
Transects Powell River Project (PRP)
Powel River Project area, Wise Co.
14 Sites. mix of FRA, FRA compliant, grassland, natural succession and traditional sites.
74
Public Access Land for Sportsmen (PALS)
Dickenson Co. on lands managed by the Timberland Trust
8 Sites, mix of FRA, grassland, traditional and Pre-MSCRA sites.
53
A&G Coal (A&G) Near Appalachia, Wise Co. and Mud Lick Creek Headwaters
3 Sites, one each of FRA, Grassland and Traditional
20
Hazel (HAZ) Above Dante in Wise Co. 3 Sites, FRA and FRA-compliant sites
19
Sigmon Coal (SIG, SIG_S & SIGW)
On Lee County – Wise County borders
7 sites, mix of Grassland, Traditional and FRA sites.
51

15
Table 2 . Mean values for habitat variables measured on reclaimed mine sites in SW Virginia, summer 2011. Data were averaged across all transects sampled that fell within a particular reclamation approach on each sampling location.
Cover Type and Site
Number of
Trans.
Herb. Canopy
Cover (%)
Grass Canopy Cover (%)
Cover of Woody
Vegetation < 2m (%)
Bare Ground (%)
Herbaceous Cover Height (cm)
Open Ground Cover (%)
Litter Canopy Cover (%)
Distance to Woody
Vegetation
Quail Foods Cover (%)
% Herbaceous Cover that
is Grass
Cover of Woody
Thickets within 100m
(%) Forest Rec. Approach (FRA)
A&G 11 92.3 60.5 0.5 34.5 20.7 55.5 89.1 84.5 32.2 65.0 2.2
HAZ03 10 96.0 94.0 2.0 2.0 38.0 33.0 100.0 29.0 8.7 97.9 24.6
MUDL 12 87.5 76.3 0.0 42.9 19.6 66.7 78.8 72.1 38.0 87.7 1.9
PALS10 15 88.7 70.0 0.0 27.0 20.5 68.7 85.0 137.0 50.0 78.4 0.3
PRP01 10 96.0 87.0 5.5 17.5 30.3 53.5 94.0 72.5 40.1 90.4 5.3
PRP03 3 88.3 63.3 1.7 26.7 38.0 31.7 93.3 23.3 11.3 67.6 40.0
PRP04 4 100.0 100.0 0.0 3.8 21.3 67.5 98.8 37.5 30.3 100.0 1.8
PRP06 7 96.4 85.0 0.0 5.7 34.9 37.9 97.1 24.3 19.5 87.9 37.5
PRP07 4 100.0 72.5 0.0 7.5 43.3 25.0 97.5 12.5 57.4 72.5 56.9
PRP10 2 87.5 62.5 0.0 22.5 28.5 52.5 92.5 35.0 42.8 70.6 20.3
SIG1 6 90.8 73.3 0.0 28.3 21.7 51.7 85.0 225.0 72.5 80.7 0.0
SIG2 6 78.3 50.0 0.0 50.0 17.2 74.2 76.7 195.8 50.0 62.9 0.1
SIG3 6 95.8 83.3 1.7 15.0 29.5 34.2 94.2 96.7 58.4 86.9 1.6
SIG4 5 89.0 77.0 0.0 36.0 22.4 63.0 85.0 37.0 22.4 86.3 17.8
SIG5 8 93.8 69.4 3.1 38.1 23.1 66.3 86.3 26.3 23.8 74.3 36.4 FRA Compliant
HAZ01 2 100.0 92.5 0.0 2.5 53.5 20.0 100.0 27.5 19.0 92.5 9.0
HAZ02 7 92.9 87.1 1.4 11.4 36.3 38.6 94.3 25.7 10.9 93.7 18.0
PRP05 4 100.0 100.0 0.0 0.0 45.8 12.5 100.0 22.5 9.3 100.0 31.9
PRP10 2 97.5 80.0 0.0 32.5 28.5 45.0 97.5 65.0 61.5 82.0 15.0
PRP14 3 98.3 85.0 0.0 1.7 31.0 46.7 100.0 20.0 28.5 86.3 37.5

16
Table 2 . Continued
Cover Type and Site
Number of
Trans.
Herbaceous Canopy
Cover (%)
Grass Canopy Cover (%)
Cover of Woody
Vegetation < 2m (%)
Bare Ground (%)
Herbaceous Cover Height (cm)
Open Ground Cover (%)
Litter Canopy Cover (%)
Distance to Woody
Vegetation
Quail Foods Cover (%)
% Herbaceous Cover that
is Grass
Cover of Woody
Thickets within 100m
(%) Grassland
A&G 6 98.3 85.8 0.8 15.0 23.5 59.2 97.5 63.3 26.3 87.4 2.1
PALS01 9 98.9 83.3 0.0 5.6 22.4 62.2 97.8 22.2 61.3 84.4 17.2
PALS02 8 99.4 96.3 0.0 3.1 24.5 37.5 98.8 35.0 71.0 96.8 6.0
PRP08 5 100.0 100.0 0.0 1.0 22.8 1.0 100.0 98.0 27.9 100.0 9.6
PRP09 3 100.0 100.0 0.0 15.0 22.3 48.3 96.7 26.7 56.8 100.0 57.5
PRP11 8 98.8 98.1 0.0 2.5 17.5 28.1 98.8 66.3 66.8 99.4 13.5
PRP13 8 100.0 100.0 0.0 0.6 27.6 3.8 100.0 26.3 33.3 100.0 4.2
SIG_S 10 94.5 65.5 0.0 20.5 17.0 80.0 93.0 57.5 24.2 69.1 3.4 Natural Succession
PRP03 1 95.0 95.0 5.0 10.0 75.0 15.0 95.0 60.0 70.5 100.0 3.0
PRP09 1 100.0 90.0 0.0 40.0 32.0 45.0 100.0 45.0 40.5 90.0 67.5
PRP12 6 96.7 94.2 1.7 13.3 41.7 39.2 99.2 24.2 57.8 97.3 63.3 Pre-SMCRA
PALS04 3 100.0 93.3 0.0 0.0 40.3 13.3 100.0 30.0 91.8 93.3 30.0
PALS05 4 98.8 60.0 0.0 6.3 35.5 43.8 95.0 27.5 51.4 60.6 3.0
PALS06 6 98.3 79.2 0.0 0.8 33.0 38.3 100.0 16.7 33.3 79.9 62.5
Traditional
A&G 3 95.0 81.7 1.7 23.3 23.7 35.0 96.7 93.3 87.5 85.7 1.2
PALS03 4 100.0 96.3 0.0 0.0 34.0 28.8 100.0 28.8 19.1 96.3 20.6
PALS08 4 100.0 97.5 0.0 7.3 21.3 20.0 100.0 37.5 74.5 97.5 45.0
PRP02 3 55.0 20.0 0.0 90.0 31.7 91.7 40.0 33.3 10.0 26.9 22.5
SIGW 10 99.0 90.5 0.0 5.5 23.1 39.0 100.0 19.0 51.6 91.4 58.5
17
Table 3. Mean values (range) for habitat variables measured at reclaimed mine sites in SW Virginia, Summer 2011. Sample sizes for each reclamation type represent the number of sites sampled from each type.
Mine Reclamation Treatment
Variable
Forest Reclamation Approach (n=15)
FRA Compliant (n=5)
Grassland (n=8)
Natural Succession (n=3)
Pre-SMCRA (n=3)
Traditional (n=5)
% Herbaceous Canopy Cover
92 (78 - 100) 98 (92 - 100) 99 (94 - 100) 97 (95 - 100) 99 (98 - 100) 90 (55 - 100)
% Grass Canopy Cover
75 (50 - 100) 89 (80 - 100) 91 (65 - 100) 93 (90 - 95) 78 (60 - 93) 77 (20 - 98)
% Woody Veg. < 2m tall
1.0 (0 - 5.5) 0.3 (0 - 1.4) 0.1 (0 - 0.8) 2 (0 - 5) 0.00 0.3 (0 - 1.7)
% Bare Ground 24 (2 - 50) 9 (0 - 32) 8 (1 - 20) 21 (10 - 40) 2.4 (0 - 6) 25 (0 - 90)
Herbaceous Veg. Height (cm)
27 (17 - 43) 39 (28 - 54) 22 (17 - 27) 50 (32 - 75) 36 (33 - 40 27 (21 - 34)
% Open Ground 52 (25 - 74) 33 (12 - 47) 40 (1 - 80) 33 (15 - 45) 32 (13 - 44) 43 (20 - 91)
% Litter Cover 90 (76 - 100) 98 (94 - 100) 98 (93 - 100) 98 (95 - 100) 98 (95 - 100) 87 (40 - 100)
Distance to woody covert (m)
74 (12 - 225) 32 (20 - 65) 49 (22 - 98) 43 (24 - 60) 25 (17 - 30) 42 (19 - 93)
% Quail Food 37 (9 - 72) 26 (9 - 61) 46 (24 - 71) 56 (40 - 70) 59 (33 - 92) 48 (10 - 88)
% Herbaceous cover that is grass
81 (63 - 100) 91 (82 - 100) 92 (69 - 100) 96 (90 - 100) 78 (60 - 93) 80 (26 - 97)
% Cover of Woody Thickets within 100m.
16 (0 - 57) 22 (9 - 37) 14 (2 - 57) 45 (3 - 68) 31 (3 - 62) 30 (1 - 58)
18
Table 4. Mean values for Suitability Indices (SI), Life Requisite Suitability Indices (LRSI) and the Habitat Suitability Index (HSI) for reclaimed mine site in SW Virginia. Index values were derived from habitat variables measured on reclaimed mine sites in SW Virginia, summer 2011. Data were averaged across all transects sampled that fell within a particular reclamation approach on each sampling location. Individual SI values that are the limiting factor for each site are in bold.
Cover Type and Site Number of Transects LRSI Cover Food SI1 Food SI2 LRSI Food Nest SI1 Nest SI2 Nest SI3 LRSI Nest HSI
Forest Rec. Approach (FRA)
A&G 11 0.06 1.00 1.00 1.00 0.52 0.95 1.00 0.70 0.06
HAZ03 10 0.62 0.41 0.16 0.26 0.46 0.62 1.00 0.53 0.26
MUDL 12 0.05 1.00 1.00 1.00 0.59 0.72 0.83 0.60 0.05
PALS10 15 0.01 1.00 0.91 0.95 0.57 0.82 0.78 0.60 0.01
PRP01 10 0.13 1.00 0.63 0.79 0.46 0.70 1.00 0.57 0.13
PRP03 3 1.00 0.51 0.90 0.68 0.58 0.92 1.00 0.73 0.68
PRP04 4 0.04 1.00 0.21 0.46 0.40 0.60 0.81 0.44 0.04
PRP06 7 0.94 0.80 0.27 0.47 0.45 0.72 1.00 0.57 0.47
PRP07 4 1.00 1.00 0.33 0.57 0.40 0.88 0.80 0.53 0.53
PRP10 2 0.51 1.00 0.78 0.88 0.59 0.89 1.00 0.72 0.51
SIG1 6 0.00 1.00 0.95 0.97 0.54 0.79 1.00 0.65 0.00
SIG2 6 0.00 1.00 1.00 1.00 0.73 0.97 0.65 0.67 0.00
SIG3 6 0.04 1.00 0.55 0.74 0.46 0.73 1.00 0.58 0.04
SIG4 5 0.45 0.91 1.00 0.95 0.57 0.74 0.93 0.62 0.45
SIG5 8 0.91 0.96 1.00 0.98 0.49 0.86 0.84 0.60 0.60 FRA Compliant
HAZ01 2 0.23 0.78 0.18 0.37 0.40 0.68 0.60 0.40 0.23
HAZ02 7 0.45 0.49 0.44 0.47 0.51 0.66 1.00 0.58 0.45
PRP05 4 0.80 0.43 0.10 0.21 0.40 0.60 0.30 0.27 0.21
PRP10 2 0.38 1.00 1.00 1.00 0.44 0.78 1.00 0.58 0.38
PRP14 3 0.94 1.00 0.15 0.39 0.43 0.74 1.00 0.56 0.39
19
Table 4 . Continued.
Cover Type and Site Number of Transects LRSI Cover Food SI1 Food SI2 LRSI Food Nest SI1 Nest SI2 Nest SI3 LRSI Nest HSI
Grassland
A&G 6 0.05 1.00 0.55 0.74 0.43 0.73 1.00 0.56 0.05
PALS01 9 0.43 1.00 0.27 0.52 0.42 0.76 0.94 0.55 0.43
PALS02 8 0.15 1.00 0.19 0.44 0.41 0.63 1.00 0.51 0.15
PRP08 5 0.24 1.00 0.13 0.36 0.40 0.60 0.00 0.00 0.00
PRP09 3 1.00 1.00 0.55 0.74 0.40 0.60 1.00 0.49 0.49
PRP11 8 0.34 1.00 0.18 0.42 0.42 0.61 0.93 0.48 0.34
PRP13 8 0.10 1.00 0.12 0.34 0.40 0.60 0.00 0.00 0.00
SIG_S 10 0.09 0.97 0.72 0.83 0.48 0.91 0.50 0.47 0.09 Natural Succession
PRP03 1 0.08 1.00 0.40 0.63 0.48 0.60 0.40 0.34 0.08
PRP09 1 1.00 1.00 1.00 1.00 0.40 0.70 1.00 0.53 0.53
PRP12 6 1.00 1.00 0.50 0.71 0.45 0.63 1.00 0.53 0.53 Pre-SMCRA
PALS04 3 0.75 0.73 0.10 0.27 0.40 0.67 0.33 0.30 0.27
PALS05 4 0.08 1.00 0.29 0.54 0.42 0.99 1.00 0.65 0.08
PALS06 6 1.00 1.00 0.13 0.35 0.43 0.80 1.00 0.58 0.35 Traditional
A&G 3 0.03 0.80 0.80 0.80 0.48 0.74 1.00 0.59 0.03
PALS03 4 0.52 0.79 0.10 0.28 0.40 0.64 0.95 0.49 0.28
PALS08 4 1.00 1.00 0.32 0.56 0.40 0.63 0.60 0.39 0.39
PRP02 3 0.56 0.46 0.25 0.34 1.00 0.70 0.21 0.38 0.34
SIGW 10 1.00 1.00 0.27 0.51 0.42 0.69 1.00 0.53 0.51
20
Table 5. Mean values (range) for HSI model Suitability Indices (SI), Life Requisite SI, and overall habitat suitability for reclaimed mine lands in SW Virginia, Summer 2011. Sample sizes for each reclamation type represent the number of sites sampled from each type. Mine Reclamation Treatment
Variable Forest Reclamation
Approach (n=15) FRA Compliant
(n=5) Grassland (n=8) Natural Succession
(n=3) Pre-SMCRA
(n=3) Traditional (n=5) LRSI - Woody Cover 0.38 (0 - 1) 0.56 (0.22 - 0.94) 0.30 (0.05 - 1) 0.69 (0.08 - 1) 0.61 (0.08 - 1) 0.62 (0.03 - 1)
Food SI 1 (% quail food) 0.91 (0.41 - 1) 0.74 (0.43 - 1) 0.99 (0.97 - 1) 1.00 0.91 (0.73 - 1) 0.81 (0.46 - 1)
Food SI 2 (% bare ground) 0.71 (0.16 - 1) 0.37 (0.10 - 1) 0.34 (0.12 - 0.71) 0.63 (0.4 - 1) 0.17 (0.1 - 0.28) 0.35 (0.1 - 0.8)
LRSI - Food 0.78 (0.25 - 1) 0.49 (0.21 - 1) 0.55 (0.34 - 0.83) 0.78 (0.63 - 1) 0.39 (0.27 - 0.54) 0.50 (0.28 - 0.8)
Nest SI 1 (% herb. Cover) 0.52 (0.4 - 0.7) 0.43 (0.4 - 0.51) 0.42 (0.4 - 0.48) 0.44 (0.4 - 0.47) 0.41 (0.4 - 0.43) 0.54 (0.4 - 1)
Nest SI 2 (% grass) 0.79 (0.6 - 0.97) 0.69 (0.6 - 0.78) 0.68 (0.6 - 0.91) 0.64 (0.6 - 0.7) 0.82 (0.67 - 0.99) 0.68 (0.62 - 0.74)
Nest SI 3 (% open ground) 0.91 (0.64 - 1) 0.78 (0.3 - 1) 0.67 (0 - 1) 0.80 (0.4 - 1) 0.78 (0.33 - 1) 0.75 (0.21 - 1)
LRSI - Nesting 0.61 (0.44 - 0.72) 0.48 (0.26 - 0.58) 0.38 (0 - 0.58 0.47 (0.34 - 0.53) 0.51 (0.30 - 0.65) 0.48 (0.38 - 0.59)
HSI 0.25 (0 - 0.67) 0.32 (0.21 - 0.45) 0.19 (0 - 0.49) 0.38 (0.08 - 0.53) 0.23 (0.08 - 0.35) 0.31 (0.03 - 0.51)
21
Table 6. Percent cover of potential quail foods sampled on reclaimed mine sites in SW Virginia, Summer 2011. Mine Reclamation Treatment
Plant Species
Forest Reclamation
Approach (n=15)
FRA Compliant
(n=5) Grassland
(n=8)
Natural Succession
(n=3)
Pre-SMCRA
(n=3) Traditional
(n=5) ANDR (Broom sedge) 0.02 0.00 0.00 0.00 0.00 0.00 CARE (sedges, spp.) 0.00 0.00 0.00 0.08 0.00 0.05 FRAG (strawberry) 0.17 1.71 0.37 0.15 0.05 0.03 JUNC (rush) 0.01 0.01 0.11 0.00 0.00 0.40 LECU (Serecia lespedeza) 1.61 2.14 8.06 9.90 0.82 6.26 LEVI (Pepper grass) 0.01 0.00 0.00 0.00 0.00 0.03 LOCO (Birdsfoot trefoil) 11.49 2.30 1.96 1.51 6.65 6.99 MEAL (White sweet clover) 0.26 0.55 0.00 0.00 0.00 0.00 MEOF (Yellow sweet clover) 0.03 0.01 0.01 0.00 0.05 0.00 PANI (Panic grasses) 0.05 1.03 0.20 0.00 0.00 0.00 RHCO (Winged sumac) 0.03 0.00 0.00 0.00 0.00 0.00 ROMU (Multiflora rose) 0.00 0.00 0.00 0.00 0.00 0.00 RUBU (Rubus spp.) 0.12 0.73 0.00 0.00 0.29 0.18 SOHA (Johnson grass) 0.00 0.00 0.00 15.65 0.00 0.00 STUM (trailing wild bean) 0.52 0.00 0.00 0.00 0.00 0.00 TRHY (Alsike clover) 0.00 0.00 0.00 0.00 0.00 0.00 TRIF ( Trifolium spp.) 0.29 0.00 0.74 0.08 0.00 6.89 TRPR (Red clover) 1.64 0.00 0.96 0.00 0.31 0.78 TRRE (White clover) 2.79 0.01 8.80 0.94 0.17 2.41 TRST (Buffalo clover) 0.00 0.00 0.00 0.00 0.00 0.00 VICE (Vetch) 0.03 0.83 0.02 1.69 8.07 2.78
22
APPENDICES
Study Area locations and representative pictures of habitat on reclaimed mine lands.
23
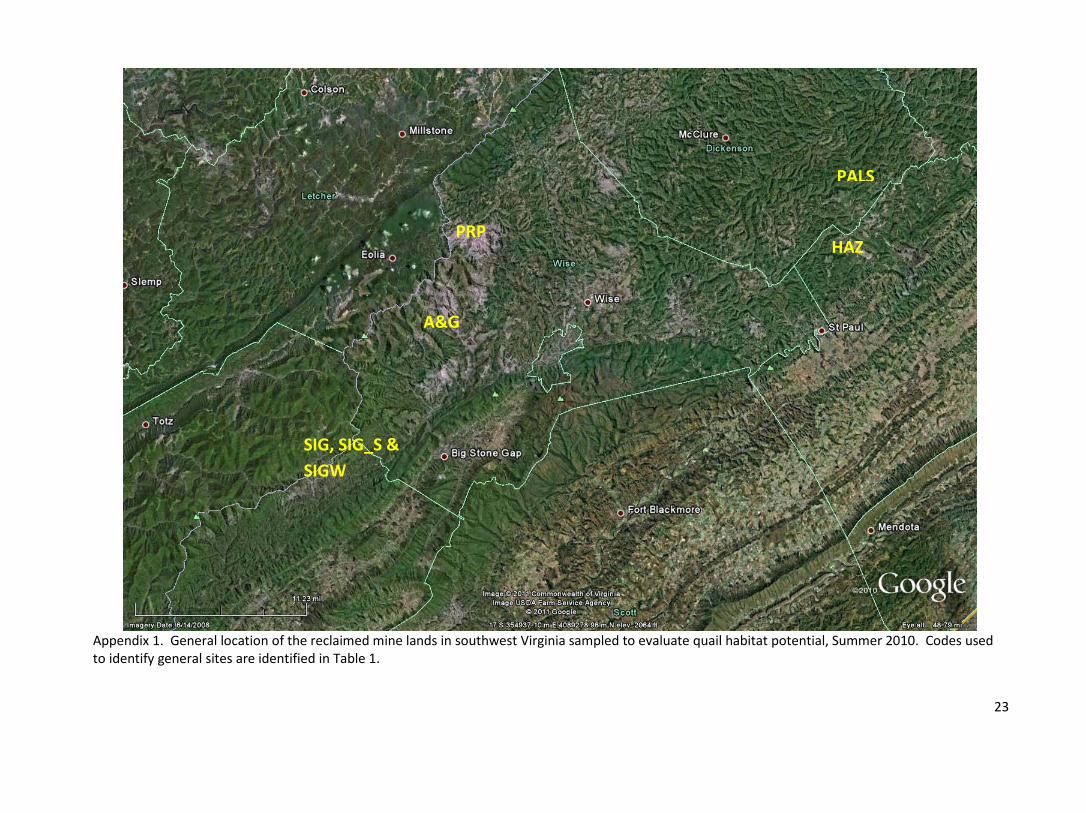
Appendix 1. General location of the reclaimed mine lands in southwest Virginia sampled to evaluate quail habitat potential, Summer 2010. Codes used to identify general sites are identified in Table 1.
PRP
PALS
HAZ
A&G
SIG, SIG_S & SIGW

24
Appendix 2 . Location of sampling transects on the Sigmon Coal site (SIG).
25
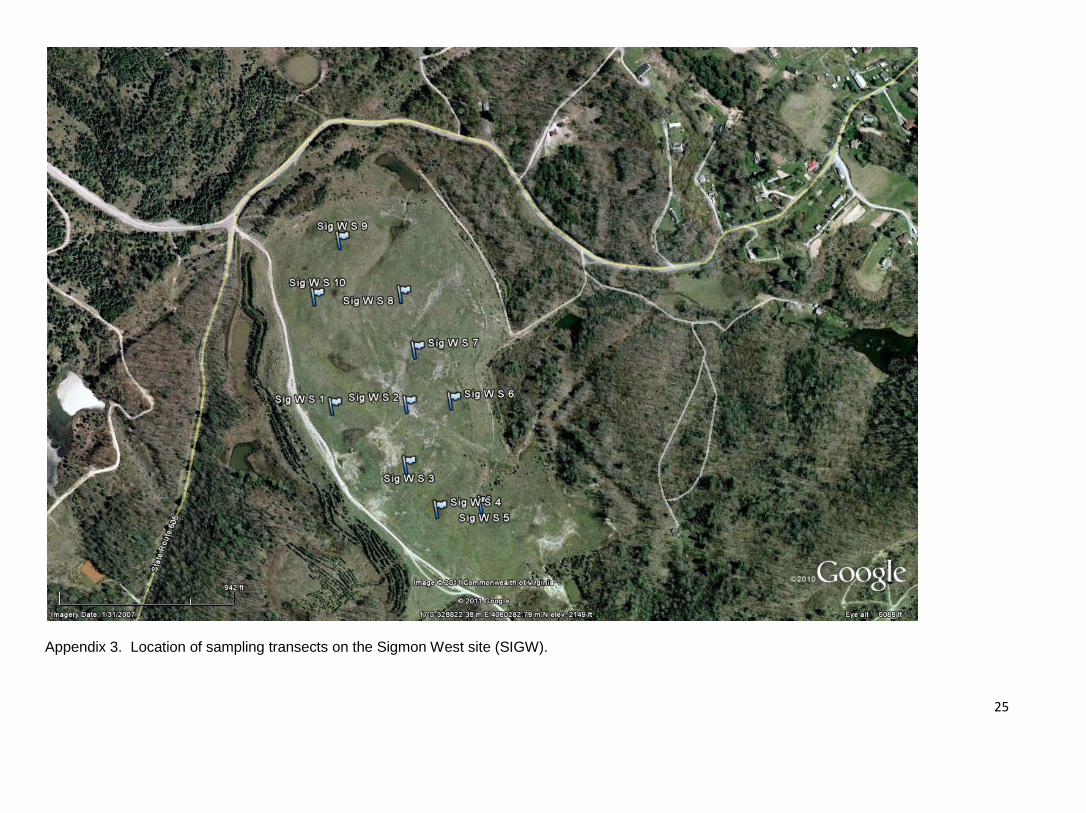
Appendix 3. Location of sampling transects on the Sigmon West site (SIGW).

26
Appendix 4. Location of sampling transects on the Sigmon South site (SIG_S).

27
Appendix 5. Location of sampling transects on the A&G Coal sites west of the town of Appalachia (A&G).
28
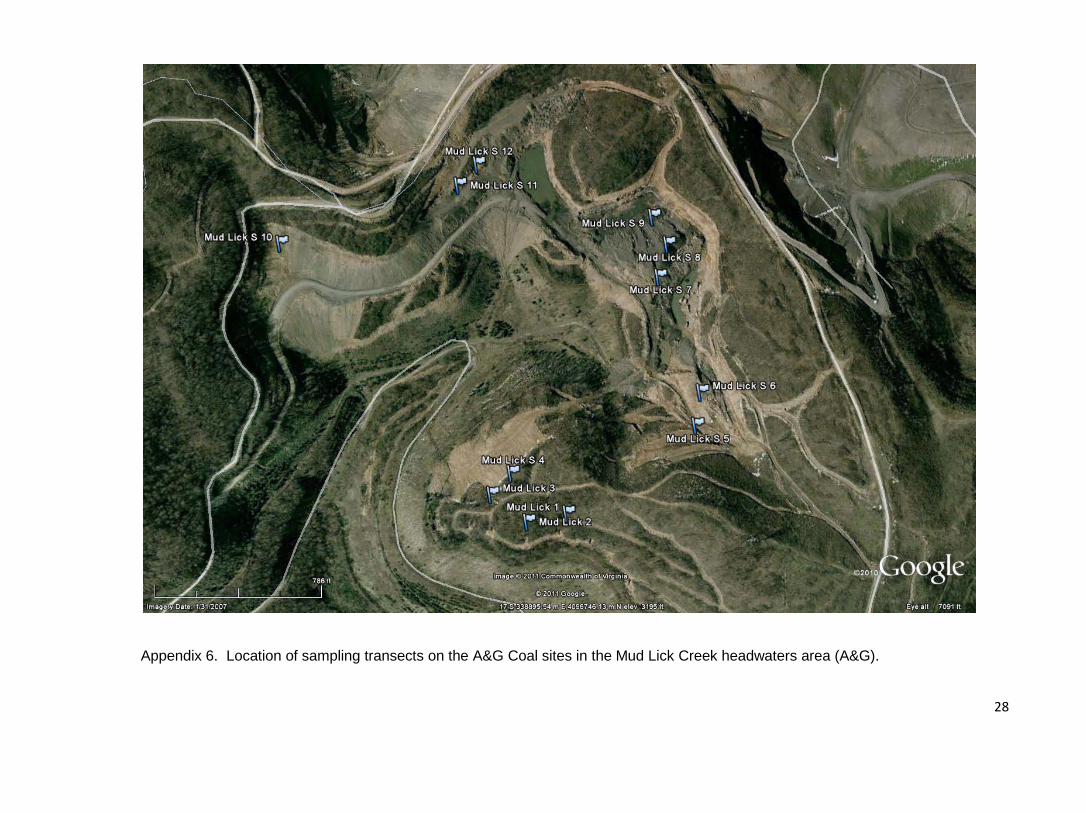
Appendix 6. Location of sampling transects on the A&G Coal sites in the Mud Lick Creek headwaters area (A&G).
29
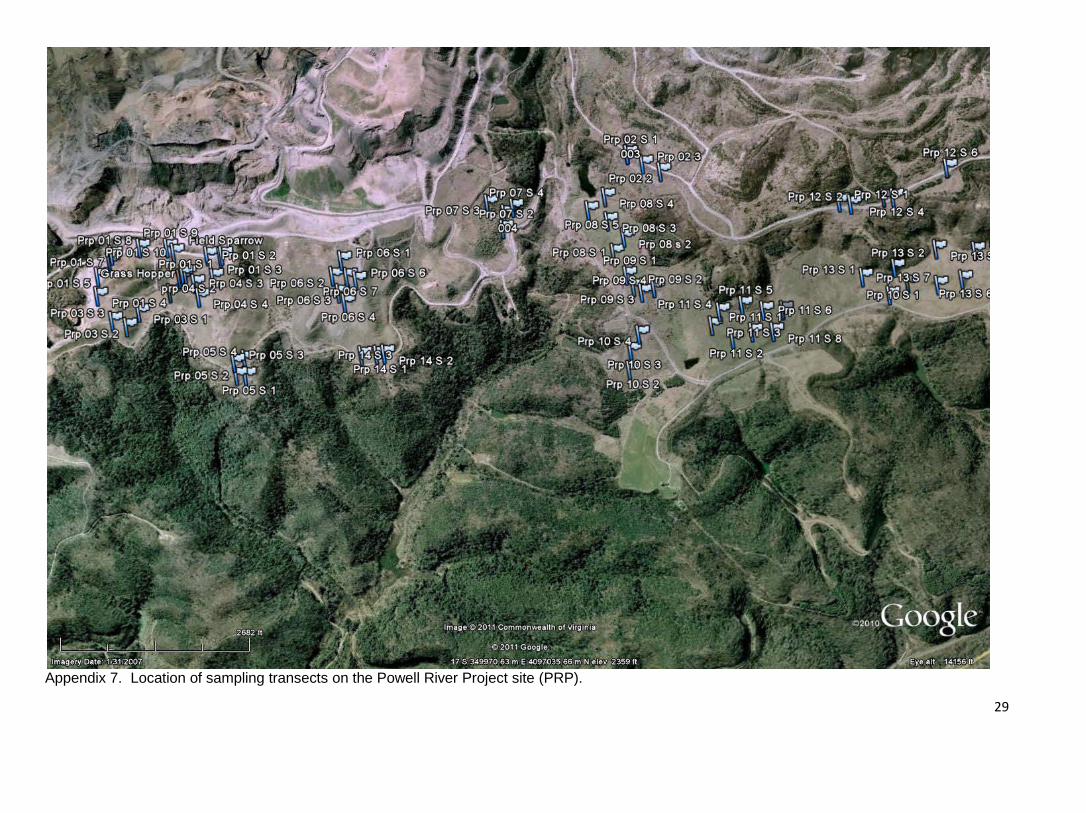
Appendix 7. Location of sampling transects on the Powell River Project site (PRP).

30
Appendix 8. Location of the sampling transects on the Hazel site (HAZ).

31
Appendix 9. Location of the sampling transects on the Public Access Lands for Sportsmen sites (PALS).

32
Appendix 10. Photos of representative sites reclaimed with the traditional reclamation approach on the Powel River Site. On the site on the left the volunteer autumn olive are evident. Dense ground vegetation is evident in the foreground of both photographs. Such cover would be difficult for quail to move through. White pines commonly have been planted in the past on reclaimed sites (right). These sites are approximately 6-7 years after reclamation. Typically on such sites the canopy closes in by 15 to 20 years of age.

33
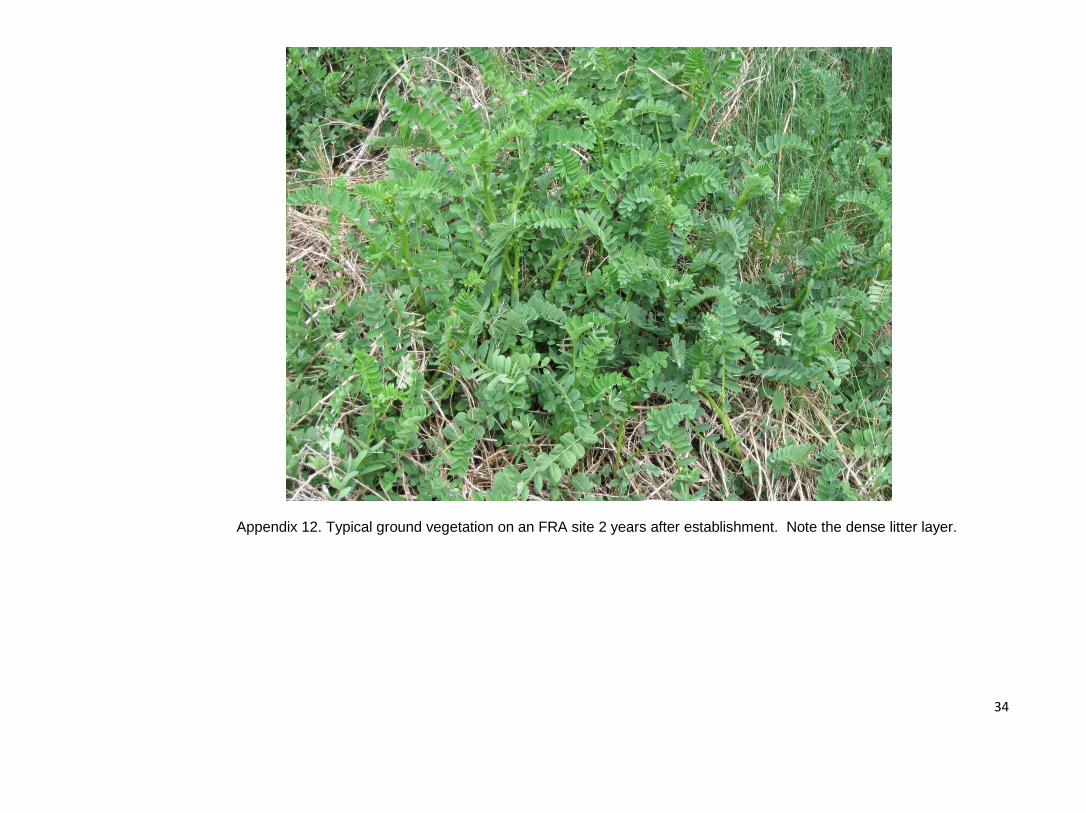
Appendix 11. A site 2 years after reclamation using the Forest Reclamation Approach. The hardwoods that were planted are not yet dominant, and there is substantial herbaceous vegetation. Typically after 2 years the herbaceous vegetation becomes quite thick.
34
Appendix 12. Typical ground vegetation on an FRA site 2 years after establishment. Note the dense litter layer.
35
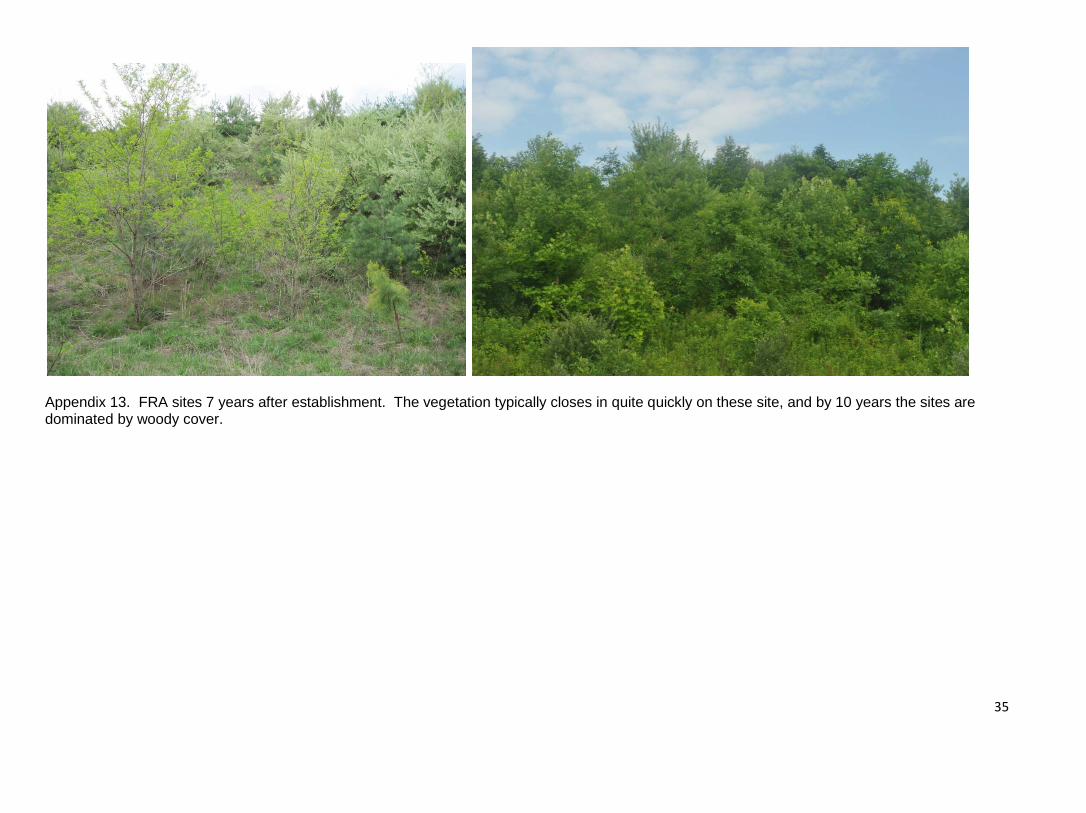
Appendix 13. FRA sites 7 years after establishment. The vegetation typically closes in quite quickly on these site, and by 10 years the sites are dominated by woody cover.