Potential Impacts of Climate Change on Global Rice … Risk in Aisa-1 East-Asian Monsoon...
41
Ching-Cheng Chang Institute of Economics, Academia Sinica Chi-Chung Chen Dept of Applied Economics, National Chung-Hsing University Shih-Hsun Hsu Dept of Agricultural Economics, National Taiwan University 1 Potential Impacts of Climate Change on Global Rice Market and Food Security in Asia FAO Expert Consultation on Global Food Production under Changing Climate and Increased Variability: Implications for trade and Food Policy , FAO Trade and Markets Division, 5-6 November 2013
Transcript of Potential Impacts of Climate Change on Global Rice … Risk in Aisa-1 East-Asian Monsoon...
Ching-Cheng Chang
Institute of Economics, Academia Sinica
Chi-Chung Chen Dept of Applied Economics, National Chung-Hsing University
Shih-Hsun Hsu
Dept of Agricultural Economics, National Taiwan University
1
Potential Impacts of Climate Change on Global Rice Market and Food Security in Asia
FAO Expert Consultation on Global Food Production under Changing Climate and Increased Variability: Implications for trade and Food Policy ,
FAO Trade and Markets Division, 5-6 November 2013
2
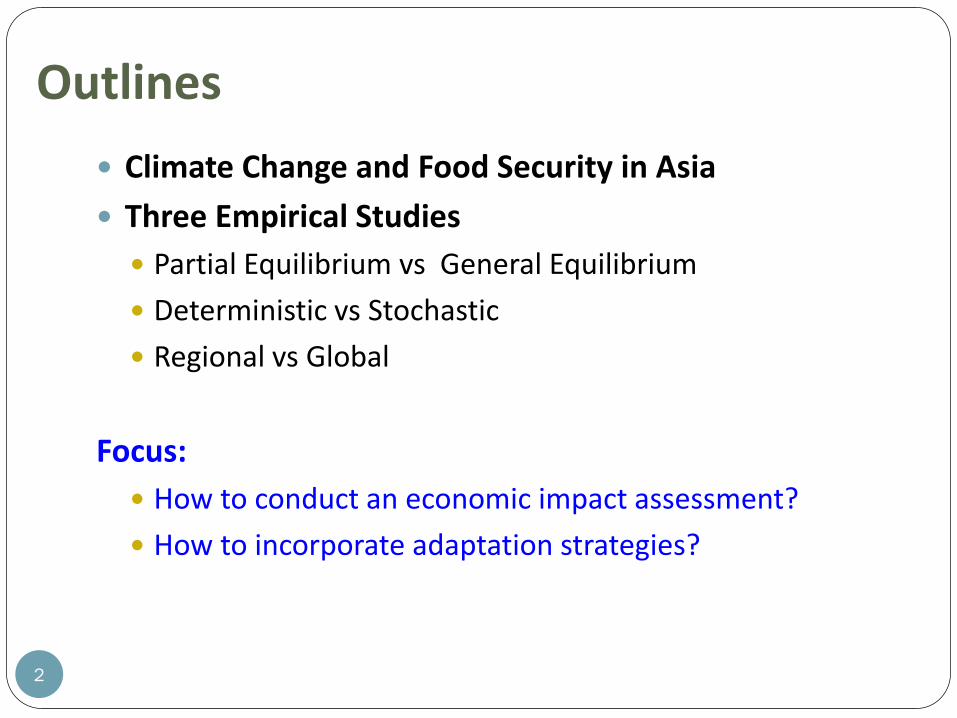
Outlines
Climate Change and Food Security in Asia
Three Empirical Studies
Partial Equilibrium vs General Equilibrium
Deterministic vs Stochastic
Regional vs Global
Focus:
How to conduct an economic impact assessment?
How to incorporate adaptation strategies?
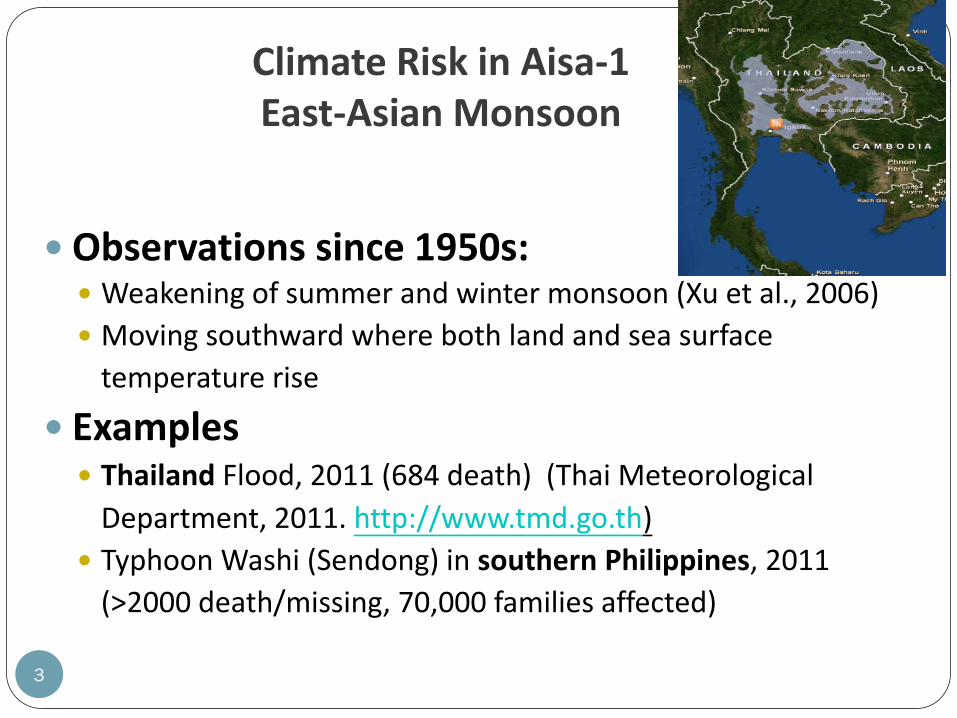
Climate Risk in Aisa-1 East-Asian Monsoon
Observations since 1950s: Weakening of summer and winter monsoon (Xu et al., 2006)
Moving southward where both land and sea surface
temperature rise
Examples Thailand Flood, 2011 (684 death) (Thai Meteorological
Department, 2011. http://www.tmd.go.th)
Typhoon Washi (Sendong) in southern Philippines, 2011
(>2000 death/missing, 70,000 families affected)
3
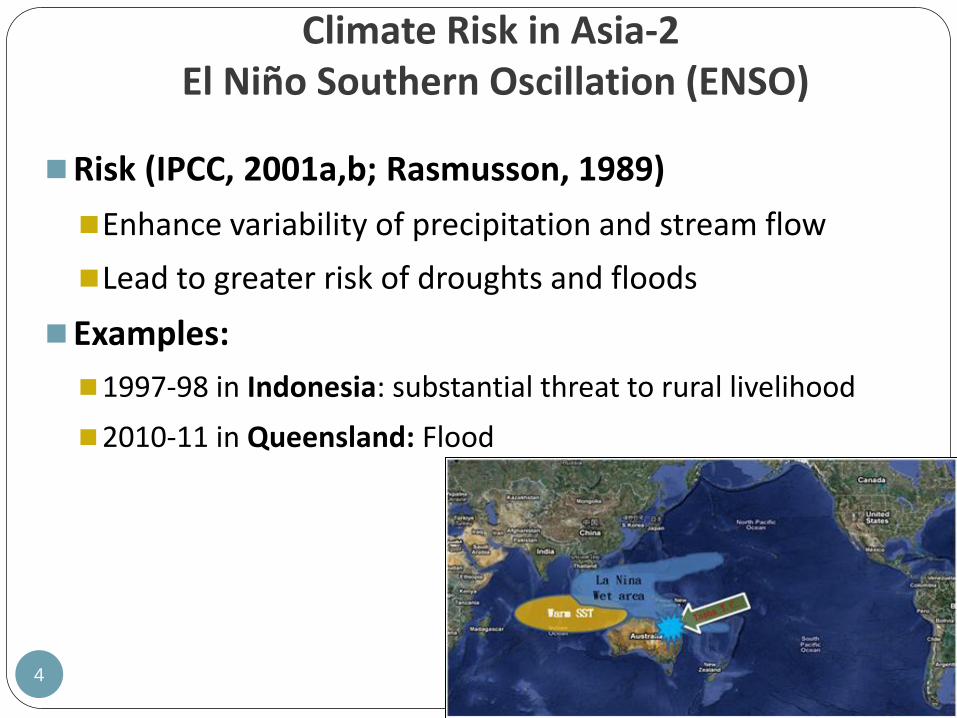
Climate Risk in Asia-2 El Niño Southern Oscillation (ENSO)
Risk (IPCC, 2001a,b; Rasmusson, 1989)
Enhance variability of precipitation and stream flow
Lead to greater risk of droughts and floods
Examples:
1997-98 in Indonesia: substantial threat to rural livelihood
2010-11 in Queensland: Flood
4
Climate Risk in Asia-3 Sea Level Rise (SLR)
Long-term threat to agriculture
Recent Projections by 2100
Annual:
• Raper and Braithwaite (2006) project SLR caused by melting glaciers and icecaps will fall between 0.046 and 0.051 m
• Meier et al. (2007) estimate an additional 0.1 to 0.25 m.
Cumulative
• Rahmstorf (2007) projects a cumulative SLR of 0.5 to 1.4 m.
• Dasgupta et al. (2009) projects 1 to 3 m of rise but indicates as much as 5 m is possible if unexpected rapid breakup of Greenland ice cover and West Antarctic ice sheet occurs.
5
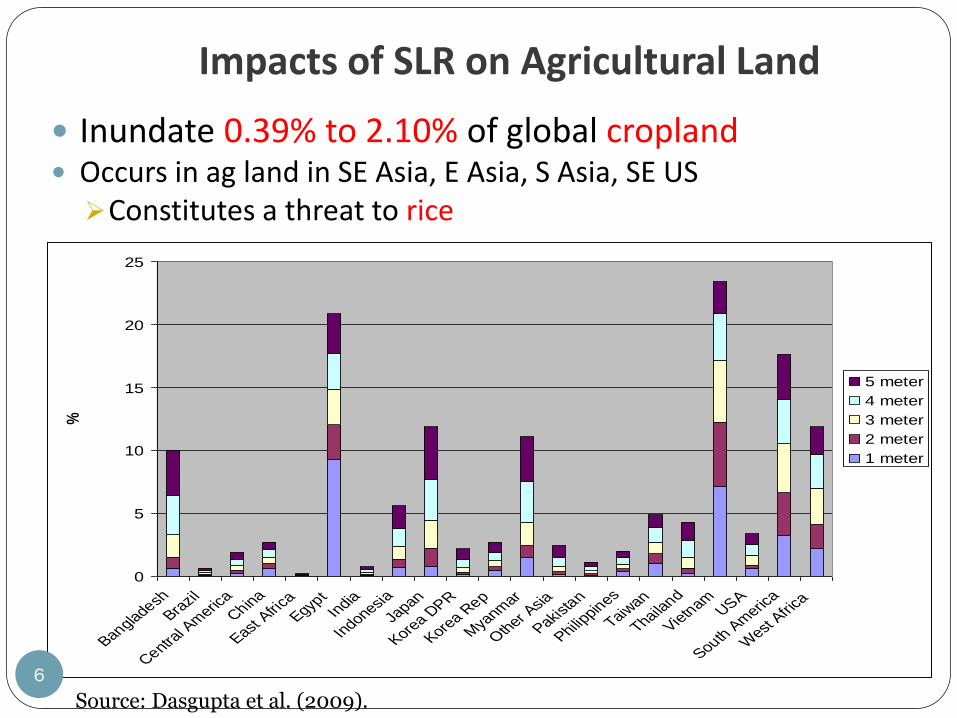
Impacts of SLR on Agricultural Land
Inundate 0.39% to 2.10% of global cropland Occurs in ag land in SE Asia, E Asia, S Asia, SE US Constitutes a threat to rice
0
5
10
15
20
25
Bangladesh
Brazil
Central A
meric
a
China
East A
frica
Egypt
India
Indonesia
Japan
Korea D
PR
Korea R
ep
Mya
nmar
Oth
er Asia
Pakista
n
Philippin
es
Taiwan
Thailand
Vietn
amUSA
South A
meric
a
West
Afri
ca
%
5 meter
4 meter
3 meter
2 meter
1 meter
Source: Dasgupta et al. (2009).
6
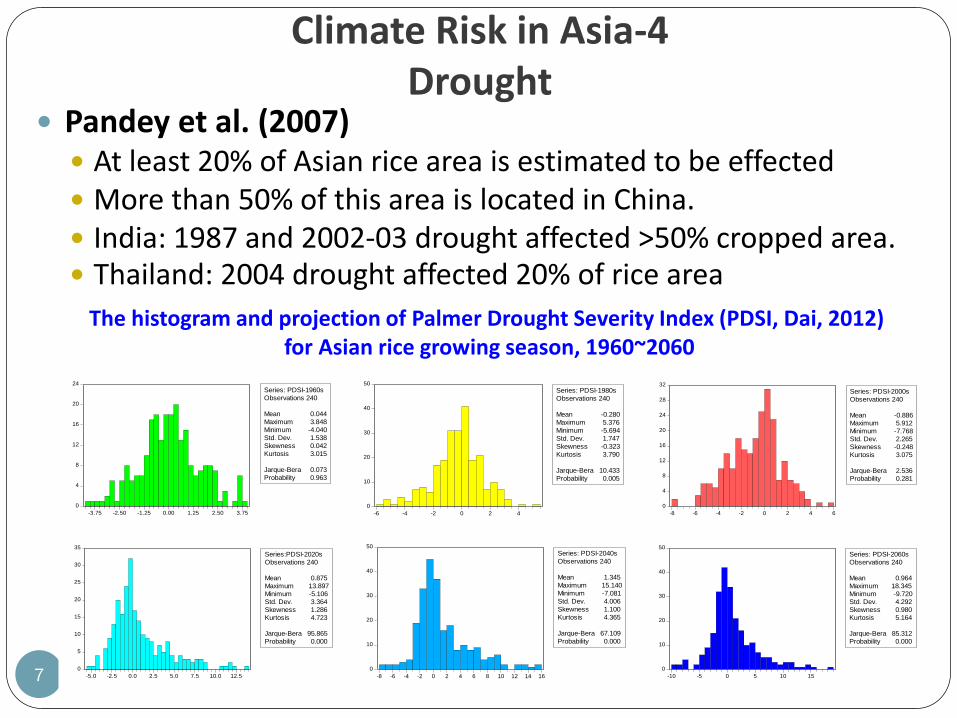
Climate Risk in Asia-4 Drought
Pandey et al. (2007) At least 20% of Asian rice area is estimated to be effected More than 50% of this area is located in China. India: 1987 and 2002-03 drought affected >50% cropped area. Thailand: 2004 drought affected 20% of rice area
7
The histogram and projection of Palmer Drought Severity Index (PDSI, Dai, 2012) for Asian rice growing season, 1960~2060
0
4
8
12
16
20
24
-3.75 -2.50 -1.25 0.00 1.25 2.50 3.75
Series: PDSI-1960s
Observations 240
Mean 0.044
Maximum 3.848
Minimum -4.040
Std. Dev. 1.538
Skewness 0.042
Kurtosis 3.015
Jarque-Bera 0.073
Probability 0.963
0
4
8
12
16
20
24
28
32
-8 -6 -4 -2 0 2 4 6
Series: PDSI-2000s
Observations 240
Mean -0.886
Maximum 5.912
Minimum -7.768
Std. Dev. 2.265
Skewness -0.248
Kurtosis 3.075
Jarque-Bera 2.536
Probability 0.281
0
10
20
30
40
50
-6 -4 -2 0 2 4
Series: PDSI-1980s
Observations 240
Mean -0.280
Maximum 5.376
Minimum -5.694
Std. Dev. 1.747
Skewness -0.323
Kurtosis 3.790
Jarque-Bera 10.433
Probability 0.005
0
5
10
15
20
25
30
35
-5.0 -2.5 0.0 2.5 5.0 7.5 10.0 12.5
Series:PDSI-2020s
Observations 240
Mean 0.875
Maximum 13.897
Minimum -5.106
Std. Dev. 3.364
Skewness 1.286
Kurtosis 4.723
Jarque-Bera 95.865
Probability 0.000
0
10
20
30
40
50
-10 -5 0 5 10 15
Series: PDSI-2060s
Observations 240
Mean 0.964
Maximum 18.345
Minimum -9.720
Std. Dev. 4.292
Skewness 0.980
Kurtosis 5.164
Jarque-Bera 85.312
Probability 0.000
0
10
20
30
40
50
-8 -6 -4 -2 0 2 4 6 8 10 12 14 16
Series: PDSI-2040s
Observations 240
Mean 1.345
Maximum 15.140
Minimum -7.081
Std. Dev. 4.006
Skewness 1.100
Kurtosis 4.365
Jarque-Bera 67.109
Probability 0.000

Climate Risk-5 Natural Disasters
No of people affected in Asia increases more dramatically than those in other continents since 80’s.
8 Number of people affected by natural disasters by Regions, 1900-2010 Source: EM-DAT: The OFDA/CRED International Disaster Database.
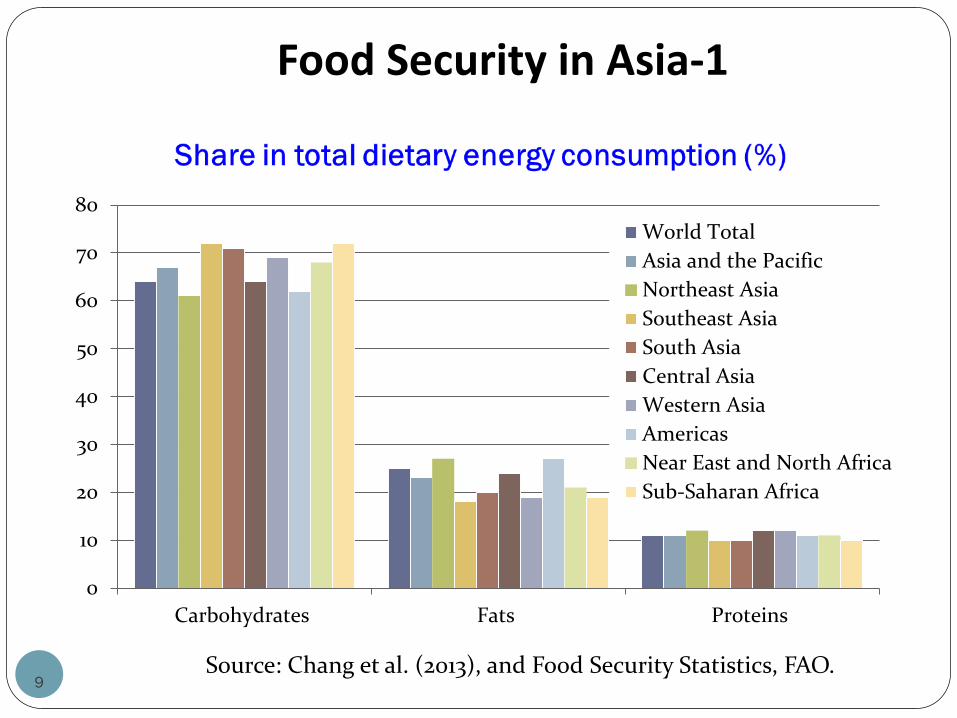
Food Security in Asia-1
9 Source: Chang et al. (2013), and Food Security Statistics, FAO.
0
10
20
30
40
50
60
70
80
Carbohydrates Fats Proteins
World Total
Asia and the Pacific
Northeast Asia
Southeast Asia
South Asia
Central Asia
Western Asia
Americas
Near East and North Africa
Sub-Saharan Africa

Undernourishment in 2010-12, by region (millions)
10
Source: FAO Hunger Portal. Food and Agriculture Organization (FAO), United Nations 2012 [cited December 1 2012]. Available from http://www.fao.org/hunger/en/.
Food Security in Asia-2
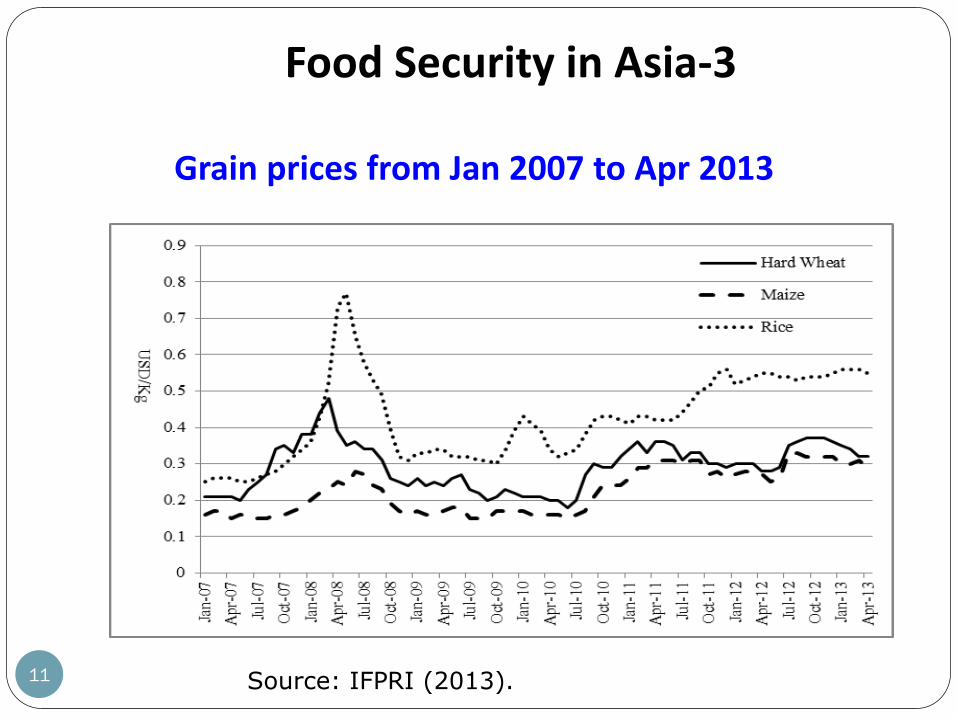
Grain prices from Jan 2007 to Apr 2013
11 Source: IFPRI (2013).
Food Security in Asia-3

Food Aid Delivery Are Declining Globally
12 Source: WFP, Food Aid Information System (INTERFAIS).
• Main causes: (ODI, Food aid and food assistance in emergency and
• transitional contexts: A review of current thinking, 2011)
• Tightened food supply due to weather anomaly • Pressure from financial and fuel crises • Shift from program/project aid to emergency aid by key donors • Change in sourcing from in-kind to in-cash local purchase
13
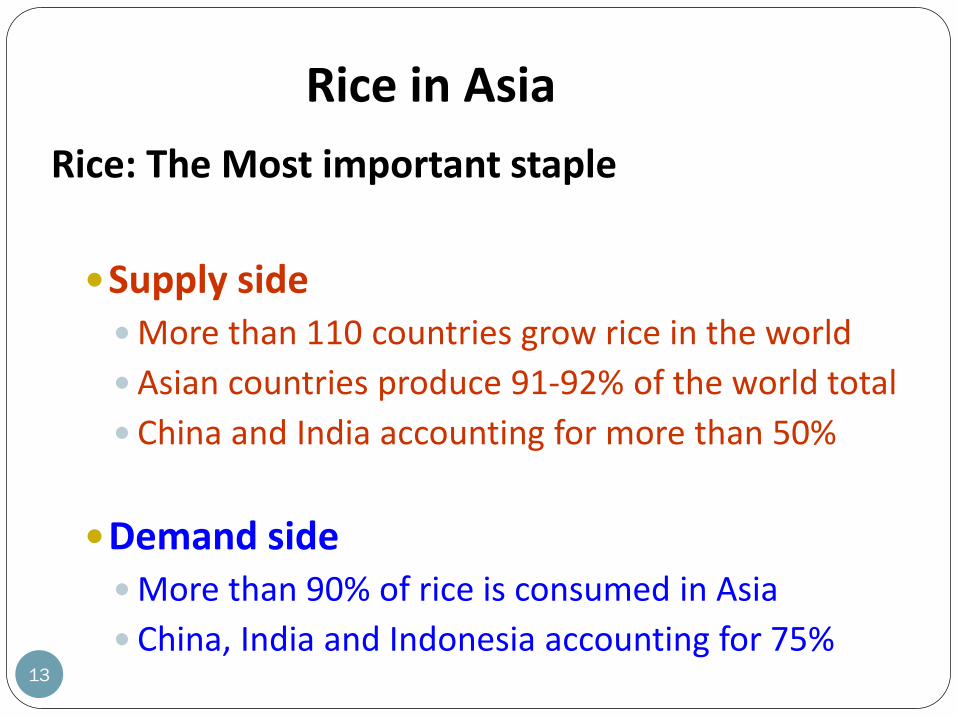
Rice in Asia
Rice: The Most important staple
Supply side More than 110 countries grow rice in the world
Asian countries produce 91-92% of the world total
China and India accounting for more than 50%
Demand side More than 90% of rice is consumed in Asia
China, India and Indonesia accounting for 75%
14
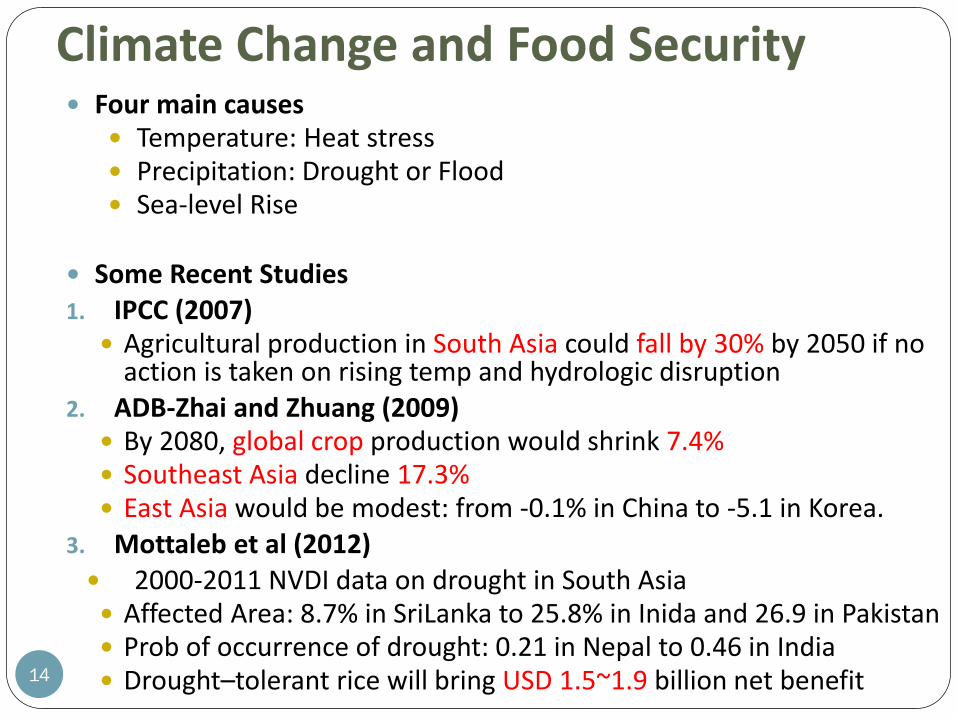
Climate Change and Food Security Four main causes
Temperature: Heat stress Precipitation: Drought or Flood Sea-level Rise
Some Recent Studies 1. IPCC (2007)
Agricultural production in South Asia could fall by 30% by 2050 if no action is taken on rising temp and hydrologic disruption
2. ADB-Zhai and Zhuang (2009) By 2080, global crop production would shrink 7.4% Southeast Asia decline 17.3% East Asia would be modest: from -0.1% in China to -5.1 in Korea.
3. Mottaleb et al (2012) 2000-2011 NVDI data on drought in South Asia Affected Area: 8.7% in SriLanka to 25.8% in Inida and 26.9 in Pakistan Prob of occurrence of drought: 0.21 in Nepal to 0.46 in India Drought–tolerant rice will bring USD 1.5~1.9 billion net benefit
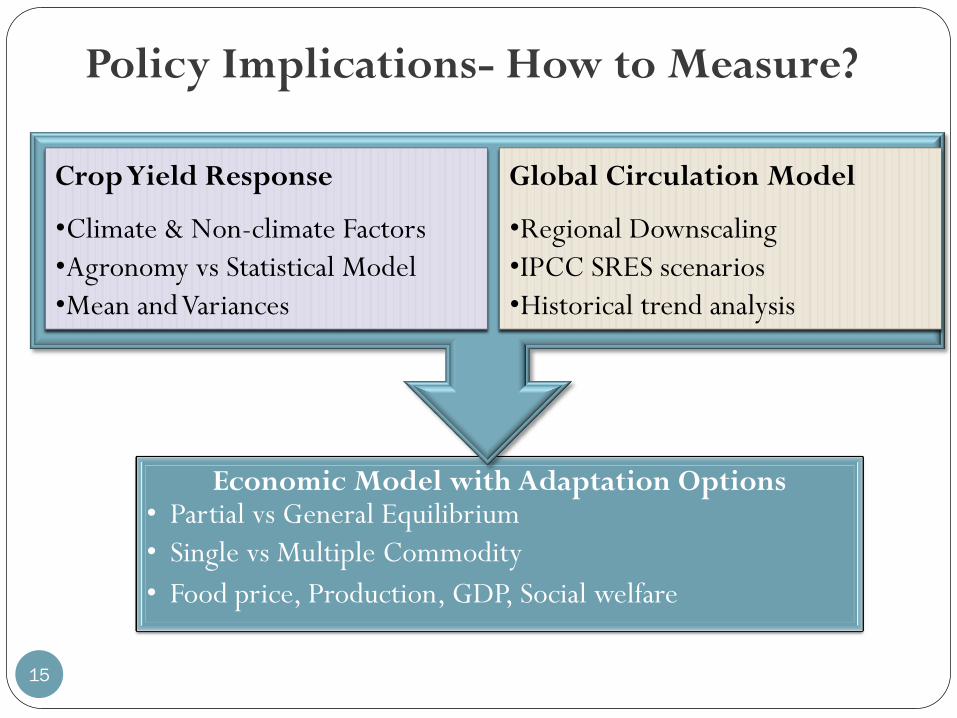
Policy Implications- How to Measure?
Economic Model with Adaptation Options • Partial vs General Equilibrium
• Single vs Multiple Commodity
• Food price, Production, GDP, Social welfare
15
Crop Yield Response
•Climate & Non-climate Factors
•Agronomy vs Statistical Model
•Mean and Variances
Global Circulation Model
•Regional Downscaling
•IPCC SRES scenarios
•Historical trend analysis
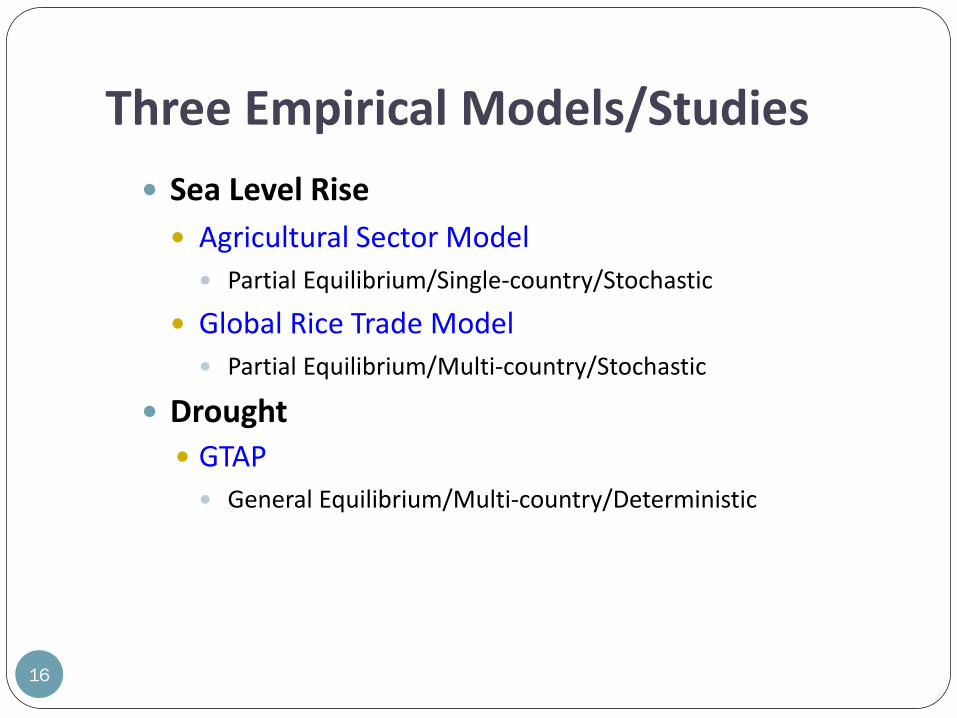
Three Empirical Models/Studies
16
Sea Level Rise
Agricultural Sector Model
Partial Equilibrium/Single-country/Stochastic
Global Rice Trade Model
Partial Equilibrium/Multi-country/Stochastic
Drought
GTAP
General Equilibrium/Multi-country/Deterministic

17
Methodology
Step 1. Estimating the effects of climate change on agricultural productivity Experimental Data Crop Simulation Model (e.g., EPIC) Econometric (Statistical ) Model w/Historical Data
Step 2. Climate Change Scenarios
Step 3. Combinations of steps 1 and 2
Step 4. Estimating the economic impacts
Step 5. Evaluating the adaptation strategies

18
Cast Study 1— Evaluating the Economic Impacts of Crop Yield Change
and Sea Level Rise Induced by Climate Change on
Agricultural Sector in Taiwan (Chang et al., 2012)
Model features 1. Market competition
Many producers and consumers Competitive for both product and input markets
2. Price endogeneity Social welfare will be maximized at the interception of demand and supply curves Prices are determined by supply-demand balance conditions
3. Embody adaptation possibilities
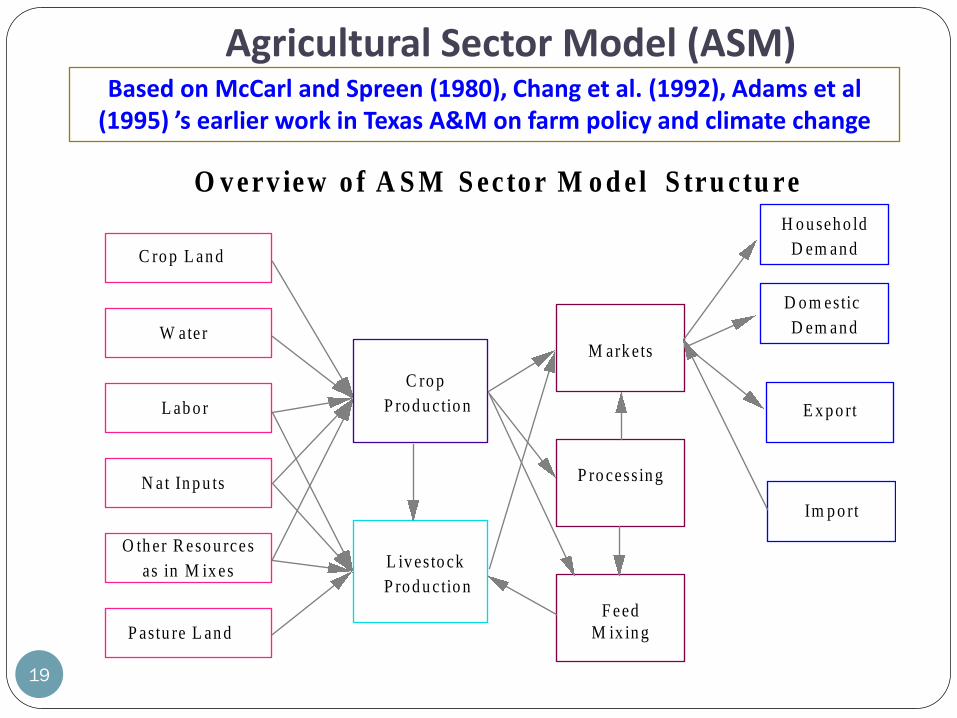
Agricultural Sector Model (ASM)
19
P ro cess in g
M ark ets
F eed
M ix in g
O th er R eso u rces
as in M ix es
L ab o r
P astu re L an d
N at In p u ts
C ro p L an d
W ate r
L iv es to ck
P rod u c tio n
C ro p
P rod u c tio n E x p o rt
D o m estic
D em an d
Im p o rt
O v erv iew o f A S M S ecto r M o d el S tru ctu re
H o u seh o ld
D em an d
Based on McCarl and Spreen (1980), Chang et al. (1992), Adams et al (1995) ’s earlier work in Texas A&M on farm policy and climate change

Stochastic ASM Mathematical Forms
20
Subscript s denoting the state of nature from climate conditions
i k
ikik
k k
kkkkk
s i
isis XCdRRdLLdQQsMAX )()()({*)(
i i i
X
i
X
i
i
issi
M
is
M
is dQQESdTRQTRQEXEDdQQED )()()(
}]**[ i
isi
M
isi TRQouttaxQtax i k
k
LG
i
G
i ALPQP ** ,
Subject to:
siTRQQXCCYIELDYQQQ is
M
is
k
ikiiks
G
i
X
isis ,0)(*)1(* ,
kSLRLALX kk
i
ik 0)1(* ,
i
kikik kRXf 0 ,

Chang's Estimates of Crop Yield Response to Temperature and Precipitation in Taiwan
Temperature Precipitation
Season Spring Summer Fall Winter Spring Summer Fall Winter
Rice 0.08 0.00 -0.20 -0.05 -0.01 -0.08 0.03 0.01
Peanuts -0.17 0.40 0.10 -0.13 -0.01 -0.08 0.00 0.06
Adzuki bean -0.34 -0.54 0.73 -1.34 0.00 0.07 -0.27 0.08
Sweet-Potatoes
0.16 0.20 -0.67 0.26 0.00 -0.03 -0.21 -0.01
Tea 0.02 0.59 -1.18 0.64 0.02 -0.24 0.02 0.01
Cane for Process
-0.10 -0.23 0.04 -0.33 0.03 0.35 -0.26 0.06
21
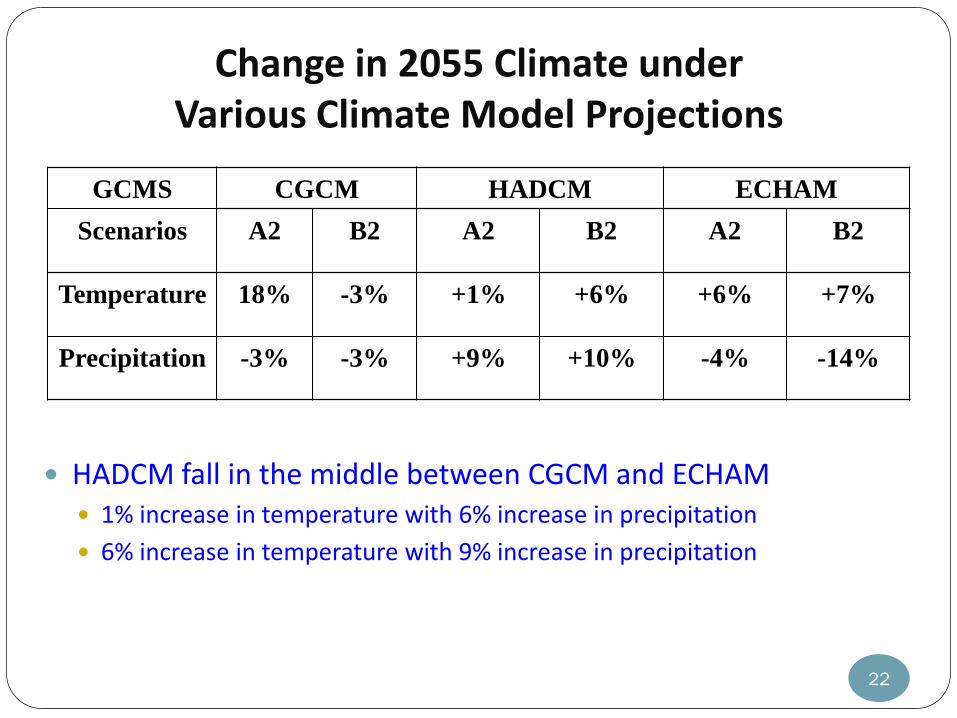
Change in 2055 Climate under Various Climate Model Projections
GCMS CGCM HADCM ECHAM
Scenarios A2 B2 A2 B2 A2 B2
Temperature 18% -3% +1% +6% +6% +7%
Precipitation -3% -3% +9% +10% -4% -14%
HADCM fall in the middle between CGCM and ECHAM 1% increase in temperature with 6% increase in precipitation
6% increase in temperature with 9% increase in precipitation
22
23
Possible Adaptation Strategies
Crop Yield Improvement
Free Trade and Storage
24
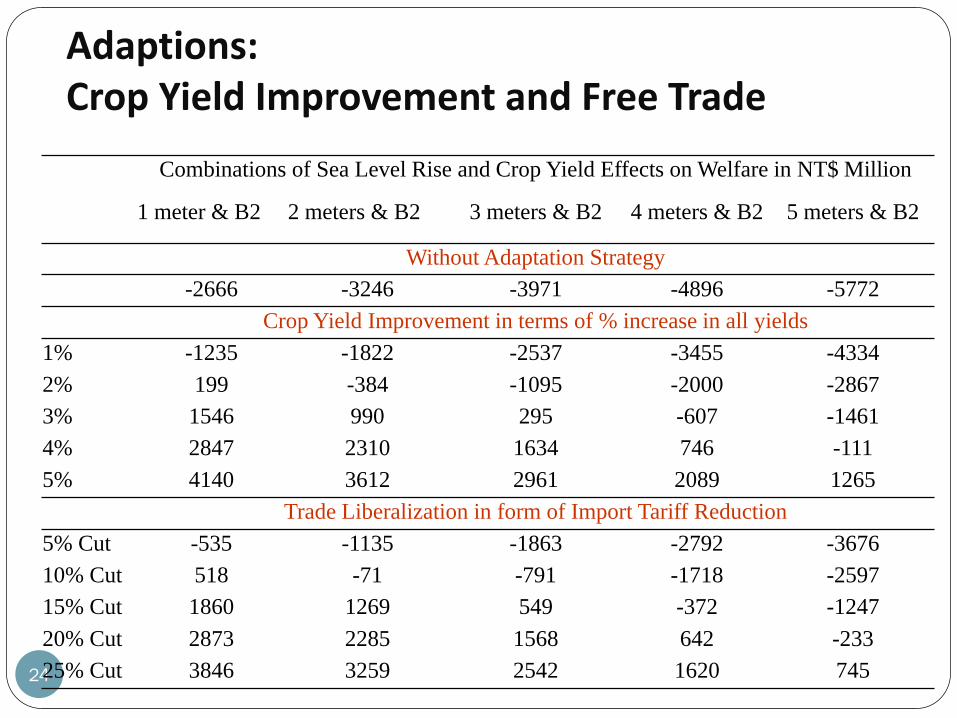
Adaptions: Crop Yield Improvement and Free Trade
Combinations of Sea Level Rise and Crop Yield Effects on Welfare in NT$ Million
1 meter & B2 2 meters & B2 3 meters & B2 4 meters & B2 5 meters & B2
Without Adaptation Strategy
-2666 -3246 -3971 -4896 -5772
Crop Yield Improvement in terms of % increase in all yields
1% -1235 -1822 -2537 -3455 -4334
2% 199 -384 -1095 -2000 -2867
3% 1546 990 295 -607 -1461
4% 2847 2310 1634 746 -111
5% 4140 3612 2961 2089 1265
Trade Liberalization in form of Import Tariff Reduction
5% Cut -535 -1135 -1863 -2792 -3676
10% Cut 518 -71 -791 -1718 -2597
15% Cut 1860 1269 549 -372 -1247
20% Cut 2873 2285 1568 642 -233
25% Cut 3846 3259 2542 1620 745
25
Cast Study 2— Impact of Sea Level Rise on Global Rice Market
(Chen et al., 2011)
Model Fearures
Based on Samuelson (1952) and Takayama and Judge (1971) Spatial Equilibrium Model
The deterministic model is modified into stochastic version
Imperfect competitive market in a global rice market is assumed

26
Stochastic Rice Trade Model
—Mathematical Forms
i
ii
i i
siiii
i i i
isisiiii
s
i
iiisiiisisi
QSprsTREexstar
STOAstocTREts
dQSieldperYQSgdQDQDf
MaxCSPS
'
,',''
'
,',',
)
])([)(
)))Y(1*)(()((
s.t.
'
',,',', ,0)1(*)()(i
isisisiisisiisii siQDSTOASTOWYieldperYQSTRETRE
s
isis iSTOSTOAs 0]W[*)(

27
Rice Production Reduction due to Sea Level Rise
To estimate rice planted acreage affects, the ratio of rice acreage divided by total cropland is applied to the land loss scenarios.
-20
-15
-10
-5
0
5
10
Ban
gla
de
sh
Bra
zil
Chin
a
Indonesia
Japan
Kore
a R
ep
Phill
ines
Taiw
an
East
Afr
ica
Egypt
India
Myanm
ar
Pakis
tan
Tha
ilan
d
US
A
Vie
tnam
Perc
en
tag
e C
ha
ng
e (
%)
1 meter
2 meter
3 meter
4 meter
5 meter
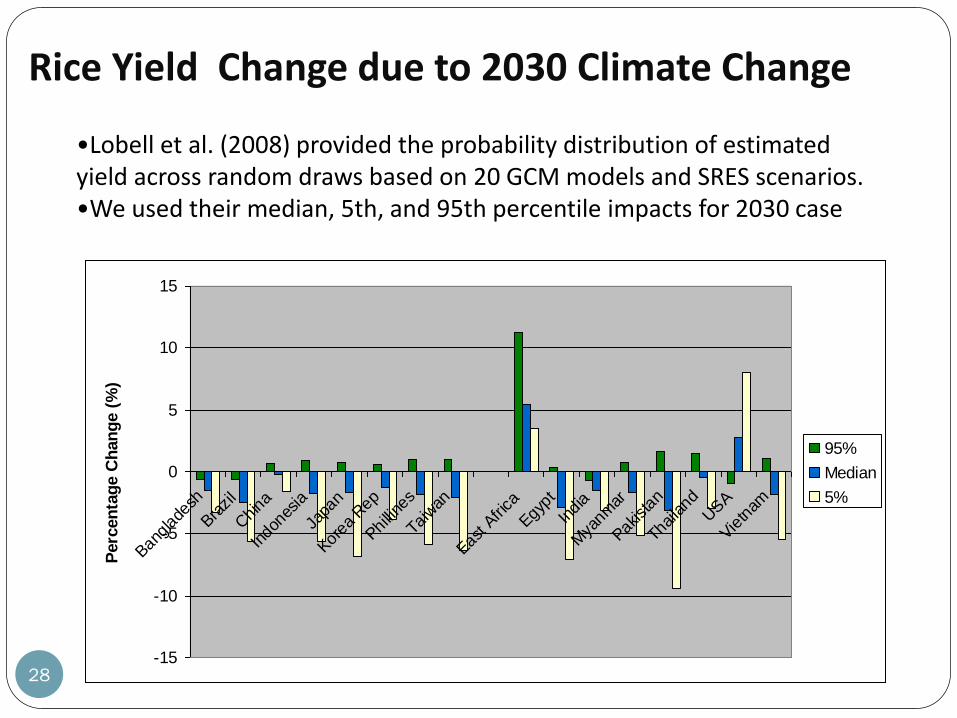
Rice Yield Change due to 2030 Climate Change
28 -15
-10
-5
0
5
10
15
Banglad
esh
Brazil
China
Indo
nesia
Japa
n
Korea
Rep
Phillin
es
Taiw
an
East A
frica
Egypt
India
Mya
nmar
Pakista
n
Thailand
USA
Vietn
am
Perc
en
tag
e C
han
ge (
%)
95%
Median
5%
•Lobell et al. (2008) provided the probability distribution of estimated yield across random draws based on 20 GCM models and SRES scenarios. •We used their median, 5th, and 95th percentile impacts for 2030 case
29
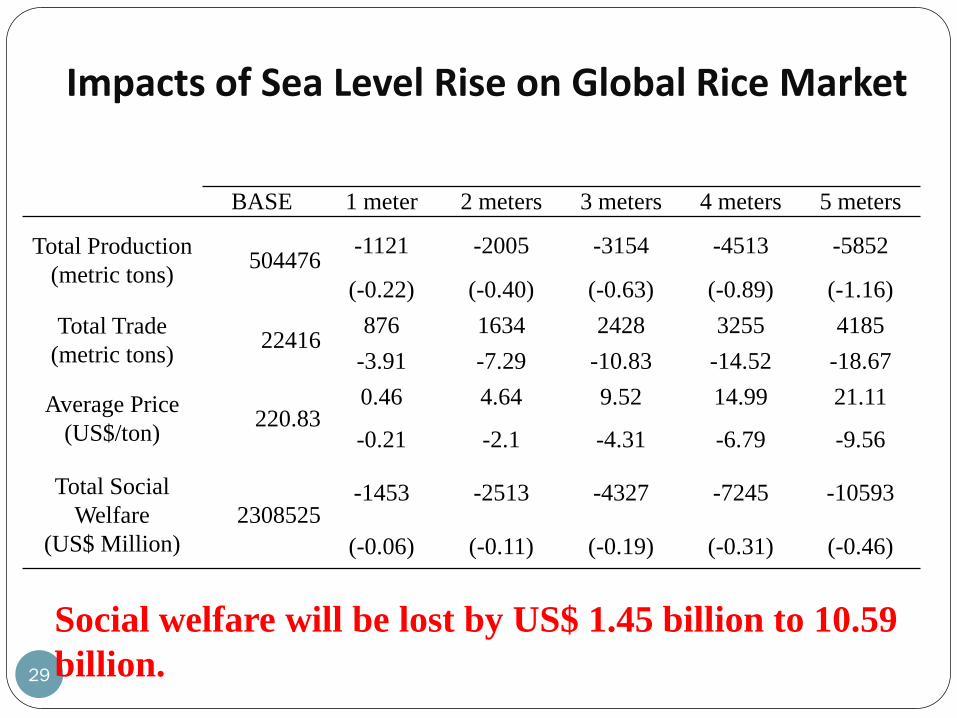
Impacts of Sea Level Rise on Global Rice Market
Social welfare will be lost by US$ 1.45 billion to 10.59
billion.
BASE 1 meter 2 meters 3 meters 4 meters 5 meters
Total Production
(metric tons) 504476
-1121 -2005 -3154 -4513 -5852
(-0.22) (-0.40) (-0.63) (-0.89) (-1.16)
Total Trade
(metric tons) 22416
876 1634 2428 3255 4185
-3.91 -7.29 -10.83 -14.52 -18.67
Average Price
(US$/ton) 220.83
0.46 4.64 9.52 14.99 21.11
-0.21 -2.1 -4.31 -6.79 -9.56
Total Social
Welfare
(US$ Million)
2308525 -1453 -2513 -4327 -7245 -10593
(-0.06) (-0.11) (-0.19) (-0.31) (-0.46)
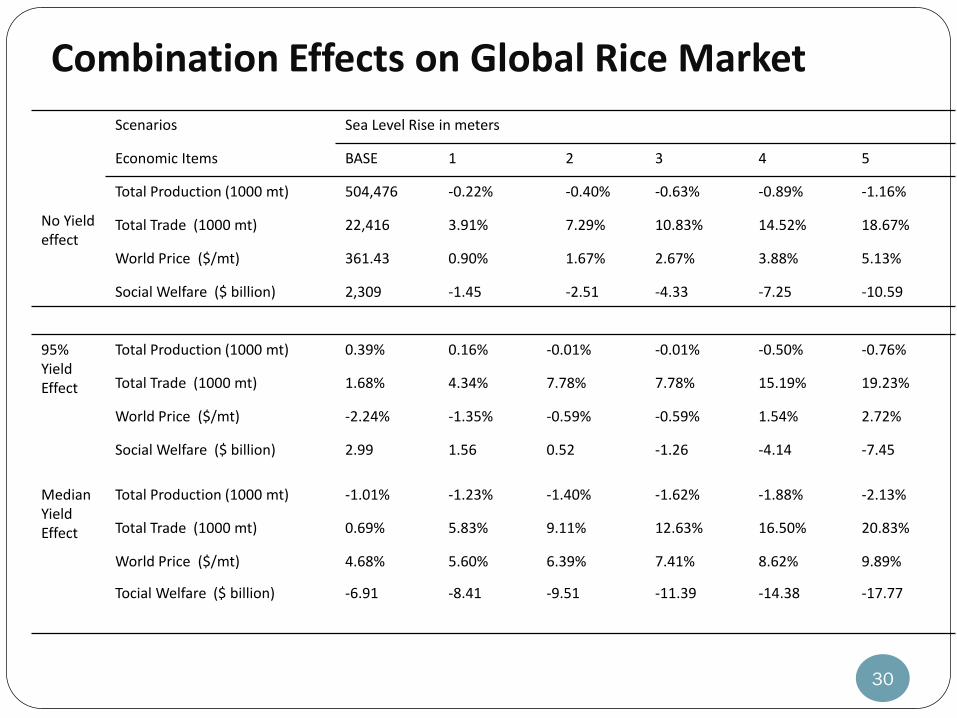
Combination Effects on Global Rice Market
No Yield effect
Scenarios Sea Level Rise in meters
Economic Items BASE 1 2 3 4 5
Total Production (1000 mt) 504,476 -0.22% -0.40% -0.63% -0.89% -1.16%
Total Trade (1000 mt) 22,416 3.91% 7.29% 10.83% 14.52% 18.67%
World Price ($/mt) 361.43 0.90% 1.67% 2.67% 3.88% 5.13%
Social Welfare ($ billion) 2,309 -1.45 -2.51 -4.33 -7.25 -10.59
95% Yield Effect
Total Production (1000 mt) 0.39% 0.16% -0.01% -0.01% -0.50% -0.76%
Total Trade (1000 mt) 1.68% 4.34% 7.78% 7.78% 15.19% 19.23%
World Price ($/mt) -2.24% -1.35% -0.59% -0.59% 1.54% 2.72%
Social Welfare ($ billion) 2.99 1.56 0.52 -1.26 -4.14 -7.45
Median Yield Effect
Total Production (1000 mt) -1.01% -1.23% -1.40% -1.62% -1.88% -2.13%
Total Trade (1000 mt) 0.69% 5.83% 9.11% 12.63% 16.50% 20.83%
World Price ($/mt) 4.68% 5.60% 6.39% 7.41% 8.62% 9.89%
Tocial Welfare ($ billion) -6.91 -8.41 -9.51 -11.39 -14.38 -17.77
30

Amount of Adaptation Needed
31
(…): % change in yield improvement to overcome welfare losses to zero
[…] : % trade barriers cut (i.e. trade liberalization) to overcome welfare losses
Sea Level Rise in meters
BASE 1 2 3 4 5
No Yield
Effect
(1%)
[14%]
(2%)
[18%]
(2%)
[22%]
(4%)
[28%]
(5%)
[33%]
Upper
95% Yield
Effect
(0%)
[0%]
(0%)
[0%]
(0%)
[0%]
(1%)
[15%]
(2%)
[24%]
(4%)
[28%]
Median
Yield
Effect
(3%)
[28%]
(4%)
[32%]
(4%)
[33%]
(5%)
[35%]
(7%)
[38%]
(8%)
[40%]
Lower 5%
Yield
Effect
(10%)
[45%]
(10%)
[46%]
( 11%)
[46%]
(12%)
[48%]
(13%)
[49%]
(15%)
[51%]

32
Cast Study 3— Potential Impact of Drought on Food Security in
Asia (Chen et al., 2013)

33
= selected grid point
STEP 1: Examine monthly SC-PDSI data (Tunalioglu and Duedu, 2012) for 24 Asian countries from Dai (2012) at a grid resolution of 2.5° by 2.5°.

34
Step 2: Use Just and Pope (1978) stochastic production function to find marginal effect of PSDI on rice production:
Panel of 18 Indica and 6 Japonica rice zone, 1961-2010 Japonica rice Indica rice
Baseline PDSI -0.6889 -0.3705
Marginal effect of PDSI on rice
Mean equation -0.4030 -0.1602
Variability equation 7.3285 -1.2807
Skewness equation 1.3232 0.1703
2020s 2040s 2060s 2020s 2040s 2060s
Projection of PDSI -1.3664 -1.7294 -2.3278 -1.3249 -1.3752 -1.7679
Marginal effect of future PDSI on rice production distribution
Mean -0.2730 -0.4193 -0.6605 -0.1528 -0.1609 -0.2238
Variability 4.9647 7.6247 12.0103 -1.2222 -1.2871 -1.7895
Skewness 0.8964 1.3767 2.1686 0.1625 0.1711 0.2379
Marginal effect of future PDSI on rice production distribution in %
Mean -8.7934 -13.5058 -21.2749 -5.8695 -6.1806 -8.5968
Variability 2.1222 3.2592 5.1339 -2.4256 -2.5544 -3.5515
Skewness 14.3550 22.0462 34.7270 15.0009 15.7966 21.9634
2020s 2040s 2060s
Changes in total rice production
-in absolute volume (mil ton)
-42.01
-53.54
-79.93
-in percentage(%)* -6.93 -8.83 -13.18
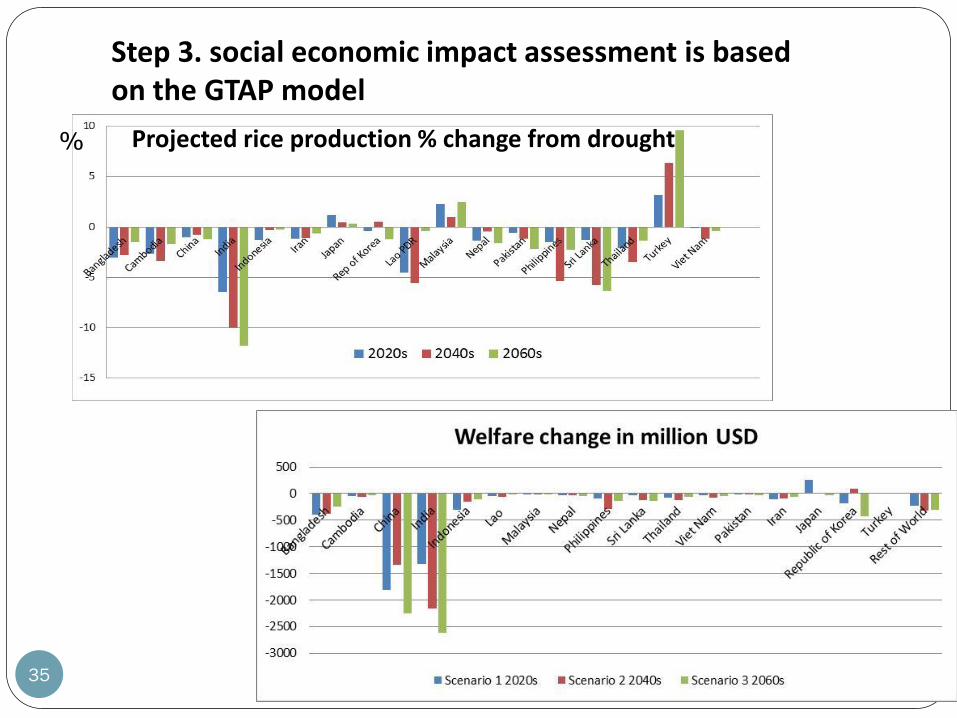
35
Projected rice production % change from drought
Step 3. social economic impact assessment is based on the GTAP model
%
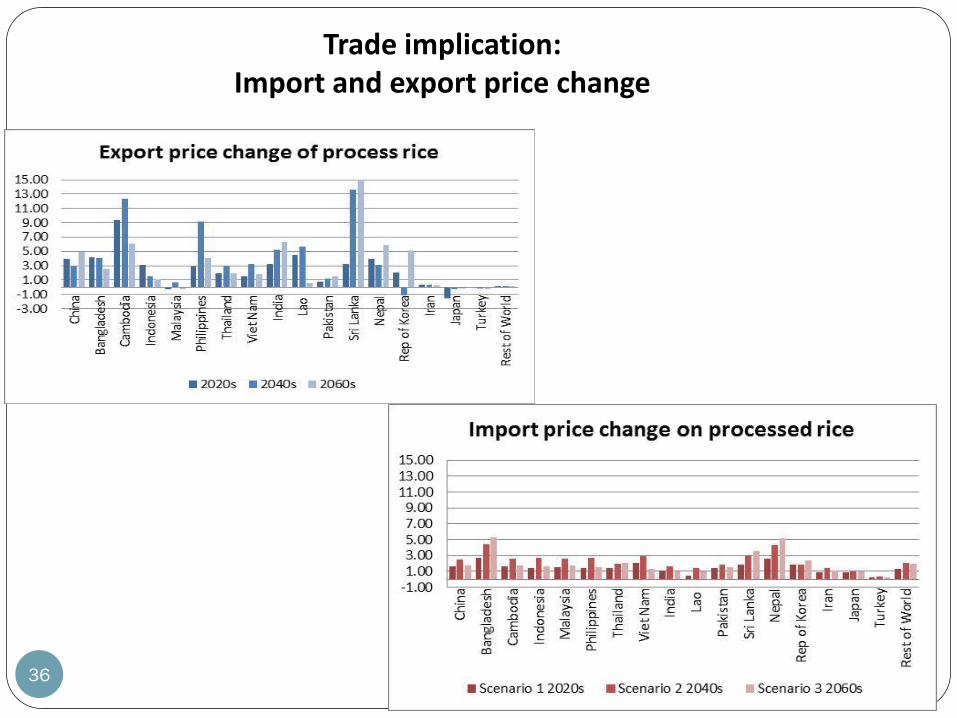
36
Trade implication: Import and export price change

Agenda for Further Research-1
37
Our study has not yet considered
Possible expansion/shrinkage of land use under the influence of climate change
Consequent change in the crop suitability of land
Climate change driven plant pest and diseases
Adoption of heat/drought-resistant varieties of crops
Collaboration with experts of agronomy and biogeography will help fill the gap.
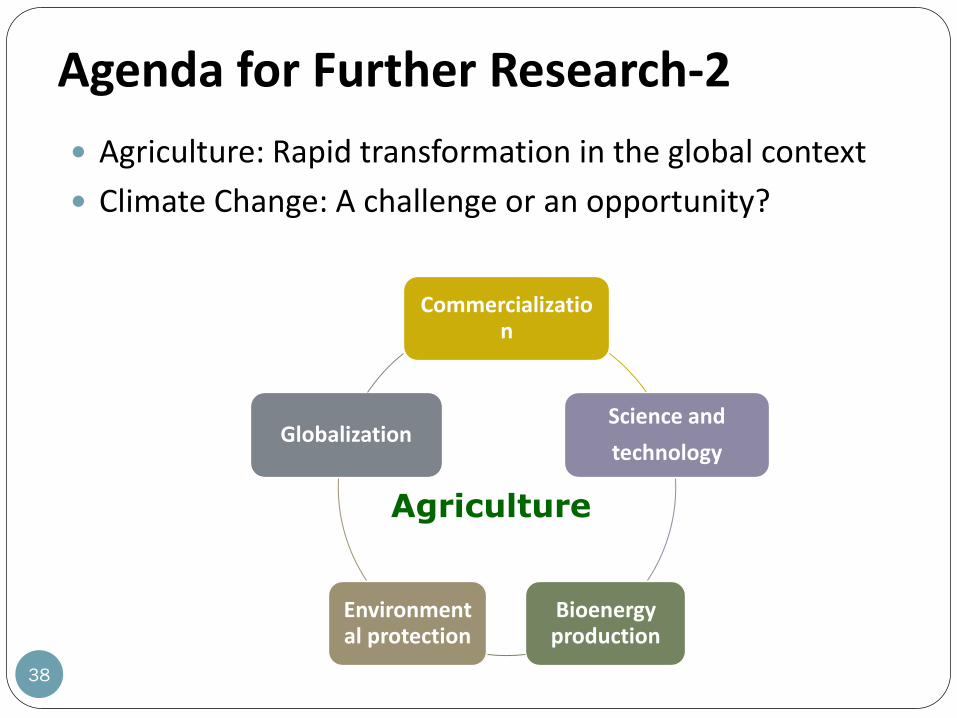
Agenda for Further Research-2
38
Agriculture: Rapid transformation in the global context
Climate Change: A challenge or an opportunity?
Commercialization
Science and
technology
Bioenergy production
Environmental protection
Globalization
Agriculture
References-1 Adams, R.A., R.A. Fleming, C.C. Chang, B.A.McCarl, and C. Rosenzweig. 1995. "A Reassessment of the
Economic Effects of Global Climate Change on U.S. Agriculture." Climatic Change, 27: 147-167
Chang, C.C., H.L Lee, and S.H Hsu, 2013. “Food Security: Global Trends and Regional Perspective with
Reference to East Asia”, The Pacific Review 26, 583-606.
Chang, C.C., B.A. McCarl, J. Mjelde, J. Richardson, 1992. "Sectoral Implications of Farm Program
Modifications." American Journal of Agricultural Economics 74: 38-49.
Chang, C.C., Chen C.C., and B.A. McCarl, 2012."Evaluating the Economic Impacts of Climate Change
Induced Sea Level Rise with Possible Adaptation Strategies on Taiwan Agricultural Sector", Agricultural
Economics, 43, 205-214.
Chen C.C., B.A. McCarl, and C.C. Chang,2011. "Climate Change, Sea Level Rise and Rice: Global Market
Implications", Climatic Change, 91, 211-231.
Chen C.C., C.C. Chang, N. Sinnarong, SH. Hsu, and D. Hsu, 2013. “Modeling the impact of drought on rice
market in Asia”, working paper.
Dai, A.G. 2012. Palmer Drought Severity Index (PDSI). The National Center for Atmospheric Research, CO.
http://www.cgd.ucar.edu/cas/catalog/climind/pdsi.html.
Dasgupta, S., Laplante, B., Meisner, C., Wheeler, D., & Yan, J., 2009. “The Impact of Sea Level Rise on
Developing Countries: A Comparative Analysis.” Climatic Change. 93, 379-388.
IFPRI. 2013. World Commodity Prices. 2013 [cited April 20 2013]. Available from
http://www.foodsecurityportal.org/api/world-commodity-prices.
Intergovernmental Panel on Climate Change. 2001a. Climate change 2001: synthesis report. A contribution of
Working Groups I, II, and III to the Third Assessment Report of the Intergovernmental Panel on Climate
Change [Watson, R. T. and the Core Writing Team (eds.)]. Cambridge Univ Press, New York, NY, USA.
Intergovernmental Panel on Climate Change. 2001b. Climate change 2001: impacts, adaptation, and vulnerability. A
contribution of Working Group II to the Third Assessment Report of the Intergovernmental Panel on Climate
Change [McCarthy, J. J., O. F. Canziani, N. A. Leary, D. J. Dokken and K. S. White (eds.)]. Cambridge Univ
Press, New York, NY, USA.
39
References-2 McCarl, B. A., Spreen, T. H., 1980. “Price endogenous mathematical programming as a tool for sector analysis.
“American Journal of Agricultural Economics 62, 87–102.
Lobell, D.B., M. B. Burke, C. Tebaldi, M. D. Mastrandrea, W. P. Falcon, and R.L. Naylor, 2008, “Prioritizing
Climate Change Adaptation Needs for Food Security in 2030,” Science, 319 607-610. Meier MF, Dyurgerov MB, Rick UK, O'Neel S, Pfeffer WT, Anderson RS, Anderson SP, Glazovsky AF., 2007.
Glaciers dominate eustatic sea-level rise in the 21st century.” Science, 317(5841): 1064-7.
• Mottaleb et al., 2012. “Ex Ante Impact Assessment of a Drought Tolerant Rice Variety in the Presence of Climate
Change”, Paper presentation at the 2012 AAEA Annual Meeting, Seattle, USA, August 12-14, 2012.
• ODI, 2011. Food aid and food assistance in emergency and transitional contexts: A review of current thinking
• Pandey, S. et al. 2007b. “Coping with Drought in Rice Farming in Asia: Insights from a Cross-country
Comparative Study.” Agricultural Economics 37(1): 213-224.
Rahmstorf, S. 2007. “A Semi-Empirical Approach to Projecting Future Sea Level Rise.” Science, 315, 368-370.
Raper, S. C. B. and R. J. Braithwaite, 2006 “Low sea level rise projections from mountain glaciers and icecaps
under global warming.” Nature, 439, 311-313 doi:10.1038.
Rasmusson, E.M., 1989, “Interannual and Intraseasonal Climate variability. ” In Climate and Food Security, Manila:
International Rice Research Institute.
Samuelson, P.A. 1952. “Spatial Price Equilibrium and Linear Programming.” The American Economic Review
42:283-303.
Takayama, T. and G.G. Judge, 1971. Spatial and Temporal Price and Allocation Models, Amsterdam: North Holland
Publishing Co.
Xu et al. 2006. “Steady decline of east Asian monsoon winds, 1969–2000: Evidence from direct ground
measurements of wind speed”, Journal of Geophysical Research: Atmospheres Vol 111 D24111 ,
doi:10.1029/2006JD007337, 2006.
Zhai F. and J. Zhuang,2009. Agricultural Impact of Climate Change: A General Equilibrium Analysis with Special Reference
to Southeast Asia, ADB working paper series, Asia Development Bank Institute.
40
THANK YOU
COMMEMT WELCOME
41