Potential Effects of Climate Change on New York City Water Supply Quantity and Quality: An...
32
Potential Effects of Climate Change on New York City Water Supply Quantity and Quality: An Integrated Modeling Approach Donald Pierson, Elliot Schneiderman and Mark Zion New York City Dept of Environmental Protection Hampus Markensten and Emmet Owens Upstate Freshwater Institute
-
Upload
martin-ramsey -
Category
Documents
-
view
216 -
download
0
Transcript of Potential Effects of Climate Change on New York City Water Supply Quantity and Quality: An...
Potential Effects of Climate Change on New York City Water Supply Quantity and Quality: An Integrated Modeling Approach
Donald Pierson, Elliot Schneiderman and Mark Zion New York City Dept of Environmental Protection
Hampus Markensten and Emmet OwensUpstate Freshwater Institute

1. Project Overview
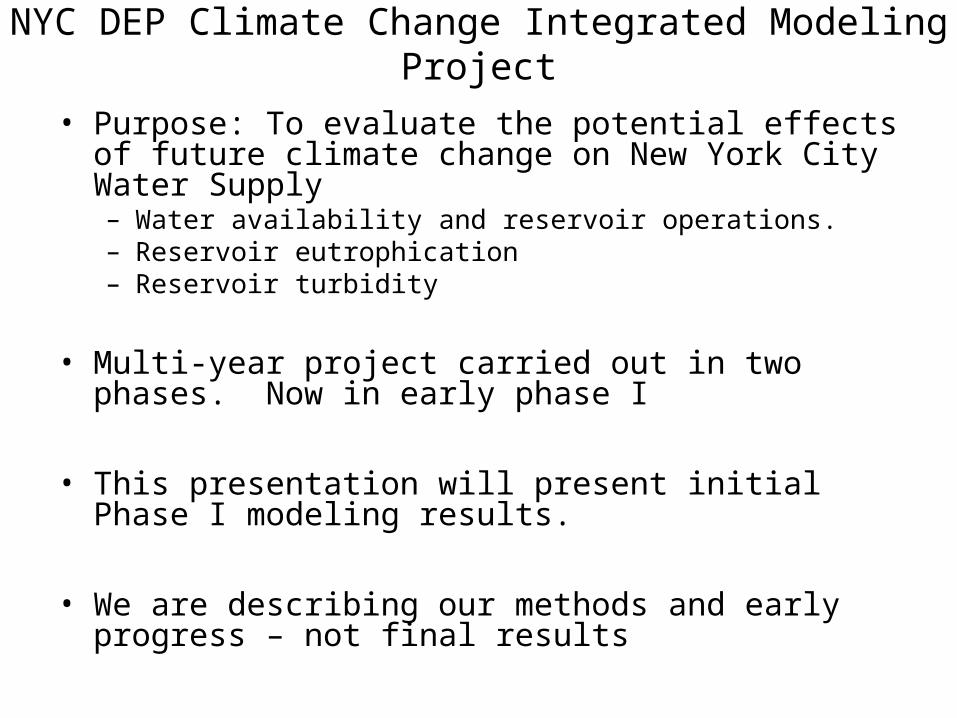
NYC DEP Climate Change Integrated Modeling Project
• Purpose: To evaluate the potential effects of future climate change on New York City Water Supply– Water availability and reservoir operations.– Reservoir eutrophication– Reservoir turbidity
• Multi-year project carried out in two phases. Now in early phase I
• This presentation will present initial Phase I modeling results.
• We are describing our methods and early progress – not final results
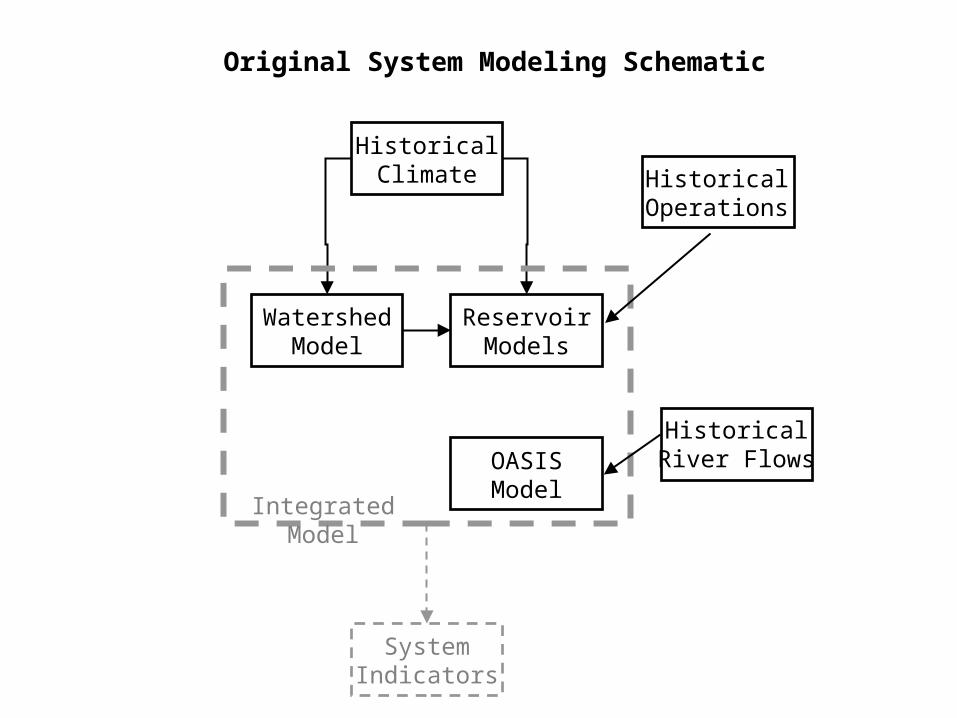
Original System Modeling Schematic
HistoricalClimate
WatershedModel
ReservoirModels
OASISModel
Integrated Model
SystemIndicators
HistoricalOperations
HistoricalRiver Flows

Early Phase I Model Connections
GCM/Delta ChangePredictions
WatershedModel
ReservoirModels
OASISModel
Integrated Model
SystemIndicators
AdjustedOperations
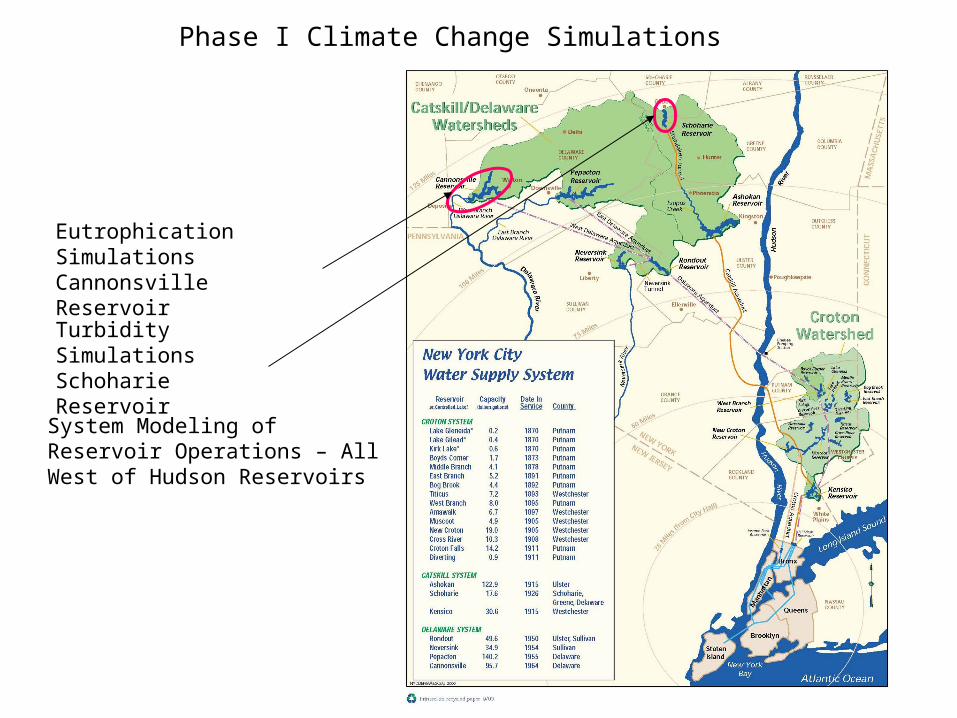
Turbidity Simulations Schoharie Reservoir
Eutrophication Simulations Cannonsville Reservoir
Phase I Climate Change Simulations
System Modeling of Reservoir Operations – All West of Hudson Reservoirs

2. Climate Change Projections
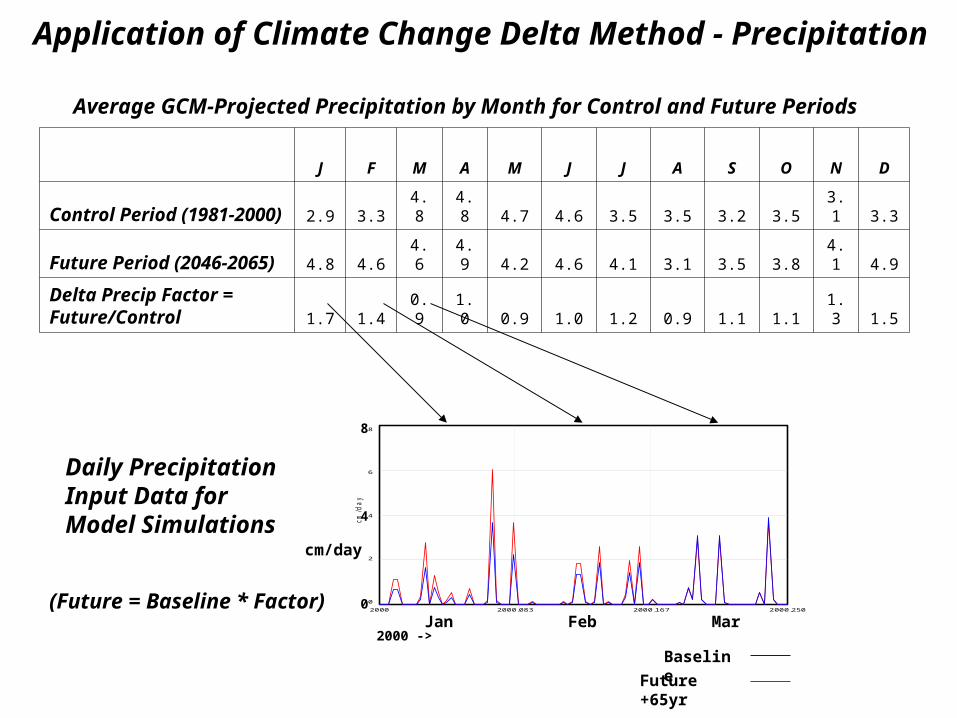
J F M A M J J A S O N D
Control Period (1981-2000) 2.9 3.3 4.8 4.8 4.7 4.6 3.5 3.5 3.2 3.5 3.1 3.3
Future Period (2046-2065) 4.8 4.6 4.6 4.9 4.2 4.6 4.1 3.1 3.5 3.8 4.1 4.9
Delta Precip Factor = Future/Control 1.7 1.4 0.9 1.0 0.9 1.0 1.2 0.9 1.1 1.1 1.3 1.5
Average GCM-Projected Precipitation by Month for Control and Future Periods
Daily Precipitation Input Data for Model Simulations
8
6
4
2
0
2000 2000.083 2000.167 2000.250
cm
/da
y
Jan Feb Mar
cm/day
4
8
0
2000 ->
Application of Climate Change Delta Method - Precipitation
Baseline
Future +65yr
(Future = Baseline * Factor)

40
20
0
-20
-40
2000 2000.083 2000.167 2000.250
de
gre
es C
Daily Air Temperature Input Data for Model Simulations
Jan Feb Mar
Degrees C
0
40
-40
2000 ->
Baseline
Future +65yr
20
-20
Application of Climate Change Delta Method – Air Temp
Average GCM-Projected Air Temperature by Month for Control and Future Periods
J F M A M J J A S O N D
Control Period (1981-2000) -5.4 -3.3 2.4 7.5 12.2 17.7 20.3 19.2 15.0 9.6 2.2 -2.5
Future Period (2046-2065) -1.6 -0.2 4.0 9.3 15.4 20.0 22.8 21.9 18.6 11.4 4.9 0.2
Delta Precip Factor = Future/Control 3.8 3.1 1.6 1.8 3.3 2.3 2.5 2.8 3.6 1.8 2.8 2.6
(Future = Baseline + Factor)

0
0.2
0.4
0.6
0.8
1
1.2
1.4
1.6
1.8
2
J F M A M J J A S O N D
Monthly Precipitation and Air Temperature Delta Change Factors
65 years forward (2046-2065)
•Expected monthly change in Precipitation
Based on 8 GCM/Emission Scenarios. Upper and lower bars are max and min of these. Box is the range of the remaining 6 scenarios. Vertical bar is the median of all scenarios.
(multiplicative factor)
(degrees C additive factor)
0
0.2
0.4
0.6
0.8
1
1.2
1.4
1.6
1.8
2
J F M A M J J A S O N D
•Expected monthly change in Air Temperature
100 years forward (2081-2100)
0
1
2
3
4
5
6
J F M A M J J A S O N D
0
1
2
3
4
5
6
J F M A M J J A S O N D
3. Watershed Effects

GWLF Hydrologic Water Balance ModelPrecipitation
Snowpack
Mean Daily AirTemperature
Rain +Snowmelt
PET
ET
Runoff
Infiltration
UnsaturatedZone
Saturated Zone Baseflow
Streamflow
Latitude
RelativeHumidity
Solar Radiation
MeltCoeff
VegetationCover Coeff
CurveNumber Delay
Coeff
RecessCoeff
Soil WaterCapacity
UnsatLeakCoeff
Elevation
Season
Deep Seepage
SeepCoeff

GWLF Watershed Model ResultsSum of All WOH Watersheds
65 Yr Forward 100 Yr Forward
Temperature(oC)
Evapotranspiration(cm/day)
-10
-5
0
5
10
15
20
25
J F M A M J J A S O N D
0
0.05
0.1
0.15
0.2
0.25
0.3
0.35
0.4
J F M A M J J A S O N D
-10
-5
0
5
10
15
20
25
J F M A M J J A S O N D
0
0.05
0.1
0.15
0.2
0.25
0.3
0.35
0.4
J F M A M J J A S O N D
Based on 8 GCM/Emission Scenarios. Upper and lower bars are max and min of these. Box is the range of the remaining 6 scenarios. Bar within box is the median. Line shows baseline run.

GWLF Watershed Model ResultsSum of All WOH Watersheds
65 Yr Forward 100 Yr Forward
Snow(cm/day)
Snowpack(cm)
0
0.05
0.1
0.15
0.2
0.25
J F M A M J J A S O N D
0
0.05
0.1
0.15
0.2
0.25
J F M A M J J A S O N D
0
1
2
3
4
5
6
7
8
9
J F M A M J J A S O N D
0
1
2
3
4
5
6
7
8
9
J F M A M J J A S O N D

GWLF Watershed Model ResultsSum of All WOH Watersheds
65 Yr Forward 100 Yr Forward
Precipitation(cm/day)
Streamflow(cm/day)
0
0.05
0.1
0.15
0.2
0.25
0.3
0.35
0.4
0.45
0.5
J F M A M J J A S O N D
0
0.1
0.2
0.3
0.4
0.5
0.6
0.7
J F M A M J J A S O N D0
0.1
0.2
0.3
0.4
0.5
0.6
0.7
J F M A M J J A S O N D
0
0.05
0.1
0.15
0.2
0.25
0.3
0.35
0.4
0.45
0.5
J F M A M J J A S O N D

4. Water Supply System Effects
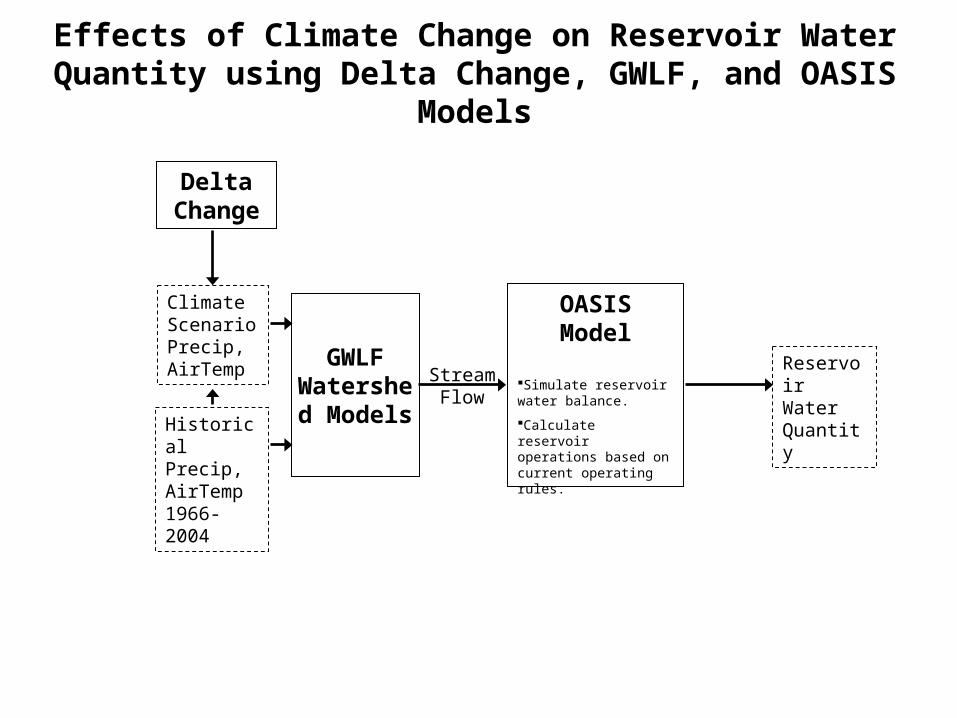
Effects of Climate Change on Reservoir Water Quantity using Delta Change, GWLF, and OASIS Models
GWLF Watershed
Models
OASIS Model
Historical Precip, AirTemp1966-2004
Climate Scenario Precip, AirTemp Stream
Flow
Reservoir Water Quantity
Simulate reservoir water balance.
Calculate reservoir operations based on current operating rules.
Delta Change
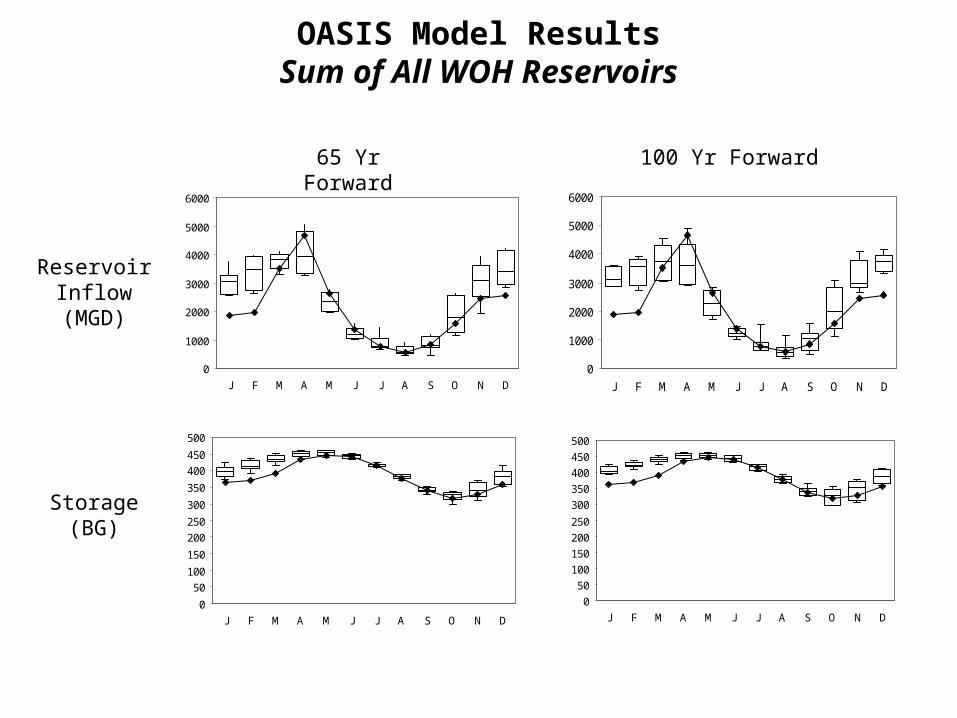
OASIS Model ResultsSum of All WOH Reservoirs
65 Yr Forward 100 Yr Forward
Reservoir Inflow(MGD)
Storage(BG)
0
50
100
150
200
250
300
350
400
450
500
J F M A M J J A S O N D0
50
100
150
200
250
300
350
400
450
500
J F M A M J J A S O N D
0
1000
2000
3000
4000
5000
6000
J F M A M J J A S O N D
0
1000
2000
3000
4000
5000
6000
J F M A M J J A S O N D
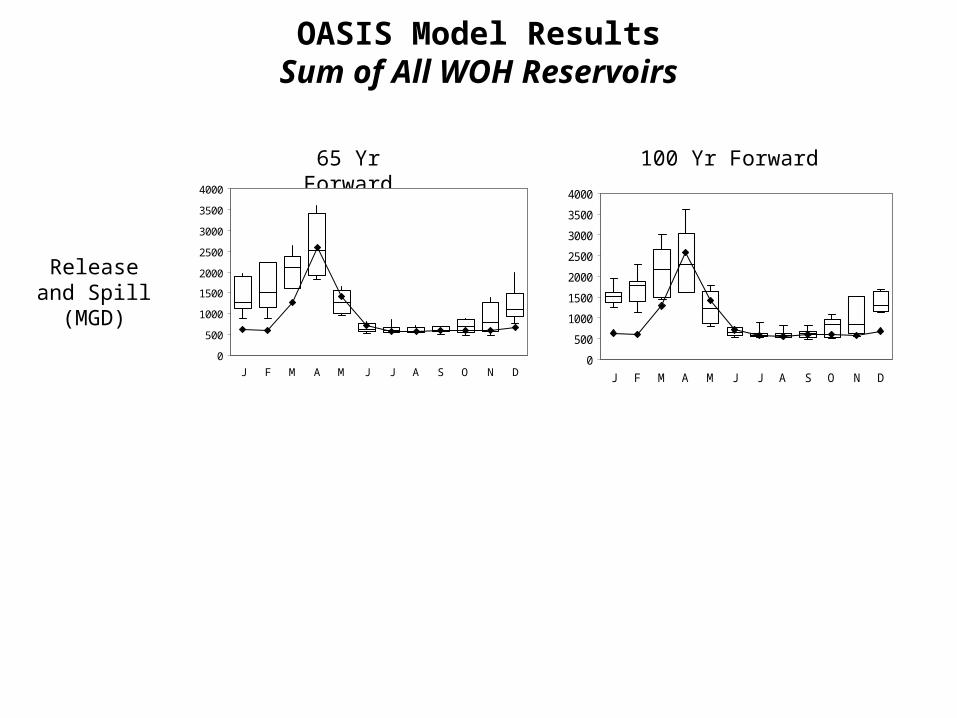
OASIS Model ResultsSum of All WOH Reservoirs
65 Yr Forward 100 Yr Forward
Release and Spill
(MGD)
0
500
1000
1500
2000
2500
3000
3500
4000
J F M A M J J A S O N D0
500
1000
1500
2000
2500
3000
3500
4000
J F M A M J J A S O N D

5. Turbidity Projections for Schoharie Reservoir

Effects of Climate Change on Turbidity in Schoharie Tunnel using Delta Change, GWLF, and W2 Models
GWLF Watershed
Model
Pre-Processor
W2 Reservoir
Model
Historical Precip, AirTemp
Climate Scenario Precip, AirTemp
Historical Tunnel Operation Data
StreamFlow
Net Flow In
Net turbidity In
Adj Tunnel Ops Data
Reservoir Water Quantity, Quality
Simulate reservoir water balance, and adjust tunnel data if withdrawal exceeds available storage.
Calculate turbidity inputs using sediment rating curve
Calculate net flow inputs
Reformat data for W2 model
Simulates water, temperature, and constituents in 2 dimensions (vertical, longitudinal)
Delta Change
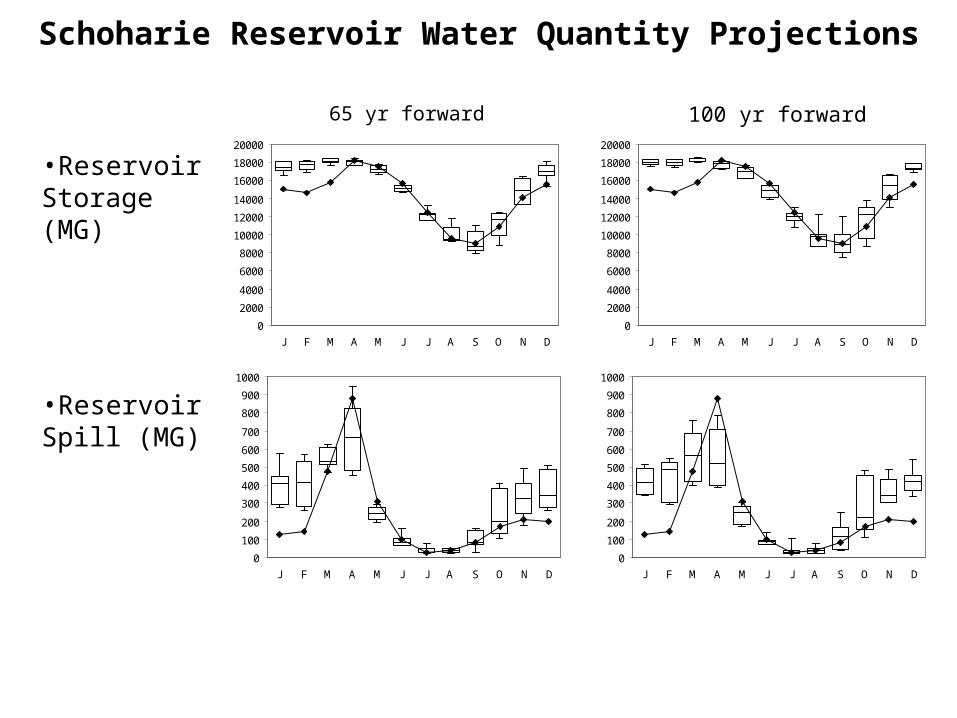
Schoharie Reservoir Water Quantity Projections
65 yr forward
•Reservoir Storage (MG)
•Reservoir Spill (MG)
100 yr forward
0
2000
4000
6000
8000
10000
12000
14000
16000
18000
20000
J F M A M J J A S O N D
0
2000
4000
6000
8000
10000
12000
14000
16000
18000
20000
J F M A M J J A S O N D
0
100
200
300
400
500
600
700
800
900
1000
J F M A M J J A S O N D
0
100
200
300
400
500
600
700
800
900
1000
J F M A M J J A S O N D

Schoharie Reservoir Turbidity Projections
65 yr forward
•Input Turbidity Load (ntu-mgd)
•Turbidity in Schoharie Tunnel (ntu)
100 yr forward
0
50000
100000
150000
200000
250000
300000
350000
J F M A M J J A S O N D
0
50000
100000
150000
200000
250000
300000
350000
400000
450000
J F M A M J J A S O N D
0
5
10
15
20
25
30
35
J F M A M J J A S O N D
0
5
10
15
20
25
30
35
40
J F M A M J J A S O N D

6. Eutrophication Projections for Cannonsville Reservoir

Effects of Climate Change on Trophic Status of Cannonsville Reservoir using Delta Change, GWLF, and
PROTECH Models
GWLF Watershed
Model
Pre-Processor
PROTECHReservoir
Model
Historical Precip, Air Temp
Climate Scenario Precip, Air Temp
Historical Operation Data
Adj Ops Data
Reservoir Water Quantity, Quality
StreamFlow
Net Flow In
Nutrient Loads
Simulate reservoir water balance, and adjust tunnel data if withdrawal exceeds available storage.
Adjust Inflow water temperature
Adjust Air temp and dew point temp inputs to reservoir model
Calculate net flow inputs
Reformat data for PROTECH model
Simulates water, temperature, nutrients and phytoplankton functional groups in 1 dimension (vertical)
Delta Change
Adjusted Met Data
Adj Stream Temp
Nutrient Loads
0
50
100
150
200
250
300
350
400
J F M A M J J A S O N D
0
20
40
60
80
100
120
J F M A M J J A S O N D0
20
40
60
80
100
120
J F M A M J J A S O N D
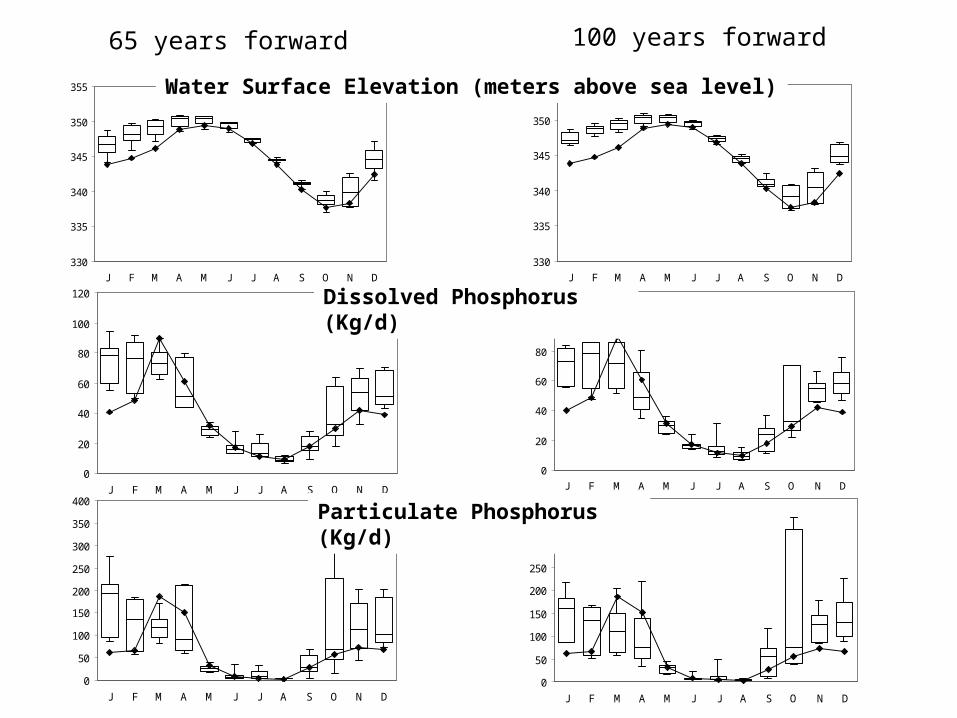
Dissolved Phosphorus (Kg/d)
0
50
100
150
200
250
300
350
400
J F M A M J J A S O N D
330
335
340
345
350
355
J F M A M J J A S O N D
330
335
340
345
350
355
J F M A M J J A S O N D
Water Surface Elevation (meters above sea level)
Particulate Phosphorus (Kg/d)
65 years forward 100 years forward
0
2
4
6
8
10
12
14
16
18
20
J F M A M J J A S O N D0
2
4
6
8
10
12
14
16
18
20
J F M A M J J A S O N D
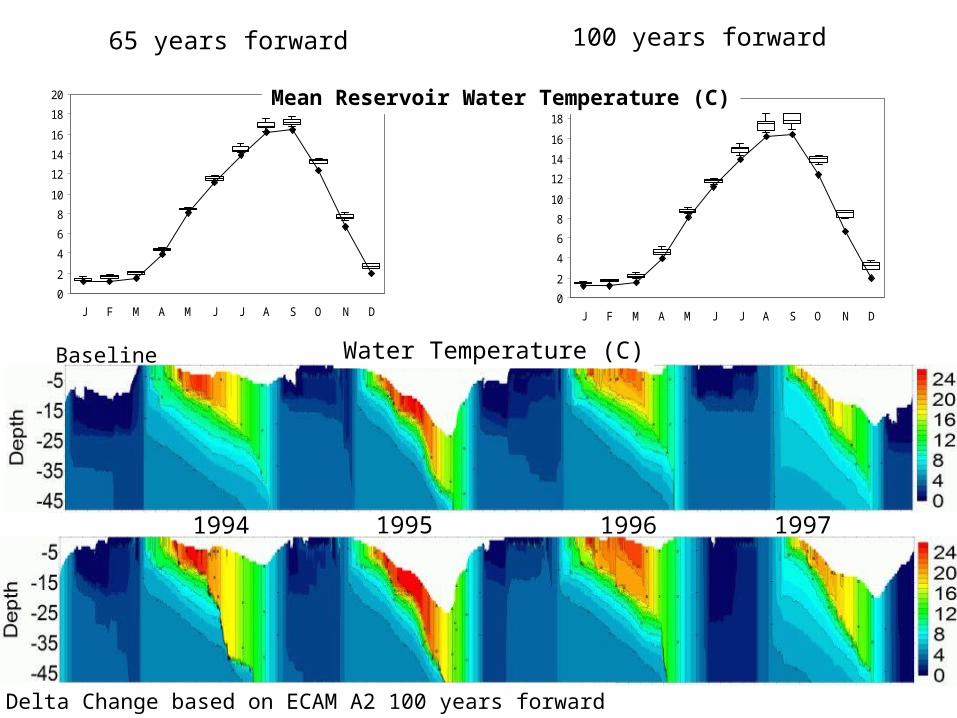
Mean Reservoir Water Temperature (C)
Baseline
Delta Change based on ECAM A2 100 years forward
Water Temperature (C)
1994 1995 1996 1997
65 years forward 100 years forward
0
1
2
3
4
5
J F M A M J J A S O N D0
1
2
3
4
5
J F M A M J J A S O N D
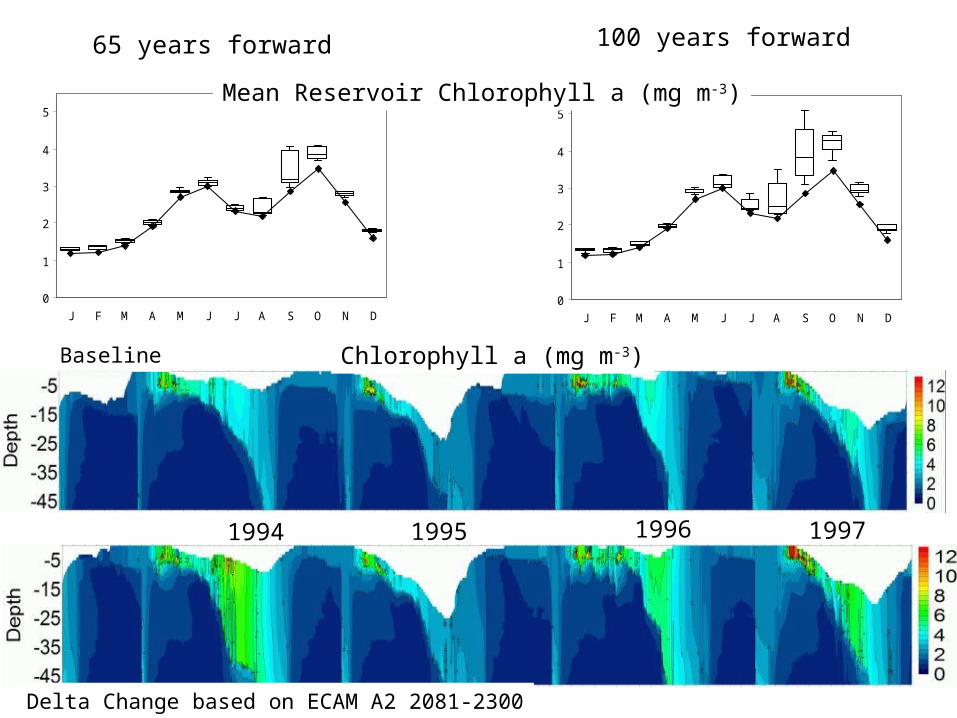
Mean Reservoir Chlorophyll a (mg m-3)
Baseline
Delta Change based on ECAM A2 2081-2300
Chlorophyll a (mg m-3)
1994 1995 1996 1997
65 years forward 100 years forward
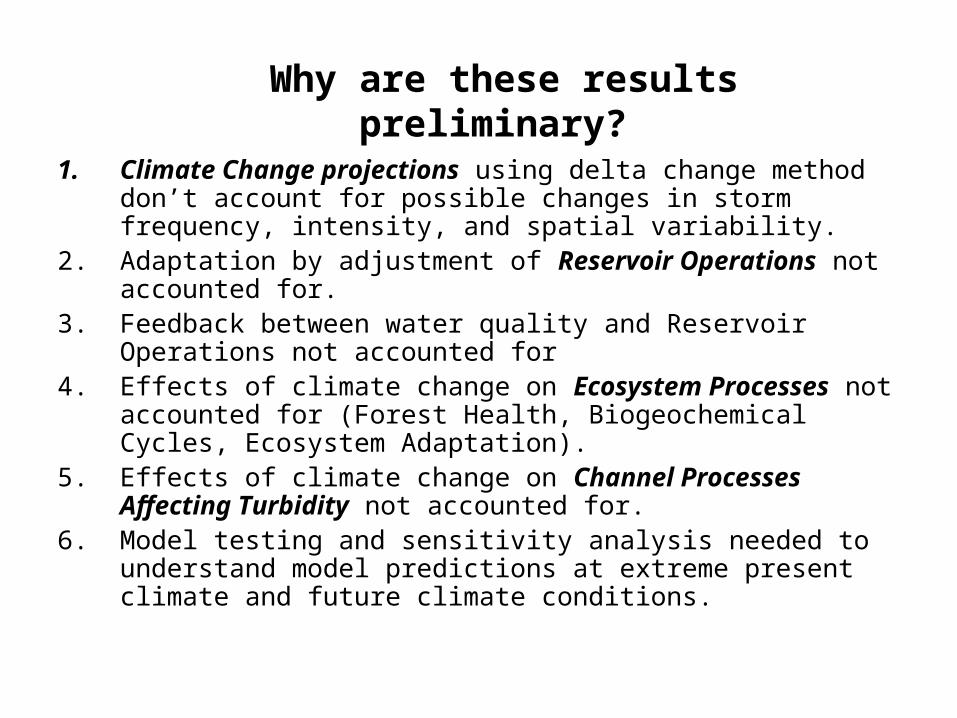
Why are these results preliminary?
1. Climate Change projections using delta change method don’t account for possible changes in storm frequency, intensity, and spatial variability.
2. Adaptation by adjustment of Reservoir Operations not accounted for.
3. Feedback between water quality and Reservoir Operations not accounted for
4. Effects of climate change on Ecosystem Processes not accounted for (Forest Health, Biogeochemical Cycles, Ecosystem Adaptation).
5. Effects of climate change on Channel Processes Affecting Turbidity not accounted for.
6. Model testing and sensitivity analysis needed to understand model predictions at extreme present climate and future climate conditions.

Summary• DEP’s Models were used with simple climate
scenarios (delta change) to obtain preliminary indication of the effects of climate change on water supply quantity and quality
• Initial results suggest– Reduced snowpack and spring melt– Greater fall and winter flows– Turbidity and nutrient loads follow flow pattern– Enhanced fall phytoplankton bloom
• Preliminary nature of these results are being addressed as the project progress.

EXTRA

Air
Tem
per
atu
re
Pre
cip
itat
ion
Sn
ow
Sn
ow
pac
k
PE
T
ET
So
il W
ater
Bas
eflo
w
Ru
no
ff
Str
eam
flo
w
-100
-75
-25
0
+25
+50
+75
+100
-50
GWLF Watershed Model ResultsSum of All WOH Watersheds
Annual Percent Change in Water Balance Components
65 Yr Forward 100 Yr Forward
Air
Tem
per
atu
re
Pre
cip
itat
ion
Sn
ow
Sn
ow
pac
k
PE
T
ET
So
il W
ater
Bas
eflo
w
Ru
no
ff
Str
eam
flo
w
-100
-75
-25
0
+25
+50
+75
+100
-50