Potential access to primary health care: what do the data ... · Ricardo Alexandre Arcêncio 2...
28
Rev. Latino-Am. Enfermagem 2016;24: e2672 DOI:10.1590/1518-8345.1069.2672 www.eerp.usp.br/rlae Original Article Uchôa SAC, Arcêncio RA, Fronteira ISE, Coêlho AA, Martiniano CS, Brandão ICA, et al. Potential access to primary health care: what does the National Program for Access and Quality Improvement data show?. Rev. Latino-Am. Enfermagem. 2016;24:e2672. [Access ___ __ ____]; Available in: ____________________. DOI: http://dx.doi. org/10.1590/1518-8345.1069.2672. Potential access to primary health care: what do the data from the National Program for Access and Quality Improvement show? Severina Alice da Costa Uchôa 1 Ricardo Alexandre Arcêncio 2 Inês Fronteira 3 Ardigleusa Alves Coêlho 4 Claudia Santos Martiniano 4 Isabel Cristina Araújo Brandão 5 Mellina Yamamura 6 Renata Melo Maroto 7 Anny Karine Freire da Silva 8 Objective: to analyze the influence of contextual indicators on the performance of cities regarding potential access to primary health care in Brazil and to discuss the contribution from nurses working on this access. Method: a multicenter descriptive study using secondary data from External Evaluation of the National Program for Access and Quality Improvement in Primary Care, with the participation of 17,202 primary care teams. The chi-square test of proportions was used to verify differences between the cities stratified in the dimensions on size of the coverage group, supply, coordination and integration. When necessary, the chi-square test with Yates correction or Fisher’s exact test were employed. For the population variable, the Kruskal-Wallis test was used. Results: the majority of participants were nurses (n = 15,876; 92.3%). Statistically significant differences were observed between the cities in terms of territory (p=0.0000), availability (p=0.0000), coordination of care (p=0.0000), integration (p=0.0000) and supply (p=0.0000), verifying that the cities that make up group 6 tend to perform better in these dimensions, with a better performance in all dimensions analyzed in groups 4, 5 and 6. Conclusion: weakness in smaller cities, confirming inequities in the potential access to Primary Health Care in Brazil as challenges for universal coverage. The preponderant role of nurses for its achievement is highlighted. Descriptors: Health Services Accessibility; Primary Health Care; Universal Coverage. 1 Post-doctoral fellow, Instituto de Higiene e Medicina Tropical, Universidade Nova de Lisboa, Lisboa, Portugal. Associate Professor, Departamento de Saúde Coletiva, Universidade Federal do Rio Grande do Norte, Natal, RN, Brazil. Scholarship holder from Conselho Nacional de Desenvolvimento Científico e Tecnológico (CNPq), Brazil. 2 PhD, Professor, Escola de Enfermagem de Ribeirão Preto, Universidade de São Paulo, PAHO/WHO Collaborating Centre for Nursing Research Development, Ribeirão Preto, SP, Brazil. 3 PhD, Assistant Professor, Instituto de Higiene e Medicina Tropical, Universidade Nova de Lisboa, Lisboa, Portugal. 4 PhD, Professor, Departamento de Enfermagem, Universidade Estadual da Paraíba, Campina Grande, PB, Brazil. 5 MSc, Professor, Departamento de Enfermagem, Centro Universitário FACEX, Natal, RN, Brazil. 6 Doctoral student, Escola de Enfermagem de Ribeirão Preto, Universidade de São Paulo, PAHO/WHO Collaborating Centre for Nursing Research Development, Ribeirão Preto, SP, Brazil. Assistant Professor, Escola de Enfermagem, Universidade Federal do Rio Grande do Norte, Natal, RN, Brazil. Scholarship holder from Fundação de Amparo à Pesquisa do Estado de São Paulo (FAPESP), Brazil. 7 Doctoral student, Departamento de Odontologia, Universidade Federal do Rio Grande do Norte, Natal, RN, Brazil. 8 Specialist in Reading and Text Production.
Transcript of Potential access to primary health care: what do the data ... · Ricardo Alexandre Arcêncio 2...

Rev. Latino-Am. Enfermagem2016;24: e2672DOI:10.1590/1518-8345.1069.2672
www.eerp.usp.br/rlae
Original Article
Uchôa SAC, Arcêncio RA, Fronteira ISE, Coêlho AA, Martiniano CS, Brandão ICA, et al. Potential access to primary
health care: what does the National Program for Access and Quality Improvement data show?. Rev. Latino-Am.
Enfermagem. 2016;24:e2672. [Access ___ __ ____]; Available in: ____________________. DOI: http://dx.doi.
org/10.1590/1518-8345.1069.2672.
Potential access to primary health care: what do the data from the
National Program for Access and Quality Improvement show?Severina Alice da Costa Uchôa1
Ricardo Alexandre Arcêncio2
Inês Fronteira3
Ardigleusa Alves Coêlho4
Claudia Santos Martiniano4
Isabel Cristina Araújo Brandão5
Mellina Yamamura6
Renata Melo Maroto7
Anny Karine Freire da Silva8
Objective: to analyze the influence of contextual indicators on the performance of cities regarding
potential access to primary health care in Brazil and to discuss the contribution from nurses
working on this access. Method: a multicenter descriptive study using secondary data from
External Evaluation of the National Program for Access and Quality Improvement in Primary
Care, with the participation of 17,202 primary care teams. The chi-square test of proportions
was used to verify differences between the cities stratified in the dimensions on size of the
coverage group, supply, coordination and integration. When necessary, the chi-square test
with Yates correction or Fisher’s exact test were employed. For the population variable, the
Kruskal-Wallis test was used. Results: the majority of participants were nurses (n = 15,876;
92.3%). Statistically significant differences were observed between the cities in terms of territory
(p=0.0000), availability (p=0.0000), coordination of care (p=0.0000), integration (p=0.0000)
and supply (p=0.0000), verifying that the cities that make up group 6 tend to perform better in
these dimensions, with a better performance in all dimensions analyzed in groups 4, 5 and 6.
Conclusion: weakness in smaller cities, confirming inequities in the potential access to Primary
Health Care in Brazil as challenges for universal coverage. The preponderant role of nurses for
its achievement is highlighted.
Descriptors: Health Services Accessibility; Primary Health Care; Universal Coverage.
1 Post-doctoral fellow, Instituto de Higiene e Medicina Tropical, Universidade Nova de Lisboa, Lisboa, Portugal. Associate Professor,
Departamento de Saúde Coletiva, Universidade Federal do Rio Grande do Norte, Natal, RN, Brazil. Scholarship holder from Conselho Nacional
de Desenvolvimento Científico e Tecnológico (CNPq), Brazil.2 PhD, Professor, Escola de Enfermagem de Ribeirão Preto, Universidade de São Paulo, PAHO/WHO Collaborating Centre for Nursing Research
Development, Ribeirão Preto, SP, Brazil.3 PhD, Assistant Professor, Instituto de Higiene e Medicina Tropical, Universidade Nova de Lisboa, Lisboa, Portugal.4 PhD, Professor, Departamento de Enfermagem, Universidade Estadual da Paraíba, Campina Grande, PB, Brazil.5 MSc, Professor, Departamento de Enfermagem, Centro Universitário FACEX, Natal, RN, Brazil.6 Doctoral student, Escola de Enfermagem de Ribeirão Preto, Universidade de São Paulo, PAHO/WHO Collaborating Centre for Nursing Research
Development, Ribeirão Preto, SP, Brazil. Assistant Professor, Escola de Enfermagem, Universidade Federal do Rio Grande do Norte, Natal, RN,
Brazil. Scholarship holder from Fundação de Amparo à Pesquisa do Estado de São Paulo (FAPESP), Brazil.7 Doctoral student, Departamento de Odontologia, Universidade Federal do Rio Grande do Norte, Natal, RN, Brazil.8 Specialist in Reading and Text Production.

www.eerp.usp.br/rlae
2 Rev. Latino-Am. Enfermagem 2016;24: e2672
Introduction
In 2005, members of the World Health Organization
(WHO) committed to achieve the universal health
coverage target provided by the Millennium Development
Goals and post-2015 agenda, aiming to improve the
health and welfare of the population. Universal coverage
is defined as access to and appropriate use of the services
according to the understanding of the health system
functions; health workers who are available, motivated
and qualified; access to essential medicines and health
products; integrated, quality, patient-centered services;
health promotion and disease control; accurate
information system for adequate decision-making; and
financing with protection against financial risks(1).
There is a growing movement in this direction
among the 25 richest nations and those in development,
such as Brazil, Mexico and Thailand, and even in those
of low-income, as Ghana, Philippines, Rwanda and
Vietnam(2).
In Brazil, the issue of universal and equitable access has been a
concern since the creation of the Unified Health System UHS (SUS) in
1988. This idea is reinforced by the National Policy of Primary Care -
BANP (PNAB), in which the potential for access to comprehensive
care management through multidisciplinary, interdisciplinary team
work is emphasized(3).
However, access has been strongly marked by
social inequalities, with disadvantaged populations
in vulnerable situations with an impact on the health
status of these groups, causing more iatrogenic
situations, poorer quality services and continued, more
severe suffering with some health conditions, including
preventable and premature deaths. Thus, new forms
of system organization, with real universal coverage
has been envisioned to achieve equity and integrality
of actions(4). Another challenge is shortage in the
distribution, composition and competence of human
resources, especially physicians, nurses and midwives(5).
In response to the most critical component, physicians,
incentive programs were adopted to supply and qualify
these professional, through the Enhancement Program
of Primary Care, and by importing foreign physicians
with the More Medical Doctors Program(6).
A significant advance towards the access to health
care services with quality and better working conditions
occurred with the implementation of the first cycle of the
National Program for Access and Quality Improvement
in Primary Care (PMAQ-AB)(7). The program is organized
in four phases: voluntary participation of municipal
managers; contracting by each Primary Care Team (PCT)
of performance indicators for monitoring; development
of self-assessment, institutional support and continuing
education; external evaluation and re-contracting,
starting a new quality cycle. In the external evaluation,
seven Higher Educational Institutions (IES) investigated
throughout the country, in loco, the structure of the Basic
Health Units (BHU) (census) and the working process of
the contracted Primary Care Teams (PCT).
The complexity of the universal coverage paradigm
has elicited theoretical studies in recent years(8) on
principles and repercussions in the Brazilian scenario,
and some empirical studies about APS(9); use of
services(10); medications(11) and educational practices(12).
Despite the contributions on the subject, national
studies that evaluate the relationship between contexts
and the centrality of professionals in the work teams,
focusing on access and equity, remain scarce. The aim
of this article is, to analyze the influence of contextual
indicators on the performance of municipalities, with
regard to potential access to APS in Brazil, based on
external evaluation of the PMAQ-AB and to discuss the
contribution of the work of nursing.
Study design
This was a cross-sectional cohort study, using
national data from the Bank of Evaluators of the External
PMAQ.
Research scenario
In 2012, SUS had 36,361 Basic Health Units (BHU)
and 33,404 Family Health Teams (FHT) with coverage in
5,297 municipalities. The adherence to PMAQ occurred
with 17,202 Primary Care Teams (PCT). Among these,
16,566 FHT and 636 non- FHT were distributed in 3,944
(70.8%) of the total municipalities, in 14,111 Basic
Health Units (BHUs)(7).
Population and sample
The study population included professionals linked
to the primary care team and qualified in PMAQ(7),
namely physicians, nurses, and dentists. In each team,
only one sampling unit was selected for the study.
Measurement instruments and data sources
The questionnaires with closed-ended questions
were provided in tablets, administered by interviewers
who had the same training, under supervision. Next,
they were sent online to the Ministry of Health
system, accessed and validated by the IES, based
on a consistency analysis protocol and validation of
the data collected through the soft Validator’s online,
PMAQ-AB. The characteristics of respondents and
four (4) dimensions of the Module II questionnaire
- Interview with professional of Primary Care Team
and Document Checking of the Health Unit External

www.eerp.usp.br/rlae
3Uchôa SAC, Arcêncio RA, Fronteira ISE, Coêlho AA, Martiniano CS, Brandão ICA, et al.
Evaluation of the first cycle of the PMAQ-AB, were
included here for data analysis(7). The dimensions that
were representative of the potential levels of access
according to the authors’ judgment were chosen and
are described in the analysis plan.
Classification of municipalities according to the context variables
The municipalities listed in the study are
classified into six strata, considering the per capita
Gross Domestic Product (GDP), the percentage of
the population with health insurance, the percentage
of the population on the Bolsa Família (Family Grant)
program, the percentage of the population in extreme
poverty, and the population density.
The composition of the extracts considered for
each municipality were: the lowest score among the
percentage of the population with Bolsa Família program,
and the percentage of the population in extreme
poverty: area 1 - Municipalities with scores lower than
4.82 and a population of up to 10,000 inhabitants;
area 2 - Municipalities with scores lower than 4.82 and
a population of up to 20 thousand inhabitants; area
3 - municipalities with scores lower than 4.82 and a
population of up to 50 thousand inhabitants; area 4 -
Municipalities with scores between 4.82 and 5.4, and
population of up to 100 thousand inhabitants; area
5 - Municipalities with scores between 5.4 and 5.85,
and population of up to 500 thousand inhabitants;
and municipalities with a score lower than 5.4, and
population between 100 and 500 thousand inhabitants;
and area 6 - Municipalities with population over 500,000
inhabitants, or a score less than 5.85(7).
Variables under consideration to evaluate potential
access:
The variables considered for evaluating potential
access are described in Table 2. The table shows the
dimension, characteristic and nature of the variables
that are included.
Plan of analysis
Initially, the descriptive analysis of the
characteristics area of the municipalities’, professional
category, and median number of professionals per team
was calculated.
Regarding the performance of municipalities in
terms of access, four dimensions of the PMAQ instrument
were measured: coverage area, supplies, customer
coordination, and integration.
The variables were dichotomized into yes and no.
Thereafter, the sum of the responses for each item was
calculated, dividing this number by the total sample. To
verify differences between the municipalities in relation
to the size of potential access, the chi-square test of
proportions was used. The chi-square test with Yates
or Fisher’s exact test correction was applied when
necessary. For the population variable, the Kruskal-
Wallis test was used to verify differences in relation to
the median inhabitants monitored by areas.
After the analysis of the performance of the
municipalities within the areas, in relation to access,
multivariate statistics by multiple correspondence
analyses (MCA) was used, given that the instrument
variables were categorical.
The MCA implementation was based on the steps
of Spencer(13) and Mingoti(14), in which the tabulation of
responses generated a matrix, with rows corresponding
to the participating health professionals, and the columns
corresponding to the variables. Subsequently, the
matrix turned into a complete disjunctive table (CDT).
In the table, the columns represent characteristics of
the variables, in which the intersection of Row I with
Column J is the xij, which is 0 or 1, indicating that the
area either has or does not have the characteristic.
The perceptual map was formed by this technique,
which is a visual representation of the variables in
two or more dimensions. Each variable has a spatial
position in the perceptual map, variables perceived as
similar or associated are allocated to proximal points
on the map, while those not perceived as similar are
represented as distal points. The proximity indicates the
correspondence between the categories represented in
rows and columns of the table.
The component row or column influences the
construction of the axes through its inertia, in relation
to the center of gravity. The inertia means the variance
of the data set (13). From the MCA it was possible to
extract the most representative dimensions in terms of
inertia, which in the study corresponded to the first two.
Its contribution to inertia was considered a criterion for
selection of the variables.
Results
Table 1 shows characteristics of the sample of
17,202 teams recruited for the study, according to the
PMAQ area. The majority of participants were nurses (n
=;%), and many of them had less than three years of
experience after completing their education.
Among the models of care, in all areas, there was
a predominance of the Family Health Strategy (FHS)
without oral health. In general, there is a median of one
(1) physician, nurse, nursing technicians, and dentist per
team. All modalities of care investigated showed that
most of the teams did not provide the patient with the

www.eerp.usp.br/rlae
4 Rev. Latino-Am. Enfermagem 2016;24: e2672
opportunity to choose a desired unit for treatment and
follow up.
In Table 2, the performance of municipalities in
terms of patient access is verified, considering the area
established in PMAQ.
Statistically significant differences were identified
between the municipalities of area 1, 2 and 3 with area
4, 5 and 6, and the professionals of the last areas had
more qualifications (p=0.0000).
Regarding the career plan, no statistically
significant difference (p = 0.0000) was observed,
and the municipalities of area 4, 5 and 6 had better
indicators; lowest values were found in areas 1, 2
and 3. Also, these areas showed statistically significant
differences associated with their training policy and
continuing education (p=0.0000).
According to Table 2, statistically significant differences
in t erms of population coverage were observed, in which
area 5 and 6 monitored a median number of people
with access well above that of areas 1, 2 and 3. Also,
statistically significant differences were present between
the municipalities in terms of coverage area (p=0.0000),
availability (p=0.0000), coordination of care (p=0.0000),
integration (p=0.0000) and supply (p=0.0000), verifying
that the municipalities that form area 6 tend to have
better performance in these dimensions.
Table1 - Characteristics of study sample, PMAQ Project, Brazil (2012)
VariablesPMAQ Areas
1 2 3 4 5 6
Professional category n ( %)
Physician 72 (0.42) 59 (0.34) 52 (0.30) 91 (0.53) 143 (0.83) 576 (3.35)
Nurse 2.058 (11.96)
2.179 (12.67) 2.425 (14.10) 3.119 (18.
13) 2.615 (15.20) 3.480 (20.23)
Dentist 35 (0.20) 35 (0.20) 50 (0.29) 56 (0.33) 56 (0.33) 101 (0.59)
Years of work/experience n (%)
Less than 1 year 546 (3.17) 693 (4.03) 801 (4.66) 995 (5.78) 830 (4.83) 875 (5.09)
Between 1-3 years 867 (5.04) 966 (5.62) 1.068 (6.21) 1.384 (8.05) 1.133 (6.59) 1.598 (9.29)
Greater than three years 743 (4.32) 608 (3.53) 652 (3.79) 881 (5.12) 843 (4.90) 1.673 (9.73)
Don´t know/ no response 9 (0.05) 6 (0.03) 6 (0.03) 6 (0.03) 8 (0.05) 11 (0.06)
Type of team n (%)
Family Health Teams with oral health 1.832 (10.66)
1.798 (10.45) 2.041 (11.86) 2.464
(14.32) 1.767 (10.27) 2.173 (12.63)
Family Health Teams without oral health 261 (1.52) 398 (2.31) 423 (2.46) 720 (4.19) 942 (5.48) 1.824 (10.60)
Primary care team with oral health 59 (0.34) 57 (0.33) 45 (0.26) 59 (0.34) 57 (0.33) 51 (0.30
Primary care teams without oral health 7 (0.04) 9 (0.05) 11 (0.06) 15 (0.09) 43 (0.25) 39 (0.23)
Others 4 (0.02) 6 (0.03) 4 (0.02) 7 (0.04) 3 (0.02) 66 (0.38)
Do not Know/No response 2 (0.01) 5 (0.03) 3 (0.02) 1 (0.01) 2 (0.01) 4 (0.02)
Minimum number of physicians in the primary care staff of BHU (n= 16643)
Median 1 1 1 1 1 1
Minimum and Maximum value 0.00 – 4.00 0.00 – 4.00 0.00 – 4.00 0.00 – 11.00 0.00 – 11.00 0.00 – 6.00
Minimum number of nurses in the primary care staff (n=16643)
Median 1 1 1 1 1 1
Minimum and maximum value 0.00 – 4.00 0.00 – 4.00 0.00 – 4.00 0.00 – 4.00 0.00 – 4.00 0.00 – 4.00
Minimum number of dentists in the primary care staff (n=16643)
Median 1 1 1 1 1 1
Minimum and maximum value 0.00 – 6.00 0.00 – 4.00 0.00 – 3.00 0.00 – 6.00 0.00 – 6.00 0.00 – 4.00
Minimum number of nursing technicians in the primary care staff (n=16643)
Median 1 1 1 1 1 1
Minimum and maximum value 0.00 – 13.00 0.00 – 10.00 0.00 – 10.00 0.00 – 8.00 0.00 – 20.00 0.00 – 11.00
Minimum number of nursing assistants in the primary care staff (n=16643)
Median 0 0 0 0 0 1
Minimum and maximum value 0.00 – 9.00 0.00 – 8.00 0.00 – 8.00 0.00 – 8.00 0.00 – 6.00 0.00 – 20.00
Minimum number of dental technicians in the primary care staff (n=16643)
Median 0 0 0 0 0 0
Minimum and maximum value 0.00 – 8.00 0.00 – 8.00 0.00 – 8.00 0.00 – 2.00 0.00 – 3.00 0.00 – 8.00
Minimum number of dental assistants in the primary care staff (n=16643)
Median 1 1 1 1 1 0
Minimum and maximum value 0.00 – 6.00 0.00 – 7.00 0.00 – 8.00 0.00 – 9.00 0.00 – 8.00 0.00 – 10.00
(continúa...)

www.eerp.usp.br/rlae
5Uchôa SAC, Arcêncio RA, Fronteira ISE, Coêlho AA, Martiniano CS, Brandão ICA, et al.
VariablesPMAQ Areas
1 2 3 4 5 6
Minimum number of community health workers in the primary care staff (n=16643)
Median 6 6 7 6 6 5
Minimum and maximum value 0.00 – 19.00 0.00 – 50.00 0.00 – 42.00 0.00 – 50.00 0.00 – 56.00 0.00 – 32.00
Allowing the patient to choose team by which he wants to be treated n (%)
Yes 219 (1.27) 191 (1.11) 180 (1.05) 161 (0.94) 127 (0.74) 303 (1.76)
No 286 (1.66) 309 (1.80) 303 (1.76) 411 (2.39) 442 (2.57) 1.059 (6.16)
Not applicable 454 (2.64) 539 (3.13) 516 (3.00) 671 (3.90) 355 (2.06) 196 (1.14)
Don´t know/No response 1.206 (7.01) 1.234 (7.17) 1.528 (8.88) 2.023(11.76) 1.890 (10.99) 2.599 (15.11)
Table 2 - Performance of municipalities on patient access according to the areas, Brazil, 2012
Dimension VariablesPMAQ areas
1 2 3 4 5 6p value
n (%) n (%) n (%) n (%) n (%) n (%)
Personal qualification
Complementary education (n=17.202)
Yes 1.708 (9.93) 1.795 (10.43) 2.050 (11.92) 2.694 (15.66) 2.460 (14.30) 3.642 (21.17)0.000*
No 457 (2.66) 478 (2.78) 477 (2.77) 572 (3.33) 354 (2.06) 515 (2.99)
Career development programs (n=16.936)
Yes 253 (1.49) 159 (0.94) 246 (1.46) 574 (3.39) 581 (3.43) 1.810 (10.69)0.000*
No 1.877 (11.08) 2.069 (12.22) 2.245 (13.26) 2.647 (15.63) 2.194 (12.95) 2.279 (13.46)
There are continuing education activities involving primary care professionals (n=17.113)
Yes 1.432 (8.37) 1.596 (9.33) 1.878 (10.97) 2.601 (15.20) 2.481 (14.50) 3.969 (23.19)0.000*
No 720 (4.21) 658 (3.85) 630 (3.68) 650 (3.80) 325 (1.90) 173 (1.01)
Coverage area
How many people for whom the team is responsible
Mean 2165 2273 2527 3266 2814 4157 0.0001†
Risk and vulnerability criteria were considered for defining people for whom the team is responsible (n=15.691)
Yes 1.024 (6.53) 1.141 (7.27) 1.323 (8.43) 1.705 (10.87) 1.423 (9.07) 2.648 (16.88)0.000*
No 951 (6.06) 877 (5.59) 937 (5.97) 1.265 (8.06) 1.115 (7.11) 1.282 (8.17)
There is definition of team coverage area (n=17.150)
Yes 2.086 (12.16) 2.197 (12.81) 2.456 (14.32) 3.190 (18.60) 2.763 (16.11) 4.113 (23.98)0.000*
No 68 (0.40) 60 (0.35) 63 (0.37) 71 (0.41) 43 (0.25) 40 (0.23)
There is a population uncovered by primary care surrounding the team’s coverage area (n=17.092)
Yes 369 (2.16) 534 (3.12) 888 (5.20) 1.083 (6.34) 1.391 (8.14) 1.513 (8.85)0.000*
No 1.783 (10.43) 1.724 (10.09) 1.618 (9.47) 2.170 (12.70) 1.406 (8.23) 2.613 (15.29)
How often people from outside the team’s coverage area are served by this team (n=16.855)
Every day of the week 900 (5.34) 828 (4.91) 1.001 (5.94) 1.247 (7.40) 1.255 (7.45) 2.152(12.77)
0.000*Some days of the week 966 (5.73) 1.135 (6.73) 1.201 (7.13) 1.502 (8.91) 1.222 (7.25) 1.673 (9.93)
Any day of the week 248 (1.47) 243 (1.44) 266 (1.58) 451 (2.68) 287 (1.70) 178 (1.65)
Availability
Patients who spontaneously arrive and have their needs heard and assessed (n=17.140)
Yes 2.121 (12.37) 2.202 (12.85) 2.442 (14.25) 3.180 (18.55) 2.689 (15.69) 4.078 (23.79) 0.000*
No 38 (0.22) 59 (0.34) 80 (0.47) 83 (0.48) 108 (0.63) 60 (0.35)
The team performs risk and vulnerability assessment in the intake of patients (n=13.739)
Yes 1.265 (9.21) 1.385 (10.08) 1.645 (11.97) 2.286 (16.64) 2.050 (14.92) 3.442 (25.05) 0.0066*
No 192 (1.40) 221 (1.61) 248 (1.81) 324 (2.36) 236 (1.72) 445 (3.24)
The schedule is organized to conduct home visitation (n=13.951)
Yes 1.418 (10.16) 1.628 (11.67) 1.865 (13.37) 2.391 (17.14) 2.253 (16.15) 3.697 (26.50) 0.000*
No 134 (0.96) 115 (0.82) 114 (0.82) 149 (1.07) 104 (0.75) 83 (0.590)
(continúa...)
Tabla 1 - continuación

www.eerp.usp.br/rlae
6 Rev. Latino-Am. Enfermagem 2016;24: e2672
Dimension VariablesPMAQ areas
1 2 3 4 5 6p value
n (%) n (%) n (%) n (%) n (%) n (%)
Coordination of care
Keep a record of high risk patients referred to other points of care (n=17.104)
Yes 826 b(4.83) 818 (4.78) 1.104 (6.45) 1.474 (8.62) 1.353 (7.91) 2.385 (13.94) 0.000*
No 1.310 (7.66) 1.439 (8.41) 1.405 (8.21) 1.785 (10.44) 1.449 (8.47) 1.756 (10.27)
There is a document proving (n=
Yes 605 (7.60) 638 (8.02) 913 (11.47) 1.206 (15.15) 1.132 (14.22) 1.978 (24.85) 0.000*
No 221 (2.78) 180 (2.26) 191 (2.40) 268 (3.37) 221 (2.78) 407 (5.11)
There are protocols that guide the prioritization of cases needing referral (n=17.037)
Yes 581 (3.41) 613 (3.60) 807 (4.74) 1.213 (7.12) 1.228 (7.21) 2.907 (17.06) 0.000†
No 1.558 (9.14) 1.636 (9.60) 1.685 (9.89) 2.036 (11.95) 1.567 (9.20) 1.206 (7.08)
Integration
There is a regulation center (n=17.201)
Yes 1.880 (10.93) 2.006 (11.66) 2.239 (13.02) 2.907 (16.90) 2.540 (14.77) 4.027 (23.41) 0.000*
No 284 (1.65) 267 (1.55) 288 (1.67) 359 (2.09) 274 (1.59) 130 (0.76)
There is a referral form for patients moving to other points of care (n=17.201)
Yes 1.752 (10.19) 1.828 (10.63) 2.138 (12.43) 2.970 (17.27) 2.615 (15.20) 4.055 (23.57) 0.0000*
No 412 (2.40) 445 (2.59) 389 (2.26) 296 (1.72) 199 (1.16) 102 (0.59)
Supply
Receive enough basic medicines from pharmacy to serve its population (n=17.161)
Yes 1.459 (8.50) 1.490 (8.68) 1.722 (10.03) 2.210 (12.88) 1.830 (10.66) 2.898 (16.89) 0.0000*
No 378 (2.20) 457 (2.66) 614 (3.58) 644 (3.75) 718 (4.18) 2.077 (6.28)
Do not receive 316 (1.84) 320 (1.86) 187 (1.09) 406 (2.37) 263 (1.53) 172 (1.00)
Offers service of complementary and integrative practices for patients of the area (n=17.199)
Yes 235 (1.37) 230 (1.34) 305 (1.77) 381 (2.22) 512 (2.98) 1.546 (8.99) 0.0000*
No 1.929 (11.22) 2.042 (11.87) 2.222 (12.92) 2.885 (16.77) 2.301 (13.38) 2.611 (15.18)
Conducts home visits (n=17.199)
Yes 2.146 (12.48) 2.262 (13.15) 2.521 (14.66) 3.253 (18.91) 2.802 (16.29) 4.148 (24.12) 0.0075*
No 18 (0.10) 10 (0.06) 6 (0.03) 13 (0.08) 11 (0.06) 9 (0.05)
The families in the coverage area are visited at intervals according to risk and vulnerability assessment? (n=17.132)
Yes 1.963 (11.46) 2.069 (12.08) 2.345 (13.69) 2.997 (15.30) 2.621 (15.30) 3.986 (23.27) 0.0000*
No 183 (1,07) 193 (1,13) 176 (1,03) 256 (1,49) 181 (1,06) 162 (0,95)
* p value statistically significant (p<0.05)
† Kruskal-Wallis test
Tabla 1 - continuación
When compared by professional category (Table 3),
a statistically significant difference is again identified, in
which a higher proportion of both physicians as well as
dentists tend to refer to more positive aspects of their
units than nurses.
The proportion of nurses who tends to identify
weaknesses in relation to the organization of services is
much greater than other professionals.
In complementary education, for example, whereas
there is one “No” for each 4 “Yes” assigned by physicians
in this item, and almost one “No” for each three “Yes”
assigned by dentists, among nurses this proportion
was almost five, which was statistically significant (p =
0.0046). Career development programs was also another
point on which this difference was very significant (p
= 0.0000), where again, the proportion of nurses who
reported the absence of or lack of participation in was
much higher than other categories.
When a comparative analysis of the APS related
to the models of care was conducted, the FHT with or
without oral health predominated. Statistically significant
differences were identified in career development
program variables, where the proportion of professionals
linked to the FHT, which has career development
programs, was much smaller than the professionals
integrated in other models of care (p=0.0000). Similarly,
a statistically significant association regarding continuing
education activities (p=0.0000) was observed, records
of the documentation of cases referred for other services
(p=0.0462), protocols to guide professionals for referrals
to other services (p=0.0000) and use of complementary
practices (p=0.0000). A significant difference was
observed in the home visits, where the FHT presented
a higher proportion of visits compared to the other two
forms of attention (p=0.0000).

www.eerp.usp.br/rlae
7Uchôa SAC, Arcêncio RA, Fronteira ISE, Coêlho AA, Martiniano CS, Brandão ICA, et al.
Table 3 - Performance of primary care for patient access to the health system according professional category, Brazil, 2012
Variables
Professional Category
P valuePhysician Nurse Dentist
Yes % No % Yes % No % Yes % No %
Complementary education n=17202 800 4.6 193 1.1 13285 77.2 2591 15.1 264 1.5 69 0.4 0.0046*
Career development programs n=17113 303 1.8 670 4.0 3224 19.0 12412 73.3 98 0.6 229 1.4 0.0000*
Continuing education activities n=17113 853 5.0 132 0.8 12850 75.1 2951 17.2 254 1.5 73 0.4 0.0000*
All patients have their needs heard and assessed n=17047 956 5.6 25 0.15 15362 90.1 380 2.2 309 1.8 15 0.1 0.0384*
The team performs risk assessment during the intake n=13730 777 5.6 95 0.7 11066 80.6 1538 11.2 223 1.6 31 0.2 0.5189
Schedule is organized for home visitation n=11473 743 6.5 27 0.2 10013 87.3 480 4.2 201 1.8 9 0.1 0.3815
High risk patients are registered when referred n=13658 488 3.6 378 2.8 6261 45.9 6284 46.0 136 1.0 111 0.8 0.0004*
Form to register the patient referral n= 6885 377 5.5 111 1.6 5159 75.0 1102 16.0 107 1.6 29 0.4 0.0105*
Protocols that guide the prioritization of cases for referral n=13606 533 3.9 329 2.4 5797 42.6 6704 49.3 129 1.0 114 0.8 0.0000*
Regulation center for referral n=17047 905 5.3 76 0.4 14274 83.7 1468 8.6 292 1.7 32 0.2 0.2347
Forms for referral of patients n=17047 915 5.4 66 0.4 14029 82.3 1713 10.1 294 1.7 30 0.2 0.0001*
Sufficient medicines in primary care to meet population needs n=17015 606 3.6 373 2.1 10721 63.0 4992 30 205 1.2 118 0.7 0.0000*
Offering integrative and complementary practices n=17045 273 1.6 707 4.2 2865 16.8 12877 75.6 46 0.3 277 1.6 0.0000*
The team performs home visitation n=17045 977 5.7 4 0.02 15690 92.1 52 0.31 320 1.9 3 0.02 0.1846
The families of coverage area are frequently visited 927 5.5 50 0.3 14636 86.2 1054 6.2 289 1.7 31 0.2 0.0142*
* p <0,05
Table 4 - Performance of primary care for access to the patient according to the model of care, Brazil, 2012
Activities
Model of care
P valueFHT (with or without oral health) Team AB Other model
Yes % No % yes % No % Yes % No %
Complementary education - V23 n= 17185 13883 80.8 2760 16.1 383 2.2 69 0.4 75 0.4 15 0.1 0.3059
Career development programs n=16923 v24 3516 21.0 12876 76.1 99 0.6 344 2.0 7 0.1 81 0.5 0.0000*
Continuing education activities = 17100 v25 13487 78.9 3074 18.0 283 2.2 66 0.4 80 0.5 10 0.1 0.0000*
All patients have their needs heard and assessed n=16987 v31 16055 94.6 397 2.3 422 2.5 15 0.1 85 0.5 3 0.0 0.1754
The team performs risk assessment during the intake n= 13723 v32 11710 85.3 1626 11.8 283 2.1 33 0.2 66 0.5 5 0.1 0.3987
Schedule is organized for home visitation n= 11473 v33 10678 93.1 486 4.2 236 2.1 22 1.32 43 0.4 8 0.1 0.3815
High risk patients are registered when referred n= 13658 v34 6685 50.0 6588 48.2 167 1.2 147 1.1 33 0.2 38 0.3 0.1323
Form to register the patient referral n= 6885 v35 5483 79.6 1202 17.5 136 2.0 31 0.5 24 0.4 9 0.1 0.0462*
Protocols that guide the prioritization of cases for referral n= 13606 v36 6289 46.2 6930 51.0 145 1.1 171 1.3 25 0.2 46 0.3 0.0000*
Regulation center for referral n= 17047 v37 12232 90.0 997 7.3 283 2.1 24 0.18 67 0.5 3 0.1 0.6982
Forms for referral of patients n= 17047 14782 86.7 1728 10.1 370 2.2 77 0.5 86 0.5 4 0.1 0.0000
V39 Has / receives medicines n= 17045 11146 59.5 5333 31.3 316 1.9 130 0.8 70 0.4 20 0.1 0.0286
V40 Offering integrative/ complementary practices n= 17045 3082 18.1 13426 78.8 93 0.6 354 2.1 9 0.1 81 0.5 0.0000*
V41 Team performs home visitation n = 17045 16462 96.6 46 0.3 437 2.6 10 0.1 88 0.5 2 0.1 0.0000*
V42 Families of coverage area are frequently visited n= 16987 15363 90.4 1099 6.5 404 2.4 33 0.2 85 0.5 3 0.1 0.1092
*p< 0,05

www.eerp.usp.br/rlae
8 Rev. Latino-Am. Enfermagem 2016;24: e2672
comprise areas 5 and 6 present better indicators with
regard to the training of their health professionals; the
municipalities that are concentrated closer to the center
have regular values. Thus they had some satisfactory
indicators and others that were unsatisfactory, and
municipalities of areas 1 and 2 had less satisfactory
indicators for this item.
The Multiple Correspondence Analysis enabled
the creation of the perceptual map shown in Figure 1,
which demonstrates that the map can be divided into
quadrants; on the right side, quadrants are plotted
municipalities that showed better indicators in terms of
qualification than those on the left.
This figure demonstrate that the municipalities that
-1,5 -1,0 -0,5 0,0 0,5 1,0 1,5 2,0
Dimensão 1; Autovalor: 0,377 (18,89% de Inercia)
-2,0
-1,5
-1,0
-0,5
0,0
0,5
1,0
1,5
2,0
Dim
ensa
o 2;
Aut
oval
or: 0
,264
(13,
20%
de
Iner
cia) Estrato PMAQ:1
Estrato PMAQ:2
Estrato PMAQ:3Estrato PMAQ:4
Estrato PMAQ:5
Estrato PMAQ:6V23v:0
V23v:1V24v:0
V24v:1V25v:0
V25v:1
Note: V23 Do you have or are you taking complementary education?; V24 Do you have career development programs?; V25 Are there continuing education
activities in the municipality involving primary care professionals? Answers 1(Yes); 0 (No)
Figure 1 - Qualification for professionals working in the context of primary health care, according to the area of PMAQ,
Brazil (2012)
Dim
ensi
on 2
: eig
enva
lue:
0.2
64 (1
3.20
% in
ertia
) Are
a
Dimension 1: eigenvalue: 0.377 (18.89% inertia)
Figure 2 expresses the performance of municipalities in
terms of availability, coordination of care, integration
and supply using a perceptual map. On the right side
of the map, the municipalities that showed better
indicators are represented, and on the left side are those
with poorer indicators.
Considering this evaluation with all of these
attributes, the single area with satisfactory indicators
across all of these dimensions was area 6; the
municipalities of area 4 and 5 showed median values,
with satisfactory indicators in some of those and
unsatisfactory in others; however, the municipalities of
area 5 were better than area 4; the municipalities of
area 1, 2 and 3 did not achieve satisfactory results in
these dimensions.

www.eerp.usp.br/rlae
9Uchôa SAC, Arcêncio RA, Fronteira ISE, Coêlho AA, Martiniano CS, Brandão ICA, et al.
-02 -01 -01 00 01 01 02
Dimensão 1; Autovalor: 0,23565 (16,83%de Inércia)
Dim
ensã
o 2;
Aut
ovla
ro: 0
,132
(9,4
3% In
érci
a)
Estrato PMAQ:1
Estrato PMAQ:2
Estrato PMAQ:3
Estrato PMAQ:4
Estrato PMAQ:5
Estrato PMAQ:6
V34:0
V34:1
V35:0
V35:1
V37:0
V37:1
V36:0
V36:1
V38:0
V38:1
V39:0 V39:1
V40:0
V40:1
V41:1
V42:0
V42:1
Dim
ensi
on 2
: eig
enva
lue
0.1
32 (9
.43%
of i
nerti
a) A
rea
Dimension 1: eigenvalue 0.23565 (16.83% of inertia)
Notes: V31 Do all patients coming to the clinic seeking care without appointments are heard and have their needs assessed?; V32 Does the team perform
risk and vulnerability assessment during the intake of patients?; V33 Is the schedule organized to perform home visits?; COORDINATION OF CARE: V34
Does the staff keep records of the high risk patients referred to other points of care?; V35 IS there is form proving this?; V36 Are there, at the clinic,
protocols to guide the prioritization of cases needing referral?; INTEGRATION: V37 Is there a central registration available for patient referral to other points
of care? V38 Are there forms for patients referred to other points of care?; SUPPLIES: V39 Does the team have/receive enough basic medicines from the
pharmacy to meet the needs of its population?; V40 Does the team offer service of complementary and integrative practices for patients of its area?; V41
Does the team perform home visits? V42 Are families in the coverage area of the primary care team frequently visited, according to risk and vulnerability
assessments? Answers (1) Yes (0) No
Figure 2 - Performance of municipalities for access to primary care according to the area defined by PMAQ, Brazil (2012)
Discussion
The prevailing participation of nurses as respondent
in all area reveals their involvement with this level of
assistance. In this sense, they are potentially able to
cooperate with the UHC coverage by their role in all health
care levels, and their particular desire to contribute to
the achievement of the goal. The organization of nurses
in international networks has been recognized by the
PAHO/WHO, with an emphasis on achieving UHC and
access to health care for the entire population (5).
In the assessment of the contextual or
socioeconomic indicators and health, and the influence
of professional qualification and territorial process in
APS, areas 4, 5 and 6 showed better performance in all
analyzed dimensions.
The best performance of the professional
qualification in the present study, in areas 4, 5 and 6,
was also observed in a study conducted in large cities,
where more than half of physicians and nurses had
participated in some training process in the prior 30
days(15).
Although a statistically significant difference was
found between the areas with respect to career plan, all
areas showed a weak performance in this item, which
can be explained by the way in which professionals are
recruitment. A study, conducted in Minas Gerais, showed
that 75% of municipal health secretaries use temporary
contracts for provision of services by professionals with
higher education(16).
This study highlights significant findings on the
existence of continuing education actions. Continuing

www.eerp.usp.br/rlae
10 Rev. Latino-Am. Enfermagem 2016;24: e2672
professional development is important, using information
and communication technologies that facilitate the
qualification of these professionals for the job. Such
strategies also contribute to improving the problem
solving within the FHU, and promote communication
between specialists and generalists(17).
With regard to coverage areas in Brazil, currently,
the population coverage estimated by the APS teams
becomes important as an universal indicator of success
with the guidelines and goals of SUS(18). It is necessary
to note that, although the average number of persons
under the responsibility of the team is within the
recommendation of the Ministry of Health(3), this number
is considered high, if we consider that, in Brazil, the
teams are responsible for a large number of activities(19).
To enable access to the population that is not covered
by primary care, teams comply with the principle of
universality, but also tend to undergo activity overloads,
considering that more and more frequently the APS/FHT
have new responsibilities delegated to them, and face
responsibilities for diseases, priority groups, problems
or specific situations(20). A similar situation is seen in the
UK and Europe, where professionals also develop a wide
range of tasks, which include, among others: prevention
activities, acute care/curative activities, treatment
for patients with chronic conditions, and emergency
treatment. These professionals are responsible for a
roster of almost 2,250 people(21).
Regarding availability, the unscheduled demand
by patients to have their needs met and evaluated
occurred in all areas, with better performance in areas
4, 5 and 6. These findings differ from those found by
Giovanela, Fausto and Fidelis, which showed barriers to
spontaneous demand and non-priority groups. Home
visits are on the professional schedules in all areas of
the municipalities. Similarly, this activity was observed
as a routine of physicians and nurses in four large
cities(22). When comparing the models of care, there
was a predominance of home visits being conducted by
the FHT, a similar result to that found in a study with
southern and northeastern cities(10).
In the coordination of care, despite the significant
differences between the areas, all areas presented
unsatisfactory performance regarding the registration
of referrals to other points of care, featuring a referral
process without accountability and relationship with the
patient.
In the integration of care, the existence of a central
registration is present in the municipalities of the area
analyzed, predominantly in 4, 5 and 6. Similar results
were noted by physicians and nurses of the FHT that
recognized the existence of a central registration for
appointments and exams(23).
With regard to the provision of health actions
and services, there was a statistical significance in all
aspects evaluated. The availability of medicines in the
basic pharmacy to meet the population was observed in
municipalities of all areas. In some cities of the country,
this distribution is more related to priority groups(15). It
is remarkable to note the low supply of complementary
and integrative practices for patients of the area, which
may be linked to the fact that this type of care integrates
a specialized service network, such as acupuncture
offered in Porto Alegre(24).
In the work process of the APS teams, the nurse
takes on several assignments, among them: planning,
individual and collective care, management, and
systematic assessment of developed actions (PNAB.
20123), which may justify the tendency of nurses to
negatively evaluate the actions of the organization. In
the daily nursing work of the FHT units, difficulties occur,
mainly related to lack of training for implementation of
actions(25).
Regarding the contribution of nurses to universal
access, the study showed that the majority were
nurses, which shows in a way the involvement of
this category of professional with the APS. The nurse
has a more focused training for this area, with well-
aligned curricula to the SUS social policy, with content
in anthropology and sociology, health management,
leadership and community sanitation practices, making
her more sensitive to innovations in the context of the
APS, and more motivated to promote change.
One important issue is that most nurses eventually
assume leadership in the teams, strategically, and
taking the forefront of primary care as a new mode
of social production in health. The low pay of these
professionals in the private sector makes many find
the SUS to provide a chance for stability, which is
very positive in terms of securing professionals in that
category. One challenge is the establishment of a new
model that values their core competence and recognizes
their autonomy in prescribing and care. The hegemonic
model with centrality in medical practice tends to push
them out of this process.
Limitations
The study was not conducted in all the Brazilian
municipalities, and only in those in which the teams
voluntarily qualified for the PMAQ; thus, the results
should be interpreted with caution because they do
not retain the ability to be generalized. There is the
possibility of selection bias, as not all staff members
were included; only one staff member was chosen,
and this was voluntary. Additionally, the study has

www.eerp.usp.br/rlae
11Uchôa SAC, Arcêncio RA, Fronteira ISE, Coêlho AA, Martiniano CS, Brandão ICA, et al.
design limitations, as it is a cross-sectional design,
and is guided by interviews of professional. There was
no monitoring of the teams for a period of time, or
triangulation of data obtained from interviews with
others, such as observation, records or statements
of patients, which would increase the accuracy of the
findings. However, it is important to note that the PMAQ
is the first evaluation of this scope and methodological
homogeneity and, despite the limitations, the findings
contribute in the advancement of knowledge regarding
APS-enhanced access, its critic nodes and also a
situational diagnosis of which municipalities have
advanced more in terms of universal coverage systems
and those which have not.
Conclusion
The study showed that there is a relationship
between access and socioeconomic conditions: as the
area of the municipalities increases, the access to
services tends to be better. However, within a context
of social inequalities and iniquities, weaknesses are
perceived that jeopardize the organization of health
activities in the municipalities regarding the availability,
care coordination, integration, and supply, particularly
in the municipalities grouped in areas 1 to 3. Given
the involvement of the nurse with the organization of
health care, this professional has contributed to the
potential access of APS in Brazil.
References
1. Organização Pan-Americana da Saúde. Estratégia
para o acesso universal à saúde e cobertura universal
de saúde. [Internet]. Washington, D.C: OPS; 2014.
[Acesso 12 nov 2014]. Disponível em: www.paho.org/
hq/index.php?option=com_docman&task
2. Rodin J. Accelerating action towards universal health
coverage by applying a gender lens. Bull Wrld Health
Org. 2013; 91:710–711. doi:http://dx.doi.org/10.2471/
BLT.13.127027.
3. Ministério da Saúde (BR). Secretaria de Atenção
à Saúde. Departamento de Atenção Básica. Política
Nacional de Atenção Básica [Internet]. Brasília:
Ministério da Saúde; 2012. [Acesso 8 nov 2013].
110 p. (Série E. Legislação em Saúde). Disponível
em: http://dab.saude.gov.br/portaldab/biblioteca.
php?conteudo=publicacoes/pnab.
4. Victora CG, Wagstaff A, Schellenberg JA, Gwatkin D,
Claeson M, Habicht JP. Applying an equity lens to child
health and mortality: more of the same is not enough.
Lancet. 2003; 362(9379):233-41.
5. Cassiani SHDB. Estratégia para o acesso universal à
saúde e cobertura universal de saúde e a contribuição
das Redes Internacionais de Enfermagem. Rev. Latino-
Am. Enfermagem. 2014; 22(6):891-2
6. Molina J. Para não perder o trem da história!. Rev
esc enferm USP. [Internet]. 2014 [Acesso 22 maio
2015]; 48(1):8-17. Disponível em: http://www.
scielo.br/scielo.php?script=sci_arttext&pid=S0080-
62342014000100008&lng=en. http://dx.doi.
org/10.1590/S0080-623420140000100001.
7. Ministério da Saúde (BR). Portaria n. 1.654, de 19
de julho de 2011 (BR). Institui, no âmbito do Sistema
Único de Saúde, o Programa Nacional de Melhoria do
Acesso e da Qualidade da Atenção Básica (PMAQ-AB)
e o Incentivo Financeiro do PMAQ-AB, denominado
Componente de Qualidade do Piso de Atenção Básica
Variável - PAB Variável. Diário Oficial [da] República
Federativa do Brasil, Brasília: 20 jul. 2011. n. 138,
Seção I, p. 79.
8. Noronha JC. Cobertura universal de saúde: como
misturar conceitos, confundir objetivos, abandonar
princípios. Cad Saúde Pública. [Internet]. 2013. [Acesso
15 mar 2015]; 29 (5): 847-9. Disponível em: http://
dx.doi.org/10.1590/S0102-311X2013000500003.
9. Cardoso MO, Vieira-da-Silva LM. Avaliação da
cobertura da atenção básica à saúde em Salvador, Bahia,
Brasil (2000 a 2007). Cad Saúde Pública. [Internet]. jul
2012 [Acesso 14 jan 2015]; 28(7):1273-84. Disponível
em: http://www.scielosp.org/scielo.php?script=sci_
arttext&pid=S0102-311X2012000700006&lng=pt&nrm
=iso&tlng=pt.
10. Tomasi E, Facchini LA, Thumé E, Piccini RX, Osorio
A, Silveira DS, et al. Características da utilização de
serviços de Atenção Básica à Saúde nas regiões Sul e
Nordeste do Brasil: diferenças por modelo de atenção.
Ciênc Saúde Coletiva. 2011;16(1):4395-404.
11. Leão C, Caldeira AP. Avaliação da associação entre
qualificação de médicos e enfermeiros em atenção
primária em saúde e qualidade da atenção. Ciênc Saúde
Coletiva. 2011; 16( 11 ): 4415-4423.
12. Taddeo PS, Gomes KWL, Caprara A, Gomes AMA,
Oliveira GC, Moreira TMM. Acesso, prática educativa e
empoderamento de pacientes com doenças crônicas.
Ciênc Saúde Coletiva. 2012;17(11): 2923-30.
13. Spencer, NH. Essentials of Multivariate data Analysis.
CRC. PRESS: Taylor & Francis; 2014. 186 p.
14. Mingoti SA. Análise de dados através de métodos
de es- tatística multivariada: uma abordagem aplicada.
Belo Horizonte: Editora UFMG; 2005.
15. Almeida PF, Fausto MCR, Giovanella L. Fortalecimento
da atenção primária à saúde: estratégia para potencializar
a coordenação dos cuidados. Rev Panam Salud Publica.
2011; 29(2):84-95.

www.eerp.usp.br/rlae
12 Rev. Latino-Am. Enfermagem 2016;24: e2672
16. Junqueira TS, Cotta RMM, Gomes RCG, Silveira SFR,
Siqueira-Batista R, Pinheiro TMM, Sampaio RF. As relações
laborais no âmbito da municipalização da gestão em
saúde e os dilemas da relação expansão/precarização do
trabalho no contexto do SUS. Cad Saúde Pública. 2010;
26(5):918-28.
17. Giovanella L, Mendonça MHM, Almeida PF, Escorel
S, Almeida PF, Fausto MCR, et al. Potencialidades e
obstáculos para a consolidação da Estratégia Saúde da
Família em grandes centros urbanos. Saúde em Debate.
2010;34(85):248-64.
18. Ministério da Saúde (BR). Secretaria de Gestão
Estratégica e Participativa. Departamento de Articulação
Interfederativa. Caderno de Diretrizes: Objetivos,
Metas e 32 Indicadores 2013 – 2015 [Internet].
Brasília: 2013 [Acesso 29 nov 2013]. 156 p. (Série
Articulação Interfederativa, v. 1). Disponível em: http://
portalweb04.saude.gov.br/sispacto/Caderno.pdf.
19. Souza MB; Rocha PM; Sá AB; Uchoa SAC. Trabalho
em equipe na atenção primária: a experiência de
Portugal. Rev Panam Salud Publica. [Internet].
mar 2013;33(3):190-5. [Acesso 20 out 2013].
Disponível em: http://dx.doi.org/10.1590/S1020-
49892013000300005.
20. Tesser, CD, Norman AH. Repensando o acesso ao
cuidado na Estratégia Saúde da Família. Saúde soc. São
Paulo. 2014; 23(3):869-83. doi.org/10.1590/S0104-
12902014000300011.
21. Calnan M, Hutten J, Tiljak H. The challenge of
coordination: the role of primary care professional in
promoting integration across the interface. In: Saltman
RS, Rico A, Boerma WGW, editores. Primary care in the
driver’s seat? Organizational Reform in European Primary
Care [Internet]. Berkshire: Open University Press; 2007
[Acesso 12 jun 2014]. p. 85-104. Disponível em: http://
www.euro.who.int/__data/assets/pdf_file/0006/98421/
E87932.pdf.
22. Santos AM, Giovanella L, Mendonça MHM, Andrade
CLT, Maria Inês Carsalade Martins, Cunha MS. Praticas
assistenciais das equipes de saúde da família em
quatro grandes centros urbanos. Ciênc Saúde Coletiva.
2012;17(10):2687-702.
23. Almeida Patty Fidelis de, Giovanella Lígia, Mendonça
Maria Helena Magalhães de, Escorel Sarah. Desafios à
coordenação dos cuidados em saúde: estratégias de
integração entre níveis assistenciais em grandes centros
urbanos. Cad Saúde Pública. [Internet]. fev 2010 [Acesso
30 maio 2015]; 26(2):286-98. Disponível em: http://www.
scielo.br/scielo.php?script=sci_arttext&pid=S0102-
311X2010000200008&lng=en. http://dx.doi.
org/10.1590/S0102-311X2010000200008.
24. Dallegrave D, Camila Boff C , Kreutz JA. Acupuntura
e Atenção Primária à Saúde: análise sobre necessidades
de usuários e articulação da rede. Rev Bras Med Fam
Comunidade. 2011; 6(21):249-56.
25. Brondani DA Jr, Heck RM, Ceolin T, Viegas CRS.
Atividades gerenciais do enfermeiro na estratégia de
saúde da família. Rev Enferm UFSM. 2011;1(1):41-50.
Erratum
Page 1:
Where was written:“Severina Alice da Costa Uchôa1
Ricardo Alexandre Arcêncio2
Inês Santos Estevinho Fronteira3
Ardigleusa Alves Coêlho4
Claudia Santos Martiniano4
Isabel Cristina Araújo Brandão5
Mellina Yamamura6
Renata Melo Maroto7”
Now Read:“Severina Alice da Costa Uchôa1
Ricardo Alexandre Arcêncio2
Inês Fronteira3
Ardigleusa Alves Coêlho4
Claudia Santos Martiniano4
Isabel Cristina Araújo Brandão5
Mellina Yamamura6
Renata Melo Maroto7
Anny Karine Freire da Silva8”
Where was written:“Objective: to analyze the influence of contextual indicators on the performance of municipalities regarding potential access to primary health care in Brazil and to discuss the contribution from nurses working on this access. Method: a multicenter descriptive study based on secondary data from External Evaluation of the National Program for Access and Quality Improvement in Primary Care, with the participation of 17,202 primary care teams. The chi-square test of proportions was used to verify differences between the municipalities stratified based on size of the coverage area, supply, coordination, and integration; when necessary, the chi-square test with Yates correction or Fisher’s exact test were employed. For the population variable, the Kruskal-Wallis test was used. Results: the majority of participants were nurses (n=15.876; 92,3%). Statistically significant differences

www.eerp.usp.br/rlae
13Uchôa SAC, Arcêncio RA, Fronteira ISE, Coêlho AA, Martiniano CS, Brandão ICA, et al.
were observed between the municipalities in terms of territory (p=0.0000), availability (p=0.0000), coordination of care (p=0.0000), integration (p=0.0000) and supply (p=0.0000), verifying that the municipalities that make up area 6 tend to have better performance in these dimensions. Conclusion: areas 4,5 and 6 performed better in every analyzed dimension, and the nurse had a leading role in the potential to access primary health care in Brazil.”
Now Read:“Objective: to analyze the influence of contextual indicators on the performance of cities regarding potential access to primary health care in Brazil and to discuss the contribution from nurses working on this access. Method: a multicenter descriptive study using secondary data from External Evaluation of the National Program for Access and Quality Improvement in Primary Care, with the participation of 17,202 primary care teams. The chi-square test of proportions was used to verify differences between the cities stratified in the dimensions on size of the coverage group, supply, coordination and integration. When necessary, the chi-square test with Yates correction or Fisher’s exact test were employed. For the population variable, the Kruskal-Wallis test was used. Results: the majority of participants were nurses (n = 15,876; 92.3%). Statistically significant differences were observed between the cities in terms of territory (p=0.0000), availability (p=0.0000), coordination of care (p=0.0000), integration (p=0.0000) and supply (p=0.0000), verifying that the cities that make up group 6 tend to perform better in these dimensions, with a better performance in all dimensions analyzed in groups 4, 5 and 6. Conclusion: weakness in smaller cities, confirming inequities in the potential access to Primary Health Care in Brazil as challenges for universal coverage. The preponderant role of nurses for its achievement is highlighted.Where was written:“1 Post-doctoral fellow, Instituto de Higiene e Medicina Tropical, Universidade Nova de Lisboa, Lisboa, Portugal. Associate Professor, Departamento de Saúde Coletiva, Universidade Federal do Rio Grande do Norte, Natal, RN, Brazil. Scholarship holder from Conselho Nacional de Desenvolvimento Científico e
Tecnológico (CNPq), Brazil.2 PhD, Professor, Escola de Enfermagem de Ribeirão Preto, Universidade de São Paulo, PAHO/WHO Collaborating Centre for Nursing Research Development, Ribeirão Preto, SP, Brazil.3 PhD, Assistant Professor, Instituto de Higiene e Medicina Tropical, Universidade Nova de Lisboa, Lisboa, Portugal.4 PhD, Professor, Departamento de Enfermagem, Universidade Estadual da Paraíba, Campina Grande, PB, Brazil.5 MSc, Professor, Departamento de Enfermagem, Centro Universitário FACEX, Natal, RN, Brazil.6 Doctoral student, Escola de Enfermagem de Ribeirão Preto, Universidade de São Paulo, PAHO/WHO Collaborating Centre for Nursing Research Development, Ribeirão Preto, SP, Brazil. Assistant Professor, Escola de Enfermagem, Universidade Federal do Rio Grande do Norte, Natal, RN, Brazil. Scholarship holder from Fundação de Amparo à Pesquisa do Estado de São Paulo (FAPESP), Brazil.7 Doctoral student, Departamento de Odontologia, Universidade Federal do Rio Grande do Norte, Natal, RN, Brazil.”
Now Read:“1 Post-doctoral fellow, Instituto de Higiene e Medicina Tropical, Universidade Nova de Lisboa, Lisboa, Portugal. Associate Professor, Departamento de Saúde Coletiva, Universidade Federal do Rio Grande do Norte, Natal, RN, Brazil. Scholarship holder from Conselho Nacional de Desenvolvimento Científico e Tecnológico (CNPq), Brazil.2 PhD, Professor, Escola de Enfermagem de Ribeirão Preto, Universidade de São Paulo, PAHO/WHO Collaborating Centre for Nursing Research Development, Ribeirão Preto, SP, Brazil.3 PhD, Assistant Professor, Instituto de Higiene e Medicina Tropical, Universidade Nova de Lisboa, Lisboa, Portugal.4 PhD, Professor, Departamento de Enfermagem, Universidade Estadual da Paraíba, Campina Grande, PB, Brazil.5 MSc, Professor, Departamento de Enfermagem, Centro Universitário FACEX, Natal, RN, Brazil.

www.eerp.usp.br/rlae
14 Rev. Latino-Am. Enfermagem 2016;24: e2672
6 Doctoral student, Escola de Enfermagem de Ribeirão Preto, Universidade de São Paulo, PAHO/WHO Collaborating Centre for Nursing Research Development, Ribeirão Preto, SP, Brazil. Assistant Professor, Escola de Enfermagem, Universidade Federal do Rio Grande do Norte, Natal, RN, Brazil. Scholarship holder from Fundação de Amparo à Pesquisa do Estado de São Paulo (FAPESP), Brazil.7 Doctoral student, Departamento de Odontologia, Universidade Federal do Rio Grande do Norte, Natal, RN, Brazil.8 Specialist in Reading and Text Production.”
Page 2
Where was written:“In Brazil, the issue of universal and equitable access has been a concern since the creation of the Unified Health System UHS (SUS) in 1988. This idea is reinforced by the National Policy of Primary Care - BANP (PNAB), in which the potential for access to comprehensive care management through multidisciplinary, interdisciplinary team work is emphasized(3).”
Now Read:“Since the 1988 constitution, Brazil has made efforts towards universal coverage as a right through the Unified Health System (SUS). In 1994, the Family Health Strategy was implemented, based on comprehensive care and multidisciplinary teamwork. Through this strategy, the coverage rate was expanded, reaching 57% of the population (108 million people) in 2013(3).”
Where was written:
“Research scenario
In 2012, SUS had 36,361 Basic Health Units (BHU)
and 33,404 Family Health Teams (FHT) with coverage in
5,297 municipalities. The adherence to PMAQ occurred
with 17,202 Primary Care Teams (PCT). Among these,
16,566 FHT and 636 non- FHT were distributed in 3,944
(70.8%) of the total municipalities, in 14,111 Basic
Health Units (BHUs)(7). “
Now Read:
“Research scenario
Adherence to cycle I of the PMAQ amounted to 17,482 Primary Care Teams (PCT), distributed across 3,944 (70.8%) of all cities and 14,111 Basic Health Units (BHUs)(7). In this group, 17,202 were recruited for the study, as their questionnaires were validated in the database of the Ministry of Health.”
Pages 3-8:
Where was written:
Classification of municipalities according to the context variables
The municipalities listed in the study are
classified into six strata, considering the per capita
Gross Domestic Product (GDP), the percentage of
the population with health insurance, the percentage
of the population on the Bolsa Família (Family Grant)
program, the percentage of the population in extreme
poverty, and the population density.
The composition of the extracts considered for
each municipality were: the lowest score among the
percentage of the population with Bolsa Família program,
and the percentage of the population in extreme
poverty: area 1 - Municipalities with scores lower than
4.82 and a population of up to 10,000 inhabitants;
area 2 - Municipalities with scores lower than 4.82 and
a population of up to 20 thousand inhabitants; area
3 - municipalities with scores lower than 4.82 and a
population of up to 50 thousand inhabitants; area 4 -
Municipalities with scores between 4.82 and 5.4, and
population of up to 100 thousand inhabitants; area
5 - Municipalities with scores between 5.4 and 5.85,
and population of up to 500 thousand inhabitants;
and municipalities with a score lower than 5.4, and
population between 100 and 500 thousand inhabitants;
and area 6 - Municipalities with population over 500,000
inhabitants, or a score less than 5.85(7).
Variables under consideration to evaluate potential
access:
The variables considered for evaluating potential
access are described in Table 2. The table shows the
dimension, characteristic and nature of the variables
that are included.

www.eerp.usp.br/rlae
15Uchôa SAC, Arcêncio RA, Fronteira ISE, Coêlho AA, Martiniano CS, Brandão ICA, et al.
Plan of analysis
Initially, the descriptive analysis of the
characteristics area of the municipalities’, professional
category, and median number of professionals per team
was calculated.
Regarding the performance of municipalities in
terms of access, four dimensions of the PMAQ instrument
were measured: coverage area, supplies, customer
coordination, and integration.
The variables were dichotomized into yes and no.
Thereafter, the sum of the responses for each item was
calculated, dividing this number by the total sample. To
verify differences between the municipalities in relation
to the size of potential access, the chi-square test of
proportions was used. The chi-square test with Yates
or Fisher’s exact test correction was applied when
necessary. For the population variable, the Kruskal-
Wallis test was used to verify differences in relation to
the median inhabitants monitored by areas.
After the analysis of the performance of the
municipalities within the areas, in relation to access,
multivariate statistics by multiple correspondence
analyses (MCA) was used, given that the instrument
variables were categorical.
The MCA implementation was based on the steps
of Spencer(13) and Mingoti(14), in which the tabulation of
responses generated a matrix, with rows corresponding
to the participating health professionals, and the columns
corresponding to the variables. Subsequently, the
matrix turned into a complete disjunctive table (CDT).
In the table, the columns represent characteristics of the
variables, in which the intersection of Row I with Column
J is the xij, which is 0 or 1, indicating that the area either
has or does not have the characteristic.
The perceptual map was formed by this technique,
which is a visual representation of the variables in
two or more dimensions. Each variable has a spatial
position in the perceptual map, variables perceived as
similar or associated are allocated to proximal points
on the map, while those not perceived as similar are
represented as distal points. The proximity indicates the
correspondence between the categories represented in
rows and columns of the table.
The component row or column influences the
construction of the axes through its inertia, in relation
to the center of gravity. The inertia means the variance
of the data set (13). From the MCA it was possible to
extract the most representative dimensions in terms of
inertia, which in the study corresponded to the first two.
Its contribution to inertia was considered a criterion for
selection of the variables.
Results
Table 1 shows characteristics of the sample of
17,202 teams recruited for the study, according to the
PMAQ area. The majority of participants were nurses (n
=;%), and many of them had less than three years of
experience after completing their education.
Among the models of care, in all areas, there was
a predominance of the Family Health Strategy (FHS)
without oral health. In general, there is a median of one
(1) physician, nurse, nursing technicians, and dentist per
team. All modalities of care investigated showed that
most of the teams did not provide the patient with the
opportunity to choose a desired unit for treatment and
follow up.
In Table 2, the performance of municipalities in
terms of patient access is verified, considering the area
established in PMAQ.
Statistically significant differences were identified
between the municipalities of area 1, 2 and 3 with area
4, 5 and 6, and the professionals of the last areas had
more qualifications (p=0.0000).
Regarding the career plan, no statistically
significant difference (p = 0.0000) was observed,
and the municipalities of area 4, 5 and 6 had better
indicators; lowest values were found in areas 1, 2 and
3. Also, these areas showed statistically significant
differences associated with their training policy and
continuing education (p=0.0000).
According to Table 2, statistically significant
differences in t erms of population coverage were
observed, in which area 5 and 6 monitored a median
number of people with access well above that of areas
1, 2 and 3. Also, statistically significant differences were
present between the municipalities in terms of coverage
area (p=0.0000), availability (p=0.0000), coordination
of care (p=0.0000), integration (p=0.0000) and supply
(p=0.0000), verifying that the municipalities that
form area 6 tend to have better performance in these
dimensions.

www.eerp.usp.br/rlae
16 Rev. Latino-Am. Enfermagem 2016;24: e2672
Table1 - Characteristics of study sample, PMAQ Project, Brazil (2012)
VariablesPMAQ Areas
1 2 3 4 5 6
Professional category n ( %)
Physician 72 (0.42) 59 (0.34) 52 (0.30) 91 (0.53) 143 (0.83) 576 (3.35)
Nurse 2.058 (11.96)
2.179 (12.67) 2.425 (14.10) 3.119 (18.
13) 2.615 (15.20) 3.480 (20.23)
Dentist 35 (0.20) 35 (0.20) 50 (0.29) 56 (0.33) 56 (0.33) 101 (0.59)
Years of work/experience n (%)
Less than 1 year 546 (3.17) 693 (4.03) 801 (4.66) 995 (5.78) 830 (4.83) 875 (5.09)
Between 1-3 years 867 (5.04) 966 (5.62) 1.068 (6.21) 1.384 (8.05) 1.133 (6.59) 1.598 (9.29)
Greater than three years 743 (4.32) 608 (3.53) 652 (3.79) 881 (5.12) 843 (4.90) 1.673 (9.73)
Don´t know/ no response 9 (0.05) 6 (0.03) 6 (0.03) 6 (0.03) 8 (0.05) 11 (0.06)
Type of team n (%)
Family Health Teams with oral health 1.832 (10.66)
1.798 (10.45) 2.041 (11.86) 2.464
(14.32) 1.767 (10.27) 2.173 (12.63)
Family Health Teams without oral health 261 (1.52) 398 (2.31) 423 (2.46) 720 (4.19) 942 (5.48) 1.824 (10.60)
Primary care team with oral health 59 (0.34) 57 (0.33) 45 (0.26) 59 (0.34) 57 (0.33) 51 (0.30
Primary care teams without oral health 7 (0.04) 9 (0.05) 11 (0.06) 15 (0.09) 43 (0.25) 39 (0.23)
Others 4 (0.02) 6 (0.03) 4 (0.02) 7 (0.04) 3 (0.02) 66 (0.38)
Do not Know/No response 2 (0.01) 5 (0.03) 3 (0.02) 1 (0.01) 2 (0.01) 4 (0.02)
Minimum number of physicians in the primary care staff of BHU (n= 16643)
Median 1 1 1 1 1 1
Minimum and Maximum value 0.00 – 4.00 0.00 – 4.00 0.00 – 4.00 0.00 – 11.00 0.00 – 11.00 0.00 – 6.00
Minimum number of nurses in the primary care staff (n=16643)
Median 1 1 1 1 1 1
Minimum and maximum value 0.00 – 4.00 0.00 – 4.00 0.00 – 4.00 0.00 – 4.00 0.00 – 4.00 0.00 – 4.00
Minimum number of dentists in the primary care staff (n=16643)
Median 1 1 1 1 1 1
Minimum and maximum value 0.00 – 6.00 0.00 – 4.00 0.00 – 3.00 0.00 – 6.00 0.00 – 6.00 0.00 – 4.00
Minimum number of nursing technicians in the primary care staff (n=16643)
Median 1 1 1 1 1 1
VariablesPMAQ Areas
1 2 3 4 5 6
Minimum and maximum value 0.00 – 13.00 0.00 – 10.00 0.00 – 10.00 0.00 – 8.00 0.00 – 20.00 0.00 – 11.00
Minimum number of nursing assistants in the primary care staff (n=16643)
Median 0 0 0 0 0 1
Minimum and maximum value 0.00 – 9.00 0.00 – 8.00 0.00 – 8.00 0.00 – 8.00 0.00 – 6.00 0.00 – 20.00
Minimum number of dental technicians in the primary care staff (n=16643)
Median 0 0 0 0 0 0
Minimum and maximum value 0.00 – 8.00 0.00 – 8.00 0.00 – 8.00 0.00 – 2.00 0.00 – 3.00 0.00 – 8.00
Minimum number of dental assistants in the primary care staff (n=16643)
Median 1 1 1 1 1 0
Minimum and maximum value 0.00 – 6.00 0.00 – 7.00 0.00 – 8.00 0.00 – 9.00 0.00 – 8.00 0.00 – 10.00
Minimum number of community health workers in the primary care staff (n=16643)
Median 6 6 7 6 6 5
Minimum and maximum value 0.00 – 19.00 0.00 – 50.00 0.00 – 42.00 0.00 – 50.00 0.00 – 56.00 0.00 – 32.00
Allowing the patient to choose team by which he wants to be treated n (%)
Yes 219 (1.27) 191 (1.11) 180 (1.05) 161 (0.94) 127 (0.74) 303 (1.76)
No 286 (1.66) 309 (1.80) 303 (1.76) 411 (2.39) 442 (2.57) 1.059 (6.16)
Not applicable 454 (2.64) 539 (3.13) 516 (3.00) 671 (3.90) 355 (2.06) 196 (1.14)
Don´t know/No response 1.206 (7.01) 1.234 (7.17) 1.528 (8.88) 2.023(11.76) 1.890 (10.99) 2.599 (15.11)

www.eerp.usp.br/rlae
17Uchôa SAC, Arcêncio RA, Fronteira ISE, Coêlho AA, Martiniano CS, Brandão ICA, et al.
Table 2 - Performance of municipalities on patient access according to the areas, Brazil, 2012
Dimension VariablesPMAQ areas
1 2 3 4 5 6p value
n (%) n (%) n (%) n (%) n (%) n (%)
Personal qualification
Complementary education (n=17.202)
Yes 1.708 (9.93) 1.795 (10.43) 2.050 (11.92) 2.694 (15.66) 2.460 (14.30) 3.642 (21.17)0.000*
No 457 (2.66) 478 (2.78) 477 (2.77) 572 (3.33) 354 (2.06) 515 (2.99)
Career development programs (n=16.936)
Yes 253 (1.49) 159 (0.94) 246 (1.46) 574 (3.39) 581 (3.43) 1.810 (10.69)0.000*
No 1.877 (11.08) 2.069 (12.22) 2.245 (13.26) 2.647 (15.63) 2.194 (12.95) 2.279 (13.46)
There are continuing education activities involving primary care professionals (n=17.113)
Yes 1.432 (8.37) 1.596 (9.33) 1.878 (10.97) 2.601 (15.20) 2.481 (14.50) 3.969 (23.19)0.000*
No 720 (4.21) 658 (3.85) 630 (3.68) 650 (3.80) 325 (1.90) 173 (1.01)
Coverage area
How many people for whom the team is responsible
Mean 2165 2273 2527 3266 2814 4157 0.0001†
Risk and vulnerability criteria were considered for defining people for whom the team is responsible (n=15.691)
Yes 1.024 (6.53) 1.141 (7.27) 1.323 (8.43) 1.705 (10.87) 1.423 (9.07) 2.648 (16.88)0.000*
No 951 (6.06) 877 (5.59) 937 (5.97) 1.265 (8.06) 1.115 (7.11) 1.282 (8.17)
There is definition of team coverage area (n=17.150)
Yes 2.086 (12.16) 2.197 (12.81) 2.456 (14.32) 3.190 (18.60) 2.763 (16.11) 4.113 (23.98)0.000*
No 68 (0.40) 60 (0.35) 63 (0.37) 71 (0.41) 43 (0.25) 40 (0.23)
There is a population uncovered by primary care surrounding the team’s coverage area (n=17.092)
Yes 369 (2.16) 534 (3.12) 888 (5.20) 1.083 (6.34) 1.391 (8.14) 1.513 (8.85)0.000*
No 1.783 (10.43) 1.724 (10.09) 1.618 (9.47) 2.170 (12.70) 1.406 (8.23) 2.613 (15.29)
How often people from outside the team’s coverage area are served by this team (n=16.855)
Every day of the week 900 (5.34) 828 (4.91) 1.001 (5.94) 1.247 (7.40) 1.255 (7.45) 2.152(12.77)
0.000*Some days of the week 966 (5.73) 1.135 (6.73) 1.201 (7.13) 1.502 (8.91) 1.222 (7.25) 1.673 (9.93)
Any day of the week 248 (1.47) 243 (1.44) 266 (1.58) 451 (2.68) 287 (1.70) 178 (1.65)
Availability
Patients who spontaneously arrive and have their needs heard and assessed (n=17.140)
Yes 2.121 (12.37) 2.202 (12.85) 2.442 (14.25) 3.180 (18.55) 2.689 (15.69) 4.078 (23.79) 0.000*
No 38 (0.22) 59 (0.34) 80 (0.47) 83 (0.48) 108 (0.63) 60 (0.35)
The team performs risk and vulnerability assessment in the intake of patients (n=13.739)
Yes 1.265 (9.21) 1.385 (10.08) 1.645 (11.97) 2.286 (16.64) 2.050 (14.92) 3.442 (25.05) 0.0066*
No 192 (1.40) 221 (1.61) 248 (1.81) 324 (2.36) 236 (1.72) 445 (3.24)
The schedule is organized to conduct home visitation (n=13.951)
Yes 1.418 (10.16) 1.628 (11.67) 1.865 (13.37) 2.391 (17.14) 2.253 (16.15) 3.697 (26.50) 0.000*
No 134 (0.96) 115 (0.82) 114 (0.82) 149 (1.07) 104 (0.75) 83 (0.590)
Coordination of care
Keep a record of high risk patients referred to other points of care (n=17.104)
Yes 826 b(4.83) 818 (4.78) 1.104 (6.45) 1.474 (8.62) 1.353 (7.91) 2.385 (13.94) 0.000*
No 1.310 (7.66) 1.439 (8.41) 1.405 (8.21) 1.785 (10.44) 1.449 (8.47) 1.756 (10.27)
There is a document proving (n=
Yes 605 (7.60) 638 (8.02) 913 (11.47) 1.206 (15.15) 1.132 (14.22) 1.978 (24.85) 0.000*
No 221 (2.78) 180 (2.26) 191 (2.40) 268 (3.37) 221 (2.78) 407 (5.11)
There are protocols that guide the prioritization of cases needing referral (n=17.037)
Yes 581 (3.41) 613 (3.60) 807 (4.74) 1.213 (7.12) 1.228 (7.21) 2.907 (17.06) 0.000†
No 1.558 (9.14) 1.636 (9.60) 1.685 (9.89) 2.036 (11.95) 1.567 (9.20) 1.206 (7.08)

www.eerp.usp.br/rlae
18 Rev. Latino-Am. Enfermagem 2016;24: e2672
Dimension VariablesPMAQ areas
1 2 3 4 5 6p value
n (%) n (%) n (%) n (%) n (%) n (%)
Integration
There is a regulation center (n=17.201)
Yes 1.880 (10.93) 2.006 (11.66) 2.239 (13.02) 2.907 (16.90) 2.540 (14.77) 4.027 (23.41) 0.000*
No 284 (1.65) 267 (1.55) 288 (1.67) 359 (2.09) 274 (1.59) 130 (0.76)
There is a referral form for patients moving to other points of care (n=17.201)
Yes 1.752 (10.19) 1.828 (10.63) 2.138 (12.43) 2.970 (17.27) 2.615 (15.20) 4.055 (23.57) 0.0000*
No 412 (2.40) 445 (2.59) 389 (2.26) 296 (1.72) 199 (1.16) 102 (0.59)
Supply
Receive enough basic medicines from pharmacy to serve its population (n=17.161)
Yes 1.459 (8.50) 1.490 (8.68) 1.722 (10.03) 2.210 (12.88) 1.830 (10.66) 2.898 (16.89) 0.0000*
No 378 (2.20) 457 (2.66) 614 (3.58) 644 (3.75) 718 (4.18) 2.077 (6.28)
Do not receive 316 (1.84) 320 (1.86) 187 (1.09) 406 (2.37) 263 (1.53) 172 (1.00)
Offers service of complementary and integrative practices for patients of the area (n=17.199)
Yes 235 (1.37) 230 (1.34) 305 (1.77) 381 (2.22) 512 (2.98) 1.546 (8.99) 0.0000*
No 1.929 (11.22) 2.042 (11.87) 2.222 (12.92) 2.885 (16.77) 2.301 (13.38) 2.611 (15.18)
Conducts home visits (n=17.199)
Yes 2.146 (12.48) 2.262 (13.15) 2.521 (14.66) 3.253 (18.91) 2.802 (16.29) 4.148 (24.12) 0.0075*
No 18 (0.10) 10 (0.06) 6 (0.03) 13 (0.08) 11 (0.06) 9 (0.05)
The families in the coverage area are visited at intervals according to risk and vulnerability assessment? (n=17.132)
Yes 1.963 (11.46) 2.069 (12.08) 2.345 (13.69) 2.997 (15.30) 2.621 (15.30) 3.986 (23.27) 0.0000*
No 183 (1,07) 193 (1,13) 176 (1,03) 256 (1,49) 181 (1,06) 162 (0,95)
* p value statistically significant (p<0.05)
† Kruskal-Wallis test
When compared by professional category (Table 3), a statistically significant difference is again identified, in
which a higher proportion of both physicians as well as
dentists tend to refer to more positive aspects of their
units than nurses.
The proportion of nurses who tends to identify
weaknesses in relation to the organization of services is
much greater than other professionals.
In complementary education, for example, whereas
there is one “No” for each 4 “Yes” assigned by physicians
in this item, and almost one “No” for each three “Yes”
assigned by dentists, among nurses this proportion
was almost five, which was statistically significant (p =
0.0046). Career development programs was also another
point on which this difference was very significant (p
= 0.0000), where again, the proportion of nurses who
reported the absence of or lack of participation in was
much higher than other categories.
When a comparative analysis of the APS related
to the models of care was conducted, the FHT with or
without oral health predominated. Statistically significant
differences were identified in career development
program variables, where the proportion of professionals
linked to the FHT, which has career development
programs, was much smaller than the professionals
integrated in other models of care (p=0.0000). Similarly,
a statistically significant association regarding continuing
education activities (p=0.0000) was observed, records
of the documentation of cases referred for other services
(p=0.0462), protocols to guide professionals for referrals
to other services (p=0.0000) and use of complementary
practices (p=0.0000). A significant difference was
observed in the home visits, where the FHT presented
a higher proportion of visits compared to the other two
forms of attention (p=0.0000).

www.eerp.usp.br/rlae
19Uchôa SAC, Arcêncio RA, Fronteira ISE, Coêlho AA, Martiniano CS, Brandão ICA, et al.
Table 3 - Performance of primary care for patient access to the health system according professional category, Brazil, 2012
Variables
Professional Category
P valuePhysician Nurse Dentist
Yes % No % Yes % No % Yes % No %
Complementary education n=17202 800 4.6 193 1.1 13285 77.2 2591 15.1 264 1.5 69 0.4 0.0046*
Career development programs n=17113 303 1.8 670 4.0 3224 19.0 12412 73.3 98 0.6 229 1.4 0.0000*
Continuing education activities n=17113 853 5.0 132 0.8 12850 75.1 2951 17.2 254 1.5 73 0.4 0.0000*
All patients have their needs heard and assessed n=17047 956 5.6 25 0.15 15362 90.1 380 2.2 309 1.8 15 0.1 0.0384*
The team performs risk assessment during the intake n=13730 777 5.6 95 0.7 11066 80.6 1538 11.2 223 1.6 31 0.2 0.5189
Schedule is organized for home visitation n=11473 743 6.5 27 0.2 10013 87.3 480 4.2 201 1.8 9 0.1 0.3815
High risk patients are registered when referred n=13658 488 3.6 378 2.8 6261 45.9 6284 46.0 136 1.0 111 0.8 0.0004*
Form to register the patient referral n= 6885 377 5.5 111 1.6 5159 75.0 1102 16.0 107 1.6 29 0.4 0.0105*
Protocols that guide the prioritization of cases for referral n=13606 533 3.9 329 2.4 5797 42.6 6704 49.3 129 1.0 114 0.8 0.0000*
Regulation center for referral n=17047 905 5.3 76 0.4 14274 83.7 1468 8.6 292 1.7 32 0.2 0.2347
Forms for referral of patients n=17047 915 5.4 66 0.4 14029 82.3 1713 10.1 294 1.7 30 0.2 0.0001*
Sufficient medicines in primary care to meet population needs n=17015 606 3.6 373 2.1 10721 63.0 4992 30 205 1.2 118 0.7 0.0000*
Offering integrative and complementary practices n=17045 273 1.6 707 4.2 2865 16.8 12877 75.6 46 0.3 277 1.6 0.0000*
The team performs home visitation n=17045 977 5.7 4 0.02 15690 92.1 52 0.31 320 1.9 3 0.02 0.1846
The families of coverage area are frequently visited 927 5.5 50 0.3 14636 86.2 1054 6.2 289 1.7 31 0.2 0.0142*
* p <0,05
Table 4 - Performance of primary care for access to the patient according to the model of care, Brazil, 2012
Activities
Model of care
P valueFHT (with or without oral health) Team AB Other model
Yes % No % yes % No % Yes % No %
Complementary education - V23 n= 17185 13883 80.8 2760 16.1 383 2.2 69 0.4 75 0.4 15 0.1 0.3059
Career development programs n=16923 v24 3516 21.0 12876 76.1 99 0.6 344 2.0 7 0.1 81 0.5 0.0000*
Continuing education activities = 17100 v25 13487 78.9 3074 18.0 283 2.2 66 0.4 80 0.5 10 0.1 0.0000*
All patients have their needs heard and assessed n=16987 v31 16055 94.6 397 2.3 422 2.5 15 0.1 85 0.5 3 0.0 0.1754
The team performs risk assessment during the intake n= 13723 v32 11710 85.3 1626 11.8 283 2.1 33 0.2 66 0.5 5 0.1 0.3987
Schedule is organized for home visitation n= 11473 v33 10678 93.1 486 4.2 236 2.1 22 1.32 43 0.4 8 0.1 0.3815
High risk patients are registered when referred n= 13658 v34 6685 50.0 6588 48.2 167 1.2 147 1.1 33 0.2 38 0.3 0.1323
Form to register the patient referral n= 6885 v35 5483 79.6 1202 17.5 136 2.0 31 0.5 24 0.4 9 0.1 0.0462*
Protocols that guide the prioritization of cases for referral n= 13606 v36 6289 46.2 6930 51.0 145 1.1 171 1.3 25 0.2 46 0.3 0.0000*
Regulation center for referral n= 17047 v37 12232 90.0 997 7.3 283 2.1 24 0.18 67 0.5 3 0.1 0.6982
Forms for referral of patients n= 17047 14782 86.7 1728 10.1 370 2.2 77 0.5 86 0.5 4 0.1 0.0000
V39 Has / receives medicines n= 17045 11146 59.5 5333 31.3 316 1.9 130 0.8 70 0.4 20 0.1 0.0286
V40 Offering integrative/ complementary practices n= 17045 3082 18.1 13426 78.8 93 0.6 354 2.1 9 0.1 81 0.5 0.0000*
V41 Team performs home visitation n = 17045 16462 96.6 46 0.3 437 2.6 10 0.1 88 0.5 2 0.1 0.0000*
V42 Families of coverage area are frequently visited n= 16987 15363 90.4 1099 6.5 404 2.4 33 0.2 85 0.5 3 0.1 0.1092
*p< 0,05

www.eerp.usp.br/rlae
20 Rev. Latino-Am. Enfermagem 2016;24: e2672
The Multiple Correspondence Analysis enabled
the creation of the perceptual map shown in Figure 1,
which demonstrates that the map can be divided into
quadrants; on the right side, quadrants are plotted
municipalities that showed better indicators in terms of
qualification than those on the left.
This figure demonstrate that the municipalities that
comprise areas 5 and 6 present better indicators with
regard to the training of their health professionals; the
municipalities that are concentrated closer to the center
have regular values. Thus they had some satisfactory
indicators and others that were unsatisfactory, and
municipalities of areas 1 and 2 had less satisfactory
indicators for this item.
Figure 2 expresses the performance of municipalities in
-1,5 -1,0 -0,5 0,0 0,5 1,0 1,5 2,0
Dimensão 1; Autovalor: 0,377 (18,89% de Inercia)
-2,0
-1,5
-1,0
-0,5
0,0
0,5
1,0
1,5
2,0
Dim
ensa
o 2;
Aut
oval
or: 0
,264
(13,
20%
de
Iner
cia) Estrato PMAQ:1
Estrato PMAQ:2
Estrato PMAQ:3Estrato PMAQ:4
Estrato PMAQ:5
Estrato PMAQ:6V23v:0
V23v:1V24v:0
V24v:1V25v:0
V25v:1
Note: V23 Do you have or are you taking complementary education?; V24 Do you have career development programs?; V25 Are there continuing education
activities in the municipality involving primary care professionals? Answers 1(Yes); 0 (No)
Figure 1 - Qualification for professionals working in the context of primary health care, according to the area of PMAQ,
Brazil (2012)
terms of availability, coordination of care, integration
and supply using a perceptual map. On the right side
of the map, the municipalities that showed better
indicators are represented, and on the left side are those
with poorer indicators.
Considering this evaluation with all of these
attributes, the single area with satisfactory indicators
across all of these dimensions was area 6; the
municipalities of area 4 and 5 showed median values,
with satisfactory indicators in some of those and
unsatisfactory in others; however, the municipalities of
area 5 were better than area 4; the municipalities of
area 1, 2 and 3 did not achieve satisfactory results in
these dimensions.
Figure 2 expresses the performance of municipalities in
terms of availability, coordination of care, integration
and supply using a perceptual map. On the right side
of the map, the municipalities that showed better
indicators are represented, and on the left side are those
with poorer indicators.
Considering this evaluation with all of these
attributes, the single area with satisfactory indicators
across all of these dimensions was area 6; the
municipalities of area 4 and 5 showed median values,
with satisfactory indicators in some of those and
unsatisfactory in others; however, the municipalities of
area 5 were better than area 4; the municipalities of
area 1, 2 and 3 did not achieve satisfactory results in
these dimensions.
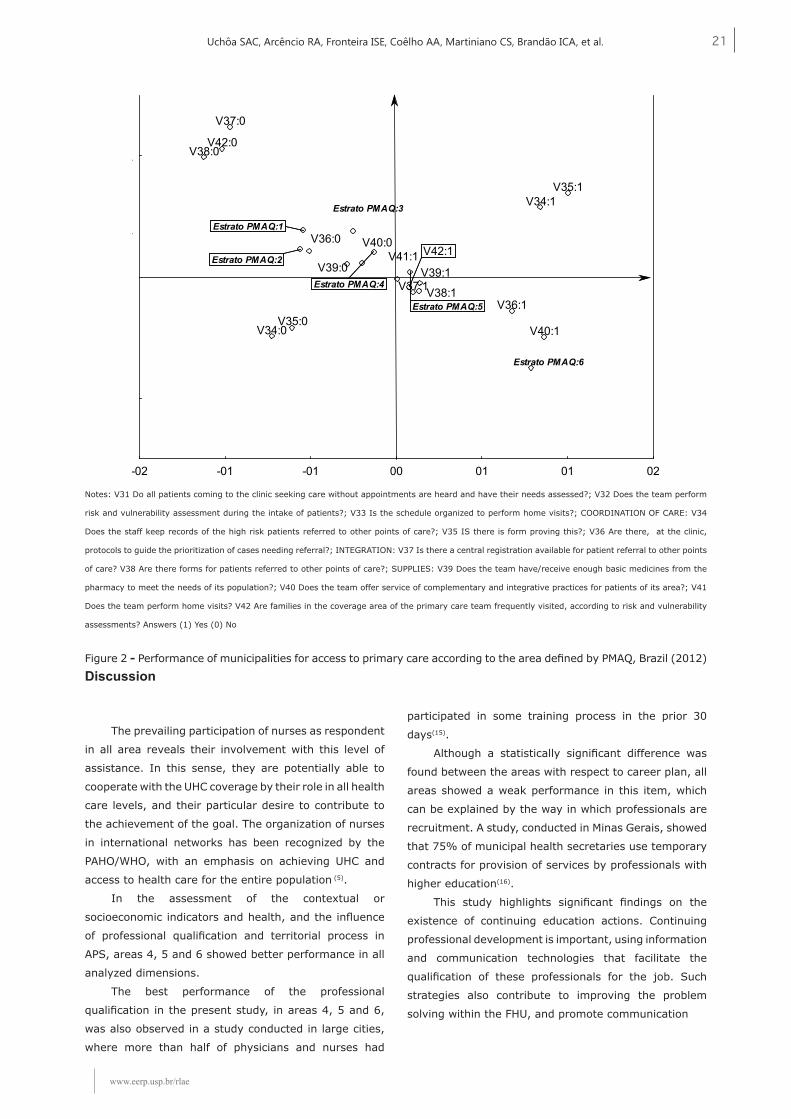
www.eerp.usp.br/rlae
21Uchôa SAC, Arcêncio RA, Fronteira ISE, Coêlho AA, Martiniano CS, Brandão ICA, et al.
Notes: V31 Do all patients coming to the clinic seeking care without appointments are heard and have their needs assessed?; V32 Does the team perform
risk and vulnerability assessment during the intake of patients?; V33 Is the schedule organized to perform home visits?; COORDINATION OF CARE: V34
Does the staff keep records of the high risk patients referred to other points of care?; V35 IS there is form proving this?; V36 Are there, at the clinic,
protocols to guide the prioritization of cases needing referral?; INTEGRATION: V37 Is there a central registration available for patient referral to other points
of care? V38 Are there forms for patients referred to other points of care?; SUPPLIES: V39 Does the team have/receive enough basic medicines from the
pharmacy to meet the needs of its population?; V40 Does the team offer service of complementary and integrative practices for patients of its area?; V41
Does the team perform home visits? V42 Are families in the coverage area of the primary care team frequently visited, according to risk and vulnerability
assessments? Answers (1) Yes (0) No
Figure 2 - Performance of municipalities for access to primary care according to the area defined by PMAQ, Brazil (2012)
Discussion
-02 -01 -01 00 01 01 02
Dimensão 1; Autovalor: 0,23565 (16,83%de Inércia)
Dim
ensã
o 2;
Aut
ovla
ro: 0
,132
(9,4
3% In
érci
a)
Estrato PMAQ:1
Estrato PMAQ:2
Estrato PMAQ:3
Estrato PMAQ:4
Estrato PMAQ:5
Estrato PMAQ:6
V34:0
V34:1
V35:0
V35:1
V37:0
V37:1
V36:0
V36:1
V38:0
V38:1
V39:0 V39:1
V40:0
V40:1
V41:1
V42:0
V42:1
The prevailing participation of nurses as respondent
in all area reveals their involvement with this level of
assistance. In this sense, they are potentially able to
cooperate with the UHC coverage by their role in all health
care levels, and their particular desire to contribute to
the achievement of the goal. The organization of nurses
in international networks has been recognized by the
PAHO/WHO, with an emphasis on achieving UHC and
access to health care for the entire population (5).
In the assessment of the contextual or
socioeconomic indicators and health, and the influence
of professional qualification and territorial process in
APS, areas 4, 5 and 6 showed better performance in all
analyzed dimensions.
The best performance of the professional
qualification in the present study, in areas 4, 5 and 6,
was also observed in a study conducted in large cities,
where more than half of physicians and nurses had
participated in some training process in the prior 30
days(15).
Although a statistically significant difference was
found between the areas with respect to career plan, all
areas showed a weak performance in this item, which
can be explained by the way in which professionals are
recruitment. A study, conducted in Minas Gerais, showed
that 75% of municipal health secretaries use temporary
contracts for provision of services by professionals with
higher education(16).
This study highlights significant findings on the
existence of continuing education actions. Continuing
professional development is important, using information
and communication technologies that facilitate the
qualification of these professionals for the job. Such
strategies also contribute to improving the problem
solving within the FHU, and promote communication
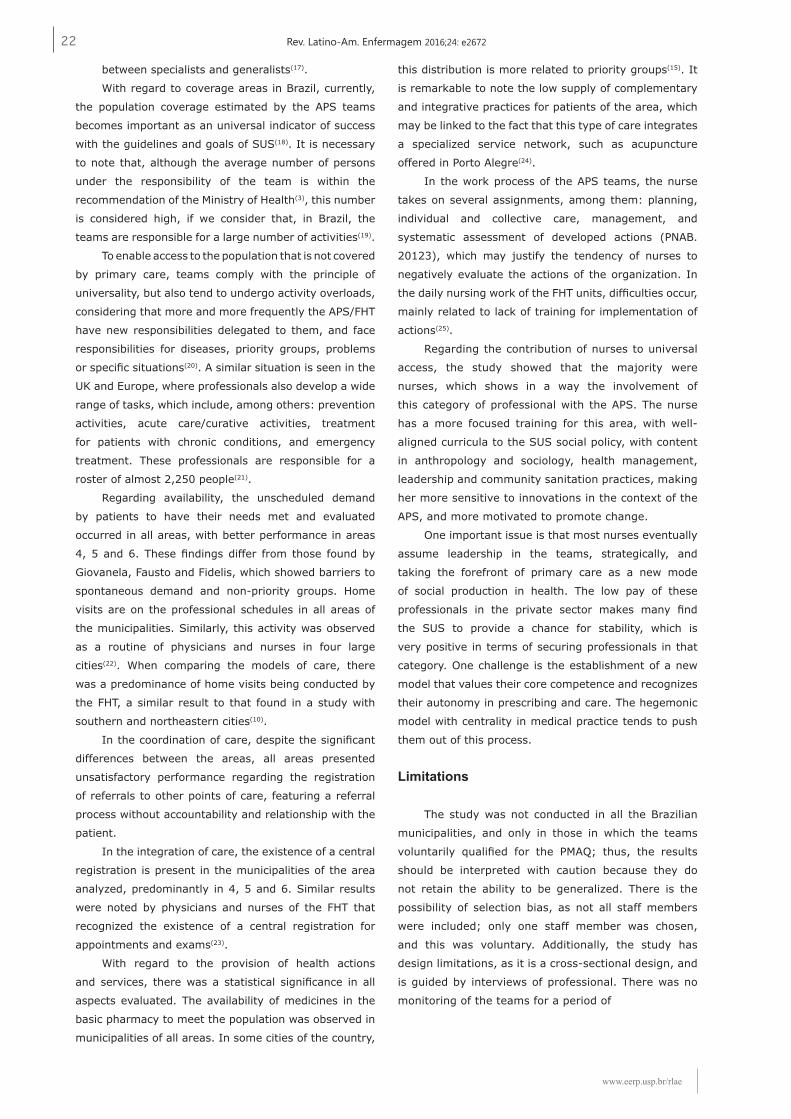
www.eerp.usp.br/rlae
22 Rev. Latino-Am. Enfermagem 2016;24: e2672
between specialists and generalists(17).
With regard to coverage areas in Brazil, currently,
the population coverage estimated by the APS teams
becomes important as an universal indicator of success
with the guidelines and goals of SUS(18). It is necessary
to note that, although the average number of persons
under the responsibility of the team is within the
recommendation of the Ministry of Health(3), this number
is considered high, if we consider that, in Brazil, the
teams are responsible for a large number of activities(19).
To enable access to the population that is not covered
by primary care, teams comply with the principle of
universality, but also tend to undergo activity overloads,
considering that more and more frequently the APS/FHT
have new responsibilities delegated to them, and face
responsibilities for diseases, priority groups, problems
or specific situations(20). A similar situation is seen in the
UK and Europe, where professionals also develop a wide
range of tasks, which include, among others: prevention
activities, acute care/curative activities, treatment
for patients with chronic conditions, and emergency
treatment. These professionals are responsible for a
roster of almost 2,250 people(21).
Regarding availability, the unscheduled demand
by patients to have their needs met and evaluated
occurred in all areas, with better performance in areas
4, 5 and 6. These findings differ from those found by
Giovanela, Fausto and Fidelis, which showed barriers to
spontaneous demand and non-priority groups. Home
visits are on the professional schedules in all areas of
the municipalities. Similarly, this activity was observed
as a routine of physicians and nurses in four large
cities(22). When comparing the models of care, there
was a predominance of home visits being conducted by
the FHT, a similar result to that found in a study with
southern and northeastern cities(10).
In the coordination of care, despite the significant
differences between the areas, all areas presented
unsatisfactory performance regarding the registration
of referrals to other points of care, featuring a referral
process without accountability and relationship with the
patient.
In the integration of care, the existence of a central
registration is present in the municipalities of the area
analyzed, predominantly in 4, 5 and 6. Similar results
were noted by physicians and nurses of the FHT that
recognized the existence of a central registration for
appointments and exams(23).
With regard to the provision of health actions
and services, there was a statistical significance in all
aspects evaluated. The availability of medicines in the
basic pharmacy to meet the population was observed in
municipalities of all areas. In some cities of the country,
this distribution is more related to priority groups(15). It
is remarkable to note the low supply of complementary
and integrative practices for patients of the area, which
may be linked to the fact that this type of care integrates
a specialized service network, such as acupuncture
offered in Porto Alegre(24).
In the work process of the APS teams, the nurse
takes on several assignments, among them: planning,
individual and collective care, management, and
systematic assessment of developed actions (PNAB.
20123), which may justify the tendency of nurses to
negatively evaluate the actions of the organization. In
the daily nursing work of the FHT units, difficulties occur,
mainly related to lack of training for implementation of
actions(25).
Regarding the contribution of nurses to universal
access, the study showed that the majority were
nurses, which shows in a way the involvement of
this category of professional with the APS. The nurse
has a more focused training for this area, with well-
aligned curricula to the SUS social policy, with content
in anthropology and sociology, health management,
leadership and community sanitation practices, making
her more sensitive to innovations in the context of the
APS, and more motivated to promote change.
One important issue is that most nurses eventually
assume leadership in the teams, strategically, and
taking the forefront of primary care as a new mode
of social production in health. The low pay of these
professionals in the private sector makes many find
the SUS to provide a chance for stability, which is
very positive in terms of securing professionals in that
category. One challenge is the establishment of a new
model that values their core competence and recognizes
their autonomy in prescribing and care. The hegemonic
model with centrality in medical practice tends to push
them out of this process.
Limitations
The study was not conducted in all the Brazilian
municipalities, and only in those in which the teams
voluntarily qualified for the PMAQ; thus, the results
should be interpreted with caution because they do
not retain the ability to be generalized. There is the
possibility of selection bias, as not all staff members
were included; only one staff member was chosen,
and this was voluntary. Additionally, the study has
design limitations, as it is a cross-sectional design, and
is guided by interviews of professional. There was no
monitoring of the teams for a period of

www.eerp.usp.br/rlae
23Uchôa SAC, Arcêncio RA, Fronteira ISE, Coêlho AA, Martiniano CS, Brandão ICA, et al.
Module II questionnaire - Interview with professional
of Primary Care Team and Document Checking of the
Health Unit External Evaluation of the first cycle of the
PMAQ-AB, were included here for data analysis(7). The
dimensions that were representative of the potential
levels of access according to the authors’ judgment were
chosen and are described in the analysis plan.
Classification of cities according to the
context variables
The cities listed in the study are classified into six
groups, considering the per capita Gross Domestic Product
(GDP), the percentage of the population with health
insurance, the percentage of the population on the Bolsa
Família (Family Grant) program, the percentage of the
population in extreme poverty, and the population density.
The composition of the extracts considered for each
municipality were: the lowest score among the percentage
of the population with Bolsa Família program, and the
percentage of the population in extreme poverty: group
1 - Cities with scores lower than 4.82 and a population
of up to 10,000 inhabitants; group 2 - Cities with scores
lower than 4.82 and a population of up to 20 thousand
inhabitants; group 3 - cities with scores lower than 4.82
and a population of up to 50 thousand inhabitants;
group 4 - Cities with scores between 4.82 and 5.40, and
population of up to 100 thousand inhabitants; group 5 -
Cities with scores between 5.4 and 5.85, and population
of up to 500 thousand inhabitants; and cities with a
score lower than 5.4, and population between 100.1
and 500 thousand inhabitants; and group 6 - Cities with
population over 500,000 inhabitants, or a score equal or
higher than 5.85(7).
The variables under consideration to evaluate the
potential access are described in Tables 1, 2 and 3 with
dimensions, variables, their characteristic and nature:
Analysis plan
Initially, the descriptive analysis of the
characteristics of the cities’ groups was undertaken in
terms of resources offered. Regarding the performance
of the cities in terms of access, this was measured
using four dimensions of the PMAQ tool: coverage
group, supplies, customer coordination and integration.
Therefore, the variables were dichotomized into yes and
no, using the chi-square test of proportions to verify
differences between the cities in relation to the size
of potential access was used. The chi-square test with
Yates’ correction or Fisher’s exact test was applied when
necessary. For the population variable, the Kruskal-
Wallis test was used to verify differences in relation to
the median inhabitants monitored by group. In all tests
applied, alpha was set at 5% (α = 0.05).
Ethical aspects
The multicenter project that led to the database
was approved by the Research Ethics Committee at
Universidade Federal do Rio Grande do Sul, under
number 21904, on March 13th 2012, and complied
with the recommendations of National Health Council
Resolution 196/1996 of the Ministry of Health.
Results
In total, 17,202 teams were recruited for the study,
the majority being nurses (n = 15,876; 92.3%), with
between one and three years of experience. In addition,
963 physicians participated in the study (5.6%) and 363
(2.1%) dentists with an equivalent length of experience.
Among the subjects enrolled, most professionals
are affiliated with the Family Health Strategy (FHS)
with oral health (n = 12,075; 70.2%). There was a
median of one (1) physician, nurse, nursing technicians,
and dentist per team. The data also reveal that 5991
(49.6%) participants could not answer whether the
users covered by their unit could choose what health
service to be followed at.
In Table 1, the performance of cities in terms
of patient access is verified, considering the group
established in PMAQ. Statistically significant differences
were identified between the cities of groups 1, 2 and
3 with groups 4, 5 and 6, and the professionals of
the last groups had more qualifications (p=0.0000).
Regarding the career plan, statistically significant
difference (p = 0.0000) were also observed, and the
cities of group 4, 5 and 6 had better indicators; lowest
values were found in groups 1, 2 and 3. Also, these
groups showed statistically significant differences
associated with their training and continuing education
policy (p=0.0000).
According to Table 2, the performance indicators
related to resource availability, coordination and
integration capacity are highlighted. As observed, again,
groups 4, 5 and 6 present better scores, with statistical
significance, such as having the users’ needs listened
to (p=0.0000), welcoming with risk classification
(p=0.0000) and organized agenda for home visits
(p=0.0000). Records of complaints and team conducts
for care coordination, as well as the existence of a
registry system (p=0.0000) and the presence of an

www.eerp.usp.br/rlae
24 Rev. Latino-Am. Enfermagem 2016;24: e2672
established regulation system (p=0.0000) were other
aspects on which cities 4, 5 and 6 performed better.
Table 3 presents the cities’ performance concerning
the supply or list of services. Cities classified in groups
4, 5 and 6 presented better indicators in terms of
Table 1 – Performance of cities concerning professional qualification and territorialization for users’ access to the universal coverage systems by groups. Program for Better Access and Quality of Basic Care, Brazil, 2012.
Dimension VariablesGroups
1n (%)
2n (%)
3n (%)
4n (%)
5n (%)
6n (%) p value*
Professional Qualification
Do you have or are you taking a complementary degree (n=17,202) 0.000
Yes 1,708 (9.93) 1,795 (10.43) 2,050 (11.92) 2,694 (15.66) 2,460 (14.30) 3,642 (21.17)
No 457 (2.66) 478 (2.78) 477 (2.77) 572 (3.33) 354 (2.06) 515 (2.99)
Is there a career plan (n=16,93.6) 0.000
Yes 253 (1.49) 159 (0.94) 246 (1.46) 574 (3.39) 581 (3.43) 1,810 (10.69)
No 1,877 (11.08) 2,069 (12.22) 2,245 (13.26) 2,647 (15.63) 2,194 (12.95) 2,279 (13.46)
Are there continuing education actions involving basic care professionals (n=17,113) 0.000
Yes 1,432 (8.37) 1,596 (9.33) 1,878 (10.97) 2,601 (15.20) 2,481 (14.50) 3,969 (23.19)
No 720 (4.21) 658 (3.85) 630 (3.68) 650 (3.80) 325 (1.90) 173 (1.01)
Territorialization How many people are under the team’s responsibility 0.0001†
Average 2165 2273 2527 3266 2814 4157
Were risk and vulnerability criteria considered to define the people under the team’s responsibility (n=15,691)
0.0000
Yes 1,024 (6.53) 1,141 (7.27) 1,323 (8.43) 1,705 (10.87) 1,423 (9.07) 2,648 (16.88)
No 951 (6.06) 877 (5.59) 937 (5.97) 1,265 (8.06) 1,115 (7.11) 1,282 (8.17)
Is the team’s coverage group defined (n=17,150) 0.0000
Yes 2,086 (12.16) 2,197 (12.81) 2,456 (14.32) 3,190 (18.60) 2,763 (16.11) 4,113 (23.98)
No 68 (0.40) 60 (0.35) 63 (0.37) 71 (0,41) 43 (0.25) 40 (0.23)
Is there population uncovered by basic care within the coverage group of the team (n=17,092) 0.0000
Yes 369 (2.16) 534 (3.12) 888 (5.20) 1,083 (6.34) 1,391 (8.14) 1,513 (8.85)
No 1,783 (10.43) 1,724 (10.09) 1,618 (9.47) 2,170 (12.70) 1,406 (8.23) 2,613 (15.29)
How frequently does this team attend to people from outside the coverage group (n=16,855) 0.0000
All weekdays 900 (5.34) 828 (4.91) 1,001 (5.94) 1,247 (7.40) 1,255 (7.45) 2,152(12.77)
Some weekdays 966 (5.73) 1,135 (6.73) 1,201 (7.13) 1,502 (8.91) 1,222 (7.25) 1,673 (9.93)
No weekdays 248 (147) 243 (1.44) 266 (1.58) 451 (2.68) 287 (1.70) 178 (1.65)* statistically significant p value (p<0.05).† Application of Kruskal-Wallis test.Source: Database of Program for Better Access and Quality of Basic Care – 1st cycle, Ministry of Health, Brazil, 2012.
sufficient drugs to attend to their population (p=0.0000).
Nevertheless, a larger proportion of professionals
in group 6 reported on the use of alternative or
complementary health practices (p=0.0000).

www.eerp.usp.br/rlae
25Uchôa SAC, Arcêncio RA, Fronteira ISE, Coêlho AA, Martiniano CS, Brandão ICA, et al.
Table 3 – Performance of cities concerning supply and list of services for user access to universal coverage systems according by groups, Program for Better Access and Quality of Basic Care, Brazil, 2012.
Dimension VariablesGroups
1n (%)
2n (%)
3n (%)
4n (%)
5n (%)
6n(%) p value*
Supply Receives sufficient drugs from basic pharmacy to attend to its population (n=17,161) 0.0000
Yes 1,459 (8.50) 1,490 (8.68) 1,722 (10.03) 2,210 (12.88) 1,830 (10.66) 2,898 (16.89)
No 378 (2.20) 457 (2.66) 614 (3.58) 644 (3.75) 718 (4.18) 2,077 (6.28)
Does not receive drugs 316 (1.84) 320 (1.86) 187 (1.09) 406 (2.37) 263 (1.53) 172 (1.00)
Offers integrative and complementary practices to users within the territory (n=17,199) 0.0000
Yes 235 (1.37) 230 (1.34) 305 (1.77) 381 (2.22) 512 (2.98) 1,546 (8.99)
No 1,929 (11.22) 2,042 (11.87) 2,222 (12.92) 2,885 (16.77) 2,301 (13.38) 2,611 (15.18)
Performs home visits (n=17,199) 0.0075
Yes 2,146 (12.48) 2,262 (13.15) 2,521 (14.66) 3,253 (18.91) 2,802 (16.29) 4,148 (24.12)
No 18 (0.10) 10 (0.06) 6 (0.03) 13 (0.08) 11 (0.06) 9 (0.05)
The families within the coverage group are visited periodically according to risk and vulnerability assessments (n=17,132)
0.0000
Yes 1,963 (11.46) 2,069 (12.08) 2,345 (13.69) 2,997 (15.30) 2,621 (15.30) 3,986 (23.27)
No 183 (1.07) 193 (1.13) 176 (1.03) 256 (1.49) 181 (1.06) 162 (0.95)*Statistically significant p value (p<0.05).Source: Database of Program for Better Access and Quality of Basic Care – 1st cycle, Ministry of Health, Brazil, 2012.
Table 2 – Performance of cities concerning the availability of resources, care coordination and integration capacity among services for user access to universal
coverage systems by groups, Program for Better Access and Quality of Basic Care, Brazil, 2012.
Dimension VariablesGroups
1n (%)
2n (%)
3n (%)
4 n (%)
5n (5)
6n (%)
p value*
Availability Users who arrive spontaneously have their needs heard and assessed (n=17,140) 0.0000
Yes 2,121 (12.37) 2,202 (12.85) 2,442 (14.25) 3,180 (18.55) 2,689 (15.69) 4,078 (23.79)
No 38 (0.22) 59 (0.34) 80 (0.47) 83 (0.48) 108 (0.63) 60 (0.35)
The team performs risk and vulnerability assessment in users welcoming (n=13,739) 0.0066
Yes 1,265 (9.21) 1,385 (10.08) 1,645 (11.97) 2,286 (16.64) 2,050 (14.92) 3,442 (25.05)
No 192 (1.40) 221 (1.61) 248 (1.81) 324 (2.36) 236 (1.72) 445 (3.24)
The agenda is organized to make home visits (n=13,951) 0.0000
Yes 1,418 (10.16) 1,628 (11.67) 1,865 (13.37) 2,391 (17.14) 2,253 (16.15) 3,697 (26.50)
No 134 (0.96) 115 (0.82) 114 (0.82) 149 (1.07) 104 (0.75) 83 (0.590)
Care Coordination
Maintains registry of highest-risk users forwarded to other care services (n=17,104) 0.0000
Yes 826 (4.83) 818 (4.78) 1,104 (6.45) 1,474 (8.62) 1,353 (7.91) 2,385 (13.94)
No 1,310 (7.66) 1,439 (8.41) 1,405 (8.21) 1,785 (10.44) 1,449 (8.47) 1,756 (10.27)
Are there documents that prove the coordination (n= 7,960) 0.0000
Yes 605 (7.60) 638 (8.02) 913 (11.47) 1,206 (15.15) 1,132 (14.22) 1,978 (24.85)
No 221 (2.78) 180 (2.26) 191 (2.40) 268 (3.37) 221 (2.78) 407 (5.11)
Are there protocols to guide the prioritization of the cases that need forwarding (n=17,037) 0.0000
Yes 581 (3.41) 613 (3.60) 807 (4.74) 1,213 (7.12) 1,228 (7.21) 2,907 (17.06)
No 1,558 (9.14) 1,636 (9.60) 1,685 (9.89) 2,036 (11.95) 1,567 (9.20) 1,206 (7.08)
Is there a regulation central (n=17,201) 0.0000
Yes 1,880 (10.93) 2,006 (11.66) 2,239 (13.02) 2,907 (16.90) 2,540 (14.77) 4,027 (23.41)
No 284 (1.65) 267 (1.55) 288 (1.67) 359 (2.09) 274 (1.59) 130 (0.76)
Integration Is there a form for forwarding users to the other care services (n=17,201) 0.0000
Yes 1,752 (10.19) 1,828 (10.63) 2,138 (12.43) 2,970 (17.27) 2,615 (15.20) 4,055 (23.57)
No 412 (2.40) 445 (2.59) 389 (2.26) 296 (1.72) 199 (1.16) 102 (0.59)
*statistically significant p value (p<0.05).Source: Database of Program for Better Access and Quality of Basic Care – 1st cycle, Ministry of Health, Brazil, 2012.

www.eerp.usp.br/rlae
26 Rev. Latino-Am. Enfermagem 2016;24: e2672
Discussion
The prevailing participation of nurses as respondents
in all groups reveals their involvement with PHC. The
organization of nurses in international networks,
recognized by the Pan American Health Organization,
highlights this role for universal health coverage(5). In the
assessment of the influence of contextual indicators and
health on professional qualification and territorialization,
groups 4, 5 and 6 showed better performance with a
larger population size and socioeconomic development.
This reflects the unequal distribution of physicians
and qualified nurses, a limiting factor of universal
coverage(3,13). This factor also happens in different
countries, such as the United States, Australia(13),
Mexico, Ghana and Thailand(3), China(14). The strategies
to attract and fix the professionals are context-based
and multifaceted and their qualification in the course of
their career stands out in the global scope(13, 15).
The PMAQ revealed qualification and continuing
education strategies for the teams, combined with the
use of information and communication technologies,
which facilitate the qualification, improve the problem-
solving ability and enhance the communication between
general PHC practitioners and specialists(16).
With regard to territorialization, each health team
attends to an appropriate number of people. In Brazil, the
territorialization gains further depth with the expanded
coverage of the Family Health Strategy, following the
logic supply-service-territory, despite the increasing
flexibility of the territory for the population’s needs,
bonding and accountability. Nevertheless, planning
based on the service logic ends up limiting the supply(17).
On the one hand, Family Health takes form as
a strategy towards universal coverage, including
populations that used to be unattended. On the other
hand, despite respecting parameters, the large number
of people, the wide range of tasks, with promotion,
prevention and treatment for priority groups, chronic
illnesses, strategic situations of vulnerability put a strain
on the professionals(18). The Brazilian experience affirms
that multiprofessional teamwork enhances the different
dimensions of care in view of the expanded coverage(19).
This aspect concerning the greater impact of the primary
care teams’ interprofessional cooperation, particularly
in cases of chronic illnesses, can be observed in the
literature from other countries, clearly showing the need
for clarifications on its potentials and limits(20).
In terms of availability, it is verified that the needs
of the users who spontaneously visit the service are
assessed and attended to in all groups, also with better
performance for groups with larger populations. The
Family Health initiatives to integrate the two types of
demands – spontaneous and scheduled – represent one
of the main challenges for access. There is a change
from technical to user-centered care, the base of the
PHC principles. Based on the international accumulation
of lessons learned since the 1990’s in Denmark and
the United Kingdom, in 2005, the Institute of Medicine
(IOM) launches a proposal to implement it by 2020 as
one of the quality domains of the primary health care
reform in the United States(21).
In this study, the home visit is present on the
agenda of professionals from cities in all groups. The
home visits are fundamental for PHC and are a positive
element of the access. Nevertheless, assessing their
occurrence is not enough. Their impact on the health
conditions and quality of the processes should also be
assessed. In a research undertaken in Germany, it was
revealed that the PHC professionals are in doubt on
their efficacy, consider it as an obligation and do not feel
motivated to make the visits(22). This reflection reveals,
for the Brazilian reality as well, the need to debate with
the professionals on their effects and forms of incentive.
In the forwarding to other care points, despite
significant differences between groups, it is observed
that all groups present hardly satisfactory behavior,
revealing difficulties in user accountability outside
the BHS. Regulation centrals more frequently exist
in the same groups highlighted earlier. These points
reveal weaknesses in the coordination, continuity and
integration of care at the different levels of network
care. The Health Care Networks represent the Brazilian
option to further the access and quality recommended
by the Pan American Health Organization, as a way to
fight the fragmentation and promote the integration of
health systems in Latin America and the Caribbean. In
these systems, despite particularities and complexities,
a range of challenges is faced due to the coexistence of
subsystems and different degrees of integration in the
same system, besides structural issues(23).
Concerning the supply of health actions and
services, statistical significance was verified in the
groups for all aspects assessed, including basic drugs.
According to WHO, the systems that implemented
the universal coverage need to address appropriate
medication use, verify its benefits and avoid waste in
order to guarantee sustainability(24). The low level of
integrative and complementary practices was verified
for users on the territory, as the SUS has recommended
since 2006. In addition, WHO reaffirms the importance
of integrating scientific and traditional medicine for the
purpose of global health(25).

www.eerp.usp.br/rlae
27Uchôa SAC, Arcêncio RA, Fronteira ISE, Coêlho AA, Martiniano CS, Brandão ICA, et al.
Limitations
The generalizability of the external evaluation
committee of the first PMAQ cycle is limited because it
did not cover all teams and worked with a statistically
non-representative sample that, due to feasibility
issues and/or the political nature of the assessment,
presupposes the municipal health manager’s voluntary
adherence. Nevertheless, its unique range across the
Brazilian territory with a homogeneous method, is
undeniable. The cities’ grouping reveals inequities in the
supply, advances and critical knots among the groups
of cities. The main limitation is that, because of its
multifaceted nature, the object needs to be analyzed by
parts. Based on the available data, the needs dimensions
could not be assessed, nor could the effective use of
the services and their impact on population health. The
information was based on “done/not done” answers, and
further depth is needed as to how the actions are being
accomplished and their appropriateness to the demands
and quality parameters. Other studies are needed, using
multiple methods capable of articulating quantitative
data with qualitative case studies, with a view to better
apprehending the complexity of the object.
Conclusions
The study showed that there is a relationship
between access and socioeconomic conditions: as the
group of the cities increases, the access to services
tends to be better. However, within a context of social
inequalities and iniquities, weaknesses are perceived
that jeopardize the organization of health activities in
the cities regarding the availability, care coordination,
integration, and supply, particularly in the cities grouped
in groups 1 to 3. Given the involvement of the nurse
with the organization of health care, this professional
has contributed to the potential access to PHC in Brazil.
The curricula for work in this group are aligned with the
social policies of the SUS, which include contents on
anthropology, sociology, health management, leadership
and health practices in the communities. This factor
makes the nurses more porous to innovations and team
leaderships in the PHC context, with greater motivation
to promote changes, as opposed to low remuneration
in the private sector. Their engagement entails the
challenge of recognition for nursing competencies and
autonomy in prescription and in care not exclusive to the
medical category.
References
1. Abiiro GA, De Allegri M. Universal health coverage
from multiple perspectives: a synthesis of conceptual
literature and global debates. BMC Int Health Hum
Rights. 2015;15(17):1-7.
2. Rodin J. Accelerating action towards universal health
coverage by applying a gender lens. Bull World Health
Organ. 2013;91(9):710-11.
3. Campell J, Buchan J, Cometto G, David B, Dussault
G, Fogstad H et al. Human resources for health and
universal health coverage: fostering equity and effective
coverage. Bull World Health Organ. 2013;91:853-63.
4. Victora CG, Wagstaff A, Schellenberg JA, Gwatkin
D, Claeson M, Habicht JP. Applying an equity lens to child
health and mortality: more of the same is not enough.
The Lancet. 2003;362(1):233-41.
5. Cassiani SHDB. Strategy for universal access to health
and universal health coverage and the contribution of
the International Nursing Networks. Rev. Latino-Am.
Enfermagem. 2014;22(6):891-2.
6. Molina J. Para não perder o trem da história! Rev. esc.
enferm. USP. 2014;48(1):8-17.
7. Pinto HA, Sousa ANA, Ferla AA. O Programa Nacional
de Melhoria do Acesso e da Qualidade da Atenção
Básica: várias faces de uma política inovadora. Saúde
debate. 2014;38(spe):358-72.
8. Noronha JC. Cobertura universal de saúde: como
misturar conceitos, confundir objetivos, abandonar
princípios. Cad. saúde pública. 2013;29(5):847-9.
9. Cardoso MO, Vieira-da-Silva LM. Avaliação da
cobertura da atenção básica à saúde em Salvador,
Bahia, Brasil (2000 a 2007). Cad. Saúde Pública.
2012;28(7):1273-84.
10. Tomasi E, Facchini LA, Thumé E, Piccini RX, Osorio
A, Silveira DS, et al. Características da utilização de
serviços de Atenção Básica à Saúde nas regiões Sul e
Nordeste do Brasil: diferenças por modelo de atenção.
Ciênc. saúde coletiva. 2011;16(1):4395-404.
11. Leão C, Caldeira AP. Avaliação da associação entre
qualificação de médicos e enfermeiros em atenção
primária em saúde e qualidade da atenção. Ciênc. saúde
coletiva. 2011;16(11):4415-23.
12. Taddeo PS, Gomes KWL, Caprara A, Gomes AMA,
Oliveira GC, Moreira TMM. Acesso, prática educativa e
empoderamento de pacientes com doenças crônicas.
Ciênc. saúde coletiva. 2012;17(11):2923-30.
13. Oliveira FP, Vanni T, Pinto HA, Santos JTR, Figueiredo
AM, Araújo SQ et al. Mais Médicos: um programa
www.eerp.usp.br/rlae
28 Rev. Latino-Am. Enfermagem 2016;24: e2672
Received: 31. 5. 2015
Accepted: 7. 8. 2015
Copyright © 2016 Revista Latino-Americana de EnfermagemThis is an Open Access article distributed under the terms of the Creative Commons (CC BY).This license lets others distribute, remix, tweak, and build upon your work, even commercially, as long as they credit you for the original creation. This is the most accommodating of licenses offered. Recommended for maximum dissemination and use of licensed materials.
Corresponding Author:Severina Alice da Costa UchôaUniversidade Federal do Rio Grande do NorteCentro de Ciências da SaúdeRua General Gustavo Cordeiro de Faria, s/nBairro: PetrópolisCEP: 59012-570, Natal, RN, BrasilE-mail: [email protected]
brasileiro em uma perspectiva internacional. Interface
(Botucatu). 2015;19(54):623-34.
14. Wang X, Zheng A, He X, Jiang H. Integration of
rural and urban healthcare insurance schemes in
China: an empirical research. BMC Health Serv Res.
2014;14(42):1-10.
15. Huicho L, Dieleman M, Campbell J, Codjia L,
Balabanova D, Dussault G, et al. Increasing access
to health workers in underserved areas: a conceptual
framework for measuring results. Bull World Health
Organ. 2010;88(5):357-63.
16. Giovanella L, Mendonça MHM, Almeida PF, Escorel
S, Almeida PF, Fausto MCR, et al. Potencialidades e
obstáculos para a consolidação da Estratégia Saúde da
Família em grandes centros urbanos. Saúde em Debate.
2010;34(85):248-64.
17. Faria RM. A Territorialização da Atenção Primária à
Saúde no Sistema Único de Saúde e a construção de
uma perspectiva de adequação dos serviços aos perfis
do território urbano. Hygeia. 2013;9(16):121-30.
18. Souza MB; Rocha PM; Sá AB; Uchoa SAC. Trabalho
em equipe na atenção primária: a experiência de
Portugal. Rev Panam Salud Publica. 2013;33(3):190-5
19. Tesser, CD, Norman AH. Repensando o acesso ao
cuidado na Estratégia Saúde da Família. Saúde soc. São
Paulo. 2014;23(3):869-83.
20. Morgan S, Pullon S, McKinlay E. Observation of
interprofessional collaborative practice in primary care
teams: An integrative literature review. Int J Nurs Stud.
2015;52(7):1217-30.
21. Davis K, Schoenbaum SC, Audet AM. A 2020 Vision
of Patient-Centered Primary Care. J Gen Intern Med.
2005;20(10):953-57.
22. Theile G, Kruschinski C, Buck M, Müller CA,
Hummers-Pradier E. Home visits - central to primary
care, tradition or an obligation? A qualitative study. BMC
Fam Pract. 2011;12(24):1-11.
23. Ramagem C, Urrutia S, Griffith T, Cruz M, Fabrega
R, Holder R, et al. Combating health care fragmentation
through integrated health services delivery networks.
Int J Integr Care. 2011;11(Suppl):1-2.
24. Wagner AK, Quick JD, Ross-Degnan D. Quality
use of medicines within universal health coverage:
challenges and opportunities. BMC Health Serv Res.
2014;14(357):1-6.
25. Falkenberg T, Smith M, Robinson N. Traditional and
integrative approaches for global health. Eur J Integr
Med. 2015;7(1):1-4.