POSTER AND DEMO PAPER - Educational Data Mining
85
POSTER AND DEMO PAPERS Proceedings of the 8th International Conference on Educational Data Mining 552
Transcript of POSTER AND DEMO PAPER - Educational Data Mining

POSTER AND DEMO PAPERS
Proceedings of the 8th International Conference on Educational Data Mining 552

Proceedings of the 8th International Conference on Educational Data Mining 553

Automatic Grading of Short Answers for MOOC viaSemi-supervised Document Clustering
Shumin JingWarner School of Education
University of Rochester, Rochester, NY, [email protected]
ABSTRACTDeveloping an effective and impartial grading system forshort answers is a challenging problem in educational mea-surement and assessment, due to the diversity of answersand the subjectivity of graders. In this paper, we design anautomatic grading approach for short answers, based on thenon-negative semi-supervised document clustering method.After assigning several answer keys, our approach is ableto group the large amount of short answers into multiplesets, and output the score for each answer automatically. Inthis manner, the effort of teachers can be greatly reduced.Moreover, our approach allows the interaction with teachers,and therefore the system performance could be further en-hanced. Experimental results on two datasets demonstratethe effectiveness of our approach.
KeywordsClustering, semi-supervised learning, short-answer grading
1. INTRODUCTIONGrading short answers is a challenging problem in the con-ventional educational measurement and assessment [6, 4],due to the diversity of answers and the subjectivity of graders.Especially, in the era of the massive open online course(MOOC), this problem becomes critical. MOOC providesplenty of courses, and has attracted over 10 million usersduring the past few years. However, traditional assessmentsare not suitable for MOOC. For example, in most MOOCplatforms, short answers appear frequently in various quizzesand exams. Obviously, hiring lots of graders is not a feasi-ble solution. Thus, it is very necessary to develop an au-tomatic grading system for short answers. The automaticgrading system for short-answers has been widely studiedduring the past decade [2]. Most recently, a system named“Powergrading”was presented by Microsoft Research, whichachieved quite impressive performance [1].
We would argue that clustering is a straightforward solution
to automatic grading. For short answer grading, the moti-vation of using clustering is that, the similar short answersshould have high similarity values, while the dissimilar onesshould have low similarity values. Therefore, those similarshort answers could be assigned into the same group. Wecan then infer the final scores of those answers accordingwhich groups they belong to.
In this paper, we aim to design an automatic grading ap-proach for short answers. Our approach is expected to solvethe assessment challenge in MOOC. Moreover, it can alsobe applied to traditional educational assessment scenario, toreduce the efforts of teachers. We will present the methodol-ogy of our approach, discuss its influence in online education,and report the quantitative results and analysis.
2. METHODOLOGY2.1 Feature RepresentationIn our problem, each short answer can be treated as a shortdocument. Let W = {f1, f2, · · · , fm} denote a completevocabulary set of the short answers after the stopwords re-moval and words stemming operations. We can get the term-frequency vector Xi of short answer di as follows
Xi = [x1i, x2i, · · · , xmi]� (1)
xji = tji × log(n
idfi) (2)
where tji, idfi, n denote the term frequency of word fj inshort answer di , the number of short answers containingword fj , and the total number of documents in the corpus,respectively.
By using Xi as a column, we can construct the term-short-answer matrix X.
2.2 Semi-Supervised Clustering for Short-answerGrading
We observe that, the label information of short answers isneglected in the basic document clustering approach. How-ever, by leveraging the expertise of teachers, we can usuallyget some useful information. For example, teachers will tellus which two answers are essentially similar to each other,although they look quite different on the first sight.
To make use of such useful information, we propose a semi-supervised document clustering approach. The basic idea
Proceedings of the 8th International Conference on Educational Data Mining 554

is to add some constraints, including positive ones and neg-ative ones. The former one shows us which short answersare similar, and we can always put them into the same clus-ter. On the other hand, the latter one tells us which shortanswers cannot be grouped together.
Inspired by the semi-supervised clustering algorithm [3, 5],we present the non-negative semi-supervised document clus-tering (SSDC) algorithm for short-answer grading as follows.
Let A = X�X denote the document (e.g., short-answer)similarity matrix. In our approach, we first employ the sym-metric non-negative tri-factorization as follows
A = QSQ� (3)
where Q is the cluster indicator matrix. Each element inQ represents the degree of association of the short-answerdi with cluster j. The cluster membership information isdetermined by seeking an optimization matrix S.
In the semi-supervised setting, we are given two sets of pair-wise constraints on the short-answers, including the must-link constraints CML and cannot-link constraints CCL. Ev-ery pair in CML means this pair of short-answers shouldbelong to the same cluster; every pair in CCL means thispair of short-answers should belong to different clusters.
Then, the objective function of SSDC algorithm is
J = argmin ‖A−QSQ�‖2s.t., S ≥ 0, Q ≥ 0,
(4)
where A = A − R+ + R−. R+ and R− are two penaltymatrices, considering the two constraint sets CCL and CML.
The problem (4) can be solved efficiently using the standardgradient descent algorithm. The update rules of S and Qare given below
Sij = Sij(Q�AQ)ij
(Q�QSQ�Q)ij(5)
Qij = Qij(AQS)ij
(QSQ�QS)ij. (6)
After obtaining the optimized S and Q, we can use them toinfer the cluster labels for each short answer.
Finally, we can assign the score for each short-answer. Forexample, we know that the score of one template answeris 8.0. If another short-answer and this template answerbelong to the same cluster, then the score of this short-answer should be close to 8.0. We also design a weightingstrategy to adjust this score, based on the distance to thetemplate answer.
3. EXPERIMENTSWe utilize the data set provided by Microsoft Research,which is also analyzed in the paper (Basu, Jacobs & Vander-wende, 2013). It contains the responses from 100 and 698crowdsourced workers to each of 20 short-answer questions.These questions are taken from the 100 questions publishedby the United States Citizenship and Immigration Servicesas preparation for the citizenship test. It also contains la-bels of response correctness (grades) from three judges for a
Table 1: The Results on MSR Dataset and MOOCDataset.
Method MSR Dataset MOOC DatasetDC 85.2% 74.1%Semi-supervised DC 87.5% 78.9%
subset of 10 questions for the set of 698 responses (3 x 6980labels).
Besides, we also collect some short answers from MOOCwebsites. We will evaluate the performance of our approachon both datasets.
We evaluate the performance of our approach on the MSRdataset and MOOC dataset. As we have the ground truthinformation, we can report the accuracy of clustering algo-rithms. Table 1 shows the accuracies of our approach andthe baseline method DC under different settings. It showsthat our semi-supervised document clustering method al-ways achieves better performance than DC on two datasets.
4. CONCLUSIONS AND FUTURE WORKWe studied the educational assessment problem in MOOC.In this paper, we proposed an automatic grading approachfor short answers. By leveraging the benefits of documentclustering, our approach was able to assign a large amountof short answers into different groups, and infer their scoresaccordingly. Moreover, we designed a semi-supervised ap-proach, which is able to incorporate the expertise of teach-ers. The proposed approach fits the requirements of MOOC.Results on two datasets showed the effectiveness of our ap-proach. Our paper provides an effective solution to the ed-ucational assessment problem. In the future, we will designmore computer-aided systems to address the educational as-sessment problem.
5. REFERENCES[1] S. Basu, C. Jacobs, and L. Vanderwende.
Powergrading: a clustering approach to amplify humaneffort for short answer grading. TACL, 1:391–402, 2013.
[2] C. Brew and C. Leacock. Automated short answerscoring. Handbook of automated essay evaluation:Current applications and new directions, (136), 2013.
[3] Y. Chen, M. Rege, M. Dong, and J. Hua. Non-negativematrix factorization for semi-supervised dataclustering. Knowl. Inf. Syst., 17(3):355–379, 2008.
[4] P. Ihantola, T. Ahoniemi, V. Karavirta, andO. Seppala. Review of recent systems for automaticassessment of programming assignments. Proceedings ofthe 10th Koli Calling International Conference onComputing Education Research, 2010.
[5] L. Lelis and J. Sander. Semi-supervised density-basedclustering. In ICDM 2009, The Ninth IEEEInternational Conference on Data Mining, Miami,Florida, USA, 6-9 December 2009, pages 842–847, 2009.
[6] C. R. Reynolds, R. B. Livingston, V. L. Willson, andV. Willson. Measurement and assessment in education.Pearson Education International, 2010.
Proceedings of the 8th International Conference on Educational Data Mining 555

Discovering students’ navigation paths in MoodleAlejandro Bogarín
Department of Computer Science University of Cordoba, Spain
(+34) 679 30 54 86 [email protected]
Cristóbal Romero Department of Computer Science
University of Cordoba, Spain (+34) 653 46 28 13
Rebeca Cerezo Department of Psychology University of Oviedo, Spain
(+34) 627 60 70 21 [email protected]
ABSTRACTIn this paper, we apply clustering and process mining techniques to discover students’ navigation paths or trails in Moodle. We use data from 84 undergraduate Psychology students who followed an online course. Firstly, we group students using on Moodle’s usage data and the students’ final grades obtained in the course. Then, we apply process mining with each cluster/group of students separately in order to obtain more specific and accurate trails than using all logs together.KeywordsClustering, process mining, navigation paths, trails in education.
1. INTRODUCTION One of the current promising techniques in EDM (Educational Data Mining) is Educational Process Mining (EPM). The main goal of EPM is to extract knowledge from event logs recorded by an educational system [4]. It have been observed that students show difficulties when learn in hypermedia and Computer Based Learning Environments (CBLEs) due to these environments seems to be highly cognitive and metacognitive demanding [1]. In this sense, the models discovered by EPM could be used: to get a better understanding of the underlying educational processes, toearly detect learning difficulties and generate recommendations to students, to help students with specific learning disabilities, to provide feedback to either students, teachers or researchers, to improve management of learning objects, etc. In a previous work [2], we found two problems when using EPM: 1) the model obtained could not fit well to the general students’ behaviour and 2) the model obtained could be too large and complex to be useful for a student or teacher. In order to solve these problems, we proposed to use clustering to improve both the fitness and comprehensibility of the obtained models by EPM. However, in this paper we propose to use a Hypertext Probabilistic Grammar (HPG) algorithm instead of Heuristics Net [2] because it provides more informative graphs.
2. METHODOLOGY A traditional approach would use all event log data to reveal a process model of student’s behaviour . Nevertheless, in this paper, we propose an approach that uses clustering for improving EPM (see Figure 1). The proposed approach firstly applies clustering in order to group students with similar features. And then, it applies process mining for discovering more accurate models of students’navigation paths or trails. In fact, we propose to use two different grouping methods:
1) Clustering students directly by using the students’ grades obtained in the final exam of the course.
2) Clustering students by using a clustering algorithm over the student’s interaction with the Moodle’s course.
Figure 1: Proposed approach for discovering students’navigation paths.
3. DESCRIPTION OF THE DATA ANDEXPERIMENTS In this work we have used real data collected from 84undergraduate Psychology students who followed a Moodle course. Firstly, we have divided the student’s log provided by Moodle in two different ways. In a first way, we divided directly the original log file into two datasets: one that contains the 68 students who passed the course and other with the 16 students who failed. In the second way, we have used the Expectation-Maximization (EM) clustering algorithm provided by Weka [6] in order to group together students of similar behaviour when usingMoodle. In this case we have obtained three clusters/datasets with the following distribution:
Cluster 0: 23 students (22 pass and 1 fail).
Cluster 1: 41 students (39 pass and 2 fail).
Cluster 2: 20 students (13 fail and 7 pass).
After clustering, we applied EPM through HPG over the previous datasets. We have used the HPG model in order to efficiently mine trails or navigation paths [3]. HPG uses a one-to-one mapping between the sets of non-terminal and terminal symbols. Each non-terminal symbol corresponds to a link between Web pages. Moreover, there are two additional artificial states, called Sand F, which represent the start and finish states of the navigation sessions respectively. The probability of a grammar string is given by the product of the probability of the productions used in its derivation. The number of times a page was requested, and the number of times it was the first and the last page (state) in a session, can easily be obtained from the collection of student navigation sessions. The number of times a sequence of two pages appears in the sessions gives the number of times the corresponding link was traversed. The aim is to identify the subset of these trails that correspond to the rules that best characterize the student’s behavior when visiting the Moodle course. A trail is included only if its derivation probability is above a cut-point.
Proceedings of the 8th International Conference on Educational Data Mining 556

The cut-point is composed of two distinct thresholds (support and confidentiality). The support (Sup) value is for pruning out the strings whose first derivation step has low probability, corresponding to a subset of the hypertext system rarely visited. The confidence (Con) value is used to prune out strings whose derivation contains transitive productions with small probabilities. Support and confidence thresholds give the user control over the quantity and quality of the obtained trails, while Alp modifiesthe weight of the first node in a student navigation session: when
is near 0, only those routes that start in a node which started a session are generated; when is near 1, all weights are completely independent of the order within the session.
4. RESULTS We have carried out several experiments with the HPG algorithm to test several configurations of number of Nodes, Links, Routes, and average route length (Avg). Results obtained when using different datasets and parameters are displayed in Table 1.
Table 1. Results with different datasets and configurations.
Dataset Alp Sup Con Nodes Links Routes Avg
Fail 0,2 0,05 0,5 8 7 12 3,85
Pass 0,2 0,05 0,5 12 11 20 3,81
Cluster0 0,2 0,05 0,5 8 6 12 4,16
Cluster1 0,2 0,05 0,5 9 7 14 4,14
Cluster2 0,2 0,05 0,5 5 4 6 2,75
Fail 0,4 0,06 0,3 15 15 27 3,8
Pass 0,4 0,06 0,3 25 27 47 3,96
Cluster0 0,4 0,06 0,3 13 12 21 3,66
Cluster1 0,4 0,06 0,3 15 17 29 4,11
Cluster2 0,4 0,06 0,3 12 9 18 3,66
Fail 0,5 0,06 0,3 20 19 36 4
Pass 0,5 0,06 0,3 37 41 72 4,07
Cluster0 0,5 0,06 0,3 19 17 31 3,7
Cluster1 0,5 0,06 0,3 20 21 38 4,19
Cluster2 0,5 0,06 0,3 12 9 18 3,66
Table 1 show that the smaller and more comprehensible models were obtained using logs from students who failed (Fail dataset) and students of Cluster 2. On the other hand, the models obtained with the other datasets were much bigger and complex. We think that this may be due to:
Both dataset Fail and Cluster 2 contain mainly information about bad students who failed the course. This type of students has a low interaction with Moodle and so, they show only some frequent navigation paths.
Datasets Pass, Cluster0 and Cluster1 contain mainly information about good students who pass the course. This type of students has a high interaction with Moodle and so,they show more frequent navigation paths.
Finally, we show an example of obtained model when using the Cluster2 dataset. In Figure 2, each node represents a Moodle’s
Web page, and the directed edges (arrows) indicate how the students have moved between them. These paths can be stochastically modeled as Markov chains [5] on the graph, where the probability of moving from one node to another is determined by which Web page the student is currently visiting. Edge thickness varies according to edge weight; this allows the learning designer to quickly focus on the most important edges, ignoring those that have very low weights. In addition, line widths and numerical weights are also available.
Figure 2: Navigation paths of Cluster 2 students. Starting from Figure 2 we can see and detect what are the most frequent actions (view forum X, view questionnaire Y, view quiz Z, etc.) and in which order (navigation paths or trails) were done/followed by Cluster 2 students (normally fail students).
5. REFERENCES [1] Azevedo, R., Behnagh, R., Duffy, M., Harley, J. M., &
Trevors G. J. Metacognition and self-regulated learning in student-centered learning environments. Theoretical foun- dations of student-center learning environments. Erlbaum, Mahwah, NJ, 2nd edition, 216–260, 2012.
[2] Bogarin, A. Romero, C., Cerezo, R., Sanchez, M. Clustering for improving Educational Process Mining. Learning Analytics and Knowledge Conference, Indianapolis, 11-14.
[3] Borges, J., Levene, M. Data Mining of user navigation patterns. Proc. of Workshop Web Usage Analysis and User Profiling. San Diego, 2000. pp. 31-36.
[4] Pechenizkiy, M., Trcka, N., Vasilyeva, E., van der Aalst, W.M., & De Bra, P. 2009. Process Mining Online Assessment. Data. Educational Dada Mining Conference,Cordoba, Spain, 279-288.
[5] Kemeny, J.G., Snell, J.L. Finite Markov chains. Princeton: Van Nostrand. 1960
[6] Witten, I.H., Eibe, F., Hall, M.A. Data Mining, Practical Machine Learning Tools and Techniques. Third Edition. Morgan Kaufman Publishers, 2001.
Proceedings of the 8th International Conference on Educational Data Mining 557

Teacher-Student Classroom Interactions: A Computational Approach
Arnon Hershkovitz School of Education Tel Aviv University Tel Aviv, ISRAEL
Agathe Merceron Media Informatics department
Beuth University of Applied Sciences Berlin, GERMANY
Amran Shamaly School of Education Tel Aviv University Tel Aviv, ISRAEL
ABSTRACTTeacher-student interactions are key to most school-taught lessons. We present a new approach to studying these interactions; this approach is based on a fine-grained data collection, using quantitative field observations (QFOs), which relies on a well-established theoretical framework. The data collected can be analyzed in various methods to address different types of research questions; we give some examples to demonstrate this potential.
KeywordsTeacher-student interactions, quantitative field observations,different analysis approaches.
1. INTRODUCTION Since the early days of Plato, over 2,300 years ago, dialogues were at the heart of the teaching practice. For as long as classroom teaching exists, teacher-student interactions have been the key to most school-taught lessons, hence studying these interactions is decades-old. Many studies in this field that have used classroom observations, often manually documented each occurrence of a teacher-student interaction, usually by observing a small cohort of students at a time or by observing individual students based on an interval-based protocol (e.g., Good & Brophy, 1970; Cameron, Cook & Tankersley, 2012; Luckner & Pianta, 2011). We use a digital data collection tool—a tablet app developed specifically for this purpose—in order to conduct quantitative field observations (QFOs). Although documenting each occurrence of a teacher-student interaction, data is not collected at the student-level (i.e., students are not labeled, only interactions), which makes it feasible to have a single person observing a whole class and still document every interaction during it. Once the class is over, the data is ready to be analyzed. More than that, this fine-grained data is time-stamped, which allows for advanced, including temporal, analyses.
2. THEORETICAL FRAMEWORK Good and Brophy's (1970) method, developed in the context of mathematics education, was probably the first to refer to a single student—as opposed to the whole class—while recording public classroom interactions, hence focusing on dyadic teacher-student interactions. This protocol was later modified by Reyes and Fennema (1981), who considered non-public teacher-student interactions too.
These validated protocols have been in use to study various variables at different grade levels and in many learning settings. Due to their validity, fine granularity and popularity, we find these protocols very suitable for our research. Adapting and extending
the original protocols to better fit to our research setting—mainly to the whole class being observed at all times—we categorize each teacher-student interaction to one of the categories described in the next sub-sections.
2.1 Response Opportunity A response opportunity is a public attempt by an individual student or a group of students to deal with a question posed by the teacher. Interactions that fall under this category take one of four possible values: Direct – the teacher asks a direct question of an individual student; Volunteer – the teacher asks a question, waits for the students to raise their hands, then calls on one of the children who has his hand up; Call Out Single – the teacher asks a question and a student calls out an answer without waiting for permission to respond; Call Out 2+ – the teacher asks a question and more than one student call out an answer without waiting for permission to respond.
2.2 Immediate Contact An immediate interaction is a public, content-related interaction initiated by the teacher, a student or a group of students that is not preceded by a teacher's question. This category again has four values based on the interaction initiator and the number of students involved in it: Teacher to Single, Teacher to 2+, Single to Teacher, 2+ to Teacher.
2.3 Behavioral Contact These are public, behavior-related comments of the teacher. Here too, four values are defined, based on the type of behavior commented and on the targeted audience: Discipline to Single,Discipline to 2+, Appraisal to Single, Appraisal to 2+.
2.4 Procedural Contacts These interactions are public, non-content related; they are related to students' management or to the class management, e.g., permission, supplies, or equipment. Like Immediate, we distinguish the interaction initiator and the number of students involved, hence its four values are: Teacher to Single, Teacher to 2+, Single to Teacher, 2+ to Teacher.
2.5 Non-Public Interactions Non-public interactions are held privately between the teacher and one or more students. As such, we assume not being able to categorize them, therefore we only code whether they were Teacher-Afforded or Student-Initiated.
3. DATA COLLECTION APP As mentioned above, a dedicated data collection app was developed for the purpose of this study. The app, Q-TSI
Proceedings of the 8th International Conference on Educational Data Mining 558

(Quantifying Teacher-Student Interactions), is available for free via Google Play Store1. Besides coding the interaction categories, the app allows documenting the following contextual variables:
Learning Configuration (whole class discussion, group work, pair work, individual work);
Technologies in Use by the Teacher (blackboard, projector, smart board, book – any combination of these are allowed);
Technologies in Use by the Students (book, computer, book and computer);
Teacher Location –on a 4x4 division of the classroom.
Furthermore, the app allows the user to enter any (time-stamped) comment s/he finds useful. These comments might be useful to interpret the results of analyses. The data is stored locally on the observer device as a CSV file.
4. ANALYSES APPROACHES The collected data can be analyzed in various ways in order to address a wide range of research questions. We now describe a few potential research directions we are currently considering (some will be demonstrated in the poster).
4.1 Visualization Visualization can be a powerful tool to have an overall understanding of the classroom dynamics. Teachers can gain awareness and reflect upon their interactions with their students during the class. A typical visualization may include a time-ordered representation of the interactions, differentiated by type (e.g., by color, marker), along with values of the contextual variables. Such visualizations may assist in initially having an overview of the kinds of interactions that happen, exploring differences within classes, based on, e.g., learning configuration or technologies in use, or between classes, based on, e.g., teacher,school, grade-level, subject matter, time of day, etc.
4.2 Statistics Basic statistics may shed light on the overall distribution of the different types of interactions in a lesson, as well as on differences within and between classes (based on variables as such as were mentioned in 4.1 Visualization).
4.3 Time-based Patterns Association rules, time series, statistical discourse analysis and epistemic network analysis may assist in understanding whether there are specific interactions that often occur jointly or in connection, possibly, in some specific order or in a specific context, and how occurrences of interactions evolve over time. Time in our context has at least two levels of granularity: the lesson granularity (i.e., what happens during one lesson) and the school year granularity (i.e., what happens in lessons over the weeks).
1 https://play.google.com/store/apps/details?id=com.gil.q_tsi
4.4 Cluster Analysis Clustering techniques can be used to explore whether classes can be classified according to typical patterns of interactions. Several ways of describing a lesson and, consequently, of comparing lessons, can be investigated. For instance, a mere quantitative analysis can be used to characterize a lesson, that is, counting interactions and using the Euclidean distance (or alike) for clustering. A lesson can also be described as a sequence of different interactions over time, then using the Levenshtein distance (or alike) for clustering. It might be necessary to define several abstraction levels for the interactions.
4.5 Prediction It might be possible to predict different types of interactions based on historical data, or based on contextual variables. A possible prediction might look like: "three <Response opportunity: Call out 2+> interactions and two <Procedural: Teacher to single> interactions are followed by a <Discipline: Single> interaction in 85% of the instances." Several techniques will be considered to investigate this kind of patterns, in particular, classification techniques enriched with time series and statistical discourse analysis.
4.6 Collecting More Data In the future, additional data will be collected, such as students' log files, performance, meta-cognitive and affective measures, in order to enrich the data with more layers. These layers will allow, in turn, to ask even more questions about the data and to better investigate the role of teacher-student interactions in the learning/teaching process.
5. ACKNOWLEDGMENTS This research is partially funded by the European Commission's Marie Curie Career Integration Grant (CIG) 618511/ARTIAC.
6. REFERENCES [1] Brophy, J.E. & Good, T.L. 1969. Teacher-child dyadic
interaction: A manual for coding classroom behavior (Report Series No. 27). Austin, TX: Texas University.
[2] Cameron, D.L., Cook, B.G., & Tankersley, M. 2012. An analysis of the different patterns of 1:1 interactions between educational professionals and their students with varying abilities in inclusive classrooms. International Journal of Inclusive Education, 16, 12, 1335-1354.
[3] Good, T.L. & Brophy, J.E. (1970). Teacher-child dyadic interactions: A new method of classroom observation.Journal of School Psychology, 8(2), 131-138.
[4] Luckner, A.E. & Pianta, R.C. 2011. Teacher–student interactions in fifth grade classrooms: Relations with children's peer behavior. Journal of Applied Developmental Psychology, 32, 5, 257-266.
[5] Reyes, L. & Fennema, E. (1981). Classroom Processes Observer Manual. Madison, WI: Wisconsin Center for Education Research.
Proceedings of the 8th International Conference on Educational Data Mining 559

Modeling Student Learning: Binary or Continuous Skill?
Radek PelánekMasaryk University [email protected]
ABSTRACTStudent learning is usually modeled by one of two main ap-proaches: using binary skill, with Bayesian Knowledge Trac-ing being the standard model, or using continuous skill, withmodels based on logistic function (e.g., Performance FactorAnalysis). We use simulated data to analyze relations be-tween these two approaches in the basic setting of studentlearning of a single skill. The analysis shows that althoughdifferent models often provide very similar predictions, theydiffer in the impact on student practice and in the meaning-fulness of parameter values.
Keywordsstudent modeling; learning; Bayesian Knowledge Tracing;simulated data
1. INTRODUCTIONIn this work we focus on modeling of student learning in thebasic setting: we assume that for each student we have asequence of answers related to a single skill and we consideronly correctness of these answers, i.e., we do not take intoaccount additional information like response times or par-tial correctness due to the use of hints. We work only withbasic models and focus on experiments with simulated data.This setting is of course a coarse simplification, since in areal application we typically have some additional informa-tion on student answers, questions are related to multipleskills, and model extensions are used. But in order to suc-cessfully use complex models, it is necessary to have deepunderstanding of the base case and this understanding is stilllacking. There are many feasible modeling approaches, butthey are usually proposed and studied independently andtheir relations, similarities, and differences have not beenwell studied. The use of simulated data allows us to ana-lyze behaviour of models in detail thanks to the knowledgeof “ground truth” values; moreover, we can manipulate incontrolled way generation of data and thus easily evaluatebehaviour of models under different assumptions.
2. MODELING STUDENT LEARNINGMost approaches to modeling of student learning can beviewed as hidden Markov models (also called latent processmodels, state-space models). We assume a hidden (latent)state variable (called “skill”) and two types of equations.Observation equation describes the dependence of observedvariables (correctness of answers) on the hidden variable(skill). State equation describes the change of the hiddenvariable (i.e., learning). There are two main types of modelsdepending on whether the latent skill is binary or continu-ous. It is in principle possible to consider discrete skill withmore than two states, but such models are not commonlyused. The standard form of a binary skill model is BayesianKnowledge Tracing (BKT) [1]. Models based on continu-ous latent skill typically use logistic function for observationequation, they differ in their approach to skill estimation.
Bayesian Knowledge Tracing assumes a sudden change inknowledge. It is a hidden Markov model where skill is abinary latent variable (either learned or unlearned). Fig-ure 1 illustrates the model; the illustration is done in a non-standard way to stress the relation of the model to the modelwith continuous skill. The estimated skill is updated using aBayes rule based on the observed answers; the prediction ofstudent response is then done based on the estimated skill.Note that although the model is based on the assumption ofbinary skill, the skill estimate is actually continuous number(in the [0, 1] interval).
Models which utilize the assumption of continuous latentskill consider skill in the (−∞,∞) interval and for the rela-tion between the skill and the probability of correct answeruse the logistic function σ(x) = 1
1+e−x . Although it wouldbe possible to consider also other functions, the logistic func-tion is currently the standard choice. As a simple model oflearning we consider a simple linear growth of the skill (Fig-ure 1). More specifically, for the initial skill θ0 we assumenormally distributed skill θ0 ∼ N(μ, σ2) and for the changein learning we consider linear learning θk = θ0+k ·Δ, whereΔ is either a global parameter or individualized learning pa-rameter (in that case we assume a normal distribution of itsvalues). This model is a simplified version of the AdditiveFactors Model [3]; the original additive factor model usesmultiple skills. A principled way of estimating continuousskills is the Bayesian approach, which computes not just apoint estimate of skill, but a distribution over skill capturingalso the uncertainty of the estimate. This approach be im-plemented for example using particle filter, i.e., discretized
Proceedings of the 8th International Conference on Educational Data Mining 560

binary skill
continuous skill
P(co
rrect
)
skill0 10
1
P
P
PP
guess
slip
initlearn
1
6 4 0 2 4 6skill
P(co
rrect
)
init
learn
Figure 1: Binary and continuous skill models of stu-dent learning – high level overview.
representation of posterior distribution. A more pragmaticapproach to skill estimation is Performance Factor Analy-sis [5], which computes the skill estimate as a linear com-bination of the number successes and failures of a student.This approach can be extended to take into account orderingof attempts and time intervals between them [2, 4].
Which type of model is better depends on the learning sit-uation. Binary skill models assume a sudden switch fromunlearned to learned state. Such assumption is appropriatemainly for fine-grained skills which require understandingor insight (such as “addition of simple fractions”). Modelswith continuous skill assume gradual increase of skill. Thisis appropriate either for modeling coarse-grained skills (e.g.,“fractions” as a single skill) or for situations where gradualstrengthening happens (e.g., memorizing facts).
3. EXPERIMENTSTo analyze the described models and relations between themwe performed experiments with simulated data. We gener-ated simulated data by one of the models and then analyzedthe generated data using both models with binary and con-tinuous skills. For generating data we used 10 scenarios withdifferent parameter settings.
With respect to accuracy of predictions the results showthat both types of models bring consistent improvement overbaselines like moving average and time decay models [6].The basic comparison of binary and continuous skill modelsis also not surprising: each approach dominates in scenar-ios which correspond to its assumptions. Nevertheless, inmany cases the differences are small and the predictions areactually highly correlated.
Models are not used only for predictions, but they may beuseful in themselves for system developers and researchers.Plausible and explainable model parameters may be used toget insight into behaviour of tutoring systems and also for“discovery with models” (higher level modeling). Results ofour analysis show that in the case when there is a mismatchbetween source of the data and a model, interpretation ofparameters may be misleading. As a specific example con-sider simulated students behaving according to the contin-uous model with θ0 ∼ N(−1, 1),Δ = 0.2. Here the fittedBKT guess and slip parameters are 0.24 and 0.16. Intuitiveinterpretation of BKT parameters would thus suggest highchance of guessing an answer. In the ground truth model,however, chance of guessing converges to zero for unskilledstudents.
One of the main applications of student models is to guidethe behaviour of adaptive educational systems. A typical ex-ample is the use of student models for mastery learning – stu-dents have to practice certain skill until they reach mastery,the attainment of mastery is decided by a student model.Mastery is declared when a skill estimate is higher thana given threshold. How does the choice of student modeland a threshold impact student practice? Our results showthat the BKT model is relatively insensitive to the choiceof the threshold and that the model provides weak decisionsfor scenarios with continuous learning, specifically when thelearning rate is low. Continuous skill models can providegood decision for all scenarios if used with a good threshold.However, optimal thresholds differ significantly for scenarioswith binary skill and continuous skill.
To summarize, our study with simulated data suggests thatthe choice between models with binary and continuous skilldoes not seem a key concern as long as we are interestedonly in predictions of students’ answers, but it can havesignificant impact on parameter interpretation and masterylearning.
4. REFERENCES[1] A. T. Corbett and J. R. Anderson. Knowledge tracing:
Modeling the acquisition of procedural knowledge. Usermodeling and user-adapted interaction, 4(4):253–278,1994.
[2] A. Galyardt and I. Goldin. Recent-performance factorsanalysis. In Educational Data Mining, 2014.
[3] Tanja Kaser, Kenneth R Koedinger, and Markus Gross.Different parameters - same prediction: An analysis oflearning curves. In Educational Data Mining, pages52–59, 2014.
[4] J. Papousek, R. Pelanek, and V. Stanislav. Adaptivepractice of facts in domains with varied priorknowledge. In Educational Data Mining, pages 6–13,2014.
[5] P. I. Pavlik, H. Cen, and K. R. Koedinger. Performancefactors analysis-a new alternative to knowledge tracing.In Artificial Intelligence in Education, volume 200,pages 531–538. IOS Press, 2009.
[6] R. Pelanek. Time decay functions and Elo system instudent modeling. In Educational Data Mining (EDM),pages 21–27, 2014.
Proceedings of the 8th International Conference on Educational Data Mining 561

An Analysis of Response Times in Adaptive Practice ofGeography Facts
Jan PapoušekMasaryk University Brno
Radek PelánekMasaryk University Brno
Jirí RihákMasaryk University [email protected]
Vít StanislavMasaryk University Brno
ABSTRACTOnline educational systems can easily measure both answersand response times. Student modeling, however, typicallyfocuses only on correctness of answers. In this work we ana-lyze response times from a widely used system for adaptivepractice of geography facts. Our results show that responsetimes have simple relationship with the probability of an-swering correctly the next question about the same item.We also analyze the overall speed of students and its re-lation to several aspects of students’ behaviour within thesystem.
1. INTRODUCTIONWhen students use computerized educational systems, wecan easily store and analyze not just their answers and theircorrectness, but also the associated response times. Re-sponse times carry potentially useful information about bothcognitive and affective states of students.
Response times have been studied thoroughly in item re-sponse theory in the context of computerized adaptive test-ing, for an overview of used models see [5]. But testing andlearning settings differ in many aspects, including responsetimes – for example we would expect students to think forlonger time in the case of high stake testing than in practicesession (there are differences even between high-stakes andlow-stakes testing [2]).
Response times have been used previously in the context ofstudent modeling for intelligent tutoring systems, e.g., formodeling student knowledge in the extension of BayesianKnowledge Tracing [6] or for modeling student disengage-ment [1]. But overall the use of response times has beenso far rather marginal. In this work we analyze responsetimes from an adaptive system for practice of facts, whichis a specific application domain where response times havenot been analyzed before.
2. THE USED SYSTEM AND DATAFor the analysis we use data from an online adaptive systemslepemapy.cz for practice of geography facts (e.g., namesand location of countries, cities, mountains). The systemuses student modeling techniques to estimate student knowl-edge and adaptively selects questions of suitable difficulty [4].The system uses open questions (“Where is Rwanda?”) andmultiple-choice questions (“What is the name of the high-lighted country?”) with 2 to 6 options.
The system uses a target success rate (e.g., 75 %) and adap-tively selects questions in such a way that the students’achieved performance is close to this target [3]. The systemalso collects users’ feedback on question difficulty – after 30,70, 120, and 200 answers the system shows the dialog“Whatis the difficulty of asked questions?”, students choose one ofthe following options: “Too Easy”, “Appropriate”, “Too Dif-ficult”.
For the reported experiments we used the following dataset:54 thousand students, 1458 geography facts, over 8 millionanswers and nearly 40 thousand feedback answers.
3. RESULTSWe provide basic analysis of response times, and their rela-tion to student knowledge and to students’ behaviour withinthe adaptive practice system.
3.1 Basic Characterization of Response TimesDistribution of response times is skewed, in previous work itwas usually modeled by a log-normal distribution [5]. Ourdata are also approximately log-normal, therefor as a mea-sure of central tendency we use median or mean of log times.
Response times clearly depend on the type of question andon specific item. Our results for example show, that responsetimes are higher for cities and rivers than for countries andregions (states are larger than cities on the used interactivemap and therefore it is easier to click on them). Responsetimes are also on average higher for countries in Asia thanin South America (there is larger number of countries on themap of Asia).
For the below presented analysis we use percentiles of re-sponse times over individual items – these are not influencedby skew and provide normalization across different items.
Proceedings of the 8th International Conference on Educational Data Mining 562

Figure 1: Response times and probability that the (next) answer is correct.
3.2 Response Times and Students KnowledgeFigure 1 shows the relationship between response times andcorrectness of answers. The relationship between responsetime and correctness of the current answer is non-monotonic– very fast responses combine “solid knowledge” and “pureguessing”, long responses mostly indicate “weak knowledge”.The highest change of correct answers is for response timesbetween 10th and 20th percentile, i.e., answers that are fast,but not extremely fast.
We get a more straightforward relationship when we analyzecorrectness of the next answer (about the same item) basedon both the correctness and response time for the currentanswer. If the current answer is correct then the probabilityof correct next answer is linearly dependent on the responsetime – it goes from 95% for very fast answers to nearly 80%for slow answers. If the current answer is incorrect thenthe dependence on response time is weaker, but there isstill (approximately linear) trend, but in this case in theother direction. When the current answer is incorrect, longerresponse time actually means higher chance that the nextanswer will be correct!
A limitation of the current analysis is that we do not takeinto account types of questions (the number of availablechoices and the related guess factor) or the adaptive be-haviour of the system (the system asks easier questions whenknowledge is estimated to be low). However, we do not ex-pect these factor to significantly influence the reported re-sults, which quite clearly show that response times are usefulfor modeling knowledge and that it is important to analyzeresponse times separately for correct and incorrect answers.
3.3 Speed of StudentsAs a next step we analyze not just response times for sin-gle answers, but over longer interaction with the system.Statistics of response times may indicate affective states orcharacterize a type of student. For this preliminary anal-ysis we have classified students as fast/slow depending ontheir median response time and we analyzed correlationswith other aspects of their behaviour (in similar way and
with analogical results we have also analyzed variance of re-sponse time). The reported results do not necessary implydirect relationship as they may be mediated by other factors(like difficulty of presented items).
Slower students answer smaller number of questions in thesystem. In fact the overall time in the system is nearly thesame for students with different speeds, i.e., slower studentsjust solve smaller number of questions during this time.Faster students have higher prior skill and are more likely toreturn to the system to do more practice. In the feedbackon question difficulty slower students report more difficultimpression. Possible application of these results is incor-poration of students’ speed into the algorithm for adaptiveselection of questions (e.g., by selecting easier questions forslower students).
4. REFERENCES[1] J. E. Beck. Using response times to model student
disengagement. In Proc. of the ITS2004 Workshop onSocial and Emotional Intelligence in LearningEnvironments, pages 13–20, 2004.
[2] Y.-H. Lee and H. Chen. A review of recentresponse-time analyses in educational testing.Psychological Test and Assessment Modeling,53(3):359–379, 2011.
[3] J. Papousek and R. Pelanek. Impact of adaptiveeducational system behaviour on student motivation. InArtificial Intelligence in Education, 2015.
[4] J. Papousek, R. Pelanek, and V. Stanislav. Adaptivepractice of facts in domains with varied priorknowledge. In Educational Data Mining, pages 6–13,2014.
[5] W. J. Van Der Linden. Conceptual issues inresponse-time modeling. Journal of EducationalMeasurement, 46(3):247–272, 2009.
[6] Y. Wang and N. Heffernan. Leveraging first responsetime into the knowledge tracing model. In EducationalData Mining, pages 176–179, 2012.
Proceedings of the 8th International Conference on Educational Data Mining 563

Achievement versus Experience: Predicting Students’ Choices during Gameplay
Erica L. Snow1, Maria Ofelia Z. San Pedro2, Matthew Jacovina1, Danielle S. McNamara1, Ryan S. Baker2
1Arizona State University, Learning Sciences Institute, 1000 S. Forest Mall, Tempe, AZ 85287 2Teachers College Columbia University, 525 W 120th St. New York, NY 10027
[email protected], [email protected], [email protected], [email protected], [email protected]
ABSTRACT This study investigates how we can effectively predict what type of game a user will choose within the game-based environment iSTART-2. Seventy-seven college students interacted freely with the system for approximately 2 hours. Two models (a baseline and a full model) are compared that include as features the type of games played, previous game achievements (i.e., trophies won, points earned), and actions (i.e., iBucks/points spent, time spent on games, total games played). Using decision tree analyses, the resulting best-performing model indicates that students’ choices within game-based environments are not solely driven by their recent achievement. Instead a more holistic view is needed to predict students’ choices in complex systems.
Keywords Game-based environments, Modeling, Decision tree analysis
1. INTRODUCTION Game-based environments often afford fine-grained examinations of patterns in students’ behaviors during gameplay and how they are related to cognitive skills and learning outcomes [1,2]. However, such previous work has not examined the driving force behind why a student chooses a specific activity or interaction within a game environment. In the current work, we compare two models. The first model is a parsimonious “1-back” model that assumes that students’ choices are directly related to (and predicted by) their most recent game choice within the system and their achievements (in terms of the type of trophy won). Thus, if a student is performing well in one activity, they will continue to play that activity (or one similar to it) – achievement behavior [3]. The second, full model assumes that students’ choices (of game type in this case) are related more comprehensively to a holistic combination of their previous experiences within the environment, including the types of games played, game achievements, and actions. This model follows the assumption that students’ choices are influenced by a range of factors that is broader than their most recent choice and achievements. This paper is an exploratory study that attempts to answer: what impacts students’ choices within game-based environments?
1.1 iSTART-2 Our analysis is conducted within the context of the Interactive Strategy Training for Active Reading and Thinking-2 (iSTART-2) system, designed to provide students with self-explanation strategy instruction to improve reading comprehension [1, 4]. After viewing five instructional videos, each covering a reading strategy, students are transitioned to a practice interface in which
they can engage with a suite of educational games. Games involve either generative or identification practice. Generative practice games require students to type their own self-explanations while reading a text. Identification mini-games require students to read self-explanations that are ostensibly written by other students, and select which of the five strategies was used to generate each self-explanation. Students receive feedback about whether their choice was correct or incorrect.
iSTART-2 offers an ideal environment to explore questions about choice within open learning environments because students are free to choose which practice games to play. During each of the practice games, students earn points for writing high quality self-explanations or selecting the correct strategies. Based on students’ score at the end of each game, theycan earn trophies (gold, silver, bronze), iSTART Points, and iBucks. iSTART Points determine students’ current level within the system. iBucks are the system currency and can be spent to customize players’ avatars, change background colors, or buy access to the identification games. In the current study, they were provided with an abundance of iBucks to allow them to freely interact with all features.
2. METHODS 2.1 Participants and Procedure The study included 77 students (18-24 years) from a large University in the Southwest US. We conducted a 3-hour session consisting of a pretest, strategy training (via iSTART-2), extended game-based practice within iSTART-2, and a posttest. For our analyses here, we solely examined data from the time students spent in the game-based practice menu of iSTART. Each student spent approximately 2 hours interacting freely within the game-based interface, with his or her actions logged into the iSTART-2 database.
2.2 Development of Machine-Learned Models of Game Choice To develop models that predict next game choice from previous achievement in an iSTART-2 game, we distilled features from the interaction logs of the 77 students who interacted with iSTART-2. A total of 1,562 action records were created for these 77 students, where each action record had 13 distilled features. Each record was labeled with the current game choice (at time n; 1 = identification game, 0 = generative game), having features corresponding to information about previous gameplay actions (at time n-1) in either an identification game or a generative game. In developing the two models to predict students’ game choice, we employed student-level cross-validation for a decision tree classifier that uses the J48 implementation [5] that builds a
Proceedings of the 8th International Conference on Educational Data Mining 564

decision tree from a set of labeled training data. The baseline 1-back model included 2 features: previous type of game played, and type of trophy earned on the previous game. The full model included 11 additional features. The features that involved prior gameplay achievements and actions included: the number of iBucks won/spent, the number of iBuck bonus points won/spent, and the number of iSTART points won/spent the previous time the student played that game type. The remaining five features were aggregates of a student’s achievements and actions so far: number of trophies achieved, number of generative games played, number of identification games played, average time played in a generative game, and average time played in an identification game.
3. RESULTS For the 1-back model that predicts game choice based solely on previous game choice and achievement, students in our data set played a total of 1,562 games in iSTART – 1,144 instances of an identification game played and 418 instances of a generative game. The baseline model performed poorly under student-level cross-validation (see Table 1). This results in an imbalance, with precision of 38.46% and recall of 4.78%. The cross-validated A' is 0.603 (correctly predicted a game choice to be an identification game 60.3% of the time) and cross-validated Cohen’s Kappa is 0.208 (model’s accuracy was only 2.8% better than chance). This baseline model mainly predicts that students who have just played an identification game will select another identification game, regardless of their trophy achievement. It also predicts that many students who have just played a generative game, but did not receive any trophy, will select an identification game next. Table 1. Cross-validated confusion matrix of baseline model
Identification Game (True) Generative Game (True)Identification Game
(Predicted) 1112 398
Generative Game (Predicted) 32 20
The second model resulted in the best-performing J48 tree with six features: (1) type of trophy from previous game played, (2) number of identification games played so far, (3) number of generative games played so far, (4) iSTART bonus iBucks spent in previous interaction, (5) iSTART points won in previous game, and (6) iSTART iBucks spent in previous interaction. Table 2. Cross-validated confusion matrix of comprehensive model
Identification Game (True) Generative Game (True)Identification Game
(Predicted) 1069 125
Generative Game (Predicted) 75 293
This second model performed significantly better under cross-validation, classifying 1194 game choices as identification games, and 368 game choices as generative games (see Table 2), with a precision of 80.45% and recall of 70.10%. Our cross-validated A' and Cohen’s Kappa also increased considerably, to A' = 0.907 and Cohen’s Kappa = 0.660. Our second model yields a decision tree size of 61, with 34 decision rules (paths from root to leaf). Some examples of rules within this model include: 1) IF a student has at least played one generative game so far, AND
spent more than 50 iSTART iBucks, THEN the next game the student will play is an IDENTIFICATION GAME (Confidence: 99.5%).
2) IF in a previous game the student won more than 610 iSTART points in a previous game, but spent 861 or fewer iSTART iBucks in a previous game, THEN the next game the student will play is an IDENTIFICATION GAME (Confidence: 97.0%).
3) IF a student has not played any generative game so far, AND spent no iSTART iBucks in a previous game, AND has received a BRONZE trophy in the previous game played, THEN the next game the student will play is an GENERATIVE GAME (Confidence: 83.33%).
4) IF a student has not played any generative game so far, AND spent no iSTART iBucks in a previous game, AND has received a SILVER trophy in the previous game played, THEN the next game the student will play is an GENERATIVE GAME (Confidence: 100%).
4. DISCUSSION Results from this exploratory analysis suggest that students’ choices in activities do not rely solely on previous game trophy achievement or previous game choice (first baseline model), but instead students’ choices seem to be guided by their overall experience and interactions within the system (second comprehensive model). While this finding is not entirely surprising, it does help researchers shed light upon which features in a game-based environment are impacting students’ choices. Indeed, there are many factors that impact students’ choices within game-based environments. Thus, within environments where students are afforded a high amount of agency, user models will benefit by incorporating a more complete set of interaction features as a means to represent students’ game experience more completely. In the future, we will employ Markov analyses in combination with decision tree analysis in an effort to gain a deeper understanding of what drives students’ choices within a game-based environment. Although interactions within agency-driven environments are highly complex, this project demonstrates that they are predictable using machine learning algorithms.
5. ACKNOWLEDGMENTS This research was supported in part by IES (R305A130124) and NSF (REC0241144; IIS-0735682).
6. REFERENCES [1] Snow, E. L., Allen, L. K., Jacovina, M. E., & McNamara, D. S.
2015. Does agency matter?: Exploring the impact of controlled behaviors within a game-based environment. Computers & Education. 26, (2015), 378-392.
[2] Sabourin, J., Shores, L. R., Mott, B. W., & Lester, J. C. 2012. Predicting student self-regulation strategies in game-based learning environments. In ITS 2012 (pp. 141-150). Springer Berlin Heidelberg.
[3] Nicholls, J. G. 1984. Achievement motivation: Conceptions of ability, subjective experience, task choice, and performance. Psychological review, 91, (1984) 328-342.
[4] Jackson, G. T., and McNamara, D. S. 2013. Motivation and Performance in a game-based intelligent tutoring system. Journal of Educational Psychology, 105, (2013), 1036-1049.
[5] Witten, I. H., & Frank, E. 2005. Data Mining: Practical machine learning tools and techniques. Morgan Kaufmann.
Proceedings of the 8th International Conference on Educational Data Mining 565

How to Aggregate Multimodal Features for Perceived TaskDifficulty Recognition in Intelligent Tutoring Systems
Ruth JanningInformation Systems and
Machine Learning LabUniversity of [email protected]
hildesheim.de
Carlotta SchattenInformation Systems and
Machine Learning LabUniversity of [email protected]
hildesheim.de
Lars Schmidt-ThiemeInformation Systems and
Machine Learning LabUniversity of Hildesheim
hildesheim.de
ABSTRACTCurrently, a lot of research in the field of intelligent tutor-ing systems is concerned with recognising student’s emo-tions and affects. The recognition is done by extractingfeatures from information sources like speech, typing andmouse clicking behaviour or physiological sensors. Multi-modal affect recognition approaches use several informationsources. Those approaches usually focus on the recognitionof emotions or affects but not on how to aggregate the mul-timodal features in the best way to reach the best recog-nition performance. In this work we propose an approachwhich combines methods from feature selection and ensem-ble learning for improving the performance of perceived taskdifficulty recognition.
1. INTRODUCTIONSome research has been done in the area of intelligent tutor-ing systems to identify useful information sources and ap-propriate features able to describe student’s emotions andaffects. However, work on multimodal affect recognition inthis area focuses more on engineering appropriate featuresfor affect recognition than on the problem of aggregating thefeatures from the different information sources in an goodway. The usual approach is to use one classification modelfed with one input vector containing the concatenated fea-tures (maybe reduced by feature selection) like in [3] or usingstandard ensemble methods on the features of the sourcesseparately like in [4]. In this paper instead we propose tomixing up the different feature types and combining meth-ods from feature selection and ensemble approaches to reacha classification performance improvement compared to usingonly either methods from feature selection or ensemble ap-proaches. Feature selection methods can be used to reducethe number of features and find good combinations of fea-tures. They take advantage of statistical information likecorrelations. Ensemble methods like stacking use multiplelearning models to obtain a better prediction performance.
Figure 1: Multimodal feature aggregation approach.
Stacking learns to combine the classification decisions of sev-eral single classifiers by a further classifier which gets as in-put the outputs of the other classifiers.
2. MULTIMODAL FEATUREAGGREGATION
We propose to profit from the advantages of both featureselection methods and ensemble methods. Hence, we com-bine both (see fig. 1): In a first step the feature vectorsof all l feature types are concatenated to reach one inputfeature vector (f0, . . . , fn). However, there could be depen-dencies between the different features. Hence, we createthe correlation matrix reporting about the correlations be-tween each pair of features. By means of this matrix weextract for each single feature fy a set uncorry contain-ing all other features fx not correlated to fy. Not corre-
lated means in this case that the correlation value vx,y ofthe pair (fx, fy) in the correlation matrix is near to 0.0, ormore explicitly, |vx,y | is smaller than some positive thresh-
Proceedings of the 8th International Conference on Educational Data Mining 566

Table 1: Classification errors and F-measures.(1) SVM applied to amplitude features
31.25% (0.75, 0.59)SVM applied to articulation features
22.92% (0.81, 0.72)(2) SVM applied to all concatenated features
27.08% (0.77, 0.67)(3) SVM applied to most uncorrelated features
20.83% (0.81, 0.77)(4) Stacking applied to uncorry sets
20.83% (0.83, 0,74)(5) Stacking applied to uncorr2y sets
16.67% (0.86, 0.80)(6) Stacking applied to uncorr2y sets with best AIC
8.33% (0.92, 0.91)
old t, i.e. uncorry := {fy} ∪ {fx | t > |vx,y|}. The setuncorry contains all features uncorrelated to fy but be-tween the features within this set there could still be cor-relations. Consequently, we compute for each feature fya set uncorr2y := {fy , fa, . . . , fk} where fy , fa, . . . , fk allare uncorrelated. These sets uncorr2y are gained for eachfeature fy by sequentially intersecting uncorry with the setsbelonging to the features within uncorry , or the intersectionrespectively. Different to feature selection, our goal is not tocreate one feature vector with reduced dimensionality butwe aim at creating one feature vector per feature which willbe fed into an own classifier, to consider each feature and todeliver as many input as needed for the ensemble method.Nevertheless, we remove some of the uncorr2y sets. The rea-son is that there is still some statistical information whichwe did not yet use: the quality of the models using thesesets as input. Hence, for each set uncorr2y we compute theAkaike information criterion (AIC) – indicating the qualityof a model. Subsequently, we remove the worse quarter ofthe sets. The remaining sets are fed into an support vectormachine (SVM) each. In the next step we apply a stackingensemble approach by feeding the outputs, i.e. the classi-fication decisions, of the SVMs into a further SVM, whichlearns how to generate one common classification decision.
3. EXPERIMENTSWe prove our proposed multimodal feature aggregation ap-proach by experiments with a real data set and multimodallow-level speech features. The data were gained by con-ducting a study in which the speech of ten 10 to 12 yearsold German students was recorded and their perceived task-difficulties were labelled by experts. During the study apaper sheet with fraction tasks was shown to the studentsand they were asked to explain their observations and an-swers. The acoustic speech recordings were used to gain twokinds of low-level speech features: amplitude and articula-
tion features. The amplitude features ([1]) are taken fromthe raw speech data, or information about speech pausesrespectively: ratio between (a) speech and pauses, (b) num-ber of pause/speech segments and number of all segments,(c) avg. length of pause/speech segments and max. lengthof pause/speech segments, (d) number of all segments andnumber of seconds, and percentage of pauses of input speechdata. The idea behind this kind of features is that dependingon how challenged the student feels, the student makes moreor less and shorter or longer speech pauses. The articula-
tion features ([2]) are gained from an intermediate step ofspeech recognition which delivers information about vow-
els and consonants: ratio between (a) number of silencetags and number of all tags, (b) avg./min. length of vow-els/obstruents/fricatives/silence tags and max./avg. lengthof vowels/obstruents/fricatives/silence tags. The idea be-hind this kind of features is that depending on how chal-lenged the student is, the student shortens or lengthens vow-els and consonants. The data collection resulted in 36 ex-amples labelled with over-challenged or appropriately chal-
lenged, respectively 48 examples after applying oversamplingto the smaller set of examples of class over-challenged toeliminate unbalance within the data. We conducted a 3-foldcross validation and we applied SVMs with an RBF-kerneland for each SVM used we conducted a grid search on eachfold to estimate the optimal values for the hyper param-eters. As baseline experiments we applied an SVM sepa-rately to both feature types. The classification test errorsand F-measures (harmonic mean of recall and precision) forboth classes (over-challenged, appropriately challenged) arereported in tab. 1, (1). An aggregation of both featuretypes only makes sense, if we can improve this results. Astraight forward way to combine different feature types is toconcatenate the features of all types and putting them intoone feature vector which serves as input for one classificationmodel. However, this approach does not deliver good results(see tab. 1, (2)) in cases where some features may be corre-lated and may disturb each other. Hence, one should restrictthe input vector by considering the correlations. The resultsof using only features uncorrelated with most of the otherfeatures are shown in tab. 1, (3). As one can see consideringcorrelations helps to improve the classification performance.But still there is space for improvement. Hence, in the fol-lowing we combine ensemble methods with feature selectionwhich takes into account correlations. In a first step we ap-plied stacking ensemble to the outputs of SVMs applied tothe uncorry sets (see tab. 1, (4)). However, there could stillbe correlations within the uncorry sets. Hence, as next stepwe computed for each feature the uncorr2y set and appliedagain stacking ensemble, resulting in a classification test er-ror of 16.67 % (tab. 1, (5)). This result is already very goodbut there is one more statistical information to use: theAIC. We computed for each uncorr2y set the AIC, threwout the worst quarter of these sets and applied stacking tothe remaining sets resulting in a very good classification testerror of 8.33 % and F-measures 0.92, 0.91 (tab. 1, (6)). Insummary, the experiments have shown that our multimodalfeature aggregation approach is able to improve the classifi-cation performance significantly.
4. REFERENCES[1] R. Janning, C. Schatten, and L. Schmidt-Thieme.
Feature analysis for affect recognition supporting tasksequencing in adaptive intelligent tutoring systems. InProceedings of EC-TEL, 2014.
[2] R. Janning, C. Schatten, L. Schmidt-Thieme, andG. Backfried. An svm plait for improving affectrecognition in intelligent tutoring systems. InProceedings of ICTAI, 2014.
[3] J. Moore, L. Tian, and C. Lai. Word-level emotionrecognition using high-level features. In CICLing, 2014.
[4] S. Salmeron-Majadas, O. Santos, and J. Boticario.Exploring indicators from keyboard and mouseinteractions to predict the user affective state. InProceedings of EDM, 2014.
Proceedings of the 8th International Conference on Educational Data Mining 567

Teacher and learner behaviour in an online EFL workbook Krzysztof
Jedrzejewski [email protected]
Mikolaj Bogucki mikolaj.bogucki @pearson.com
Mikolaj Olszewski mikolaj.olszewski @pearson.com
Jan Zwolinski jan.zwolinski
@pearson.com
Kacper Lodzikowski
kacper.lodzikowski @pearson.com
All authors work for Pearson IOKI, Dabrowskiego 77, Poznan.
ABSTRACT In this paper, we present selected findings from our usage analysis of an online English Language Teaching (ELT) workbook. We focus on how teachers assign activities and how learners complete them.
Keywords ELT, network analysis, time on task
1. BACKGROUND MyEnglishLab for Speakout Pre-intermediate is an ELT workbook that accompanies a paper textbook. The aim of the product is for the teacher to assign auto-graded homework. On average, about 10 practice activities are assigned by the teachers within a week, with a 30% chance of assigning more than the average. Speakout consists of twelve units that cover 90-120 hours of teaching. Each unit contains about thirty assignable activities centred around grammar, vocabulary, listening, reading and writing. This paper is an exploratory study about how teachers assign such activities and how learners complete them.
2. TEACHER PROGRESSION 2.1 Method To analyse how teachers progress through units within Speakout, we wanted to show which pairs of units were assigned together. By assigning a unit we mean assigning at least one activity from that unit. In Figure 1 (created using Gephi [1]), a node represents teachers who assigned at least one activity in a given unit. The edges represent those teachers that, having assigned some activities in one unit, moved to another unit. A thicker edge means two units were assigned together more frequently (by more teachers). For example, 185 teachers assigned both Unit 1 and Unit 2. The thickness and length of each edge refers to normalised co-appearance (geometric mean) calculated after Newman [2] as:
n(ui,uj )
n(ui ) ⋅n(uj )
where n (…) is the number of teachers that assigned activities in all listed units, and ui is the i-th unit. Different unit types were highlighted for better readability, namely the regular Units 1-6 (U1-U6) and Units 7-12 (U7-U12) are shown separately from Review and Check 1-4 (R&CH1-R&CH4). The role of the former units is to enable regular day-to-day homework practice, while the role of the latter is to allow the learner to review a larger portion of the material from the three previous units before a test.
2.2 Results Figure 1 shows that there is no prominent community structure. Teachers tend to focus on smaller chunks of material, especially Units 1-3 and Units 7-9. Figure 2 shows that teachers assign either the regular Units or just the Review and Check units, rarely both. There are more connections between the Review and Check units themselves than between the regular Units. For example, more teachers assign Review & Check 3 together with Review & Check 4 than they assign Units 10-12 together with Review & Check 4.
Figure 1. Network graph of relations between units in
Speakout Pre-intermediate with edge as a normalised value (geometric mean)
Proceedings of the 8th International Conference on Educational Data Mining 568

Figure 2. Network graph of relations between units in
Speakout Pre-intermediate with edge as a normalised value (geometric mean); only the 24 strongest edges shown
3. QUESTION TYPE AND TIME SPENT When it comes to learners, we wanted to analyse the time needed for completing a language-learning activity. Speakout contains 15 main question types. Figure 3 (created using RStudio [3]) shows that for most of them the average time spent on the first submission of an activity is of the order of 3 minutes. Learners spend the least time on multiple choice activities (about 1.5 minutes), and most time on jumble words activities (over 4 minutes). We stress that these times do not necessarily correspond to the optimal duration it takes a learner to complete all the questions within such an activity, which needs future exploration.
Figure 3. Geometric average of time spent on completing an activity of a given type, with 95% confidence intervals.
Due to space constraints, we present only one figure that presents a question type in more detail, namely fill-in (gap completion).
Figure 4. Correlation between the time in which a learner
submits a fill-in activity and the score received for that activity; cutoff at 60 minutes
Figure 4 shows that, except for the solid lines at activity score 0% and 100%, most of the observations are placed in the top left part of the plot. The smoothed line shows a peak in activity score at 1.5 minutes spent on a fill-in activity, after which the score visibly decreases. This means many learners need 1.5 minutes to submit a simple fill-in activity (for example, without a text or audio) and receive a relatively high score. An analysis of the top four question types that account for about 76% of Speakout activities (fill-in, drag-and-drop, dropdown and single choice – the last three are not shown here) shows that there is a negative correlation between the time spent on activities and the scores received for those activities. On average, the score decreases by about 8% for each 10 minutes spent on the activities with these question types.
4. FUTURE WORK Regarding teacher usage, our next step is to segment teachers according to course types and institutions. Regarding learner usage, we will investigate if activities consisting of many questions that are completed within a very short time need to be further analysed to identify whether their format encourages guessing or copying.
5. ACKNOWLEDGMENTS Our thanks to Rasil Warnakulasooriya for his comments on the early drafts of this work and to the Pearson English MyEnglishLab Team.
6. REFERENCES [1] Gephi, The Open Graph Viz Platform. Retrieved March 30,
2015, http://gephi.github.io.
[2] Newman, M. 2010. Networks. Oxford Scholarship Online. DOI=10.1093/acprof:oso/9780199206650.001.0001.
[3] RStudio. 2012. RStudio: Integrated development environment for R. Retrieved March 30, 2015, http://www.rstudio.com
Proceedings of the 8th International Conference on Educational Data Mining 569

Skill Assessment Using Behavior Data in Virtual World
1Ailiya, 2Chunyan MiaoThe Joint NTU-UBC Research Centre
of Excellence in Active Living for the Elderly (LILY) Nanyang Technological University
Singapore {1ailiya, 2ascymiao}@ntu.edu.sg
3Zhiqi Shen, 4Zhiwei ZengSchool of Computer Engineering
Nanyang Technological University Singapore
[email protected] [email protected]
ABSTRACTHighly interactive game-like virtual environment has gained increasing spotlight in academic and educational researches. Besides being an efficient and engaging educational tool, virtual environment also collects a lot of behavior data which can be used with Educational Data Mining (EDM) techniques to assess students' learning competencies. In this paper, we propose an assessment system that seamlessly integrates EDM techniques with functionality and affordance of a virtual environment to assess students’ learning competency through analyzing their behavioral data and patterns. The virtual environment can record not only students’ learning outcome, but also their detailed learning process information, which has the potential to depict the full set of students’ learning activity. We also propose a set of metrics which can be used for judging students’ Self-Directed Learning skills and how these metrics can be evaluated computationally by capturing students’ behavioral data in a virtual environment. The field study, which is conducted in Xinmin Secondary School in Singapore, preliminarily illustrates the effectiveness of our approach.
KeywordsEducational Data Mining; Virtual Environment; Competency Assessment; Self-Directed Learning
1. INTRODUCTION In the fast changing and increasingly globalized society, students nowadays need to become more conscious, controlled, independent and active in their learning. The new requirements of education urge the creation of new assessment approaches.Besides being an efficient and engaging educational tool, virtual environment also collects a lot of behavior data which can be used with Educational Data Mining (EDM) techniques to assess students' learning competencies. Many researchers have worked in this area [1-3]. The system that we proposed is based on a full-scale 3D virtual environment to assess students’ learning competencies. Among all kinds of learning competencies, wefocus on Self-Directed Learning (SDL) competency in our research study because it is among the most important learning competencies students need to excel in the knowledge society of the 21st century [4]. SDL skills are important indicators of students’ learning competencies as they are the fundamental philosophy behind life-long learning. The proposed system uses Evidence Centered Design (ECD) approach to assess students’ SDL competency through analyzing their behavioral data in virtual learning environment. With the Competency Model, Evidence Model, and corresponding Task Model, the system can provide opportunities for students to elicit behavioral indicators of certain SDL skills. These behavioral indicators can be used for assessing the skill levels which cannot be discerned from
traditional academic assessment. Moreover, we conducted a pilot study in Xinmin Secondary School Singapore to demonstrate how to evaluate the SDL metrics. The study illustrates the preliminary effectiveness of our approach.
2. MODELING SDL SKILLS The overall system architecture consists of two main modules: the Virtual Singapura II (VS-II) System and Assessment Automation module. VS-II System is a full-scale 3D virtual world to promote intelligent agent mediated learning. As an open environment, VS-II allows students to explore and learn in a self-directed manner. By recording student’s behaviors in the virtual environment, the system provides a convenient and effective setting to elicit students’ behavior evidence of their learning skills through the whole learning process.
Figure 1. System Architecture for Assessing Students’ Learning Competency.
The Assessment Automation module has three sub-modules as shown in Figure 1. The first module – Data Recording meticulously records a wide range of student learning behavior data. There are totally 78 types of events being tracked in the system, and the data collected in the virtual environment consists of three categories: 1) Student learning behavior data, such as locations, timestamps, mouse clicks, etc. 2) Student learning achievement data, such as collected items, fulfilled missions, etc. 3) Student knowledge data, such as correctness of responses, hints required, etc. The second module – User Competency analyzes students’ behavioral data through Evidence Centered Design (ECD) approach. Evidence Centered Design (ECD) is the framework for assessment that makes explicit the interrelations among substantive arguments, assessment designs, and operational processes [5]. Similar to the approach Shute has adopted in her study [6], we utilize ECD methodology in our system design to track and interpret students’ behavioral data to assess students’ SDL competency. The system is designed in a
Data Recording
Proceedings of the 8th International Conference on Educational Data Mining 570

three-layered model. The three layers are: 1) Competency Modelidentifies what should be assessed in terms of skills. The competence of Self-Directed Learning (SDL) is denoted as ,where consists of three aspects of skills , and
, where denotes Ownership of Learning, denotes Management and Monitoring of Own Learning, and denotes Extension of Learning. 2) Evidence Model identifies behaviors that demonstrate the skills defined in 1). The essential student behavioral indicators for SDL are defined as
, where . 3) Task Model identifies the tasks that would draw out behaviors defined in 2). Let T = {tasks completed by students in the learning environment}, and . Each task is an n-tuple, which consists of an ordered list of learning activities. Let
, and denotes a learning activity. is the set of learning activities and each is atomic and cannot be further decomposed into other learning activities.
In our implementation, we focus on the assessment of SDL skills in one of its three aspects, “Management and Monitoring of Own Learning”. We illustrated the assessment process by emphasizing one of the skills of SDL competency, , i.e. Management and monitoring of own learning skills. This skill is defined with three behavioral indicators. For each behavioral indicator, we designed several evidence variables to capture a student’s performance (as Figure 2). The Last module Statistics and Visualization module visualizes all the results and findings through our user interface.
Figure 2. List of Behavioral Indicators and Evidence Variables on Management and Monitoring of Learning.
3. PILOT STUDY AND FINDINGS The assessment prototype has been deployed in Xinmin secondary school in Singapore. The field study on one side aims to examine whether the whole system is technically workable (data transmission, real time data recording, network setting, client response, etc.), on the other side aims to examine whether the SDL skills can be identified among students with students’ real behavioral data. 26 students from Secondary 2 (age 12-13) have participated in our study. In order to get the benchmark, we collected students’ SDL skills markings from three of their teachers, and calculated the average scores on each perspective. We also let students fill in a SDL self-report questionnaire.
Significant results have been found. For time management,students who used the virtual map to plan their learning path completed a significantly higher number of learning tasks during the same sessions as compared to those who did not. About 50% of the students in the group with the virtual map completed 4 learning tasks, while for the other group, most students (close to 60% of them) only managed to complete 2 or 3. The average number of learning tasks completed by the group with the map is 3.83, while that of the other group is 2.5. Also, students who more tended to rely on the mobility tools provided in the game (i.e. the teleporting gates, the virtual passport, etc.) tended to limit themselves in terms of self-exploring wide range of possibilities. In contrast, students who were more selective of the tools tend to explore more widely and make better decisions. The correlation coefficient between mobility tool usage and the form teacher’s assessment of individual students’ exploration skills is -0.5404, indicating a strong negative relationship. These findings support that our system is promising in identifying useful learning behavior metrics, and also has the capability to identify different SDL skills from different behavior patterns.
4. CONCLUSIONS This paper proposed a virtual environment enabled assessment system for assessing student’s SDL skills through personal learning behavior informatics. We provided a set of tools from theoretical models to system implementations to analyze student’s behavior data and managed to evaluate the connections between behavioral indicators and student’s SDL skills. The proposed three-layered model bridges the gap between definitions of SDL skills and how they can be quantified and evaluated computationally. The seamless integration with VS-II system enables the collection of students’ behavioral data in the virtual environment. With the application of educational data mining, the Assessment Automation module analyzes collected behavioral data, consolidates and presents the findings graphically. In the future work, with more and more student data collected, we will gradually refine the benchmarks of student skills and improve the whole assessment process.
Acknowledgement. This research is supported in part by Interactive and Digital Media Programme Office (IDMPO), National Research Foundation (NRF).
5. REFERENCES [1] Barab, Sasha, et al. "The Quest Atlantis Project: A socially-
responsive play space for learning." The educational design and use of simulation computer games pp. 159-186. 2007.
[2] DiCerbo, Kristen E. "Detecting Game Player Goals with Log Data." American Educational Research Association (2014).
[3] C. Dede, J. Clarke, D. J. Ketelhut, B. Nelson, and C. Bowman, "Students’ motivation and learning of science in a multi-user virtual environment." American Educational Research Association Conference. 2005.
[4] Sabourin, Jennifer L., et al. "Understanding and predicting student self-regulated learning strategies in game-based learning environments." International Journal of Artificial Intelligence in Education 23. no.1-4, pp. 94-114.2013.
[5] R. J. Mislevy, L. S. Steinberg, and R. G. Almond, “Focus article: On the structure of educational assessments,” Measurement: Interdisciplinary research and perspectives,vol. 1, no. 1, pp. 3-62, 2003.
[6] V. J. Shute, “Stealth assessment in computer-based games to support learning,” Computer games and instruction, vol. 55, no. 2, pp. 503-524, 2011.
Proceedings of the 8th International Conference on Educational Data Mining 571

Pacing through MOOCs: course design or teaching effect? Lorenzo Vigentini
Learning & Teaching Unit UNSW Australia,
Lev 4 Mathews, Kensington 2065 +61 (2) 9385 6226
Andrew Clayphan Learning & Teaching Unit
UNSW Australia, Lev 4 Mathews, Kensington 2065
+61 (2) 9385 6226 [email protected]
ABSTRACT Despite the original tenets about openness and participatory characteristics of MOOCs [1], the majority of MOOCs are delivered in a semi-structured asynchronous way bridging the strong structure of traditional courses -signposted by lectures, tutorials/seminars and activities/assignment deadlines- and open courseware in which student are able to select their own learning paths and goals. Looking at the activity of students in three different MOOCs delivered on the Coursera platform, we considered the effects of different course design to observe variations in the way students pace through the courses. The analysis (in progress) suggests that the course design and the mode of teaching strongly influence the way in which students progress and complete the courses. However, more research needs to be done on the individual variations and on the supporting mechanisms which could be put in place to scaffold students’ development of their own learning paths and matching their intended goals.
Keywords
MOOCs, learning design, behavioural analysis, learning
1. INTRODUCTION Following Gartner’s hype cycle [2], MOOCs are currently in the ‘sliding into the trough’ phase, quickly moving into a consolidation stage, which should lead to the establishment of best practices. This is evident also in the research domain, in which MOOCs have taken centre stage in the recent LAK and Learning@scale conferences. Despite the hype of big data in education and the potential associated with the ability to collect and analyse large amount of information about students’ learning behaviours, one of the biggest limitation in the field are the lack of systematicity in the creation of MOOCs –perhaps with the exemption of the limitations of the various platforms- and the lack of strong collaborations leading to sharing data across the sector. As mentioned in [3], at most, researcher might have access to a few MOOCs to analyse; this is echoed in the recent call for a special issue of the JLA (Siemens) to open up and describe large datasets in order to enable research. Yet, the biggest limitation in many published works is a full description of the context, i.e. the course design and philosophy behind it -which is the first stage of any data mining process in the industry-standard CRISM-DM model [4].
Even though the philosophies behind the MOOCs movement range from the instructivist (xMOOC, [5]) to the social-constructivist (cMOOC, [6, 7]), a key assumption is that most MOOCs are built as a ‘course’: normally there is an instructor/facilitator, a set of resources, activities, support and other participants; content can be curated by instructors or shared among participants. As Cormier [8] put it, a MOOC is ‘an event’
which provides an opportunity for participants ‘to connect and collaborate’ and to ‘engage with the learning process in a structured way’. But, if it is an event and it is structured, then the way in which it is designed is fundamental and the design is what trumps the teacher role and/or presence. From an academic development’s perspective, not only the way in which elements and components are selected and structured makes a difference, but also the philosophy of teaching behind how the course should be delivered drive the learners’ experiences.
2. DIFFERENT COURSE DESIGN At our university, a large, public, research-intensive university in Australia, one of the key reasons to enter the MOOC space was to be able to experiment with pedagogical innovation, learn from it and bring it back to mainstream (i.e. what we do on campus). The selection of courses to be delivered is driven by the awareness of a different target audience, disciplines and the ways in which academics imagined the best ways of teaching a course at scale. Here we only refer to the first 3 courses completed: INTSE (Introduction to System Engineering), LTTO (Learning to Teach Online) and P2P (From Particles to Planets -physics) which are broadly characterised in the table below.
Table 1. Overview of courses
INTSE LTTO P2P
Target group Engineers Teachers at all levels
High school and teachers
Course length 9 weeks 8 weeks 8 weeks Total videos 110 224 98 Total quizzes 10 22 42 Assignments 7 3 2
Forums 54 (14 top level)
105 (17 top-level)
63 (15 top-level)
Design mode All-at-once All-at-once Sequential
Delivery mode All-at-once Staggered Staggered
Use of forums Tangential Core activity Support
N in forum 422 1685 293
Tot posts 1361 6361 1399
Tot comments 285 2728 901
Registrants 32705 28558 22466
Active students1 60% 63% 47%
Completing2 4.2% (0.3% D)
4.4% (2.4 D)
0.7% (0.2%)
1. Active students are those appearing in the log; 2. Completing are those who achieve the pass grade or earn Distinction (D)
Proceedings of the 8th International Conference on Educational Data Mining 572

At the surface all three course lean toward an instructivist approach in which the content is essential. However, the educational developers supporting the design ensured that each course was characterised by a mix of content, activities, support tools and evaluation. There are some key differences by design: the way in which content is released; the way in which the course is taught; the function of activities and forums. In INTSE and LTTO all content is released at the start all together, however in LTTO the teaching occurred in a staggered way with regular announcements and feedback videos in response to the top voted comments in each week. P2P used a sequential release of content every week with a staggered delivery and interaction. The activities focus on self-test in INTSE and P2P, while in LTTO these had a teaching function structuring personal development and reflection in the forums. Finally forums were not the focus of the course in INTSE, but had an important role in LTTO and as support in P2P.
3. RESULTS 3.1 Patterns of activity As it can be seen from the charts some patterns are quite evident. For the P2P course (figure 1), which was designed and delivered on a week-on-week basis, the darker diagonal shows that students are following the course in a linear fashion. LTTO (figure 2) shows a tendency to follow activity along the diagonal. However, this pattern is reduced by individuals who jump between sections/components in the same week (earlier in the course rather than later). In the INTSE (figure 3), patterns are a lot more diluted: in the use of content (videos) the stronger patters occur in the first week, last week and in part across the diagonal. The forums don’t seem to have a time-based dependency and the quizzes follow the diagonal and are more frequent in the last week of the course, it is evident that the majority of students tend to follow a fairly linear pattern. Further analysis will be required to test the significance of these patterns, but this early visualization clearly suggest that there is an interaction between the design and delivery of the course and that despite the freedom of determining their learning paths, students like the pacing provided by instructors.
3.2 ‘Ontrackness’ and dedication In their analysis [3] ‘on-trackness’ is defined as ‘the degree to which students cohere with the recommended syllabus’. Similar metrics have been used in learning analytics as signals for possible support/interventions in order to reduce dropout (i.e. attendance, timely submission etc.). In sequential courses this is simple to identify, however when all the material is available at once, this could be less meaningful. Figure 4 shows the patterns in the three courses by mapping the weeks in which a resource is expected to be used (i.e. design) and when it was actually used. Once again the linear pattern around the diagonal for P2P clearly show how participants follow the course week-on-week; in INTSE and LTTO the videos use are more scattered with quite a few participants looking ahead in the course, but this is not reflected in the quizzes/acitivities and the forums As well as the overview of ontrackness, we have started to consider other metrics, which will require further modelling and analysis. Dedication is defined as the regularity of engagement. Given a time period T and the distribution of activity during T, dedication d is the ratio of activity and course length. Assiduity is a measure of the patterns of activity over time and it is characterised by the skewness and kurtosis of the distribution of activity. Looking into
individual distributions of activity and the relations with other measures will provide a better insight on the individual preferences and how these are related to the teaching and course design.
4. CONCLUSION & DIRECTIONS Bearing in mind the differences in the cohorts of students taking the courses taken into consideration, which leads to a limited ability to draw conclusions, the striking similarities between the patterns of engagement in the different MOOCs suggests that the method of teaching/delivery is a key element in the way students take a MOOC. The structure of the MOOC ‘event’ has got a strong impact in the way students engage, but more analysis is necessary to determine the level of flexibility afforded.
At the group level it is apparent that student follow the pace of the course as set by the instructors, however many questions remain open about the effectiveness when it comes to achievement levels. In particular, the goals/intents of students might not be to complete the course and therefore the skipping behaviours could be aligned with what they want to achieve and hard to relate to the measure of success of a MOOC. In fact [9] argue that we need to review and reconceptualise what we mean with student success in this space. More analysis, especially at the individual student level will be necessary to extract meaningful insights.
5. REFERENCES [1] Dave Cormier and George Siemens. 2010. The Open Course:
Through the Open Door--Open Courses as Research, Learning, and Engagement. EDUCAUSE Review 45, 4 (January 2010), 30.
[2] Alexander Linden and Jackie Fenn. 2003. Understanding Gartner’s hype cycles. Strategic Analysis Report No R-20-1971. Gartner, Inc (2003).
[3] Tommy Mullaney and Justin Reich. 2015. Staggered Versus All-At-Once Content Release in Massive Open Online Courses: Evaluating a Natural Experiment. In Proceedings of the Second (2015) ACM Conference on Learning @ Scale. L@S ’15. New York, NY, USA: ACM, 185–194. DOI: http://dx.doi.org/10.1145/2724660.2724663
[4] Colin Shearer. 2000. The CRISP-DM model: the new blueprint for data mining. Journal of data warehousing 5, 4 (2000), 13–22.
[5] C. Osvaldo Rodriguez. 2012. MOOCs and the AI-Stanford Like Courses: Two Successful and Distinct Course Formats for Massive Open Online Courses. European Journal of Open, Distance and E-Learning (January 2012).
[6] George Siemens. 2005. Connectivism: A learning theory for the digital age. International journal of instructional technology and distance learning 2, 1 (2005), 3–10.
[7] Stephen Downes. 2008. Places to go: Connectivism & connective knowledge, Innovate.
[8] Dave Cormier. 2009. What is a MOOC? YouTube (2009). https://www.youtube.com/watch?v=eW3gMGqcZQc, accessed April 201
[9] Jennifer DeBoer, Andrew D. Ho, Glenda S. Stump, and Lori Breslow. 2014. Changing “Course” Reconceptualizing Educational Variables for Massive Open Online Courses. EDUCATIONAL RESEARCHER 43, 2 (March 2014), 74–84. DOI:http://dx.doi.org/10.3102/0013189X145230
Proceedings of the 8th International Conference on Educational Data Mining 573

Integrating a Web-based ITS with DM tools for Providing Learning Path Optimization and Visual Analytics
Igor Jugo
Božidar KovačićDepartment of Informatics
University of Rijeka, Radmile Matejčić 2, Rijeka, Croatia
Vanja Slavuj
ABSTRACTWe present an improved version of our web-based intelligent tutoring system integrated with data mining tools. The purpose of the integration is twofold; a) to power the systems adaptivity based on SPM, and b) to enable teachers (non-experts in data mining) to use data mining techniques on a daily basis and get useful visualizations that provide insights into the learning process/progress of their students.
KeywordsWeb based intelligent tutoring system, data visualizations, visual analytics.
1. INTRODUCTION Our proposed solution to objectives put forth in [5] is the integration of our web-based ITS with standalone data mining tools Weka[3] and SPMF[2]. We developed an integration module that enables continuous communication with the DM tools without implementing any specific algorithm into our application or changing the original DM code. The architecture of the integrated system is displayed in Figure 1. Functionalities that rely on data mining results for students and teachers are marked with asterisks. We will elaborate on these in the next sections. Our web-based intelligent tutoring system (ITS) provides a platform for learning on ill-defined domains [4] i.e. domains that consist of a number of knowledge units (KUs) that do not have a set order in which they have to be learned, but instead the system relies on a domain expert to define the structure of the domain. The learning process is started by selecting a KU to which the system responds by displaying the various types of learning materials created by the teacher. Afterwards, the student proceeds to the assessment module. The system will first ask the student a question about the KU that was learned, followed by an initial question for every KU that is below the current KU in the domain structure created by the teacher. In this way the system checks whether the student understands all the underlying concepts. This list of KUs is currently the same for all students. We aim to make this part dynamic (see Section 3) in order to make the system more
adaptive and increase the efficiency of the whole system. If the student offers an incorrect answer to any of the initial questions, he/she is transferred to learning that KU and the whole process is repeated.
Figure 1. Overall system architecture No matter how many levels down the hierarchy the student is taken by answering initial questions incorrectly, the system will always return to the starting KU and finish when all the initial questions have been answered. Once the student reaches the KU threshold, the system will stop displaying that KU later in the learning process in order to avoid tediousness and repetition.
2. VISUAL ANALYTICS FOR TEACHERS At the time of writing the visual analytics section for teachers had a number of visualizations and a clustering section that provide useful insights into the activity of the students and the learning process as a whole. When they start the analytics module, teachers are presented with a compact report containing columns on the number of learning and repetition activities the student performed, number of correct, incorrect and unanswered questions, and the total time spent learning. Each of the columns can be expanded into a sortable, searchable, heat mapped table to get a detailed view about the student’s activity. Figure 2 represents the expanded report on the number of learning sessions and repetitions for all the KUs in the domain. Another part of the visual analytics module is the chart section. There are a number of
Proceedings of the 8th International Conference on Educational Data Mining 574

activity charts that can reveal the activity levels of the whole group or individual students (Figure 3).
Figure 2. Detailed report on learning (all KUs,all students)
Figure 3. Cumulative group activity by days The clustering analysis is currently based on a fixed number of features (the ones mentioned in the compact report), but in the next development iteration it will be completely interactive so that the teacher will be able to select features as well as the number of clusters before starting the analysis. When the teacher starts the clustering, the system invokes the communication manager which converts the data to the appropriate file format for either Weka or SMPF, writes the file to the file system and then performs the appropriate API call in the shell command line.
Figure 4. Visualization of student learning paths The DM tool runs the required algorithm on the data using the sent parameters, and produces the output file. The file is then read, formatted and then returned to the teacher interface where they are displayed as a table with five columns containing cluster names, clusters centroids and students belonging to each cluster. The teachers using the system had no problem identifying inactive
students, best students, the average students (largest cluster) and students that were “gaming” the system - students with low number of questions answered and very small amount of time spent learning – they started using the system at the last minute and probably obtained the answers to some questions. This can be confirmed by analyzing the heat maps and activity charts of those students.
3. DM-POWERED PATH OPTIMISATION The next goal of our research is to create a more adaptive tutoring system in order to: a) increase the quality of learning, b) reduce time needed to acquire the domain knowledge. The set hypothesis is that each student creates a unique path through the structure of KUs. By scheduling a daily analysis of all these paths using SPM algorithms, we can find frequent learning paths. Next, we need to evaluate these paths in order to differentiate between paths that are frequent because a number of students are struggling with a difficult KU without making much progress through the domain from paths that show efficient behaviors that result in significant progress. We are currently developing an algorithm that will perform these evaluations by taking into account a number of learning performance indicators in order to produce a path score. When we get a list of evaluated frequent sequences and students clustered by their activity and effectiveness levels, we can alter thelist and order of KUs to be learned in order to help the student follow an optimized path through the knowledge domain. Clustering of students gives us a finer level of granularity so we can offer different modifications to different groups of students. At this moment we run the SPM algorithms to get the frequent patterns and visualize them (Figure 4) using D3JS [1].
4. CONCLUSIONThe main advantage of the system is that we can use any of the many SPM and clustering algorithms provided by integrated DM tools. In the future we will complete the SPM based adaptive path optimization component and perform experiments to verify its efficiency.
5. ACKNOWLEDGMENTS This research is a part of the Project "Enhancing the efficiency of an e-learning system based on data mining", code: 13.13.1.2.02., funded by the University of Rijeka, Croatia.
6. REFERENCES [1] Bostock, S. M., 2014. D3JS Data Driven Documents.
http://d3js.org.[2] Fournier-Viger, P., et al., 2013. SPMF: Open-Source Data
Mining Library. http://www.philippe-fournier-viger.com/spmf/.
[3] Hall, M., et al., 2009. The WEKA Data Mining Software: An Update. SIGKDD Explorations, 11, 1.
[4] Lynch, C., et al., 2006. Defining Ill-Defined Domains; A literature survey. In Proc. Intelligent Tutoring Systems Ill-Defined Domains Workshop, Taiwan, 1-10.
[5] Romero, C., Ventura, S., 2010., Educational data mining: A review of the state-of-the-art. Transactions on Systems, Man, and Cybernetics, , vol. 40, 6, 601-618.
Proceedings of the 8th International Conference on Educational Data Mining 575

Different patterns of students´ interaction with Mooodle and their relationship with achievement
Rebeca Cerezo University of Oviedo
Faculty of Psychology +34 627607021
M. Sanchez-Santillan University of Oviedo Computer Science +34 669 094015
J.C. Núñez University of Oviedo
Faculty of Psychology +34 985 103224
M. Puerto Paule University of Oviedo Computer Science
+34 689384409 [email protected]
ABSTRACT This work tends to broaden the knowledge about the learning process in LMSs from an EDM approach. We examine students’ interactions with Moodle and their relationship with achievement. We analyzed the log data gathered from a Moodle 2.0 course corresponding to the different interaction patterns of 140 undergraduate students with the LMS in an authentic learning context. We found out 4 different patterns of learning related to different academic achievement.
Keywords
Learning process, LMSs, Moodle, higher education, log analysis.
1. INTRODUCTION In traditional learning settings, instructors can easily get an insight into the way that the students work and learn. However, in LMSs, it is more difficult for teachers to see how the students behave and learn in the system [2]. Since learner activities are crucial for effective online teaching-learning process, it is necessary to search for empirical methods to better observe patterns in the online environment. In recent years, researchers have investigated various data mining methods to help instructors to improve e-learning process and systems [1]. As shown in the review of Romero and Ventura [3], a good number of quality works have been conducted with techniques similar to the ones used at this work. Most of them were carried out in laboratory settings with concrete tasks, but just a few in real settings or during an extended period of time [2]. These work aims to go beyond laboratory contexts and researcher-controlled settings. Therefore we set two research questions: 1. Are there sense different patterns of students’ interaction when they learn in an LMS in a real context? 2. Are those patterns related to students’ final marks?
2. METHODOLOGY 2.1 Participants and procedure The datasets used in this work have been gathered from a Moodle 2.0 course that enrolled 140 undergraduate university students in a psychology degree program at a state university in Northern
Spain. The experience was an assignment in the curriculum of a third year mandatory subject. Students were asked to participate in an eTraining program about self-regulated learning related to the subject’s topic. The program was composed of 11 different units that were delivered to the students on a weekly basis. Students get an extra point in their final subject grade if they complete the assignments. We have used 12 actions that make the most sense to represent the students’ performance in the particular Moodle course described (See Table 1). The variables selected can be grouped into two different groups: Variables related to effort and time spent working (Time task, Time Span, Relevant Actions, and Word Forums) and Variables related to procrastination (Day’s task and Day’s Hand-in). Final marks were extracted from the performance in the subject that is the grade of the e-Training program and the sum of the grade in an objective final exam of the subject.
2.2 Data Analysis First, as an exploratory approach to the optimal number of behavioral patterns or clusters in the LMS, the expectation-maximization (EM) algorithm was used. Second, we sought a similar solution to the one provided by EM for the cluster classification but through the k-means algorithm. The objective of these two first steps is to obtain a clustering solution based on coherence among EM and k-means. Through the clustering, we aim to get high similarity intra-cluster and maximize the differences between them. Finally, ANOVA analyses were run to observe if there were differences between the inter-clusters, and the predictive validity of those clusters to predict final marks.
3. RESULTS After analyzing the data with the EM algorithm, with k-means and with the elbow method, k = 4 was found to be the optimal number of clusters for this sample. Fig. 1 graphically represents the characteristics of the four groups. The second question was to bring up the chances of those patterns being related to students’ final marks. For this purpose, an ANOVA analysis was carried out. The results obtained with final marks as the dependent variable and the different clusters the independent ones where F (3,136) = 13.31; p < .00; η2
p .227, indicates that there are statistically significant differences between the four student groups in final marks. The post hoc comparisons showed the following statistically significant differences: cluster 1 vs cluster 2 (d = 0.82, large effect), cluster 2 vs cluster 4 (d = 1.43, very large effect), and cluster 3 vs cluster 4 (d = 1.01, large effect).
Proceedings of the 8th International Conference on Educational Data Mining 576

Table 1. Name of variables considered in the study with their description and extraction method
Regarding the comparisons between cluster 1 vs cluster 4 and cluster 2 vs cluster 3, the inter-cluster differences’ effect size was medium.
4. DISCUSSION Four different patterns of learning with different final marks were found in this course; it is interesting how students with very different patterns in the LMS end with a very similar achievement. Cluster 1 is characterized by a small amount of time allocated to work in general but particularly in the practical task. The variables regarding procrastination and the participation in the forums are low, nevertheless, the overall number of significant actions in the LMS is high. Considering that their achievement is medium-low these results may indicate that students in this cluster work quickly but not efficiently. The students in the Cluster 2 could be described as strategic due to the small amount of time and low number of actions in the LMS that led them to very good results. The pattern for working variables is very suitable, too, with a high quantity of time invested in the tasks and they do not procrastinate. Cluster 3 is similar to the previous one in terms of achievement but not in the remaining variables. This group’s achievement is a bit lower than Cluster 2’s, it could be labeled as medium-high. There is nothing remarkable about procrastination variables, in contrast, the participation in the forums is really low. The number of relevant actions is also the lowest for this cluster; however, the time that they spent in the LMS was the highest. These results may indicate that they are not strategically efficient and do not make the most of the time spent, but they are still ultimately profitable in terms of achievement. Finally, Cluster 4 is characterized by the lowest marks. The most defining characteristic is that they are extreme procrastinators with really low levels in the variables related to the time spent working. Moreover, they make a significant number of relevant actions but do not benefit from them at all, which denotes a maladaptive approach to learning. On one hand, these results may help an instructor better understand students’ learning process, identify at-risk students (e.g., Cluster 1 and 4) and intervene. On the other hand, the information provided by Clusters 2 and 3 could guide the future
development of recommendation systems; having a similar
performance in terms of achievement the underlying interaction with the LMS denote different patterns that could be modeled by a recommendation systems in very different terms.
5. ACKNOWLEDGMENTS Our thanks to the Projects TIN2011-25978, EDU2010-16231, GRUPIN14-053 and GRUPIN14-100.
6. REFERENCES [1] García, E., Romero, C., Ventura, S., & de Castro, C. 2006.
Using rules discovery for the continuous improvement of e-learning courses. In Intelligent Data Engineering and Automated Learning (Burgos, Spain, September 20 - 23). IDEAL 2006. Springer, Berlin - Heidelberg, 887-895.
[2] Graf, S., & Liu, T. C. 2009. Supporting teachers in identifying students' learning styles in learning management systems: an automatic student modelling approach. Educational Technology & Society, 12, 4, 3.
[3] Romero, C. & Ventura, S. 2010. Educational Data Mining: A review of the State of the Art. IEEE Transactions on Systems, Man, and Cybernetics, 40, 6, 601-618.
Name Description Extraction Method under Moodle nomenclature Additional information
Variables related to effort and time spent working
Time Tasks Total time spent
Sum of the periods between quiz view/quiz attempt/quiz continue attempt/quiz close attempt
and the next different action
Students have a period of 15 days to complete the tasks.
Time Span Total time spent working in every unit
Sum of the variables related to the time spent in the three different type of contents: Time tasks,
Time Theory and Time Forum
Students have a period of 15 days to work in a declarative knowledge level (Theoretical
contents), procedural knowledge level (Practical tasks), and conditional knowledge
level (Discussion forums). Words Forums Number of words in forum posts Extracting the number of forum add discussion
OR forum add reply words Students do not have a minimum/maximum
number of words.
Relevant Actions
Number of relevant actions in the LE Total of relevant actions considered
Actions such as log in, log out, profile updating, check calendar, refresh content,
etc. are dismissed.
Variables related to procrastination
Day’s Tasks
How long students wait to check the task since it was made
available in the LE (in days)
Date of task view since the task was made available
Students have a period of 15 days to complete the tasks.
Day’s “hand-in”
The time taken to hand in the task since the task was made available
at in LE (in days)
Date of quiz close attempt since the task was made available
Students have a period of 15 days to hand in the tasks.
Figure 1. Graphic representation of clustering
Proceedings of the 8th International Conference on Educational Data Mining 577

Educational Data Mining in an Open-Ended Remote Laboratory on Electric Circuits. Goals and Preliminary
Results Jordi Cuadros
Lucinio González IQS Universitat Ramon Llull
Via Augusta 390 08017 Barcelona (Spain)
+34 932 672 000{jordi.cuadros, lucinio.gonzalez
@iqs.url.edu}
Susana Romero M. Luz Guenaga
Javier Garcia-Zubia Pablo Orduña
Universidad de Deusto Avda. Universidades, 24
48007 Bilbao (Spain) +34 944 139 000
{sromeroyesa,mlguenaga,zubia,pablo.orduna @deusto.es}
ABSTRACTWebLab-Deusto is a learning environment used at the University of Deusto as the landing platform to several remote laboratories currently used in high school and university level courses. One of these remote labs is VISIR, a remote electricity kit that can be used in teaching DC and AC circuits. As happens in any open-ended educational environment, it is difficult to assess the learning effects of this tool. Fortunately the communication between the users and the VISIR remote lab in the Weblab-Deusto leaves behind a set of log information that can be analyzed. This contribution presents our current work-in-progress in analyzing these logs for better understanding the learning processes that take place when using this remote lab.
KeywordsRemote lab, logging, learning, physics, electric circuit
1. INTRODUCTION WebLab-Deusto [1] is an open-source management system for remote laboratories in development at DeustoTech, Universidad de Deusto since 2001. Its features web and mobile access to several remote laboratories in different topics, e.g. programming or physics.
One of the remote labs that is used through this platform is VISIR [2], a remote laboratory which supports experimentation with electric circuits (see Figure 1).
As is common in using open-ended educational environments, it is difficult for students, teachers and researchers alike to understand and to assess how to use them to improve learning.
Fortunately, the use of VISIR through the WebLab allows collected each of the circuits made by the students and sent to the remote lab for its construction.
Figure 1. Web interface to VISIR in WebLab-Deusto
This work describes the data collected in WebLab-Deusto for the VISIR remote lab and it presents our efforts to provide (a) a tool for teachers to check students’ work, and (b) a toolbox for a quick understanding of the students’ activity when the lab is used in medium-to-large class settings.
2. WEBLAB-DEUSTO VISIR DATA COLLECTION As indicated above, any call to the VISIR remote lab in the WebLab-Deusto system is collected to a database.
Each register in the collected data includes the following fields:
studentId, a key corresponding to each student, sessionId, a WebLab-Deusto session key, requestTime, a date/time indicating when the request was made, responseTime, a date/time indicating when the response was sent back to the web client,
Proceedings of the 8th International Conference on Educational Data Mining 578
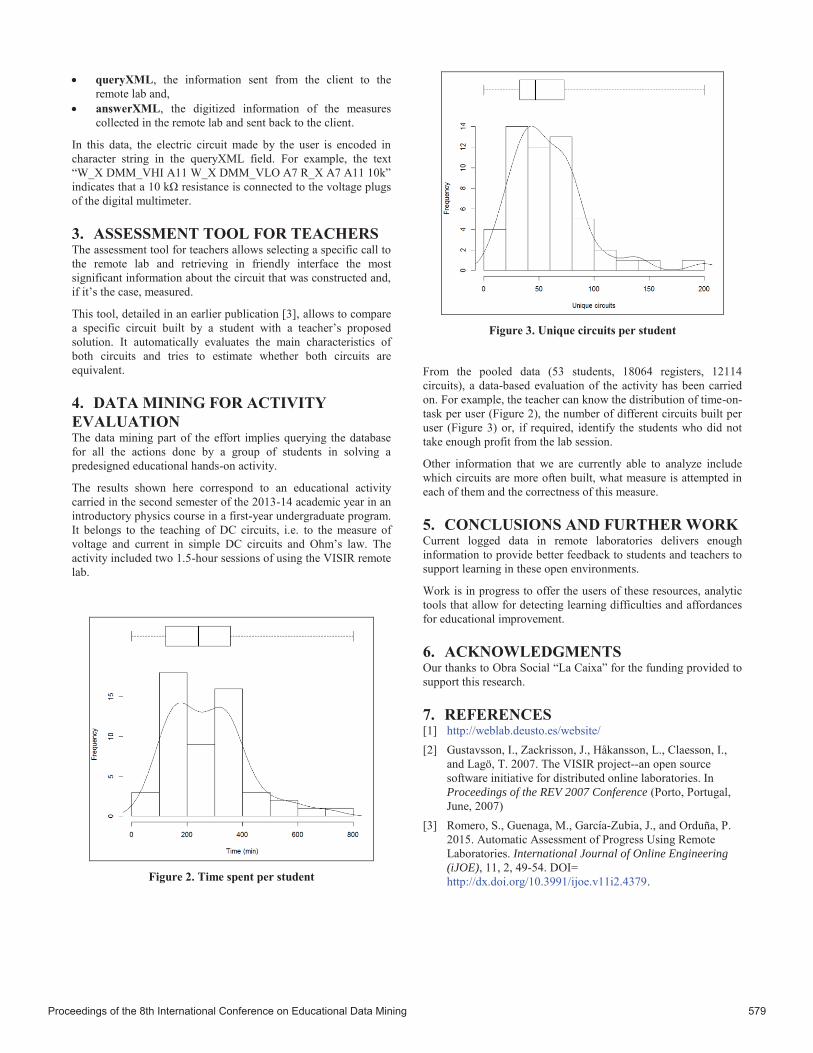
queryXML, the information sent from the client to the remote lab and, answerXML, the digitized information of the measures collected in the remote lab and sent back to the client.
In this data, the electric circuit made by the user is encoded in character string in the queryXML field. For example, the text “W_X DMM_VHI A11 W_X DMM_VLO A7 R_X A7 A11 10k” indicates that a 10 kΩ resistance is connected to the voltage plugs of the digital multimeter.
3. ASSESSMENT TOOL FOR TEACHERS The assessment tool for teachers allows selecting a specific call to the remote lab and retrieving in friendly interface the most significant information about the circuit that was constructed and, if it’s the case, measured.
This tool, detailed in an earlier publication [3], allows to compare a specific circuit built by a student with a teacher’s proposed solution. It automatically evaluates the main characteristics of both circuits and tries to estimate whether both circuits are equivalent.
4. DATA MINING FOR ACTIVITY EVALUATION The data mining part of the effort implies querying the database for all the actions done by a group of students in solving a predesigned educational hands-on activity.
The results shown here correspond to an educational activity carried in the second semester of the 2013-14 academic year in an introductory physics course in a first-year undergraduate program. It belongs to the teaching of DC circuits, i.e. to the measure of voltage and current in simple DC circuits and Ohm’s law. The activity included two 1.5-hour sessions of using the VISIR remote lab.
Figure 2. Time spent per student
Figure 3. Unique circuits per student
From the pooled data (53 students, 18064 registers, 12114 circuits), a data-based evaluation of the activity has been carried on. For example, the teacher can know the distribution of time-on-task per user (Figure 2), the number of different circuits built per user (Figure 3) or, if required, identify the students who did not take enough profit from the lab session.
Other information that we are currently able to analyze include which circuits are more often built, what measure is attempted in each of them and the correctness of this measure.
5. CONCLUSIONS AND FURTHER WORK Current logged data in remote laboratories delivers enough information to provide better feedback to students and teachers to support learning in these open environments.
Work is in progress to offer the users of these resources, analytic tools that allow for detecting learning difficulties and affordances for educational improvement.
6. ACKNOWLEDGMENTS Our thanks to Obra Social “La Caixa” for the funding provided to support this research.
7. REFERENCES [1] http://weblab.deusto.es/website/[2] Gustavsson, I., Zackrisson, J., Håkansson, L., Claesson, I.,
and Lagö, T. 2007. The VISIR project--an open source software initiative for distributed online laboratories. In Proceedings of the REV 2007 Conference (Porto, Portugal,June, 2007)
[3] Romero, S., Guenaga, M., García-Zubia, J., and Orduña, P. 2015. Automatic Assessment of Progress Using Remote Laboratories. International Journal of Online Engineering (iJOE), 11, 2, 49-54. DOI=http://dx.doi.org/10.3991/ijoe.v11i2.4379.
Proceedings of the 8th International Conference on Educational Data Mining 579

Discovering Process in Curriculum Data to ProvideRecommendation
Ren WangDepartment of Computing Science
University of [email protected]
Osmar R. ZaïaneDepartment of Computing Science
University of [email protected]
ABSTRACTProcess mining is an emerging technique that can discoverthe real sequence of various activities from an event log, com-pare different processes and ultimately find the bottleneck ofan existing process and hence improve it. Curriculum datais the history of the courses effectively taken by students.It is essentially process-centric. Applying process miningon curriculum data provides a means to compare cohortsof students, successful and less successful, and presents anopportunity to adjust the requirements for the curriculumby applying enhancement of process mining. This can leadto building recommenders for courses to students based onexpected outcome. In this paper we first discover a processmodel of students taking courses, then, compare the pathsthat successful and less successful students tend to take andhighlight discrepancies between them. The conclusion wereached is that process mining indeed has a great potentialto assist teachers and administrators to understand studentsbehavior, to recommend the correct path to students, andat last to enhance the design of a curriculum.
1. INTRODUCTIONThe term curriculum often refers to a predefined recom-mended or mandatory sequence of actions including coursesor resources for students. It is designed by a school or auniversity in order to achieve some educational goals. Tomaximize this goal, some constraints are frequently imposed,e.g., students must take some specified courses before tak-ing others. Given the liberal approach for selecting coursesand taking into account these prerequisites for the coursesand the requirements for the programs, students can followdifferent paths from start to finish. Discovering and under-standing the process students follow, or some cohort, such asthe most successful learners, can be very indicative to cur-riculum administrators and can also be the basis for a recom-mender system to recommend appropriate paths to studentsin terms of courses to take and in terms of prioritizing the se-quence of courses. The common way to analyze educationaldata is using simple statistics and traditional data mining.
However statistics and conventional data mining techniquesdo not focus on the process as a whole, and do not aim atdiscovering, analyzing, nor providing a visual representationof the complete educational process [3]. Process mining con-sists of extracting knowledge from event logs recorded by aninformation system and is inherent in discovering businessprocess from these event logs, comparing and conformingprocesses, and providing mechanisms for improvements inthese processes[4]. Process mining techniques are often usedin the absence of formal description of the process and canprovide a visualization with a flowchart as a sequence ofactivities with interleaving decision points or a sequence ofactivities with relevance rules based on data in the process.
Some attempts have already been made to exploit the powerof process mining in curriculum data, historical data en-compassing the sequence of courses taken by students. Forinstance, the authors of one chapter in [2] give a broad in-troduction of process mining and indicate that it can beused in educational data. The first paper that proposes toutilize process mining on curriculum data is [3]. The mainidea is to model a curriculum as a Colored Petri net us-ing some standard patterns. [1] directly targets curriculumdata and brings up a notion called curriculum mining. Sim-ilar to the three components of process mining, it clearlydefines three main tasks of curriculum mining, which arecurriculum model discovery, curriculum model conformancechecking and curriculum model extensions.
The application of process mining on curriculum data offersa wide range of possibilities. First it can help the educatorsunderstand and make better decisions with regard to theoffered curriculum. For example, what is the real academiccurriculum? Are there paths seldom used and others morepopular? Do current prerequisites make sense? Are the par-ticular curriculum constraints obeyed? How likely is it thata student will finish the studies successfully or will drop out?It can also assist students to choose among different optionsand even make recommendations to students. For instance,How can I finish my study as soon as possible? Is it more ad-vantageous to take course A before B or B before A? ShouldI take courses A and B or courses B and D this semester inorder to maximize my GPA? Answering such questions toboth educators and students can greatly enhance the edu-cational experience and improve the education process. Weshow in this paper how some of these questions can be an-swered using the history of courses taken.
Proceedings of the 8th International Conference on Educational Data Mining 580

2. CURRICULUM DATAAlthough the data about courses have already been collectedby the Computing Science department of the University ofAlberta, we cannot publish any result related to such datadue to lack of ethical approval. However, we wrote a curricu-lum simulator to mimic the behaviors of different kinds ofstudents from the department and be as close as possible tothe real data. First, we predefined a set of rules or require-ments similar to those in the offered programs in the depart-ment. For example, prerequisites, i.e. some specified coursesmust be taken before the student takes another one. Otherrequirements include the first and the last course a studentmust take, mandatory courses, and non-coexisting courses,i.e. if the student takes one course in the group then theycannot take any other course belonging to the same group.Then, we generated students in three categories: the respon-sible students who always satisfy the course constraints; thetypical students who seldom violate course constraint rules;and the careless students who often do not follow the setrules. Moreover, we differentiated the students based on therange of marks they are assigned in courses they take cre-ating clusters of successful and less successful students. Wegenerated the historic courses data for each student addingsome probability that a student withdraws from a coursegiving the course load and previous withdrawing behavior.
3. DATA ANALYSISThe final goal is to examine what kind of paths successfulstudents tend to take and what is the discrepancy betweensuccessful students and less successful students so that wecan make recommendations to steer the students to the suc-cessful paths. Since we have predefined rules for differenttypes of students in our simulations, the goal is to verifywhether we can discern these rules purely from the modelwe discover by process mining. If we can find the rules fromthe model, then we are safe to say it is possible to distinguishthe ”correct path” that can yield the best result by means ofprocess mining, thus a recommendation, that closes the gapamong students, can be achieved.
The several process models that were discovered from thecurriculum log are close portrayal of real curriculum mod-els in our computing science department. Each model cov-ers the most frequent activity paths, given some thresholds.This is because the model map would be too dense and clut-tered to recognize patterns if we present all of them. Weadded an additional activity at the end of each case to indi-cate the type of the student. In practice, this type can be anycohort of students such as based on the GPA ranges, basedon graduation distinction, withdrawal, or other criteria. Toinspect students’ behavior patterns in more detail, we fur-ther filtered the model with their last activity, i.e., parti-tioning students based on their type so that we can comparethem. The rules we imposed while generating the curricu-lum data can indeed be easily verified. For the students whoseldom violate course constraint rules, the frequent pathsappear very similar to those of the first group. However,contrasting the complete graphs of these groups reveals pe-culiar paths specific to one or the other group. The contrastis even more pronounced when comparing the responsiblestudents and the careless students, as defined in the data.This grouping can be a placement test in some other cases.The categorization can also be done at the end of the paths
based on the outcome at the end of the program or the endresult for a given course. This allows contrasting the pathstaken by successful students with other paths at the end ofa program, or comparing the initial paths of students whodropped out of a course to paths leading to the same coursetaken by those who finish that course. The result of contrast-ing paths of different cohorts of students stresses out desiredand undesired paths specific to some groups, the analysis ofwhich can highlight recommendations for new prerequisitesto align new students from a potentially undesired path tothe desired one. In the case of drop-outs from courses, thisanalysis provides insights on the potentially faulty sequenceof courses or lack of certain courses in the sequence thatlead to higher risk of dropping out. In addition to providingbetter understanding of the curriculum data and a way todiscern between behaviors of different cohorts of students,contrasting between process models from different groups ofstudents presents an opportunity for a course recommendersystem. By contrasting between the processes followed bystudents grouped based on their course outcome or basedon final GPA, we can find and visualize the sequences ofcourses that lead to the highest probability of success fora given course. Based on the courses already taken by astudent, the system can indicate the options to take thathave the highest chance to improve the GPA. Similarly, thesystem can recommend to take a course before another tomaximize outcome. The same data can also be used by ad-ministrators to define new prerequisites for courses and thusimprove the chance for the adoption of better paths. We arecurrently building such a recommender system for students.The system would use evidence from historical data to pro-vide comparison of average ranges of prospective marks if astudent follows one path or the other when selecting courses.
4. CONCLUSIONProcess mining, to discover sequences of courses taken bystudents, is indeed a powerful tool to analyze curriculumdata. By this means, we can visualize and formalize the realpaths students actually take, and reveal the underlying pat-terns such as prerequisites and other constraints. Moreover,conformance in process mining can reveal paths that areunexpectedly not followed by students. Furthermore, con-trasting processes from different cohorts of students discloseshidden specificity that we can act upon. Most importantly,contrasting processes provides means to recommend moreappropriate sequences of courses to students personalized totheir own cases and exposes new insights to administrators.
5. REFERENCES[1] M. Pechenizkiy, N. Trcka, P. De Bra, and P. Toledo.
Currim: Curriculum mining. In Intl. Conf. onEducational data Mining, pages 216–217, 2012.
[2] C. Romero, S. Ventura, M. Pechenizkiy, and R. Baker.Handbook of educational data mining. CRC Press, 2010.
[3] N. Trcka and M. Pechenizkiy. From local patterns toglobal models: Towards domain driven educationalprocess mining. In Intl. Conf. on Intelligent SystemsDesign and Applications, pages 1114–1119, 2009.
[4] W. Van Der Aalst. Process mining: discovery,conformance and enhancement of business processes.Springer Science & Business Media, 2011.
Proceedings of the 8th International Conference on Educational Data Mining 581

Proceedings of the 8th International Conference on Educational Data Mining 582

Proceedings of the 8th International Conference on Educational Data Mining 583

Exploring Problem-Solving Behavior in an Optics Game
Michael Eagle, Rebecca Brown, andTiffany Barnes
North Carolina State UniversityDepartment of Computer Science
{mjeagle, rabrown7,tmbarnes}@ncsu.edu
Elizabeth Rowe, Jodi Asbell-Clarke, andTeon Edwards
Educational Gaming Environments(EdGE) @ TERC
{elizabeth_rowe, jodi_asbell-clarke,teon_edwards}@terc.edu
ABSTRACTUnderstanding player behavior in complex problem solvingtasks is important for both assessing learning and for thedesign of content. Previous research has modeled student-tutor interactions as a complex network; researchers wereable to use these networks to provide visualizations and au-tomatically generated feedback. We collected data from 195high school students playing an optics puzzle game, Quan-tum Spectre, and modeled their game play as an interactionnetwork. We found that the networks were useful for vi-sualization of student behavior, identifying areas of studentmisconceptions, and locating regions of the network wherestudents become stuck.
1. INTRODUCTIONThis work presents preliminary results from our attempts toderive insight into the complex behaviors of students solvingoptics puzzles in an educational games using a complex net-work representation of student-game interactions. An Inter-action Network is a complex network representation of allobserved student-tutor interactions for a given problem ina game or tutoring system [3]. Professors using InVis weresuccessful in performing a series of data searching tasks; theywere also able to create hypotheses and test them by explor-ing the data [5]. InVis was also used to explore the behaviorof students in a educational game for Cartesian coordinates.Exploration of the interaction networks revealed off task be-havior, as well as a series of common student mistakes. Thedevelopers used the information gained from the interactionnetworks to change some of the user interface to reduce theseundesirable behaviors [4]. Regions of the network can bediscovered by applying network clustering methods, such asthose used by Eagle et al. for deriving maps high-level stu-dent approaches to problems [2]. This paper reports game-play data from 195 students in 15 classes collected as partof a national Quantum Spectre implementation study in the2013-14 academic year.
The Education Gaming Environments (EdGE @ TERC) re-
search group studies how games can be used to improvelearning of fundamental high-school science concepts. EdGEgames use popular game mechanics embedded in accuratescientific simulation so that through engaging gameplay, play-ers are interacting with digitized versions of the laws of na-ture and the principles of science. We hypothesize that asplayers dwell in scientific phenomena, repeatedly grapplingwith increasingly complex instantiation of the physical laws,they build and solidify their implicit knowledge over time.Previous work for a game Impulse used an automated detec-tor of strategies in the game [1]. In this study, we examinehow interaction networks can be used to visually measurethe implicit science learning of students playing QuantumSpectre, a puzzle-style game that simulates an optics benchstudents might encounter in a high school physics classroom.
2. QUANTUM SPECTREQuantum Spectre is a puzzle-style designed for play in browsersand on tablets. Each level requires the player to direct one ormore laser beams to targets while (potentially) avoiding ob-stacles. For each level, an inventory provides the player withaccess to resources, such as flat and curved (concave, con-vex, and double-sided) mirrors, (concave and convex) lenses,beam-splitters, and more, that can be placed and orientedwithin the puzzle and that interact with and direct the laserbeams in a scientifically accurate manner. When the ap-propriate color laser beam(s) have reached all the targets, alevel is complete. The player earns three “stars” if the puz-zle has been solved in the fewest possible moves, two “stars”for a low number of extra moves, and one “star” for anysolution. Each placement or rotation of an object on thegame board counts as one move. A player can go onto tothe next level as soon as a puzzle is complete, regardless ofthe number of moves used, but the stars system provides anincentive for level replay and an understanding of the puz-zle’s solution. The game includes a range of scientificallyaccurate optical instruments and related science concepts,but for the research, three key scientific concepts were iden-tified: The Law of Reflection; Focal Point and Focal Lengthof Concave Mirrors; and Slope.
3. RESULTS AND DISCUSSIONTo construct an Interaction Network for a problem, we col-lect the set of all solution attempts for that problem. Eachsolution attempt is defined by a unique user identifier, aswell as an ordered sequence of interactions, where an inter-action is defined as {initial state, action, resulting state},from the start of the problem until the user solves the prob-
Proceedings of the 8th International Conference on Educational Data Mining 584

Figure 1: The approach map for problem number 18. This is a high-level view at student approaches to thispuzzle. The vertices represent sub-regions of the overall interaction network. Vertices are colored accordingto their game “star” score, with green being the optimal score, blue the less optimal, and orange for verysuboptimal states. The approach map is capturing students with poor approaches to the problem, theseregions are indicated by the dotted line.
lem or exits the system. The information contained in astate is sufficient to precisely recreate the tutor’s interfaceat each step. Similarly, an action is any user interactionwhich changes the state, and is defined as {action name,pre-conditions, result}. We chose to use only objects theplayer can interact with. We ignore the distinction betweenobjects of the same type, so the order of placement does notmatter. An example state could be {Flat Mirror(4,1,90),Flat Mirror(5,5,180)}: which would be a state describingtwo mirror objects with the first two numbers representingthe X and Y coordinates and the last representing the mir-rors angle.
The full graph of every state space and every action takenwas large, complex, and difficult to interpret in terms ofplayer understanding. In order to provide a high-level viewthat game designers and instructors could use to gauge play-ers’ mastery of game concepts, we clustered states using theApproach Map method from Eagle et al. [2]. The interac-tion network for problem 18, which had over 1000 uniquestates, is concisely represented as 17 region-level nodes asseen in figure 1.
This image is a simplified representation of the game board,with a mirror drawn in every location where a mirror wasplaced by an edge entering the cluster. “Active” pieces (thepiece that was moved or rotated to enter the cluster wasconsidered active for that move) were shown in blue, andinactive pieces (any pieces that remained unmoved on theboard during that action) were in black. The intention wasto show a milestone for each cluster: by looking at howeach student who entered a cluster got into that cluster, thereader could trace a given path from cluster to cluster andget an idea of how the students on that path had progressedthrough the puzzle.
Using the approach map we are able to derive an overviewof the student behaviors. Several of the derived regions rep-
resent poor approaches to solving the problem, this mirrorsthe results from Eagle et al. [2]. The region vertices areparticularly useful for discovering the locations where stu-dents transfer into the confusion regions, as these highlightthe places where student approaches contain misunderstand-ings. These results support the use of approach maps andinteraction networks for use in this game environment. In fu-ture work we will look for differences in student performanceon pre and posttest measures to see if there are differencesin overall approach that are predicted by pretest score orcan predict posttest score.
4. ACKNOWLEDGMENTSWe are grateful for NSF/EHR/DRK12 grant 1119144 andour research group, EdGE at TERC, which includes ErinBardar, Jamie Larsen, Barbara MacEachern, and Katie Mc-Grath.
5. REFERENCES[1] J. Asbell-Clarke, E. Rowe, and E. Sylvan. Working
through impulse: assessment of emergent learning in aphysics game. Games+ Learning+ Society, 9, 2013.
[2] M. Eagle and T. Barnes. Exploring differences inproblem solving with data-driven approach maps.Proceedings of the Seventh International Conference onEducational Data Mining, 2014.
[3] M. Eagle, D. Hicks, P. III, and T. Barnes. Exploringnetworks of problem-solving interactions. Proceedings ofthe Fifth International Conference on LearningAnalytics and Knowledge (LAK 15), 2015.
[4] M. Eagle, M. Johnson, T. Barnes, and A. K. Boyce.Exploring player behavior with visual analytics. InFDG, pages 380–383, 2013.
[5] M. W. Johnson, M. Eagle, and T. Barnes. Invis: Aninteractive visualization tool for exploring interactionnetworks.
Proceedings of the 8th International Conference on Educational Data Mining 585

Proceedings of the 8th International Conference on Educational Data Mining 586

Proceedings of the 8th International Conference on Educational Data Mining 587

Analyzing Students Interaction Based on their Responsesto Determine Learning Outcomes
Fazel KeshtkarSoutheast Missouri State University
One University Plaza, CapeGirardeau, MO, [email protected] Crutcher
Southeast Missouri State UniversityOne University Plaza,Cape
Girardeau, MO, [email protected]
Jordan CowartSoutheast Missouri State University
One University PlazaCape Girardeau, MO, USA
Ben KingenSoutheast Missouri State University
One University PlazaCape Girardeau, MO, USA
ABSTRACTOnline learning platforms such as Moodle and MOOC (Coursera, edX, etc) have become popular in higher education. These platforms provide information that are potentially useful indeveloping new student learning models. One source ofinformation provided by these platforms is in the form of student interaction with one another, instructors, and the platform itself. These interactions contain various activities such as: participation in forum discussion, how frequently a student is logged into their account, and frequency of reading posted activities, etc. Using Data Mining techniques, namely clustering algorithms to find students with similar behavior patterns, our goal is to develop a student model that can be conducted by learning these interaction patterns. In doing so, we aim to develop a method by which toprovide students with different guidelines and instructions that will help to improve their performance. This research is inprogress and our data include Moodle online courses in computer science in different semesters.
KeywordsOnline Learning, Student Behaviors, Student Outcomes, Moodle,Data Mining, Clustering, Educational Data Mining
1. INTRODUCTION Detecting students’ performance is one of the most crucial tasks inonline learning and educational data mining (EDM), a task whichfalls under the scope of classification/clustering or otheralgorithms. Various learning methods have been applied to detectcourse results and academic performance with each learningalgorithm performing differently with different datasets [4]. TheNo Free Lunch Theorem states that it is difficult to choose aspecific model or classification algorithm for this difficult task[2]. Therefore, discovering and applying appropriate methods fora specific dataset should yield a significant improvement in theeffectiveness of a given learning algorithm. Our approach willapply learning algorithms based on metadata, as they have provento be sufficient to address this problem [2]. These meta-learningalgorithms have been studied by exploring metadata to adoptsuitable algorithm based on data mining and machine learningtechniques [5]. In this research, we propose to apply variousclassifications/clustering models, evaluation measurements, andstatistical analysis test to predict the performance of students’learning outcomes based on new dataset. This paper focuses on aportion of our statistical analysis, namely the examination ofstudent response times to professor activity.
2. DATASET Our dataset contains student and professor metadata from elevencourses over two semesters at Southeast Missouri StateUniversity. The metadata is in the form of log data from theonline learning platform that the school uses, Moodle. In order todetermine which of the features the metadata provides, we haveperformed rudimentary statistical analysis using SPSS. A basicoverview of our dataset is provided in Table 1.
Table 1. Course OverviewCourse Number of
StudentsNumber ofinteractions
AverageInteractions
CS1 12 4281 356.75
CS2 53 14006 264.26
CS3 23 3891 169.17
IS1 33 26682 808.55
IS2 31 20049 646.74
IS3 10 7906 790.60
IS4 13 13311 1023.92
IS5 19 10986 578.21
IS6 30 31433 1047.77
IS7 7 13150 1878.57
UI1 27 7127 263.96
2.1 Data Processing For this portion of analysis, we analyze CS2 (bold in Table 1.) forstudents interaction response times; this was due to the largesample size it provided with respect to the other courses in ourdataset. There were five students that failed to complete thiscourse, so they were dropped from the dataset for this particularportion of analysis to prevent data skewing in the later weeks ofthe class.
Proceedings of the 8th International Conference on Educational Data Mining 588

3. METHODOLOGY We propose that applying data mining techniques and statisticalanalysis of metadata from an online learning platform will allowus to derive insights into student interaction patterns. Using theseinsights, we theorize that a student learning model can bedeveloped by learning these interaction patterns. In doing so, weaim to develop a method by which to provide students withdifferent guidelines and instructions that will help to improve theirperformance.
3.1 Feature Selection Our dataset explicitly provides the following features: the coursein which an activity occurred, the time of occurrence, the IPaddress from which an activity originated, the user whichperformed the action, the action occured (course, user,assignment, and grade view), and information about the actioncompleted.
There are also metadata that are not explicitly provided in thedataset but can be extracted. For example, our dataset doesprovide with specifics of the activity that the student is performing(e.g. posting to a forum, content of their posts, etc.) . However, weaware that a student is automatically logged out from theirMoodle account if they have not performed an activity within 15minutes. Using this knowledge, we can then determine when astudent is logged out, approximately number of times they login,and the time interval between logins. We are aware that that theremay be more metadata hidden within our dataset that maybefound upon closer examination that we plan to consider for futureresearch. Finally, we consider statistical features that have been extracted.For this portion of the analysis we considered how quickly thestudents responded to activities made by the professor; theseactivities include: updates to materials, posting of assignments,and updating student grades. We have computed the averagestudent response time per activity, a sample standard deviation forthe response time per activity, the total average response time anda sample standard deviation for the course during the first twoweeks and the entirety of the course. We have also computed thetop ten activities that resulted in the quickest average responsetimes and the top ten activities that resulted in the slowest averageresponse times.
4. RESULTS AND DISCUSSION One of our goals was to explore trends in how students interactwith their course over the duration of a semester and, morespecifically, how quickly they react to activities performed bytheir professor. We noticed that when a professor interacts withMoodle, they typically perform a lot more than one action. Forour statistics, we counted the time it took for each student in thecourse to respond to the last update to the course page that aprofessor made in a continuous block of interactions. For each ofthese interactions, we then calculated the average response timeper student and the overall average response time for thatparticular activity. The average response times per activity areshown in Figure 1. We can see that student activity has fluctuatesthroughout the semester, but further analysis is needed todetermine possible causes for these fluctuations. The only readilyexplainable peak is activity thirty, which occurred during a fiveday break.
5. RELATED WORKS Wang [6] has indicated a need for the examination of log analysiswithin online learning platforms, namely the examination of
indicators of participation such as use of discussion forums, quizcompletion rate, and video usage. The research of Yudelson et al[7]. indicates that finding and analyzing certain sub-populationswithin a student body can produce a better predictive model thanthat of examining the entire population; importantly, these sub-populations tend produce a more substantial data footprint [7].The research of Coffrin et al. indicates that student interactivityand success during the first two weeks of a course strongly relatedto their outcomes at the end of the course. They also suggestedthat identifying students based on their patterns of engagementpresents the opportunity of tailored feedback to these sub-populations [1].
6. ACKNOWLEDGMENTS This research is funded by GRFC grant, Southeast Missouri StateUniversity.
7. REFERENCES 1. Coffrin, C., Corrin, L., Barba, P., Kennedy, G. Visualizing
patterns of student engagement and performance in MOOCs.Proceedings of the Fourth International Conference onLearning Analytics and Knowledge. 2014.
2. Hamälainen, W., Vinni M. Classifiers for educational datamining; Handbook of Educational Data Mining. Chapman &Hall/CRC. 2011.
3. Ho T.K., Basu M. Complexity measures of supervisedclassification problems. IEEE Transactions on PatternAnalysis and Machine Intelligence, 24(3):289-300, 2002.
4. Romero, C. and Ventura, S. Data Mining in Education. WireInterdisciplinary Reviews: Da-ta Mining and KnowledgeDiscovery, 3:12-27. 2013.
5. Song, Q, Wang, G, Wang, C. Automatic recommendation ofclassification algorithms based on dataset characteristics.Pattern recognition. 45, 2672–2689, 2012.
6. Wang, Y. MOOC Learner Motivation and Learning PatternDiscovery - A Research Prospectus Paper. Proceedings of the7th International Conference on Educational Data Mining.2014.
7. Yudelson, M., Fancsali, S., Ritter, S., Berman, S., Nixon, T.,Joshi, A. Better Data Beat Big Data. Proceedings of the 7thInternational Conference on Educational Data Mining. 2014.
Figure 1. Average response times per activity.
Proceedings of the 8th International Conference on Educational Data Mining 589

Exploring the Impact of Spacing in Mathematics Learningthrough Data Mining
Richard TibblesDepartment of Cognitive ScienceUniversity of California, San Diego
9500 Gilman DriveSan Diego, California, [email protected]
ABSTRACTLaboratory studies suggest that long term retention of Math-ematics learning is enhanced by spaced, as opposed to massed,practice. However, little evidence has been evinced to demon-strate that such spaced learning has a positive impact inreal world learning environments, at least partly because ofentrenched pedagogy and practice, whereby students are en-couraged to engage with Mathematics in a very sequentialmanner - thus leading to massed learning episodes. Indeed,much educational practice and the structure of Mathemat-ics textbooks lend themselves to massed rather than spacedlearning. However, in online learning such spaced practice ispossible and more practically achieved. Predicting learneroutcomes from data in a popular online Mathematics learn-ing site shows that in this data set spacing seems to have anegative effect on retention at a later time.
KeywordsMathematics, spaced learning, learning science, online learn-ing
1. INTRODUCTIONLearning efficiently is one of the main drivers of personalizedinstruction. By ensuring that students engage with materialonly for as long as they need to in order to master it, in-telligent instruction can push students further in less time,allowing outcomes to be improved more rapidly, and also toreduce the risk of boredom and loss of motivation. In ad-dition, retention over longer time scales is important to thegoals of Education as a whole. While the old adage “Educa-tion is what is left once what is learned has been forgotten”is oft quoted, in many Educational contexts, and in particu-lar Mathematics, the necessity of prerequisite knowledge forlearning higher order material means that such forgetting isfar less desirable.
Until relatively recently in pedagogical practice (as shown
by the design of Mathematics textbooks), it was thoughtthat the most efficient way for a student to learn Mathemat-ics in a way that facilitated later retrieval was overlearning- the continued practice of a procedure after mastery hasbeen achieved. This massed (as opposed to spaced) prac-tice model explains the design of Mathematics textbooks,where, by chapter, exercises are massed by a small num-ber of procedures that need to be applied. By contrast, aspaced learning methodology would require intermingled ex-ercises requiring application of different kinds of procedure,but with procedures recurring multiple times over severalstudy sessions.
Spacing has been a core component of recent advances inour understanding of the Science of Learning. Rohrer andPashler[7], drawing on work by Rohrer and Taylor[8], iden-tify the empirical support for using such spaced learningepisodes in the learning of Mathematics. Rickard et al.[6]examined the role of spacing in promoting retrieval over cal-culation in mathematics, and spacing of learning has beenassessed in the college Mathematics classroom by Butler andcolleagues[1]. Both found spacing to have positive effectson Mathematics learning. However, most recent work hasfocused more on the effect of spacing on declarative factlearning, with much of the successful practical applicationfocused on foreign language vocabulary learning[4][5][9]. Ifthese techniques can be extended to Mathematics learning,then considerable learning gains could be achieved.
Such hypotheses are best tested through a more controlledmanipulation of the spacing regime - in the online learningcontext, using an A/B test common in most website im-plementations. Exposing some subset of users to a spacedlearning regime, while recommending massed learning to theremainder. However, it is also possible to examine the im-pact of spaced learning in a somewhat more confounded wayby looking at spaced learning that has occurred naturallyduring the course of student engagement.
2. DATAThe data being analysed are logs from Khan Academy’s in-teractive Mathematics exercise platform. Students answerexercises, and are given instant feedback. The data recordedfor each attempt includes the exercise type, the instance ofthe exercise, the answers given by the student, the time thestudent spent on the page while answering, the time it wasattempted, and whether the student used a hint or not.
Proceedings of the 8th International Conference on Educational Data Mining 590

2.1 Spaced LearningKhan Academy has attempted to implement spaced learn-ing within its site design mostly derived from the spacedrepetition algorithm popularized by Leitner[3]. In the Leit-ner System cards that have been correctly memorized arepushed back into a later set, whereas incorrectly answeredcards are placed into the first set. The first set is reviewedon every cycle, with each set beyond being reviewed one lesstime per cycle (for N boxes, a cycle will consist of N reviewsessions).
The variable implementation of this spacing design over timein the Khan Academy site (including the use of A/B testingfor various implementations of this spaced repetition algo-rithm), in addition to the voluntary engagement with thesoftware by student users has served to create a data setwith a large variety of spacing schemes (although somewhatconfounded by other variables). Using this data, we are con-ducting a post hoc analysis of spaced versus massed practice.This will help to shed light on the impact of spaced repeti-tion on learning of particular Mathematics skills.
3. ANALYSISRecent experimental studies on spaced learning have gener-ally been constructed around one or more temporally sep-arated (by periods of more than a day) study sessions, fol-lowed by a further temporally separated recall session, whereretention of what has been learned is measured[2]. In orderto emulate this design for each student, data, subdivided byexercise, were separated into study sessions (any gaps of aday or more were assumed to constitute a separate studysession). In order to have an outcome measure by which tomeasure student learning, the final session was taken to bethe retention session.
3.1 Data SelectionIn order to ensure more meaningful comparisons, all stu-dent/exercise pairings with only one session associated withthem (and therefore no differentiable outcome measure) werediscarded, as were students who had made less than ten at-tempts across all sessions on that particular exercise. Arandom subsample was chosen for analysis, with data from13528 students, and a total of 155602 student/exercise pairs.All data were normalized before fitting in order to rendermodel coefficients more meaningful.
4. RESULTSIn order to assess the potential contribution of the effect ofspacing, a logistic regression model using L2 regularization(strength parameter set by 10-fold cross validation) was fit-ted to predict student performance during the retention ses-sion. The independent variables included in the model were:mean accuracy across all study sessions, mean accuracy inthe most recent study session, total time spent on exercisesduring study sessions, total number of study sessions, andtotal number of attempts during study sessions. While themodel performed relatively poorly, (achieving approximately58% accuracy on the test data) similar performance was seenpredicting from most subsets of the independent variables.Only total time spent failed to lend any power to the model.
Table 1: Coefficients for Normalized VariablesMean Study Accuracy 38.25Recent Accuracy -15.61Total Study Time 0.74Number of Study Sessions -13.36Study Attempts 8.59
5. CONCLUSIONSThe results seem to indicate that, at least in the case ofthe Khan Academy data, that spaced learning does not helpwith later retention. However, as much of the engagementtakes place over relatively short time scales (with the me-dian interval between study and retention being ten days).Further analysis will look at the impact of spaced learningnot only on later retention of that skill, but also on learningskills for which the learned skill is a prerequisite. This willallow the impact of spaced learning to be assessed absent thecompressed nature of engagement with individual exercises.
6. ACKNOWLEDGMENTSI acknowledge support from a Small Grant provided by theTemporal Dynamics of Learning Center, an NSF funded Sci-ence of Learning Center. I would also like to thank KhanAcademy for making the data available for analysis.
7. REFERENCES[1] A. C. Butler, E. J. Marsh, J. P. Slavinsky, and R. G.
Baraniuk. Integrating Cognitive Science andTechnology Improves Learning in a STEM Classroom.Educational Psychology Review, 26(2):331–340, June2014.
[2] N. J. Cepeda, E. Vul, D. Rohrer, J. T. Wixted, andH. Pashler. Spacing effects in learning a temporalridgeline of optimal retention. Psychological science,19(11):1095–1102, 2008.
[3] S. Leitner. So lernt man lernen. Herder, 1974.
[4] R. V. Lindsey, J. D. Shroyer, H. Pashler, and M. C.
Mozer. Improving studentsaAZ long-term knowledgeretention through personalized review. Psychologicalscience, 25(3):639–647, 2014.
[5] H. Pashler, N. Cepeda, R. Lindsey, E. Vul, and M. C.Mozer. Predicting the optimal spacing of study: Amultiscale context model of memory. In Advances inneural information processing systems, pages1321–1329, 2009.
[6] T. C. Rickard, J. S.-H. Lau, and H. Pashler. Spacingand the transition from calculation to retrieval.Psychonomic Bulletin & Review, 15(3):656–661, 2008.
[7] D. Rohrer and H. Pashler. Increasing retention withoutincreasing study time. Current Directions inPsychological Science, 16(4):183–186, 2007.
[8] D. Rohrer and K. Taylor. The shuffling of mathematicsproblems improves learning. Instructional Science,35(6):481–498, Nov. 2007.
[9] H. S. Sobel, N. J. Cepeda, and I. V. Kapler. Spacingeffects in real-world classroom vocabulary learning.Applied Cognitive Psychology, 25(5):763–767, 2011.
Proceedings of the 8th International Conference on Educational Data Mining 591

Toward Data-Driven Analyses of Electronic Text Books
Ahcène BoubekkiULB Darmstadt/TU Darmstadt
Ulf KröhneDIPF Frankfurt/M
Frank GoldhammerDIPF Frankfurt/M
[email protected] Schreiber
KU Eichstä[email protected]
Ulf BrefeldTU Darmstadt/[email protected]
ABSTRACTWe present data-driven log file analyses of an electronic textbook for history, called the mBook, to support teachers inpreparing lessons for their students. We represent user ses-sions as contextualised Markov processes of user sessions andpropose a probabilistic clustering using expectation maximi-sation to detect groups of similar (i) sessions and (ii) users.
1. INTRODUCTIONElectronic text books may offer a multitude of benefits toboth teachers and students. By representing learning con-tent in various ways and enabling alternative trajectories ofaccessing learning objects, electronic text books offer greatpotentials for individualised teaching and learning. Althoughtechnological progress passed by schools for a long time, in-expensive electronic devices and handhelds have found theirway into schools and are now deployed to complement tra-ditional (paper-based) learning materials.
Particularly text books may benefit from cheap electronicdevices. Electronic versions of text books may revolutioniserigour presentations of learning content by linking maps,animations, movies, and other multimedia content. How-ever, these new degrees of freedom in presenting and com-bining learning materials may bring about new challengesfor teachers and learners. For instance, learners need to reg-ulate and direct their learning process to a greater extent ifthere are many more options they can choose from. Thus,the ultimate goal is not only an enriched and more flexiblepresentation of the content but to effectively support teach-ers in preparing lessons and children in learning. To thisend, not only the linkage encourages users to quickly jumpthrough different chapters but intelligent components suchas recommender systems [4] may highlight alternative pagesof interest to the user. Unfortunately, little is known on theimpact of these methods on learning as such and even lit-tle is known on how such electronic text books are used bystudents.
In this article, we present insights on the usage of an elec-tronic text book for history called the mBook [5]. Amongothers, the book has been successfully deployed in the Ger-man-speaking Community of Belgium. We show how data-driven analyses may support history teachers in preparingtheir lessons and showcase possibilities for recommendingresources to children. Our approach is twofold: Firstly, weanalyse user sessions to find common behavioural patternsacross children and their sessions. Secondly, we aggregatesessions belonging to the same user to identify similar typesof users. This step could help to detect deviating learnersrequiring additional attention and instructional support.
2. THE MBOOKThe mBook is guided by a constructivist and instructional-driven design. Predominantly, the procedural model of his-torical thinking is implemented by a structural competencemodel that consists of four competence areas that are de-duced from processes of historical thinking: (i) the com-petency of posing and answering historical questions, (ii)the competency of working with historical methodologies,and (iii) the competency of capturing history’s potential forhuman orientation and identity The fourth competency in-cludes to acquire and apply historical terminologies, cate-gories, and scripts and is best summarised as (iv) declara-tive, conceptual and procedural knowledge.
Imparting knowledge in this understanding is therefore notabout swotting historic facts but aims at fostering a reflectedand (self-)reflexive way of dealing with our past. The under-lying concept of the multimedia history schoolbook imple-ments well-known postulations about self-directed learningprocess in practice. The use of the mBook allows an open-minded approach to history and fosters contextualised anddetached views of our past (cf. [3]). To this end, it is crucialthat a purely text-based narration is augmented with mul-timedia elements such as historic maps, pictures, audio andvideo tracks, etc. Additionally, the elements of the mainnarration are transparent to the learners. Learners quicklyrealise that the narration of the author of the mBook is alsoconstructed, as the author reveals his or her constructionprinciple.
3. METHODOLOGYFor lack of space, we only sketch the technical contribution.We devise a parameterised mixture model with K compo-nents to compute the probability of a user session. The
Proceedings of the 8th International Conference on Educational Data Mining 592

browsing process through chapters is modelled by a first-order Markov chain so that pages are addressed only bytheir chapter. The category model depends on the chaptersas we aim to observe correlations between different typesof pages. This may show for example whether galleries ofsome of the chapters are more often visited (and thus moreattractive) than others and thus generate feedback for theteachers (e.g., to draw students attention to some neglectedresources) and developers (e.g., to re-think the accessibilityor even usefulness of resources). The model for the connec-tion times is inspired by the approach described in [2] tocapture repetitive behaviour across weeks. The final modelis optimised by an EM-like algorithm.
4. EMPIRICAL RESULTSIn our empirical analysis, we focus on about 330.000 sessionscollected in Belgium between March and November 2014containing approximately 5 million events.
Session-based View: Figure 1 (top) shows the results of asession-based clustering. User sessions are distributed acrossthe clustering according to the expressed behaviour. Clus-ters can therefore be interpreted as similar user behavioursat similar times. The visualisation shows that all categoriesare clearly visible for all clusters, indicating a frequent usageof all possible types of resources by the users. Cluster C6possesses half of the mass on the weekend of category text.This indicates more experienced users who like to form theiropinion themselves instead of going to summary pages. Thesame holds for cluster C8 that possesses in addition only avanishing proportion of the home category. Small probabil-ities of category home as well as large quantities of categorytext indicate that users continuously read pages and do notrely on the top-level menu for navigation.
User-based View: Our approach can also be used to groupsimilar users. To this end, we change the expectation stepof the algorithm so that sessions by the same user are pro-cessed together. That is, there is only a single expectationfor the sessions being in one of the clusters. Clusters there-fore encode similar users rather than similar behaviour as inthe previous section.
Figure 1 shows the results. Apparently, the main differenceof the clusters is the intensity of usage during working daysand weekends. Cluster C2 for instance clearly focuses onworking day users who hardly work on weekends comparedto Cluster C1 whose users place a high emphasise on Satur-days and Sundays. Cluster C3 contains low frequency userswho rarely use the mBook and exhibit the smallest amountof sessions and page views per session. Cluster C8 containsheavy (at night) users with high proportions of category text.In general, we note that transition matrices are consistentbetween chapters in contrast to the session-based clustering,that is, test takers interact with most of the chapters.
5. DISCUSSIONOur results illustrate potential benefits from clustering learn-ers for instructional purposes. In the first place, the proba-bilistic clustering approach shows a way how to condense ahuge amount of logfile information to meaningful patterns oflearner interaction. Classifying a student into one of severalclusters reveals whether, when, and how the learner used
Figure 1: Resulting clusters for the session- (top)and user-based (bottom) clustering.
the materials offered by the electronic text book. Thus, theteacher can get information about the learners’ navigationspeed, whether part of the content was used in self-directedlearning processes as expected, whether learners came upwith alternative learning trajectories, and so on and so forth.This information can be used by the teacher in a formativeway (cf. the concept of formative assessment, e.g., [1]), thatis, it is directly used to further shape the learning processof students. For instance, in a follow-up lesson the teachercould simply draw the students attention to some parts ofthe book that have not or only rarely been visited. More-over, history and learning about history could be reflected ina group discussion of learners who used the mBook resourcesof a particular chapter in different ways.
6. REFERENCES[1] P. Black and D. Wiliam. Assessment and classroom
learning. Assessment in Education, 5(1):7–74, 1998.
[2] P. Haider, L. Chiarandini, U. Brefeld, and A. Jaimes.Contextual models for user interaction on the web. InProc. of the Workshop on Mining and ExploitingInterpretable Local Patterns, 2012.
[3] Y. Karagiorgi and L. Symeou. Translatingconstructivism into instructional design: Potential andlimitations. IFETS, 8 (1):17–27, 2005.
[4] F. Ricci, L. Rokach, B. Shapira, and P. B. Kantor,editors. Recommender Systems Handbook. Springer,2011.
[5] W. Schreiber, F. Sochatzy, and M. Ventzke. Dasmultimediale schulbuch - kompetenzorientiert,individualisierbar und konstruktionstransparent. InW. Schreiber, A. Schoner, and F. Sochatzy, editors,Analyse von Schulbuchern als Grundlage empirischerGeschichtsdidaktik, pages 212–232. Kohlhammer, 2013.
Proceedings of the 8th International Conference on Educational Data Mining 593

How to Visualize Success: Presenting Complex Data in a Writing Strategy Tutor
Matthew E. Jacovina, Erica L. Snow, Laura K. Allen, Rod D. Roscoe, Jennifer L. Weston, Jianmin Dai, and Danielle S. McNamara
{Matthew.Jacovina, Erica.L.Snow, LauraKAllen, Rod.Roscoe, Jennifer.Weston, Jianmin.Dai, Danielle.McNamara @asu.edu}
Arizona State University Tempe, AZ 85287
ABSTRACTIntelligent tutoring systems (ITSs) have been successful at improving students' performance across a variety of domains. To help achieve this widespread success, researchers have identified important behavioral and performance measures that can be used to guide instruction and feedback. Most systems, however, do not present these measures to the teachers who employ the systems in classrooms. The current paper discusses visualizations that will be displayed to teachers using the writing strategy tutor, Writing Pal. We present visualizations for both classroom and student level data and offer descriptions of each.
KeywordsVisualizations, intelligent tutoring systems, writing instruction.
1. INTRODUCTION Over the past several decades, intelligent tutoring systems (ITSs) have been successfully developed for and implemented across a variety of domains [1]. These computer-based systems are often designed to record every interaction, behavior, and performance marker a student achieves while using the system. Research in educational data mining has used these system logs to identify what data are most predictive of overall performance and learning [2], while research in the learning sciences has used system logs to tailor instruction to individual students [3]. The synthesis of this work yields more adaptive, effective systems.
The analysis of log data has helped develop complex computational algorithms that improve adaptability within ITSs by modeling the learner [4]. Learner models can be difficult to understand without experience in modeling and educational research, and as a result, researchers have developed visualization tools to render components of these models more accessible [5]. Such tools are important because of the potential disadvantages that may emerge when the teachers who use ITSs have little understanding of their underpinnings. For instance, teachers may be less likely to use a system if they do not understand a system's feedback or what drives the feedback [6]. Moreover, if a system does not convey appropriate and timely information about students, the instructor may be unable to intervene [7].
Visualizations provide one means of aiding teachers in deciphering the complexity of ITSs and making data-driven classroom decisions [e.g., 8]. Our team is working toward providing visualizations of student progress within the Writing
Pal (W-Pal), a writing strategy ITS designed for high school students. Writing Pal provides strategy instruction via lesson videos, game-based strategy practice, and essay practice with automated, formative feedback [9]. In this paper, we describe visualizations we have developed and implemented as well as those we are currently prototyping.
2. VISUALIZING DATA Our initial goal is to provide the most relevant and understandable data to teachers through intuitive visualizations. The following sections describe visualizations that we are developing for W-Pal’s teacher interface, where teachers view students’ progress.
2.1 Classroom Level Visualizations In a recent classroom implementation of W-Pal, five ninth grade classes with the same teacher used the system for approximately four months. We analyzed data from 90 consenting students. For the study, W-Pal’s teacher interface included a spreadsheet in which teachers could track students’ progress through the system activities (see Figure 1). However, during the study, this page did not provide a visual summary of the progress across students. Broadcasting the average number of activities attempted in a classroom of students who have generally stalled in their progression might prompt teachers to request that students not linger on particular topics or switch their focus. Future iterations of W-Pal will provide easily discernible bars that indicate the overall progress of classes. In Figure 1, the darker blue bars in the first four columns represent the percentage of activities attempted for those modules (a black rectangle highlights this feature).
Figure 1. Visualization of a classroom’s progress in W-Pal’s teacher interface; dark blue bars represent progress.
An important strength of W-Pal is the automated feedback it provides on students’ essays. The teacher interface allows teachers
Proceedings of the 8th International Conference on Educational Data Mining 594

to view each student’s submitted essays along with the feedback and score received. Currently, however, teachers do not have access to a summary of all students’ performance. For example, if the majority of students are struggling to properly structure their writing in W-Pal, teachers would remain unaware until they carefully perused students’ feedback messages. To provide teachers with a quickly consumable summary of the feedback that students are receiving, we are developing a visualization that displays the percentage of feedback triggered across all essays in a W-Pal class (see Figure 2). Using this information, teachers might adjust their own classroom instruction or assign students to interact with appropriate W-Pal lessons.
Figure 2. Visualization of the type of essay feedback students in a classroom have received.
2.2 Student Level Visualizations Our recent classroom study also revealed that the percentage of time that students selected different activities related to their persistence in the system. For example, there was a positive correlation between the percentage of game activities that students selected and the number of days they used the system [r(90) = .49, p < .001]. Thus, the percentage of activities attempted (i.e., videos, games, and essay practice) could be indicative of how likely students are to persist in the system. Teachers will be presented with this information via pie charts, which are useful for visualizing proportions of a whole [10] (see Figure 3).
Figure 3. Visualization of the activity breakdown for an individual student.
Similar to the activity breakdown available for each student, teachers will be able click students' names in the essay window to see breakdowns of essay feedback (see Figure 2 for a similar example). If a student is struggling with writing assignments in class, this visualization will give teachers a quick view of how W-Pal has assessed areas of weakness.
3. CONCLUSION In this paper, we argue for the importance of using visualizations to communicate data from ITSs to the teachers. Specifically, we describe classroom and student level visualizations that we are developing for the writing strategy tutor, W-Pal. When equipped
with these visualizations, teachers may be more likely to use asystem appropriately and to intervene when a student is not performing optimally. Future empirical work must test these visualizations, through techniques ranging from surveys to eye tracking [8], to determine their effectiveness in conveying information to teachers. As the understanding of how teachers use such visualizations grows, systems can provide teachers with intelligent tutors that better support classroom instruction.
4. ACKNOWLEDGMENTS This work was supported by the Institute of Education Sciences (IES), USDE Grant R305A120707 to ASU. Opinions, findings, and conclusions expressed are those of the authors and do not necessarily represent views of the IES.
5. REFERENCES [1] Graesser, A. C., McNamara, D. S., and VanLehn, K. 2005.
Scaffolding deep comprehension strategies through Point & Query, AutoTutor, and iSTART. Educational Psychologist,40, (2005), 225–234.
[2] Snow, E. L., Allen, L. K., Jacovina, M. E., and McNamara, D. S. 2015. Does agency matter?: Exploring the impact of controlled behaviors within a game-based environment. Computers & Education, 26, (2015), 378-392.
[3] Grigoriadou, M., Papanikolaou, K., Kornilakis, H., and Magoulas, G. 2001. INSPIRE: An intelligent system for personalized instruction in a remote environment. In Proceedings of 3rd Workshop on Adaptive Hypertext and Hypermedia (Sonthofen, Germany, July 14, 2001). Springer, Berlin, Germany, 13-24.
[4] Desmarais, M. C. and Baker, R. S. J. D. 2012. A review of recent advances in learner and skill modeling in intelligent learning environments. User Modeling and User-Adapted Interaction, 22, (2012), 9–38.
[5] Zapata-Rivera, J. D., and Greer, J. E. 2004. Interacting with inspectable Bayesian student models. International Journal of Artificial Intelligence in Education, 14, (2004), 127–163.
[6] Grimes, D. and Warschauer, M. 2010. Utility in a fallible tool: A multi-site case study of automated writing evaluation. The Journal of Technology, Learning and Assessment, 8, (2010). Retrieved from www.jta.org.
[7] Walonoski, J. and Heffernan, N. T. 2006. Prevention of off-task gaming behavior in intelligent tutoring systems. In Proceedings of the Eighth International Conference on Intelligent Tutoring Systems (Jhongli, Taiwan, June 26-30,2006). Springer, Berlin, Germany, 722–724.
[8] Vatrapu, R., Reimann, P., Bull, S., and Johnson, M. 2013. An eye-tracking study of notational, informational, and emotional aspects of learning analytics representations. In Proceedings of the Third International Conference on Learning Analytics and Knowledge (Leuven, Belgium, April 8-12, 2013). ACM, New York, NY, 125-134.
[9] Roscoe, R. D. and McNamara, D. S. 2013. Writing pal: Feasibility of an intelligent writing strategy tutor in the high school classroom. Journal of Educational Psychology, 105, (2013), 1010–1025.
[10] Spence, I. 2005. No humble pie: The origins and usage of a statistical chart. Journal of Educational and Behavioral Statistics, 30, (2005), 353–368.
Proceedings of the 8th International Conference on Educational Data Mining 595

Adjusting the weights of assessment elements in the evaluation of Final Year Projects
Mikel Villamañe, Mikel Larrañaga, Ainhoa Alvarez, Begoña Ferrero Department of Languages and Computer Systems
University of the Basque Country (UPV/EHU), Spain {mikel.v, mikel.larranaga, ainhoa.alvarez, bego.ferrero}@ehu.eus
ABSTRACT The authors of this paper have defined a continuous evaluation methodology for Final Year Projects, in which six different evaluable items are involved. However, establishing the weights of each assessment element in the evaluation of Final Year Projects is a complex process, especially when several teachers are involved [3] like in this case. In this paper, the experiment carried out in order to establish the weight each assessment element should have in the final mark of a Final Year Project is described.
Keywords
Final Year Projects, weight adjustment, experts’ validation
1. INTRODUCTION Finishing a Final Year Project (FYP) is a challenging task for all the involved actors, either students or lecturers. In a previous work, the authors conducted a study and concluded that the main problems during projects’ development are related to the evaluation process [7].
In many universities, the evaluation of the FYPs has been mainly based on a final dissertation of the work and a public oral defense in front of an examination board. This approach presents several drawbacks [6]. In order to overcome them, a set of 8 experts (teachers from the University of the Basque Country, with more than 10 years supervising FYPs) defined six elements to be taken into account and the responsible for their evaluation.
The supervisor of the project evaluates: an initial report including the project planning and requirements (Init_Report), the result of the design phase of the project (Design) and the students’ attitude during the process (Attitude).
The evaluation board evaluates: the final report of the project (End_Report), the oral defense (Defense) and the complexity of the project (Complexity).
To avoid the subjectivity, an evaluation rubric was created for each of the evaluable elements [4].
2. ADJUSTING THE WEIGHTS OF THE EVALUABLES According to the proposed FYP grading proposal [7], the final grade is computed as the weighted mean of the scores achieved in the assessable elements. Next, the experiment carried out to adjust those weights is described.
2.1 Data Set & Techniques In order to develop a model to accurately predict the mark of a FYP, a set of graded FYPs, including the final grade provided by the evaluation board using the traditional grading way and the grades for each of the items for those projects, are required.
In this experiment, 32 FYPs were evaluated. The collected data was randomly split into two data sets, training set, which contained 2/3 of the collected data, and the validation set, entailing the remaining data.
Adjusting the weight to compute the grade as accurate as possible in relation to the grades given by the evaluation board is a regression problem. Therefore, the first technique tested was the linear regression. In this experiment the target variable is the final mark and the features are the 6 items that according to experts should influence the final mark. The objective is to determine to which extent affects each element the final mark.
During this experiment, negative coefficients were inferred (see Table 1, LRModel). In the case of FYP, a negative value is not applicable as the assessable elements refer to aspects the FYP must satisfy, whilst a negative weight would mean that an undesirable or wrong feature is being evaluated. To overcome this problem, non-negativity constraints in the model should be enforced. Therefore, the Lawson-Hanson Non-negative least-squares technique [2] was used in the second phase of the experiment.
Table 1. Weights of each item in the final mark
Weights Analysis results
Init_Report Design Attitude End_Report Defense Complexity Correlations RMSE
LRModel 0.24 0.18 -0.08 0.37 0.11 0.15 0.95 0.49
NNLSModel1 0.1 0.26 0 0.31 0.19 0.14 0.97 0.31
NNLSModel2 0.25 0.08 0.08 0.46 0.13 0 0.85 0.55
NNLSModel3 0 0 0 0.52 0.32 0.16 0.96 0.35
Proceedings of the 8th International Conference on Educational Data Mining 596

2.2 Validation Procedure The validation process consisted in analyzing the extent to which the obtained model fits the data. With this objective, evaluation boards’ judgments and the marks obtained using the weights of the different models were compared computing two different metrics: Pearson correlation coefficients [5] and Root-Mean-Squared Error (RMSE) [1].
The admissible error for the model has to be defined taking into account the peculiarities of the process. In this case, according to the experts, it is a common practice to round the grades to 0.5 points intervals, being very unusual to find grades not matching this criterion. For example, grades such as 7 or 7.5 were observed in the training set, whereas intermediate grades similar to 7.2 were not found. Taking this into account, for this experiment 0.5 has been asset as the maximum admissible error.
2.3 Exploratory Analysis and Working Hypothesis The identified 6 features are considered independent factors for the final score, as they are evaluated in different stages of the FYP process. To determine the new models to compute the final grades of the FYPs, the authors stated the following hypotheses:
• H1: The factors identified by the expert board are appropriate predictors for the final grade of the FYPs.
• H2: the complexity of the FYPs is implicitly considered in the other evaluable elements.
• H3: The evaluation board can infer all the information needed from the End_report and the Defense.
Considering these starting hypotheses, the following models were defined for this experiment:
• LRModel: Model derived using linear regression and considering all the features. (Hypothesis H1)
• NNLSModel1: Model derived using the Lawson-Hanson Non-negative least-squares technique and considering all the features. (Hypothesis H1)
• NNLSModel2: Model derived using the Lawson-Hanson Non-negative least-squares technique and considering all the features except Complexity. (Hypotheses H1 and H2)
• NNLSModel3: a model derived using the Lawson-Hanson Non-negative least-squares technique only considering the End-report, the Defense and the Complexity. (Hypothesis H3)
3. RESULTS In this experiment, the models described above were derived using the training set and tested on the validation set.
As it can be observed in Table 1, the linear regression technique, used for LRModel, led to a model with negative coefficients for some features (Attitude). Although the performance was remarkably good, this is not an admissible model to grade FYPs because it would mean that negative aspects of the project are being measured.
NNLSModel2 had an RMSE of 0.55 points, which did not fit in the defined admissible error range. NNLSModel1 computed
grades with 0.97 correlation with the evaluation boards’ and 0.31 RMSE, whereas NNLSModel3 achieved 0.35 RMSE.
Taking into account the calculated RMSE, the best model is NNLSModel1 where all the features identified by the expert board are used (including Complexity). However, in this model Attitude has a weight of 0, i.e., it is not a statistically significant predictor for the final mark. Moreover, as shown in Table 1, with NNLSModel1 an error of 0.31 in a 10-point scale has been achieved. As previously mentioned, this is an admissible error for the evaluation of FYPs because it is inferior to 0.5.
4. CONCLUSIONS AND FUTURE WORK This paper has presented the experiment carried out in order to adjust the weights of assessment elements for the evaluation of FYPs. Several models have been evaluated, achieving a model with an error of 0.31 in a 10-point scale. One of the main results of the experiment is that the student’s attitude (Attitude) is not statistically significant to predict the final mark.
The best performing model considers elements that must be evaluated by the supervisor of the FYP in addition to the elements assessed by the evaluation board. This suggests that, even if the evaluation board can give a grade, for a detailed evaluation, the opinion of the person who better knows the project is required.
The main future work is related to the adjustment of weights for each dimension of the rubrics. Additionally, the authors will continue validating the obtained model with new evaluations.
5. ACKNOWLEDGMENTS This work has been supported by the Basque Government (IT722-13), the Gipuzkoa Council (FA-208/2014-B) and the University of the Basque Country (UFI11/45).
6. REFERENCES [1] Chai, T. and Draxler, R.R. 2014. Root mean square error
(RMSE) or mean absolute error (MAE)? – Arguments against avoiding RMSE in the literature. Geoscientific Model Development. 7, 3 (2014), 1247–1250.
[2] Lawson, C. and Hanson, R. 1995. Solving Least Squares Problems. Society for Industrial and Applied Mathematics.
[3] Quevedo, J.R. and Montanes, E. 2009. Obtaining Rubric Weights for Assessments by More than One Lecturer Using a Pairwise Learning Model. (Cordoba, Spain, Jul. 2009), 289–298.
[4] Stevens, D.D., Levi, A.J. and Walvoord, B.E. 2012. Introduction to Rubrics: An Assessment Tool to Save Grading Time, Convey Effective Feedback, and Promote Student Learning. Stylus Publishing.
[5] Taylor, R. 1990. Interpretation of the correlation coefficient: a basic review. Journal of diagnostic medical sonography. 6, 1 (1990), 35–39.
[6] Valderrama, E., Rullan, M., Sánchez, F., Pons, J., Mans, C., Giné, F., Jiménez, L. and Peig, E. 2009. Guidelines for the final year project assessment in engineering. 39th IEEE Frontiers in Education Conference, 2009. FIE ’09 (San Antonio, Texas, EE.UU., Oct. 2009), 1–5.
[7] Villamañe, M., Ferrero, B., Álvarez, A., Larrañaga, M., Arruarte, A. and Elorriaga, J.A. 2014. Dealing with common problems in engineering degrees’ Final Year Projects. (Madrid, 2014), 2663–2670
Proceedings of the 8th International Conference on Educational Data Mining 597

Predicting students’ outcome by interaction monitoringSamara Ruiz
Department of Languages and Computer Systems
University of the Basque Country, UPV/EHU
San Sebastian, Spain [email protected]
Maite Urretavizcaya Department of Languages and
Computer Systems University of the Basque Country,
UPV/EHU San Sebastian, Spain
Isabel Fernández-Castro Department of Languages and
Computer Systems University of the Basque Country,
UPV/EHU San Sebastian, Spain
ABSTRACT In this paper we propose to predict the students’ outcome by analyzing the interactions that happen in class during the course. PresenceClick lets teachers and students register their interactions during learning sessions in an agile way to give feedback in return about the students’ learning progress by means of visualizations. Some of the registered interactions are the students who are attending class and a subset of the students’ emotions felt during learning sessions. We have found correlations among attendance, emotions and performance in the final exam. This paper presents the study carried out to build a prediction model for the students’ mark in the final exam based on these interactions. The purpose is to advice teachers about students in risk to fail.
Keywords
F2F interactions, mark prediction, linear regression, decision tree
1. INTRODUCTION Drop out or failure is a common issue related to university students. Many studies have been carried out to detect students’ problems, or even to predict the students’ outcome, by applying data mining techniques to their interactions with intelligent tutoring systems [1] or course management systems [2] [3]. Other works include a wide range of potential predictors –i.e. personality factors, intelligence and aptitude tests, academic achievement, previous college achievements, or demographic data− to predict drop out and students’ performance in high school [4] [5]. However, these works leave aside all the information that can be collected from the interactions that happen in face-to-face learning, the most extended way of education.
During traditional learning courses there is no way to detect problems or to know the performance of students in the final exam, except applying the teacher’s intuition on the in-class students’ interactions. This is even more difficult as the number of students in class grows, which is a current common issue at university worldwide. In this line, this papers aims to answer the next research questions: Is it possible to predict the students’ outcome by analyzing the interactions that happen in class? And, can we detect any interaction that especially influences the mark?
2. PRESENCECLICK PresenceClick is a distributed and modular environment that captures the interactions in learning sessions in an agile way. On the one hand, the AttendanceModule automatically captures the list of attendees to class. On the other hand, the EmotionsModule lets teachers capture the emotional state of the classroom related to whatever specific activity of the course. Students quantifies their emotions (six positive –enjoyment, hope, pride, excitement, confidence and interest– and six negative –anxiety, anger, shame, hopelessness, boredom and frustration–) in a 6-likert scale questionnaire based on the models described in [6] and [7]. The analyzed data belong to two subjects of Computer Science:Modular and Object Oriented Programming, (MOOP) and Basic Programming (BP). In MOOP 97 students were enrolled whereas 81 students participated in BP. The data were collected asking students to fill different event questionnaires. The MOOP students were asked three times to fill events where 41, 20 and 41 students responded respectively. The BP students were asked six times and 56, 36, 57, 48, 29 and 13 students participated (last event participation was low due to a server problem).
3. PREDICTING OUTCOME Building a predicting model for students’ outcome in the final exam was aimed to let teachers foresee those students that could be in risk to fail in the subject or even drop out.
In MOOP 44 students out of 97 enrolled attended the exam and 50 responded at least one emotion event, while 59 students attended the exam from 81 students enrolled in BP and 68 responded at least one emotion event. As the students dropping out the subject precisely are an important sample set to study, and as a considerable number of students did not attend the exam in both subjects, three different cases were studied: (Case1 - NA=F) Students non attending the exam were not considered; (Case2 - NA=T; mean=F): Students non attending the exam were assigned 0 as mark; (Case3 - NA=T; mean=T): Students non attending the exam were assigned the mean of the fails as mark, where fails are all the students with mark<5.
The three phase experiment that follows was carried out.
3.1 Phase 1: Correlation analysis Pearson-correlation analysis was conducted between mark-attendance and mark-emotions. All the positive/negative emotions were gathered together, and the mean from all the events where each student participated was calculated in order to normalize the data. Table 1 shows the correlations for the three cases between mark-attendance, mark-positive emotions and mark-negative emotions. In both subjects attendance and students’ negative emotions influence the mark in the final exam (except when non
Proceedings of the 8th International Conference on Educational Data Mining 598

attendees to exam were not considered in BP) according to literature (p>|0.3|) [8]. Student’s positive emotions influence the mark only in MOOP. This could be due to the fact that being aware of the negative emotions is usually easier than being aware of the positive ones. In addition, we could also suppose that students expressing negative emotions in questionnaires are not lying, whereas students could increase the value of their positive emotions in order to be closer to the group feelings. Table 1. Correlations with the mark in MOOP
Case Attendance Pos emo Neg emo
MOOP
NA=F 0.45 (p=0.0048)
0.45 (p=0.0056)
-0.46 (p=0.0034)
NA=T, mean=F
0.6 (p=4.02e-06)
0.46 (p=0.0008)
-0.65 (p=3.78e-07)
NA=T, mean=T
0.54 (p=4.7e-05)
0.46 (p=0.0008)
-0.59 (p=5.45e-06)
BP
NA=F 0.25 (p= 0.071)
0.13 (p= 0.35)
-0.29 (p=0.034)
NA=T, mean=F
0.48 (p=0.0004)
0.28 (p=0.019)
-0.34 (p=0.0042)
NA=T, mean=T
0.39 (p=0.0009)
0.23 (p=0.054)
-0.33 (p=0.006)
3.2 Phase 2: Multiple linear regression In this stage of the experiment we looked for a model with a multiple linear regression analysis to predict the numeric mark of the student. For both subjects, 2/3 of the population was taken for training while the remaining was taken for validation. The three variables together were tested as dependent in order to predict the mark (w+ x* + y* + z* ). However, for all cases the standard deviation of the model prediction error rounded two points, which implies a margin too big (in a scale grade from 0 to 10, where fails are above 5). All the emotions were also studied individually to check if any of them could explain the mark, but the error rounded the two points.
3.3 Phase 3: Classification tree Finally, we ran a decision tree to predict whether a student drops out, fails or passes the exam. Data from both subjects were normalized and gathered in a unique dataset, and different models were tested taking into account different variables in order to find the one that better predicted the students’ performance. Figure 1 presents the decision tree for the training set that best predicted the students’ performance taking into account the attendance and the students’ negative emotions.
Figure 1. Training set’s classification tree
As we can see in table 2 failed students are not well predicted with a 30% precision and 50% recall (F1=37,5%), but dropping out students (F1=86,36%) and passing students are quite well predicted (F1=81,63%). The low correction of the fails could be due to the fact that few students are in this category and more data is required to refine the model. However, we consider that the most important measure is the recall for drop out and fail, in order to discover the students in risk and make the teacher aware. Taking into account that only 16% of failed students and 8,4% of
drop out students have been predicted with PASS, we can conclude that the model is quite good, although a major sample is needed in order to adjust it for a better prediction. Table 2. Predictions table
Real FAIL NA PASS Precis. Recall
Cla
ss FAIL 3 3 4 30% 50%
NA 2 19 2 82,61% 90,48% PASS 1 2 20 86,96% 76,92%
4. CONCLUSIONS This paper has presented the preliminary study developed to propose a predicting model for the students’ outcome in the final exam based on the interactions captured by the PresenceClick system. Those interactions data give teachers and students the possibility to avoid failure and drop out. So far, we have tested the attendance to class and the students’ emotions as model predictors. The study was divided in three phases: correlation analysis, multiple linear regression and decision trees. We founded that attendance as well as student’s emotions influence the mark. In particular, the negative emotions together with the attendance seem to be the interactions with bigger influence on the mark, although the multiple linear regression did not provide an accurate model. However, the decision tree brought us the possibility to foresee the students’ performance in the final exam according to these factors, although a major sample is needed in order to refine the model.
5. ACKNOWLEDGMENTS This work has been supported by the Govern of the Basque Country (IT722-13), the EHU/UPV university (PPV12/09, UFI11/45) and Gipuzkoako Foru Aldundia (FA-208/2014-B).
6. REFERENCES [1] Baker, R., Corbett, A., Koedinger, K., 2004. Detecting
Student Misuse of ITS, in: Lester, J., Vicari, R., Paraguaçu, F. (Eds.), ITS, Lecture Notes in CS, pp. 531–540.
[2] Romero, C., Ventura, S., Espejo, P.G., Hervás, C., n.d. Data mining algorithms to classify students, in: In Proc. of the 1st Int. Conf. on Educational Data Mining (EDM’08), P. 187191, 2008. 49 Data Mining 2009.
[3] Calvo-flores, M.D., Galindo, E.G., Jiménez, M.C.P., Pérez, O., n.d. 586 Current Developments in Technology-Assisted Education (2006) Predicting students ’ marks from Moodle logs using neural network models.
[4] Kabakchieva Dorina, 2013. Predicting Student Performance by Using Data Mining Methods for Classification. cait 13,61.
[5] Pal, A.K., Pal, S., 2013. Data Mining Techniques in EDM for Predicting the Performance of Students. International Journal of Computer and Information 11/2013; 2(6):1110-1116.
[6] Pekrun, R., Goetz, T., Frenzel, A.C., Barchfeld, P., Perry, R.P., 2011. Measuring emotions in students’ learning and performance: The AEQ. Contem. Educat. Psych. 36, 36–48.
[7] Arroyo, I., Cooper, D.G., Burleson, W., Woolf, B.P., Muldner, K., Christopherson, R., 2009. Emotion Sensors Go To School, in: Proc. 14th Conference on Artificial Intelligence in Education, pp. 17–24.
[8] Gray, G., McGuinness, C., Owende, P., 2013. An Investigation of Psychometric Measures for Modelling Academic Performance in Tertiary Education, in: Sixth International Conference on Educational Data Mining.
Proceedings of the 8th International Conference on Educational Data Mining 599

Hierarchical Dialogue Act Classification in Online Tutoring Sessions
Borhan Samei Vasile Rus Benjamin Nye Donald M. MorrisonInstitute for Intelligent Systems
University of Memphis [email protected]
ABSTRACTAs the corpora of online tutoring sessions grow by orders of magnitude, dialogue act classification can be used to capture increasingly fine-grained details about events during tutoring. In this paper, we apply machine learning to build models that can classify 133 (126 defined acts plus 7 to represent unknown and undefined acts) possible dialogue acts in tutorial dialog from online tutoring services. We use a data set of approximately 95000 annotated utterances to train and test our models. Each model was trained to predict top level Dialogue Acts using several learning algorithms. The best learning algorithm from top level Dialogue Acts was then applied to learn subcategories which was then applied in multi-level classification.
KeywordsDialogue Act, Tutoring dialog, Machine Learning, Classification
1. INTRODUCTION A speech or dialogue act is a construct in linguistics and the philosophy of language that refers to the way natural language performs actions in human-to-human language interactions, such as dialogues. [1] [6] In order to represent the Dialogue Act of an utterance, a set of Dialogue Act categories is defined. The set of categories is also known as the Dialogue Act taxonomy.
In this paper we examine different models on a relatively large data set which is extracted from one-on-one online tutoring sessions. The taxonomy used in our work is based on a hierarchical structure, i.e., each Dialogue Act has a set of sub-categories (subacts). The size of our training data is larger than the data presented in most of the previous work on Dialogue Act classification, which helps support this more fine-grained structure. We used WEKA toolkit [2] and the CRF++ package to train and test the models and Mallet [3] java library was used to train and test Logistic Regression models. Since our data is within the domain of human one-on-one tutoring sessions, this work enables further analysis of models to investigate the impact of dialog moves on learning. The feature sets used to train these models include the leading tokens of an utterance in addition to contextual information (i.e., features of previous utterances).
2. METHOD The taxonomy used in this work was developed with the assistance of 20 subject matter experts (SMEs), all experienced tutors and tutor mentors. The resulting hierarchical taxonomy includes 15 main categories where each main dialog act category consists of different sub-categories which resulted in 133 distinct dialog acts out of which 7 categories were defined to represent unknown and undefined cases. Once the taxonomy was available, a set of 1,438 sessions were manually tagged. The human tagging process included 4 major
phases: development of taxonomy, 1st round tagging, reliability check, 2nd round tagging, reliability check, and final tagging phase. The experts were divided into two groups: Taggers and Verifiers. In the first 2 tagging phases, each tagger was given a session transcript and asked to annotate the utterances. The resulting tagged session was then assigned to a verifier who went through the annotations, reviewed the tags and made necessary changes. In the reliability check steps, experts tagged each transcript independently.Since the Verifiers were modifying tags already established by the Taggers in the 1st and 2nd round cases, the agreement was expected to be high. The agreement of Taggers and Verifiers was approximately 90%, with a slightly higher agreement on the second round. This shows to what extent the verifiers made changes to the initial annotations (about 10% of tags changed). The reliability checks involved completely independent tagging, in which human experts yielded an agreement of approximately 80% on top level and 60% on subact level. The final annotations were used as training data for our machine learning models. In order to build the Dialogue Act classifier, we applied the following 3 kinds of feature sets. - Simple features: Based on previous research, 3 leading tokens of an utterance were shown to be good predictors for Dialogue Act [4]. Thus, we extracted the following features of each utterance: 1st token, 2nd token, 3rd token, last token, and length of utterance (i.e., number of tokens).- Extended features: Using the Correlation Feature Selection (CFS) measure, we found that 1st and last token are the most predictive features and in order to add contextual information (features of prior utterances) we extended the simple features by adding the 1st and last token of three previous utterances to our feature set. The above feature sets were used to create different models with multiple learning algorithms. Four learning algorithms were used and evaluated: Naïve Bayes, Bayesian Networks, Logistic Regression, and Conditional Random Fields (CRF). Each of the algorithms has certain properties that take into account different characteristics of data.
3. RESULTS & DISCUSSION Based on the division of taxonomy in top-level and subcategories, we first trained and tested the models to predict the top-level Dialogue Act. Table 1 shows the results of 10-fold cross validation on the top-level classification models. Table 1. 10-fold Cross Validation of Algorithms with Different Features for Top-level Dialogue Act Classification.
Algorithm FeatureSet Accuracy% Kappa
Proceedings of the 8th International Conference on Educational Data Mining 600

Naïve Bayes Simple 72.5 0.65
Naïve Bayes Extended 72.3 0.64
Bayes Net Simple 72.6 0.65
Bayes Net Extended 72.5 0.65
Logistic Regression Simple 76.6 0.70
Logistic Regression Extended 77.4 0.71
CRF Simple 72.7 0.45
CRF Extended 71.9 0.44
As seen in table 1, the best performance on top-level classification is achieved by the Logistic Regression algorithm; however, all the algorithms yield and accuracy of more than 70%. It is interesting to note that the extended feature set does not improve the algorithms significantly which implies that adding the contextual information, i.e., prior utterances, is either not useful or not sufficiently representing the context. The diminished role of contextual features is not surprising. It has been previously indicated that they do not play a significant role in Dialogue Act classification models on a multi-party chat based tutoring system [5]. We further trained and tested models to classify utterances in the second level of Dialogue Act categories. For each Dialogue Act aclassifier was trained to predict its corresponding subcategories. Table 2 shows the performance of these classifiers which were trained on 70% and tested on 30% of the dataset. A 10-fold cross-validation was not possible in this case due to too few instances for some subcategories. Table 2. Performance of Subact Classifiers within eachDialogue Act Category using Logistic Regression algorithm.
Model N Accuracy% Kappa
Answer 1130 52.8 0.43
Assertion 29890 57.6 0.42
Clarification 609 40.4 0.17
Confirmation 6620 92.6 0.77
Correction 2065 62.3 0.43
Directive 2006 61.7 0.52
Explanation 1941 54.4 0.25
Expressive 22198 76.8 0.74
Hint 341 67.6 0.34
Promise 303 95.6 0.00
Prompt 6186 64.2 0.30
Question 2553 60.7 0.49
Reminder 337 47.7 0.25
Request 14243 56.2 0.49
Suggestion 2028 70.2 0.43
As shown in Table 2, the subact classifiers yield an average accuracy of approximately 65% and kappa of 0.4. Next we created a single model to classify Dialogue Act and Subact. By combining
the top-level dialogue acts with their subacts, this produced a flat taxonomy with 133 categories. Table 3 shows the performance of our models with flat taxonomy using 10-fold cross validation. Table 3. Performance of models with flat taxonomy.
Algorithm FeatureSet Accuracy Kappa
Naïve Bayes Simple 51% 0.49
Naïve Bayes Extended 48% 0.45
Bayes Net Simple 53% 0.50
Bayes Net Extended 51% 0.48
Logistic Regression Extended 44% 0.42
Logistic Regression Simple 43% 0.41
Table 3 shows that the flat taxonomy classification improved the accuracy of our model significantly when compared to the the multi-level classification. It is worth noting that these results approach the agreement of human experts when they annotated independently, which was 66%.
4. CONCLUSIONThe results of the different models and algorithms showed that the top-level Dialogue Acts can be predicted with a reasonable accuracy. However to be able to tag utterances with both top-level and subcategories a combined classification needed to be applied,rather than a hierarchical approach. Multiple classification algorithm were effective, such as Naïve Bayes, Bayesian Networks, Logistic Regression, and Conditional Random Fields (CRF). The ultimate goal of this work is to build a model to be applied to a set of not-seen and untagged data and use the Dialogue Acts as means of modeling the discourse. The proposed models in this paper can be used as initial models for a semi-supervised classifier which will ultimately identify Dialogue Acts in real time.
5. REFERENCES [1] Austin, J. L. 1962. How to do things with words: Oxford.[2] Hall, M., Frank, E., Holmes, G., Pfahringer, B.,
Reutemann, P., & Witten, I. H. 2009. The WEKA Data Mining Software: An Update: SIGKDD Explor. Newsl., 11(1), 10-18.
[3] McCallum, Andrew Kachites. 2002. "MALLET: A Machine Learning for Language Toolkit: http://mallet.cs.umass.edu.
[4] Rus, V., Moldovan, C., Niraula, N., & Graesser, A. C. 2012. Automated Discovery of Dialogue Act Categories in Educational Games: International Educational Data Mining Society.
[5] Samei, B., Li, H., Keshtkar, F., Rus, V., & Graesser, A. C. 2014. Context-Based Dialogue Act Classification in Intelligent Tutoring Systems: Intelligent Tutoring Systems - 12th International Conference, {ITS} 2014, Honolulu, HI, USA, June 5-9, 2014. Proceedings, 236-241.
[6] Searle, J. R. 1969. Dialogue Acts: An essay in the philosophy of language: Cambridge university press.
Proceedings of the 8th International Conference on Educational Data Mining 601

Towards Freshmen Performance PredictionHana Bydžovská
CSU and KD Lab Faculty of Informatics Masaryk University, Brno
ABSTRACTIn this paper, we deal with freshmen performance prediction. We analyze data from courses offered to students at Faculty of Informatics, Masaryk University. We supposed that the success rate of our predictions increases when we omit freshmen from our experiments as we have no study-related data about them.However, we disproved this hypothesis because there wasgenerally no significant difference in prediction of freshmen and non-freshmen students. We also presented the attributes that were important for freshmen performance prediction.
KeywordsStudent Performance, Prediction, Freshmen, Social Network Analysis, Educational Data Mining.
1. INTRODUCTION Universities are faced with the problem of a high number of students’ drop outs. Thus, researches explore what influences students’ performance, and identify weak students in order to help them to improve their achievements. It is important to predict student failure as soon as possible. The task is difficult because the less data about students we have the less accurate the prediction we obtain is.
Data mining techniques represent a typical way for discovering regularity in data [3]. It allows us to build predictive models by defining valid and exact corresponding rules. Authors in [2] explored the drop-out prediction after the first year at Electrical Engineering department. Their data contained the study results of students enrolled in selected courses or the average grades gained in different groups of courses. Their results showed that decision trees belong to the most suitable algorithms. They also demonstrated that the cost-sensitive learning methods helped to bias classification errors towards preferring false positives to false negatives. Authors in [4] also investigated the prediction after the first year. They used questionnaires to get more detailed information about student habits.
We are interested in a similar problem but our task involves the prediction of student success in a course not in the whole study. Our aim is to identify the combinations of students and courses that could be predicted with a high accuracy. Due to the lack of data, we supposed that omitting freshmen (students in the first semester in their first study at the faculty) from the investigation should significantly increase the prediction accuracy. We also investigated how accurately we are able to predict the success or failure of freshmen.
2. DATA The data used in our experiment originated from the Information System of Masaryk University. Our aim was to reveal useful attributes characterizing students in order to predict student
performance in every particular course. Our data comprised of study-related and social behavior data about students. We explored the freshmen performance prediction and the observations were verified on 62 courses offered to students of the Faculty of Informatics of Masaryk University. The data sets comprised of students enrolled in courses in the years 2010-2012and their grades. We constructed three data sets: (1) All students –3,862 students with 42,677 grades, (2) Without freshmen – 2,927 students with 32,945 grades, (3) Only freshmen – 935 students with 9,732 grades.
2.1 Study-related data This kind of data contained personal attributes (e.g. gender, year of birth, year of admission at the university) and data about study achievements (e.g. the number of credits to gain for enrolled, but not yet completed courses, the number of credits gained from completed courses, the number of failed courses). This data contained 42 different attributes in total.
2.2 Social Behavior Data This kind of data described students’ behavior and co-operation with other students. In order to get additional social attributes, we created sociograms. The nodes denoted users and the edges represented ties among them. The ties were calculated from the communication statistics, students’ publication co-authoring, and comments among students. Particularly, we applied social network analysis methods on the sociograms to compute the values of attributes that represent the importance of each user in the network, e.g. centrality, degree, closeness, and betweenness. We also calculated the average grades of students and their friends. Finally, the social behavior data contained 131 attributes in total. We already proved that this type of data increases the accuracy of student performance prediction [1].
3. EXPERIMENT Hypothesis. The accuracy of the student success prediction will significantly increase when we omit freshmen.
Evaluation. We utilized nine different classification algorithms implemented in Weka. We built a classifier for each investigated course because courses differ in their specialization, difficulty, and student occupancy rate. In the first place, we had to select suitable methods and compare the results of data sets with and without freshmen. We used the accuracy and coverage for comparing the results. Generally, the accuracy represents the percentage of correctly classified students. The coverage represents the amount of students for whom we can predict the success or failure.
Observations. In all cases, SMO reached the highest accuracy (with and without freshmen). We computed also baseline (the prediction into the majority class) in order to compute the percentage of successful grades. In all cases, we used 10-fold cross-validation for evaluation the results. The results comparison
Proceedings of the 8th International Conference on Educational Data Mining 602

can be seen in Table 1. Surprisingly, the results indicate that there is no significant improvement when we omit the freshmen. We improved the results only by 1% but for almost 10,000 grades we did not give any prediction.
Table 1. Comparison of results with and without freshmen
ALL COURSES Accuracy Coverage
SMO Baseline
All students 80.04% 73.45% 100%
Without freshmen 81.26% 75.79% 77.2%
Naturally, the increase can be distorted by the large amount of non-freshmen students. No freshman has enrolled in 8 courses. Less than 10 freshmen were enrolled in 22 courses. Moreover, freshmen did not constitute 10% of all students in the next 18 courses. For the next investigation we selected only 14 courses where the number of freshmen is not negligible.
The results of selected 14 courses can be seen in Table 2. As can be seen, the improvement was 3.3%. However, there was a significant difference in baseline – about 7%. SMO was the most suitable method again but the results were difficult to interpret. For this reason, we also presented the accuracy using J48 for the purpose of comparison the success rate of the both approaches. We considered the J48 model to be similar enough for indication the attributes that influenced the results.
Table 2. Comparison of results for 14 courses
14 COURSESAccuracy
CoverageSMO J48 Baseline
Without freshmen
82.07% 80.24% 77.82% 59.27%
All students 78.77% 77.48% 70.66% 100%
Only freshmen 76.56% 75.10% 67.11% 40.73%
When comparing the results presented in Table 1 and Table 2,freshmen decreased the overall accuracy in all cases. However, the difference was insignificant. The model based on J48 algorithm was explored for each course. We also investigated trees built only for the freshmen. The classifiers classified the data based on using the following attributes:
Known study-related attributes: field of study, programme of the study, if the student passed the entrance test or the student was accepted without taking any entrance test, score of the entrance test, if the course is mandatory, elective, or voluntary for the student.Social behavior attributes: degree, centrality, betweenness,number of friends / average of grades of friends that already passed investigated course, number of friends / average of grades of friends that are enrolled in the course with the investigated student. It was very interesting that the freshmen can be characterized by social attributes. They got the access to the system in June during the enrollment to their studies. During the enrollment of courses
in September when we investigated their probability to pass the courses, we already had some data about their activity in the system. In order to measure the influence of the social behavior data on the freshmen performance prediction, we removed different types of data from the data set. The comparison can be seen in Table 3. SMO reached all presented results. The accuracy obtained by mining social behavior attributes was surprisingly slightly better than by mining only known study-related attributes. The best result was obtained when we used the both data types together.
Table 3. Freshmen performance prediction using different types of data
Data set AccuracyAll attributes 76.56%
Only known study-related attributes 73.95%.
Only social behavior attributes 74.72%
Decision. The results indicated that the accuracy of the prediction was almost the same for all students regardless the status of freshmen. The freshmen passed through the similar classification paths as the non-freshmen. When we consider only the courses with a high proportion of the freshmen, the difference is higher but not significant. As a result, the hypothesis was not confirmed.
4. CONCLUSION In this paper, we were dealing with the freshmen performance prediction. The hypothesis was that the success rate of the predictions will increase when we omit the freshmen. We disproved this hypothesis because the results sustained almost the same. The freshmen passed through the similar classification path as the non-freshmen. When we inspected the possibility of estimation only the freshmen grades, surprisingly, mining the social behavior data collected from students in the information system only in two months reached better results than mining data about results in the entrance test, course category, and the basis of the study specialization.
5. REFERENCES [1] Bydžovská H. and Popelínský L. 2014. The Influence of
Social Data on Student Success Prediction. In Proceedings of the 18th International Database Engineering & Applications Symposium, pp. 374-375 (2014)
[2] Dekker, G.W. and Pechenizkiy, M. and Vleeshouwers, J.M.2009. Predicting students drop out: a case study. In T. Barnes et al. (eds.), Proceedings of the 2nd International Conference on Educational Data Mining (EDM’09), pp. 41-50.
[3] Marquez-Vera, C. Romero, C. and S. Ventura. 2011. Predicting school failure using data mining. In Proceedings of the 4th International Conference on Educational Data Mining (EDM’11), pp. 271-276.
[4] Vandamme, J.P. and Superby, J.F. and Meskens, N. 2006. Determination of factors influencing the achievement of the first-year university students using data mining methods. In Proceedings of the 8th international conference on intelligent tutoring systems, Educational Data Mining Workshop, pp. 37-44.
Proceedings of the 8th International Conference on Educational Data Mining 603

Generalising IRT to Discriminate Between Examinees
Ahcène BoubekkiULB Darmstadt/TU
Darmstadt/[email protected]
Ulf BrefeldTU Darmstadt/[email protected]
Thomas DelacroixTelecom Bretagne
ABSTRACTWe present a generalisation of the IRT framework that al-lows to discriminate between examinees. Our model there-fore introduces examinee parameters that can be optimisedwith Expectation Maximisation-like algorithms. We provideempirical results on PISA data showing that our approachleads to a more appropriate grouping of PISA countries thanby test scores and socio-economic indicators.
1. INTRODUCTIONDevelopments in Psychometrics have led to a multitude oflogistic models, ranging from simple classical test theoryto sophisticated multidimensional generalizations (e.g., [2]).Usually, these generalizations focus on items and the suc-cess of solving an item depends on a particular set of skills.On the contrary, examinees are only represented by theirability although, according to the original theoretical IRTproblem, items and examinees are supposed to be treatedsymmetrically.
In this paper, we propose to balance this asymmetry byincluding a discrimination parameter for examinees. Wepresent a homographic parametrization that preserves sym-metry and allows to derive characteristics of examinees. Wereport on empirical results on PISA 2012 data showing thatthe use of examinee discrimination parameters reveals in-sights that cannot be identified with traditional approaches.
2. A SYMMETRIC AND LOGISTIC MODELThe traditional 1PL model [5] is given by
IRF1PL(i, j) =1
1 + eθi+βj), (1)
where the real numbers θ and β represent the examinee’sability and the item difficulty, respectively. These param-eters can be related to the score xi and the rate of suc-cess of the question aj by using the transformations βj =
log(
1−aj
aj
)and θi = log
(1−xixi
). Note that xi and aj are
real numbers bounded by 0 and 1. After substitution, themodel can be expressed as
IRF1PL(i, j) =ajxi
ajxi + (1− aj)(1− xi). (2)
A similar transformation can be applied to the 2PL [1],where αj = bj are non negative real numbers called itemdiscrimination,
IRF2PL(i, j) =1
1 + eαj(θi+βj)
=(ajxi)
bj
(ajxi)bj + ((1− aj)(1− xi))bj. (3)
The multidimensional two-parameter logistic model (M2PL)[2] splits the items in k different skills. The examinee hasan ability parameter for each skill that is affected by a skilldiscrimination parameter. The ability is now a vector ofreal numbers θi = (θi,1, ..., θi,k) and the item discriminationa vector of non-negative real numbers αj = (αj,1, ..., αj,k),
IRFM2PL(i, j) =1
1 + eαjθi + βj
=ajx
bji
ajxbji + (1− aj)(1− xi)bj
. (4)
The appealing use of item discrimination parameters canbe translated to examinees, for instance to distinguish be-tween a regular scholarly student and a talented, yet slackingone. Let us introduce an examinee discrimination parame-ter denoted by the non-negative real number yi that actsas the analogue of its peer bj . The discrimination parame-ters will also be decoupled from the other item or examineeparameter. This assures the identifiability of the model.The resulting model is called the Symmetric Logistic Model(SyLM) and given by
IRFSyLM (i, j) =1
1 + ebjθi+yiβj
=ayij x
bji
ayij x
bji + (1− aj)yi(1− xi)bj
. (5)
At first sight, the logistic parametrization of the SyLM ap-pears as a special case of the M2PL by setting βj = 0 andrenaming the parameters, however, the homographic param-eterization renders them intrinsically different. Actually,SyLM is closer to the 2PL as it does not subdivide itemsinto skills although a multidimensional extension could beeasily derived. For lack of space, we will thus only compareSyLM to the 1PL and 2PL.
Proceedings of the 8th International Conference on Educational Data Mining 604

Table 1: Synthetic resultsModel Param. log.Lik AIC BIC1PL Log. -3847.1 8504.3 10100.11PL Hom. -3836.6 8483.2 10079.0
2PL Log. -3809.2 8478.5 10172.82PL Hom. -3724.3 8308.7 10002.9
SyLM Log. -3809.2 9238.5 12430.1SyLM Hom. -3455.5 8531.1 11722.6
3. EMPIRICAL EVALUATION3.1 Synthetic ComparisonFor each approach, logistic and homographic parameteriza-tions are tested. Parameters are inferred by a MaximumLikelihood [4] algorithm supported by a Newton-Raphsonoptimization. The dataset consists of the results to the firstMathematic booklet of PISA 2012 study in France (380 ex-aminees, 25 items). For items having two degrees of success,both cases are considered as a success. Similarly, answersentered as “not reached” or “NA” are considered as failures.
Although the results shown in Table 1 should be indepen-dent of the paramtetrization, estimations using homographicparametrizations produce better results throughout all set-tings. As expected, the additional parameters brought intothe optimization by SyLM are crucial for the informationcriteria. However, comparing SyLM with the 1PL showsSyLM as the winner in two out of three cases. The decreaseof the log-likelihood exceeds the increase of the AIC due tothe significantly higher number of parameters.1 The differ-ence is even stronger for BIC and increases with the numberof samples, hence naturally penalizing SyLM.
3.2 PISA AnalysisWe now analyse the PISA 2012 ranking [3] and its associ-ated country clustering with SyLM. The original grouping isbased on the scores in the different tests and on social andeconomical variables of the countries. We focus on four pairsof countries/economies and shown in Table 2. AlthoughShanghai and Singapore are not reported similar, we studythem together as they are the top ranked and the only oneswithout a similar peer. Our analysis is again performed onthe Mathematics test. For each country, booklets are ana-lyzed separately before the results are merged.
For the the twelve countries listed in Table 2, Figure 1 fo-cuses on the distribution of examinee’s discrimination giventhe examinee’s ability. The coloring indicates the ratio ofpupils having a high or a low normalized2 discriminationgiven the fact that they have a low or a high normalizedability. We consider values below .25 as a low normalizedcharacteristic and above .75 as a high one.
Although Switzerland and Japan are in the same PISA group,their figures are very different. The Japanese distribution iscloser to the other Asiatic countries while the Swiss is simi-lar to the German one. The geographic argument holds forBrazil and Argentina but not for USA and Russia, whichare geographically and culturally very different. Again the
1The 2PL counts N +2M parameters, SyLM has 2N +2M .2Data is normalized by yi → yi
1+yiand θi → 1
1+eθi= xi.
Table 2: PISA country grouping
QCN Shanghai CHE Switzerland GER GermanySGP Singapore JPN Japan CAN Canada
FRA France USA USA BRA BrazilGBR Great Britain RUS Russia ARG Argentina
Figure 1: SyLM results for PISA
two neighbors Canada and USA produce very different re-sults. While the distribution for USA is closer to the Britishone, the Canadian one shows very different. Based on ourresults, an improved clustering can be proposed. Shanghai,Singapore and Japan constitute the first group; Switzerland,Germany the second. Great Britain, the USA and Russiaform the third group while Brazil and Argentina make agroup of their own. Canada and France remain outsiders.
4. CONCLUSIONWe proposed the Symmetric Logistic Model as a general-ization of the Rasch model. Our approach can be inter-preted as a symmetric 2PL at the cost of additional param-eters. Empirically, our Symmetric Logistic Model showedthat the PISA grouping of countries based on score andsocio-economic backgrounds is suboptimal. More appropri-ate groups could be formed by taking examinee discrimina-tion parameters into account.
5. REFERENCES[1] A. Birnbaum. Some latent trait models and their use in
inferring an examinee’s ability. In Statistical Theories ofMental Test Scores. Addison-Wesley, 1968.
[2] R. L. McKinley and M. D. Reckase. An extension of thetwo-parameter logistic model to the multidimensionallatent space. Technical report, DTIC Document, 1983.
[3] OECD. PISA 2012 Results in Focus: What 15-year-oldsknow and what they can do with what they know.OECD Publishing, 2013.
[4] N. Rose. Maximum likelihood and Bayes modal abilityestimation in two-parametric IRT models: Derivationsand implementation. (Schriften zur Bildungsf.), 2010.
[5] N. Verhelst and C. Glas. The one parameter logisticmodel. In G. Fischer and I. Molenaar, editors, RaschModels, pages 215–237. Springer New York, 1995.
Proceedings of the 8th International Conference on Educational Data Mining 605

Detection of learners with a performance inconsistent withtheir effort
Diego García-SaizDepartment of Software
Engineering and ElectronicsUniversity of CantabriaAvda. Los Castros s/n,
Santander, [email protected]
Marta ZorrillaDepartment of Software
Engineering and ElectronicsUniversity of CantabriaAvda. Los Castros s/n,
Santander, [email protected]
ABSTRACTMotivation is essential to learning and performance in e-learning environments. Designing strategies to intervene inthe learning process as soon as possible with the aim of keep-ing the learner engagement high is thus remarkably impor-tant. This paper proposes a method which allows instructorsto discover learners with a performance inconsistent with theactivity carried out, enabling teachers to send personalisedmessages to these students.
1. INTRODUCTIONMotivation is essential to carry out any kind of task success-fully but, this is even more necessary for activities which re-quire a great cognitive and time effort such as the acquisitionand understanding of new knowledge to be applied suitablyand rightly to problem solving. This is the case of learningprocesses supported by e-learning platforms where learnersmust adopt an active role and guide their self-learning.
To offer support and individualised help to learners, teach-ers need tools that help them to detect students who re-quire advice. We, in this work, present a method whichaims at detecting learners whose effort performed in the e-platform is comparable or higher than that one done by theirpeers but, unlike them, they do not pass the assessable as-signments. These learners require a feedback different fromthose who are not interested in the course, thus being at riskof dropout. These feedback messages should be automati-cally generated by the e-learning system in order to providestudents with personalized guidance, tailored to their inho-mogeneous needs and requirements [1].
To our knowledge, the relationship between effort and per-formance has never been studied. The closest topic re-searched is the detection of undesirable student behaviours[3, 2] whose goal is to discover those students who havesome type of problem or unusual behavior such as dropping
out or academic failure. For instance, Ueno [4] proposedan animated agent which provided adaptive messages to thelearners with an irregular learning process and Vellido et al.[5], characterised atypical student behaviors through robustgenerative relevance analysis.
Next, we describe our method and discuss the results achieved.
2. METHOD AND RESULTSOur approach aims at detecting students who have carriedout a great effort but, however, they have failed. These arethus a subset of the students that a performance classifierwould classify wrongly since their activity is very similarto that performed by students who passed. Therefore ourmethod works in two phases: first, a classifier is built inorder to detect misclassified instances and next, a clusteringtechnique is applied on the misclassified instances set of ”fail”class with the aim of detecting these learners. The instancesfrom the cluster whose weighted Euclidean distance to ”fail”class prototype is the largest are our target students.
We apply our method on students’ activity data from two e-learning courses hosted in Moodle with 43 and 119 learnersrespectively. In both, the students must carry out four as-signments to pass the course. We generated two data sets,one for each course, with the activity data correspondingto the period of the first assignment(named ”d1” and ”d2”).The attributes used were: N# of actions performed by thestudent (”act”), N# of visits to the content-files (”v-re”),the SCORM resources (”v-sc”), the statistics page (”v-da”),the feedback messages provided by the instructor (”v-fe”)and the html pages (”v-co”); N# of messages read (”v-fo”),posted (”a-di”) and answered (”p-fo”) by the student in theforum and the sum of the attributes ”a-di” and ”p-fo” (”pa-fo”). As class attribute, we used the mark achieved by thelearner in the first assignment, pass or fail.
We configured our method for using J48 as classifier andk-means as clustering technique. The accuracy of the classi-fiers, evaluated with 10-CV, were 69.77% and 85.17%, with7 and 13 instances misclassified respectively, that means,there were 7 and 13 learners who could have carried outan activity (effort) similar to those who passed the first as-signment, but however they failed. To determine if thesemisclassified students had really a similar activity to thosewho passed, we performed a clustering process with these
Proceedings of the 8th International Conference on Educational Data Mining 606

Table 1: Clustering process on ”d1”attr. relevance C1 C2 Avg.
act 9 0.1835 0.4639 0.1245
v-re 4 0.093 0.438 0.1270
v-co 1 0.1017 0.3785 0.1239
v-fe 1 0 0.1667 0.0385
v-da 6 0.0435 0.3732 0.0920
a-di 2 1 0.1667 0.0769
p-fo 4 0 0.2 0.0308
pa-fo 1 0.1667 0.1944 0.0385
v-fo 2 0.3061 0.3299 0.0597
v-sc 3 0.075 0.3417 0.0952
N# ins. - 1 6 -
dist. to avg. - 2.0183 3.8936 -
Table 2: Clustering process on ”d2”attr. relevance C1 C2 C3 C4 Avg.
act 10 0.679 0.049 0.163 0.137 0.07
N# ins. - 2 5 2 4 -
dist. to avg. - 0.609 0.021 0,093 0,067 -
instances. Two and four clusters were created for dividingup these students. The number of clusters was manually se-lected by comparing the different clusters built with k rangesfrom 2 to 5. Next, we calculated the weighted Euclidean dis-tance from each centroid to the mean of the well-classifiedinstances of class ”fail”, being the contribution of each at-tribute weighted according to its relevance. Those instanceswhich belonged to the cluster with a larger distance to theaverage were marked as outliers. The prototype of each clus-ter is shown in Tables 1 and 2. These tables also gather therelevance of each attribute (”relevance”) calculated with theClassifierSubSetEval method provided by Weka and the av-erage value (”Avg.”) of each attribute corresponding to thewell-classified instances of the fail class.
As can be observed, in ”d1”, the cluster C1 only contains oneinstance which represents the activity of one of the studentswith the lowest activity in all course and similar to that per-formed by the students who failed and were well-classified.The centroid of cluster C2 is further from the average of thewell-classified instances of the fail class and these, thus, aremarked as outliers. In ”d2”, the only relevant attribute isthe N# of total actions, and the instances of the cluster C1therefore were marked as outliers.
Table 3 collects the most relevant activity performed by thesix and the two students misclassified in each course respec-tively. In ”d1”, the value of most attributes is larger thanthe average of their class, being this difference remarkablefor the attribute ”act”. On the one hand, the students la-belled as d1s3, d1s4, d1s5 and d1s6 performed a significantactivity, but failed the first assignment (q1) with a low qual-ification, from 0 to 4 out of 10. However, they passed thesecond assignment (q2) with a good mark, 9 out of 10. Thatmeans that the feedback given to them by the instructor wasuseful and effective, being clearly reflected the importance ofgiving a good feedback to the students. On the other hand,student named d1s2, even having an appreciable activity,failed the first assignment and dropped out before sendingthe second task. In this case, the instructor’s advice wasnot successful. If the teacher had known the activity per-formed at the same time that he assessed the assignment,the message could have been written in a more motivatingtone, expressly mentioning the activity already undertaken.Finally, d1s1 was detected by the method but the learner
Table 3: Students’ activitystudent act v-re v-da p-fo v-sc q1 q2
d1s1 0.23 0.30 0.24 0.00 0.19 0 0(dropout)
d1s2 0.20 0.16 0.15 0.00 0.34 3 0(dropout)
d1s3 0.91 1.00 0.72 0.60 0.63 4 9
d1s4 0.50 0.44 0.20 0.20 0.23 0 9
d1s5 0.58 0.42 0.43 0.40 0.31 3 9
d1s6 0.37 0.30 0.50 0.00 0.36 0 9
d2s1 0.84 3 8
d2s1 0.51 4.5 8.5
did not receive feedback because he did not deliver the as-signment. In this case, the teacher missed the opportunityto rescue him. Regarding d2, the N# of actions performedby both students is very high in comparison with the aver-age of the students who failed. Indeed, one of these studentshad a mark of 4.5 out of 10, being very close to pass. In thisscenario, the feedback provided by the instructor was suc-cessful since this learner passed the second assignment witha qualification of 8.5 out of 10.
The experimentation carried out shows that our methodhelps to discover students whose performance do not matchwith the effort performed. Being able to automatically de-tect them would allow teachers to act quickly, sending thempersonalised messages oriented to keep their engagementhigh and avoid the dropout.
As future work, our aim is to apply this method to othervirtual courses and support the teacher during the learningprocess in order to validate the goodness of our proposal inreal online contexts. Another issue which will be addressedshortly is to evaluate the effect of using different classifiersand clustering algorithms in our proposal.
3. ACKNOWLEDGMENTSThis work has been partially financed by the PhD studentshipprogram at University of Cantabria (Spain).
4. REFERENCES[1] F. Castro, A. Vellido, n. Nebot, and F. Mugica.
Applying data mining techniques to e-learningproblems. In L. Jain, R. Tedman, and D. Tedman,editors, Evolution of Teaching and Learning Paradigmsin Intelligent Environment, volume 62 of Studies inComputational Intelligence, pages 183–221. SpringerBerlin Heidelberg, 2007.
[2] A. Pena Ayala. Review: Educational data mining: Asurvey and a data mining-based analysis of recentworks. Expert Systems with Applications,41(4):1432–1462, Mar. 2014.
[3] C. Romero and S. Ventura. Educational data mining:A review of the state of the art. IEEE Transactions onSystems, Man, and Cybernetics, 40(6):601–618, 2010.
[4] M. Ueno. Data Mining in E-learning, chapter Onlineoutlier detection of learners’ irregular learningprocesses, pages 261–278. Billerica,MA: WitPress, 2006.
[5] A. Vellido, F. Castro, A. Nebot, and F. Mugica.Characterization of atypical virtual campus usagebehavior through robust generative relevance analysis.In Proceedings of the 5th IASTED InternationalConference on Web-based Education, WBE’06, pages183–188, Anaheim, CA, USA, 2006. ACTA Press.
Proceedings of the 8th International Conference on Educational Data Mining 607

A Probabilistic Model for Knowledge Component Naming
Cyril GoutteNational Research Council
1200 Montreal RdOttawa, ON, Canada
Serge LégerNational Research Council100 rue des AboiteauxMoncton, NB, [email protected]
Guillaume DurandNational Research Council100 rue des AboiteauxMoncton, NB, Canada
ABSTRACTRecent years have seen significant advances in automaticidentification of the Q-matrix necessary for cognitive di-agnostic assessment. As data-driven approaches are intro-duced to identify latent knowledge components (KC) basedon observed student performance, it becomes crucial to de-scribe and interpret these latent KCs. We address the prob-lem of naming knowledge components using keyword auto-matically extracted from item text. Our approach identifiesthe most discriminative keywords based on a simple proba-bilistic model. We show this is effective on a dataset fromthe PSLC datashop, outperforming baselines and retrievingunknown skill labels in nearly 50% of cases.
1. OVERVIEWThe Q-matrix, introduced by Tatsuoka [9], associates testitems with attributes of students that the test intends to as-sess. A number of data-driven approaches were introducedto automatically identify the Q-matrix by mapping items tolatent knowledge components (KCs), based on observed stu-dent performance [1, 6], using, e.g. matrix factorization [2,8], clustering [5] or sparse factor analysis [4]. A crucial issuewith automatic methods is that latent skills may be hard todescribe and interpret. Manually-designed Q-matrices mayalso be insufficiently described. A data-generated descrip-tion is useful in both cases.
We propose to extract keywords relevant to each KC fromthe textual content corresponding to each item. We build asimple probabilistic model, with which we score keywords.This proves surprisingly effective on a small dataset obtainedfrom the PSLC datashop.
2. MODELWe focus on extracting keywords from the textual contentof each item (question, hints, feedback, Fig. 1). We denoteby di the textual content (e.g. body text) of item i, and as-sume a Q-matrix mapping items to K skills ck, k = 1 . . .K.
Figure 1: Example item body, feedback and hints.
These may be latent skills obtained automatically or froma manually designed Q-matrix. For eack KC we build a un-igram language model estimating the relative frequency ofwords in each KC [7]:
P (w|ck) ∝∑
i,di∈cknwi, ∀k ∈ {1 . . .K} (1)
with nwi the number of occurrences of word w in documentdi. P (w|c) is the profile of c. Important words are those thatare high in c’s profile and low in other profiles. The sym-metrized Kullback-Leibler divergence between P (w|c) andthe profile of all other classes, P (w|¬c), decomposes over
words: KL(c,¬c) = ∑w (P (w|c)− P (w|¬c)) log P (w|c)
P (w|¬c) . We
use the contribution of each word to the KL divergence asscore indicative of keywords. In order to focus on wordssignificantly more frequent in c, we use the signed score:
KL score: sc(w) = |P (w|c)− P (w|¬c)| log P (w|c)P (w|¬c) . (2)
Figure 2 illustrates this graphically. Words frequent in c butnot outside (green, right) receive high positive scores. Wordsrare in c but frequent outside (red, left) receive negativescores. Words equally frequent in c and outside (blue) getscores close to zero: they are not specific enough.
3. EXPERIMENTAL RESULTSWe used the 100 student random sample of the ”Comput-ing@Carnegie Mellon”dataset, OLI C@CM v2.5 - Fall 2013,Mini 1. This OLI dataset is well suited for our study be-cause the full text of the items is available in HTML format
Proceedings of the 8th International Conference on Educational Data Mining 608

Knowledge Component c:0.
000.
10
All other KCs:
0.00
0.06
KL score s(w)
−0.2
0.2
Figure 2: From KC profile, other KCs, to KL scores.
KC label #it Top 10 keywords (body text only)identify-sr 52 phishing email scam social learned
indicate legitimate engineering anti-phishing indicators
quota
12 quota printing andrew print semesterconsumed printouts longer unused cost
penalties
bandwidth
1 maximum limitations exceed timesbandwidth suspended network access
Table 1: Top 10 keywords for 3 KC of various sizes.
and can be extracted. Other datasets only include screen-shots. There are 912 unique steps, 31k body tokens, 11.5khints tokens, and 41k feedback tokens, close to 84k tokenstotal. We pick a model in PSLC that has 108 distinct KCswith partially descriptive labels. That model assigns 1 to52 items to each KC, for 823 items with at least 1 KC as-signed. All text is tokenized, stopwords are removed, as wellas tokens not containing one alphabetical character.
We estimate three different models, using Eq. (1), depend-ing on the data considered: body text only (”body”), bodyand hints (”b+h”), all text (”all”). For each model, we ex-tract up to 10 words with highest KL score (2) for each KC.Table 1 shows that even for knowledge components with veryfew items, the extracted keywords are clearly related to thetopic suggested by the label. Although the label itself is notavailable when estimating the model, words from the labeloften appear in the keywords: this happens in 44 KCs out of108 (41%), suggesting that the retrieved keywords are rele-vant. Note that some labels are vague (e.g. identify-sr) butthe keywords provide a clear description (phishing scams).
We now focus on two desirable qualities for good keywords:diversity (keywords should differ accross KCs) and specificity(keywords should describe few KCs). Table 2 compares KLscores with the common strategy of picking the most fre-quent words (MP), using various metrics. Good descriptionsshould have a high number of different keywords, many ofwhich describing a unique KC, and few KCs per keyword.The total number of keyword is fairly stable as we extractup to 10 keywords for 108 KCs. It is clear that KL extractsmany more different keywords (up to 727) than MP (352 to534). KL yields on average 1.4 (median 1) KC per keyword,whereas MP keywords describe on average 3.1 KC. There arealso many more KL-generated keywords describing a unique
total different unique maxKL-body 995 727 577 9KL-b+h 1005 722 558 10KL-all 1080 639 480 19MP-body 995 534 365 42MP-b+h 1005 521 340 34MP-all 1080 352 221 87
Table 2: Keyword extraction for KL vs. max. prob-ability (MP) using text from body, b+h and allfields; total keywords, # different keywords, # withunique KC, and maximum KC per keyword.
KC. These results support the conclusion that our KL-basedmethod provides better diversity and specificity.
Note that using more textual content (adding hints and feed-back) hurts performance accross the board. We see why fromthe list of words describing most KCs from two methods:KL-body: use (9) following (8) access, andrew, account (7)MP-all: incorrect(87) correct(67) review(49) information(30)
”correct” and ”incorrect” are extracted for 67 and 87 KCs,respectively, because they appear frequently in the feedbacktext. The KL-based approach discards them because theyare equally frequent everywhere.
AcknowledgementWe used the ’OLI C@CM v2.5 - Fall 2013, Mini 1 (100 stu-dents)’ dataset accessed via DataShop [3]. We thank AlidaSkogsholm from CMU for her help in choosing this dataset.
4. REFERENCES[1] T. Barnes. The Q-matrix method: Mining student
response data for knowledge. In AAAI EDM workshop,2005.
[2] M. Desmarais. Mapping questions items to skills withnon-negative matrix factorization.ACM-KDD-Explorations, 13(2), 2011.
[3] K.R. Koedinger, R.S.J.d. Baker, K. Cunningham,A. Skogsholm, B. Leber, and J. Stamper. A datarepository for the EDM community: The PSLCdatashop. In Handbook of Educational Data Mining.CRC Press, 2010.
[4] A.S. Lan, C. Studer, and R.G. Baraniuk. Quantizedmatrix completion for personalized learning. In 7thEDM, 2014.
[5] N. Li, W. Cohen, and K.R. Koedinger. Discoveringstudent models with a clustering algorithm usingproblem content. In 6th EDM, 2014.
[6] J. Liu, G. Xu, and Z. Ying. Data-driven learning ofQ-matrix. Applied Psych. Measurement, 36(7), 2012.
[7] A. McCallum and K. Nigam. A comparison of eventmodels for naive bayes text classification. In AAAI-98workshop on learning for text categorization, 1998.
[8] Y. Sun, S. Ye, S. Inoue, and Yi Sun. Alternatingrecursive method for q-matrix learning. In 7th EDM,2014.
[9] K.K. Tatsuoka. Rule space: an approach for dealingwith misconceptions based on item response theory. J.of Educational Measurement, 20(4), 1983.
Proceedings of the 8th International Conference on Educational Data Mining 609

An Improved Data-Driven Hint SelectionAlgorithm for Probability Tutors
Thomas W. PriceNorth Carolina State
University890 Oval Drive
Raleigh, NC [email protected]
Collin F. LynchNorth Carolina State
University890 Oval Drive
Raleigh, NC [email protected]
Tiffany BarnesNorth Carolina State
University890 Oval Drive
Raleigh, NC [email protected]
Min ChiNorth Carolina State
University890 Oval Drive
Raleigh, NC [email protected]
ABSTRACTData-driven systems such as the Hint Factory have been suc-cessful at providing student guidance by extracting proceduralhints from prior user data. However, when only small amountsof data are available, it may be unable to do so. We present anovel hint-selection algorithm for coherent derivational domains,such as probability, which addresses this problem by searching afrontier of viable, partially matching student states. We testedthis algorithm on a dataset collected from two probability tutorsand performed a cold start comparison with direct state match-ing. We found that our algorithm provided higher value hintsto students in unknown states 55.0% of the time. For someproblems, it also provided higher value hints in known states.
1. INTRODUCTIONAdaptive feedback is one of the hallmarks of an Intelligent Tutor-ing System. This feedback often takes the form of hints, pointinga student to the next step in solving a problem. While hints canbe authored by experts, more recent data-driven approaches,such as the Hint Factory [1] have shown that this feedback can beautomatically generated from prior student data. The Hint Fac-tory operates on a representation of a problem-specific datasetcalled an interaction network [3], where each vertex representsthe state of a student’s solution at some point during the problemsolving process, and each edge represents a student’s action. Acomplete solution is represented as a path from the initial state toa goal state. A new student requesting a hint is matched to a pre-viously observed state and directed along a path to the goal state.
If too few students have been recorded, the Hint Factory isunable to match new students to existing states in the network.
This is known as the cold start problem, a fundamental challengein many domains. For example, when Hint Factory’s originalstate matching algorithm was applied to BOTS, an educationalprogramming game, a dataset of nearly 100 students providedonly 40% hint coverage [4].
This paper focuses on two probability tutors in which manyactions have no ordering constrains. This can produce an ex-ponentially large state space, making the cold start problemeven harder to overcome. We present a novel state matchingmechanism that helps address this problem in coherent deriva-tional domains. These are problem-solving domains, such asprobability, physics, and logic, where: a) a solution S is con-structed by repeated applications of domain rules to derive agoal value; b) taking any valid action cannot prevent the studentfrom taking another valid action; and c) if S is a completesolution to the problem, then any superset of S is also a com-plete solution. Note that this does not prevent rule applicationswithin a solution from having ordering constraints.
2. SELECTION ALGORITHMSFor our purposes, we assume a hint selection algorithm takes thefollowing inputs: a) an interaction network, N=(V,E) of previ-ously observed states and actions; b) a value or ordering functionf : V →R, which assigns “desirability” to each of the states inV ; and c) the current state sc of a student who is requesting ahint. In coherent derivational domains, each state s∈V can bedefined by the set of derived facts. Each edge e∈E is annotatedwith an action ae, the derivation or deletion of a fact.
Given this information, a selection algorithm attempts to findthe optimal action a, such that a is a valid action in state sc,and the value of the resulting state f(sa) is maximized. Herewe derive f from the Hint Factory’s value iteration procedure[1], but other functions could be used instead.
The selection algorithm employed by the Hint Factory requiresthat sc∈V , meaning the student is in a known, or previously ob-served state. The algorithm then selects the successor of sc withthe highest value and returns the action which leads to this state.
Proceedings of the 8th International Conference on Educational Data Mining 610

In the case that sc is unknown, meaning sc �∈V , Barnes andStamper [1] suggest using a student’s previous state to generatea hint. This approach can be generalized to walking back to thelast recognized state in the student’s path, and using that to gen-erate a hint. We refer to this as the“Backup Selection”algorithm.
In our selection algorithm, we first mark all v∈V such that v⊆s.Beginning with the start state s0, we traverse the graph in adepth-first fashion, following an edge e only if ae is a deletion orderives a fact which is present in sc. Let us call the set of statestraversed in the manner T . Note that we do not generate stateshere, but explore only the previously observed states in N. Weknow that for any t∈T , t⊆sc and t is reachable by a known pathfrom the start state. We define the Frontier F as the set of allstates which can be reached by a single action from a state in T .A student in sc can reach any state in the Frontier – or some su-perset of the Frontier state – in a single action. We then find the
edge−→tu which maximizes f(u) and return its annotated action.
3. EVALUATIONOur evaluation was based on the cold start experiment originallyused to evaluate the Hint Factory [1], which was designed tomeasure how much data was required to provide hints to newstudents. Because we can always provide some hint by applyingthe Backup algorithm, we are instead interested in measuringthe quality of the hints being given. Since we cannot directlymeasure hint quality, we will use the value function, f , describedin Section 2, as an approximation of the quality. Here we use thevalue iteration method employed by the Hint Factory [1]. We donot make the claim this is an ideal metric, and this experimentcan be easily adapted to work with any value function.
We evaluated our algorithm using combined log data from theAndes and Pyrenees probability tutors [2]. The Andes data wasdrawn from a prior experiment [2] and included 394 problemattempts by 66 students over 11 problems. The Pyrenees dataincluded 999 problem attempts by 137 students on the same prob-lem set. The tutors contain the same knowledge base, problemsand solutions, allowing their data to be merged. This allowed usaccess to a wider variety of data than a single tutor would afford.
3.1 ProcedureFor each problem, a student was selected at random and re-moved from the population to represent a previously unobservedstudent. We will call this student’s path P . The remainingstudents who successfully solved the problem were added, oneat a time and in a random order, to the network, N. Let n bethe number of students added this way. After each addition,for each non-solution state in P , we calculated hints with theBackup selection algorithm and with our algorithm. We gaveeach of these hints a value, equal to f(s), where s is the resultingstate of applying the hint. In the case that this state was notin N, we used the value of the Fringe state selected by thealgorithm (a superset of the resulting state). If our algorithmshowed an improvement, we also recorded whether or not thestate requesting a hint was known, meaning it was in N. Thisprocess was repeated 500 times to account for ordering effects.
3.2 ResultsFor each problem, we averaged the the percentage of unknownstates with improved hints over all values of n. This averageranges from 33.5% to 69.8%, with an average of 55.0%. This indi-
Figure 1: One cold start curve, showing the percentof hints which are improved by our algorithm (y-axis),given the number of students in N (x-axis).
cates that our algorithm accomplishes its intended purpose of im-proving hint selection when insufficient data makes it difficult tofind matching states in the network. However, while we were ableto improve hints for a large percentage of these unknown states,the number of unknown states dropped off rapidly as n increased.
For 7 of the 11 problems, our algorithm also produced improvedhints for known states. Notably, the percentage of improvedhints increases as more students are added to N, meaningadditional data strengthens our algorithm’s advantage. After allof the students were added to N, this number ranged from 3.6%to 49.7%, with an average of 17.8%. The improvement for knownstates seems to depend largely on the graph structure, and occursinfrequently in smaller graphs. Figure 1 depicts one cold startgraph demonstrating the trends for known and unknown states.
4. CONCLUSIONSWe have presented a novel algorithm for selecting among pos-sible data-driven hints. We have demonstrated that on averageour algorithm gives a higher value hint 55.0% of the time whena student is in an unknown state, and 17.8% of the time forknown states in a subset of problems.
5. ACKNOWLEDGMENTSWork supported by NSF Grant #1432156 “Educational DataMining for Individualized Instruction in STEM Learning Envi-ronments”Min Chi & Tiffany Barnes, Co-PIs.
6. REFERENCES[1] T. Barnes and J. Stamper. Toward Automatic Hint Genera-
tion for Logic Proof Tutoring Using Historical Student Data.In Intelligent Tutoring Systems (ITS), pages 373–382, 2008.
[2] M. Chi and K. VanLehn.Eliminating the gap between the high and low studentsthrough meta-cognitive strategy instruction. In IntelligentTutoring Systems (ITS), volume 5091, pages 603–613, 2008.
[3] M. Eagle and T. Barnes. Exploring Networks of Problem-Solving Interactions. In Learning Analytics (LAK), 2015.
[4] B. Peddycord III, A. Hicks, and T. Barnes. Generating Hintsfor Programming Problems Using Intermediate Output.In Proceedings of the 7th International Conference onEducational Data Mining (EDM 2014), pages 92–98, 2014.
Proceedings of the 8th International Conference on Educational Data Mining 611

Good Communities and Bad Communities:Does membership affect performance?
Rebecca BrownNorth Carolina State
UniversityRaleigh, NC
Collin F. LynchNorth Carolina State
UniversityRaleigh, NC
Michael EagleNorth Carolina State
UniversityRaleigh, NC
[email protected] Albert
North Carolina StateUniversityRaleigh, NC
Tiffany BarnesNorth Carolina State
UniversityRaleigh, NC
Ryan BakerTeachers College, Columbia
UniversityNew York, NY
[email protected] Bergner
Educational Testing ServicePrinceton, NJ
Danielle McNamaraArizona State University
Phoenix, [email protected]
KeywordsMOOC, social network, online forum, community detection
1. INTRODUCTIONThe current generation of Massive Open Online Courses (MOOCs)are designed to leverage student knowledge to augment instructorguidance. Activity in these courses is typically centered on athreaded forum that, while curated by the instructors, is largelystudent driven. When planning MOOCs, it is commonly hopedthat open forums will allow students to interact freely and thatbetter students will help the poorer performers. It has not yetbeen shown, however, that this occurs in practice.
In our ongoing work, we are investigating the structure of studentcommunities and social interactions within online and blendedcourses [1]. Our focus in this poster is on the structure ofstudent communities in a MOOC and the connection betweenthose communities and students’ performance in the course. Ourgoal was to determine whether students in the course formstrong sub-communities and whether a student’s communitymembership is correlated with their performance. If studentsdo form strong communities and community membership isa predictor of performance, then it would suggest either thatstudents are forming strong relationships that help to improve theirperformance or that they are clustering by performance. If they donot, then it suggests that they may be able to connect freely in theforums at the expense of persistent and beneficial relationships.
2. BACKGROUNDCourse-level relationships have been shown to influence students’performance and the overall success of a course. Fire et al.examined the impact of immediate peers in a traditional class andfound that students’ performance was significantly correlated withthat of their closest peer [4]. Eckles and Stradley analyzed dropoutrates and found that students with strong relationships withstudents who dropped out were more likely to do so themselves [3].
Rose et al. [7] examined students’ evolving social interactionsin MOOCs using a Mixed-Membership Stochastic Block modelwhich seeks to detect partially overlapping communities. Theyfound that dropout likelihood was strongly correlated with com-munity membership. Students who actively participated in forumsearly in the course were less likely to drop out later. Dawson [2]studied blended courses and found that students in the highergrade percentiles tended to have larger social networks within thecourse and were more likely to be connected to the instructor.
3. METHODSBig Data in Education is a MOOC offered by Dr. Ryan Bakerthrough the Teacher’s College at Columbia University [8]. This isa 3-month long course composed of lecture videos, forum interac-tions, and 8 weekly assignments. All of the assignments were struc-tured as numeric or multiple-choice exams and were graded auto-matically. Students were required to complete assignments withintwo weeks of their release and were given three attempts to do so,with the best score being used. 48,000 students enrolled in thecourse with 13,314 watching at least one video, 1,380 completing atleast one assignment and 778 posting in the forums. Of that 778,426 completed at least one assignment. 638 students completedthe course, some managed to do so without posting in the forums.
We extracted a social network from the forums, each student,instructor, and TA was represented by a node. Each student nodewas annotated with their final grade. Forum users could: startnew threads, add to existing threads, or add comments belowexisting posts. We added directed edges from the author of eachitem to the author of the parent post, if any, and to the authorsof the items that preceded it in the current thread. We then elimi-
Proceedings of the 8th International Conference on Educational Data Mining 612

nated all self-loops and collapsed all parallel edges to form a simpleweighted graph for analysis. We extracted two different classesof graphs. The ALL graphs include everyone who participated inthe forums while the Student graphs omit the instructor and TAs.We produced two versions of each graph: one containing all par-ticipants and one that excluded students with a course grade of 0.
We identified communities using the Girvan-Newman Edge Be-tweenness Algorithm [5]. This algorithm takes as input an undi-rected graph and a desired number of communities. It operatesby identifying the edge with the highest edge-betweenness score:the edge that sits on the shortest path between the most nodes. Itthen removes that edge and repeats until the desired number of dis-joint graphs have been made. We applied exploratory modularityanalysis to identify the natural number of communities [1].
Having generated the graphs and determined the natural clusternumbers, we clustered the students into communities. We treatedthe cluster assignment as a categorical variable and tested itscorrelation with final course grades. An examination of the gradedistributions showed that they were non-normal, so we appliedthe Kruskal-Wallis (KW) test to evaluate the relationship [6].The KW test is a non-parametric analogue of the ANOVA test.
4. RESULTS AND DISCUSSIONThe raw graph contained 754 nodes and 49,896 edges. Aftercollapsing the parallel arcs and removing self-loops we retaineda total of 17,004 edges. Of the 754 nodes, 751 were students. Ofthose, 304 obtained a grade of 0 in the course leaving 447 nonzerostudents. The natural cluster number for each of the graphs isshown in Table 1 along with the result of the KW tests. As Table1 illustrates, cluster assignment was significantly correlated withthe students’ grade performance for all of the graphs. A samplevisualization of the student graph is shown in Figure 1.
The students formed detectable communities, and communitymembership was significantly correlated with performance. Whilethe structure of the communities changed when non-students andzero-students were removed, the significance relationships held.Thus while the specific community structure is not stable underdeformations, students are still most connected to others whoperform at a similar level. This is consistent with prior work ontraditional classrooms and issues such as dropout. It runs counterto the naıve assumption that good students will help to improvethe others. While it may be the case that the better performingcommunities contain poorer-performing students who increasedtheir grades through interaction with better students, the presenceof so many low-grade clusters suggests that students do fragmentinto semi-isolated communities that do not perform very well.
More research is required to determine why these communitiesform, whether it is due to motivational factors or similar incomingcharacteristics. We present some work along these lines in [1]. Wewill also examine the stability of the communities over time todetermine whether they can be changed or if they are a naturaloutgrowth of the forums and must be accepted as is.
Table 1: Community cluster numbers and Kruskal-Wallis test of student grade by community.
Users Zeros Clusters K df p-value
All Yes 212 349.03 211 < 0.005All No 173 216.15 172 < 0.02Students Yes 184 202.08 78 < 0.005Students No 169 80.93 51 < 0.005
Figure 1: Student communities with edges of weight 1removed. Nodes represent communities. Size indicatesnumber of students. Color indicates mean grade.
5. ACKNOWLEDGMENTSWork supported by NSF grant #1418269: “Modeling Social Inter-action & Performance in STEM Learning”Yoav Bergner, RyanBaker, Danielle S. McNamera, & Tiffany Barnes Co-PIs.
6. REFERENCES[1] R. Brown, C. F. Lynch, Y. Wang, M. Eagle, J. Albert,
T. Barnes, R. Baker, Y. Bernger, and D. McNamara.Communities of performance & communities of preference.In C. F. Lynch, T. Barnes, J. Albert, and M. Eagle,editors, Proceedings of the 2nd International Workshopon Graph-Based Educational Data Mining, 2015. submitted.
[2] S. Dawson. ’seeing’ thelearning community: An exploration of the development ofa resource for monitoring online student networking. BritishJournal of Educational Technology, 41(5):736–752, 2010.
[3] J. Eckles and E. Stradley.A social network analysis of student retention using archivaldata. Social Psychology of Education, 15(2):165–180, 2012.
[4] M. Fire, G. Katz, Y. Elovici, B. Shapira, and L. Rokach. Pre-dicting student exam’s scores by analyzing social network data.In Active Media Technology, pages 584–595. Springer, 2012.
[5] M. Girvan and M. E. J. Newman. Communitystructure in social and biological networks. Proc. of theNational Academy of Sciences, 99(12):7821–7826, June 2002.
[6] W. H. Kruskal and W. A. Wallis.Use of ranks in one-criterion variance analysis. Journal ofthe American statistical Association, 47(260):583–621, 1952.
[7] C. P. Rose, R. Carlson, D. Yang, M. Wen, L. Resnick,P. Goldman, and J. Sherer. Social factors that contributeto attrition in moocs. In Proc. of the first ACM conferenceon Learning@ scale conference, pages 197–198. ACM, 2014.
[8] Y. Wang, L. Paquette, and R. S. J. D.Baker. A longitudinal study on learner career advancementin moocs. Journal of Learning Analytics. (In Press).
Proceedings of the 8th International Conference on Educational Data Mining 613

A Model for Student Action Prediction in 3D VirtualEnvironments for Procedural Training
Diego RiofríoETSI Informáticos, UPM
Madrid, [email protected]
Jaime RamírezETSI Informáticos, UPM
Madrid, [email protected]
ABSTRACTThis paper presents a predictive student action model, whichuses student logs generated by a 3D virtual environment forprocedural training to elaborate summarized information.This model can predict the most common behaviors by con-sidering the sequences of more frequent actions, which isuseful to anticipate common student’ errors. These logs areclustered based on the number of errors made by each stu-dent and the total time that each student spent to completethe entire practice. Next, for each cluster an extended au-tomata is created, which allows us to generate predictionsmore reliable to each student type. In turn, the action pre-diction based on this model helps an intelligent tutoring sys-tem to generate students’ feedback proactively.
KeywordsIntelligent Tutoring Systems, Educational Data Mining, e-learning, procedural training, virtual environments
1. INTRODUCTIONInteractive simulations or virtual environments (VEs) havebeen used as tools to improve the learning by facilitating the“learning by doing” approach. Some of them show informa-tion to students through pictures, videos, interactive objectsor help teachers make virtual lectures. However, there aresome educative environments that can also supervise the ex-ecution of students’ tasks by employing Intelligent TutoringSystems (ITS), which provide tutoring feedback to students.
As a preamble to this work, a 3D biotechnology virtual labwas developed by our research group [4]. After evaluatingthis virtual lab, we saw opportunity to include the powerof data mining to improve its automatic tutor by takingadvantage of student logs.
Despite the work that has already been done about ITSin Educational Data Mining (EDM), the community missesmore generic results [5]. Furthermore, it is also remarkable
the lack of ITSs that take advantage of models developed byEDM [1].
The work presented in this paper represents a step forwardtowards the development of an ITS that leverages a predic-tive model computed by means of EDM to offer a bettertutoring feedback. Moreover, this ITS is intended for proce-dural training in VEs and is domain independent.
Section 2 describes the proposed architecture for the ITS,which leverages the predictive student model (section 3).Finally, in section 4 we show the conclusions of this work.
2. ITS ARCHITECTURE PROPOSALThe ITS architecture proposal is inspired on MAEVIF ar-chitecture [3], which is an extension of the ITS classical ar-chitecture for VEs.
Our main contribution resides in the Tutoring Module, whichhas a Tutoring Coordinator that validates the students’ ac-tions and shows error messages or hints. This module alsocomprises the Student Behavior Predictor (SBP) and withinit lies the Predictive Student Model, which is used to findout the next most probable action from the last action madeby the student. This information is used to anticipate prob-able students’ errors, which provides a mechanism to avoidthem as long as it is pedagogically appropriate.
3. PREDICTIVE STUDENT MODELPredictive student model uses historical data from past stu-dents and is continually refined (as Romero and Venturarecommend [5]) with actions that students under supervi-sion are doing. In the context of the KDD Process and itsadaptation into EDM formulated by Romero and Ventura[5], this model is created in Models/Patterns phase.
The model contains summarized data from historical reg-istries of actions made by past students, and it is used toobtain the next most probable student’s action. It consistsof several clusters of students where each of them containsan extended automata, detailed in section 3.1. These clus-ters help to provide automatic tutoring adapted to each typeof student. For example, if the student is committing few er-rors, it is more probable that his/her next action will not bean error. However,it will happen the opposite to a studentwho has failed more times.
The process of creation of this model is similar to the one
Proceedings of the 8th International Conference on Educational Data Mining 614

proposed by Bogarın et. al. [2], and it is executed at the tu-tor start-up. Basically, this process consists in taking eventsfrom student logs and from them data clusters of studentsare created based on the number of errors and the time theyspent to complete the entire training process. Then, an au-tomata for each cluster is built from the logs of the studentsusing an incremental method. Later, at training time theSBP component updates the model with each new student’saction attempt.
3.1 Extended Automata DefinitionThis automata consists of states (represented by circles) andtransitions (represented as arrows) as shown in figure 1. Fur-thermore, states are grouped into three zones: Correct Flow,Irrelevant Errors and Relevant Errors Zone.
Figure 1: Example of an extended automata
Transitions denote events across an exercise such as actionsor action attempts that past students have performed sofar and new students may repeat in the future. An eventmay be a valid action of an exercise or an error detectedby the tutor at the time of validating an action attempt.Accordingly, states represent the different situations derivedfrom the events provoked by students.
Each state, and each transition, contains the number of stu-dents whose logged sequences of events have passed through,which becomes into event probabilities between states. Inthe case of states with loops, event frequencies to next stateare reflected in a vector. In this way, the probability that astudent leaves the loop on each iteration can be represented.
3.1.1 Correct Flow ZoneIn this area, events represent the valid sequence of actionsfor an exercise, which ends up with a final satisfactory state.These states are represented by white circles.
3.1.2 Irrelevant Errors ZoneThis zone groups states derived from error events that donot influence in the final result. These error events are asso-ciated with action attempts blocked by the automatic tutor(blocking errors [4]). These are graphically represented bya yellow circle.
3.1.3 Relevant Errors ZoneThis area encompasses states derived from error events thatactually influence in the final result, i.e. if an event of thistype occurs the final result will be wrong unless a repair-ing action is done (non-blocking errors [4]). In this case
there will be an error propagation to the subsequent states,because it does not matter what the student does later (ex-cept for some repairing action), the subsequent states willbe considered also erroneous. The states derived directlyfrom these errors are graphically represented by red circlesand the subsequent correct states by orange circles.
In addition, repairing actions can be found in this area.These actions fix errors occurred earlier and redirect to onestate in the correct flow.
4. CONCLUSIONSOur proposal achieves an automatic tutoring in proceduraltraining more adapted to each type of student by apply-ing methods of extraction and analysis of data, which cananticipate possible errors depending on its configuration.
The principal application of the presented predictive modelis to help students with preventing messages. For this, wehave designed an ITS, presented above, which leverages thepredictive model to provide that kind of tutoring.
We consider that the advice of an expert educator or teacherof the subject is essential at design time, despite this ITSmay become very independent once its tutoring strategy isconfigured. This is because the resulting predictive modelneed to be analyzed for refining the tutoring strategy. In or-der to facilitate this task, it will be necessary to develop anapplication that displays the model to the expert or profes-sor. In this way, he/she could visualize where students makemore mistakes or where the practice is easier for them, andwith this information he/she could decide where and whattutoring feedback is needed. Additionally, this could alsohelp teacher to improve his/her own teaching.
5. ACKNOWLEDGEMENTSRiofrıo thanks Secretariat of Higher Education, Science, Tech-nology and Innovation from Ecuador (SENESCYT).
6. REFERENCES[1] R. S. Baker. Educational data mining: An advance for
intelligent systems in education. Intelligent Systems,IEEE, 29(3):78–82, 2014.
[2] A. Bogarın, C. o. b. Romero, R. Cerezo, and M. S anchez-Santill a n. Clustering for improving educationalprocess mining. In Proceedings of the FourthInternational Conference on Learning Analytics AndKnowledge, pages 11–15. ACM, 2014.
[3] R. Imbert, L. Sanchez, A. de Antonio, G. Mendez, andJ. Ramırez. A multiagent extension for virtual realitybased intelligent tutoring systems. Advanced LearningTechnologies, 2007. ICALT 2007. Seventh IEEEInternational Conference on, pages 82–84, 2007.
[4] M. Rico, J. Ramirez, D. Riofrıo Luzcando,M. Berrocal-Lobo, A. De Antonio, and D. Riofrio. Anarchitecture for virtual labs in engineering education.In Global Engineering Education Conference(EDUCON), 2012 IEEE, pages 1–5, 2012.
[5] C. Romero and S. Ventura. Data mining in education.Wiley Interdisciplinary Reviews: Data Mining andKnowledge Discovery, 3(1):12–27, 2013.
Proceedings of the 8th International Conference on Educational Data Mining 615

The Impact of Instructional Intervention and Practice onHelp-Seeking Strategies within an ITS
Caitlin TenisonDepartment of PsychologyCarnegie Mellon University
5000 Forbes Ave.Pittsburgh, PA 15213
Christopher J. MacLellanHuman-Computer InteractionCarnegie Mellon University
5000 Forbes Ave.Pittsburgh, PA 15213
ABSTRACTWithin intelligent tutoring systems, instructional events areoften embedded in the problem-solving process. As studentsencounter unfamiliar problems there are several actions theymay take to solve it: they may explore the space by tryingdifferent actions in order to ‘discover’ the correct path orthey can request a hint to get ‘direct instruction’ about howto proceed. In this paper we analyze experimental data froma tutoring system that provides two different kinds of hints:(1) interface specific hints that guide students attention torelevant portions of a worked example, supporting studentdiscovery of next steps, and (2) procedural hints that di-rectly tell students how to proceed. We adapted a methodof sequence clustering to identify distinct hinting strategiesacross the two conditions. Using this method, we discoveredthree help-seeking strategies that change due to experimen-tal condition and practice. We find that differences in strat-egy use between conditions are greatest for students thatstruggle to achieve mastery.
1. INTRODUCTIONAs an instructional practice, tutoring supports students asthey learn by doing. The tutor passively observes whilethe student is successful, but intervenes when the studentstruggles. In this paper, we explore data from two intel-ligent tutoring system (ITS) experimental conditions thattake different approaches to assisting students. The condi-tions utilized adaptations of two common instructional per-spectives, direct instruction and independent student discov-ery. These methods are often discussed in contrast to oneanother. Direct Instruction (DI) involves explicitly identi-fying and teaching the key principles, skills, and proceduresfor performing a specific task. The Discovery Method (DM),on the other hand, fosters a student’s discovery of these prin-ciples, skills, and procedures by referring to content in thelearning environment and providing indirect feedback andguidance.
To explore how DI and DM impact student learning we an-alyzed data from two algebra equation solving tutors [1]. Inboth tutors students were provided with a worked exam-ple. However, in the DI condition, students were providedwith explicit procedural hints whereas in the DM condition,hints provided general information about the interface. Intheir initial analysis, Lee et al. looked at average actions perproblems across several units and found that on some earlyunits students in the DM tutor showed a higher proportion
of mastered skills than students in the DI tutor. This effectdid not persist in later units of the tutor. They concludedthat, in the early units, students in the DM condition wereable to learn faster with the non-verbal worked examplesscaffolding than with the informative hints of the DI condi-tion. In the current paper we aim to take a more nuancedlook at how the two experimental conditions impacted help-seeking strategies and how these strategies change over thecourse of problem solving.
2. METHODSThe experiment was conducted within the Carnegie Learn-ing Algebra tutor. Twenty-two high school classes wererandomly assigned to the DI condition and sixteen classeswere randomly assigned to the DM condition. We restrictedthis sample to students who had completed all experimen-tal problems in the ‘Two-step linear equation solving’ unit(DI=136, DM=138). Tutors in both conditions featured aworked example that faded as students achieved mastery.In the DI condition students were provided with hints thatinstructed them on what procedure to do and why to do it(e.g. “To eliminate -1, add 1 to both sides of the equationbecause -1 +1=0”). In the DM condition students were pro-vided with hints about how to use the interface (e.g. “Selectan item from the transform menu and enter a number”).Unlike the traditional Cognitive Tutor, the initial hint wasa bottom out hint. Finally, in both tutors students couldmake two types of mistakes, which received different feed-back. If they selected off-task actions (e.g. choosing to mul-tiply when they should have divided), they received a ‘bug’telling them to undo their action and ask for a hint. If theyselected an on-task action, but incorrectly applied it (e.g.dividing by an incorrect amount), they would receive ‘error’feedback that their action was incorrect.
To identify distinct strategic behaviors within these tutorswe first generated a matrix of all problem-solving sequencesfor each participant. We had a total of 5541 sequences forthe DI condition and 5430 sequences for the DM condition.Correct actions were coded as ‘Success’, off-path actions as‘Bug’, on-path actions as ‘Error’, and hints as ‘Hint’. Next,we used a clustering method previously used to detect strat-egy use within an ITS [2]. This method consists of fitting aMarkov Chain (MC) to each sequence, evaluating the fit ofeach sequence’s MC to every other sequence’s MC to derivea dissimilarity matrix, and using k-mediods to cluster thesequences. We found that fitting 3 clusters produced the
Proceedings of the 8th International Conference on Educational Data Mining 616

Figure 1: The student behavior for each cluster. Arrow gradients denote transition probability. Green nodes representsuccess, red error, orange bugs, and yellow hints.
highest average silhouette coefficient. Then, for each clusterwe re-fit a single MC using all sequences assigned to thatcluster to generate transition probabilities between statesused to make Figure 1. After clustering the sequences wefit a binomial mixed-effects model to each cluster to bet-ter understand how students moved through the strategicclusters. Our models included fixed effects for experimen-tal condition, the number of problems students solved (werefer to this as Practice Opportunity), and an interactionbetween experimental condition and practice opportunity.The models also included a random intercept for student toaccount for individual differences, and a random interceptfor each specific problem to account for differences betweenthe specific problems.
3. RESULTSFigure 1 illustrates the occupancy and transitions betweenthe different actions of the three clusters. A Chi-Squaredtest found that the cluster assignment of sequences from thetwo conditions are significantly different (χ2(2) = 131.7, p <.001). More sequences in the DM condition were observedin Strategy 1 (DI=2886, DI=2922) and Strategy 3 (DI=765,DM=1103) than students in the DI condition, whereas the
Figure 2: The average usage of strategies across practiceopportunity for the two conditions. The solid vertical anddashed lines indicate the average point of mastery for DM(M=39,SD=11.5) and DI (M=41, SD 14).
reverse was true for Strategy 2 (DI=1890, DM=1405). Mod-eling Strategy 1 use, we found that the level of variabilitybetween conditions was not sufficient to include a randomeffect of problem. We found a marginally significant effect ofintercept (z = 1.94, p = 0.053) along with a marginally sig-nificant interaction between the DM condition and practiceopportunity (z = 1.89, p = 0.059). In modeling the use ofStrategy 2, we found that there was a significant fixed effectof intercept (z = −7.8, p < .001) and of practice opportunity(z = 3.4, p < .001). Finally, in modeling the use of Strategy3, we found that the random effect of practice opportunitywas invariant across the different problems and model fit wasimproved by removing it. After removal, we found a signifi-cant fixed effect of intercept (z = −11.2, p < .001) as well asa significant effect of the DM condition (z = 3.0, p < .005).Figure 2, while not capturing the full nuanced relationshipbetween the different factors and strategy assignments, of-fers some reference for understanding the model results.
In conclusion, our approach enabled us to build a picture ofthe strategies students use and how they change over time.Our results suggest that strategy use in the DM and DIconditions is similar, with differences appearing after higherperforming students begin to reach mastery. This suggeststhat students who do not need help and are not exposedto the experimental manipulations have similar strategiesacross the two conditions. In contrast, students who achievemastery more slowly ask for more hints, receive the ma-nipulation, and consequently vary in their use of strategy.Future work might benefit from focusing on students thattake longer to reach mastery and from coding problem type.
4. ACKNOWLEDGMENTSThis work is supported in part by IES (R305B090023). Wethank Carnegie Learning, Inc., for providing the CognitiveTutor data supporting this analysis. All opinions expressedin this article are those of the authors and do not necessarilyreflect the position of the sponsoring agency.
5. REFERENCES[1] H. S. Lee, J. R. Anderson, S. R. Berman,
J. Ferris-glick, T. Nixon, and S. Ritter. Exploringoptimal conditions of instructional guidence in anAlgebra tutor. In SREE Fall 2013 Conference, 2013.
[2] C. Tenison and C. J. Maclellan. Modeling Strategy Usein an ITS : Implications for Strategic Flexibility. InITS, 2014.
Proceedings of the 8th International Conference on Educational Data Mining 617

Predicting Performance on Dichotomous Questions:Comparing Models for Large-Scale Adaptive Testing
Jill-Jênn Vie, Fabrice Popineau,Yolaine Bourda
LRI – Bât. 650 Ada LovelaceUniversité Paris-Sud91405 Orsay, France
{jjv,popineau,bourda}@lri.fr
Jean-Bastien GrillInria Lille - Nord Europe
40 avenue Halley59650 Villeneuve-d’Ascq,
Éric BruillardENS Cachan – Bât. Cournot61 av. du Président Wilson
94235 Cachan, Franceeric.bruillard@ens-
cachan.fr
ABSTRACTComputerized adaptive testing (CAT) is a mode of testingwhich has gained increasing popularity over the past years.It selects the next question to ask to the examinee in orderto evaluate her level efficiently, by using her answers to theprevious questions. Traditionally, CAT systems have beenrelying on item response theory (IRT) in order to providean effective measure of latent abilities in possibly large-scaleassessments. More recently, from the perspective of provid-ing useful feedback to examinees, other models have beenstudied for cognitive diagnosis. One of them is the q-matrixmodel, which draws a link between questions and examineeknowledge components. In this paper, we define a proto-col based on performance prediction to evaluate adaptivetesting algorithms. We use it to evaluate q-matrices in thecontext of assessments and compare their behavior to itemresponse theory. Results computed on three real datasetsof growing size and of various nature suggest that tests ofdifferent type need different models.
KeywordsAdaptive assessment, computerized adaptive testing, cogni-tive diagnosis, item response theory, q-matrices
1. INTRODUCTIONAutomated assessment of student answers has lately gainedpopularity in the context of online initiatives such as massiveonline open courses (MOOCs). Such systems must be ableto rank thousands of students for evaluation or recruitingpurposes and to provide personal feedback automatically forformative purposes.
For computerized adaptive tests (CAT), item response the-ory (IRT) provides the most common models [3]. IRT pro-vides a framework to evaluate the performance of individualquestions, called items, on assessments [6]. When the in-tention is more formative, examinees can receive a detailedfeedback, specifying which knowledge components (KCs) aremastered and which ones are not [1]. Most of these modelsrely on a q-matrix specifying for each question the differentKCs required to solve it.
We propose a protocol to evaluate adaptive testing algo-rithms and use it to compare the performances of the sim-plest IRT model, the 1-parameter logistic one, commonlyknown as Rasch model, with the simplest Q-matrix model.We expect to answer the following question: given a budget
of questions of a certain dataset asked according to a cer-tain adaptive selection rule, which model performs the bestat predicting the answers of the examinee over the remainingquestions? We managed to get satisfactory results, enablingus to state that no model dominates in all cases: accordingto the type of test, either the Rasch model or the q-matrixperforms the best.
2. BACKGROUND AND RELATED WORK2.1 Item Response Theory: Rasch ModelThe Rasch model estimates the latent ability of a student bya unique real number θ modeled by a random variable andcharacterizes each question by one real number: its difficultyd, corresponding to the ability needed to answer the ques-tion correctly. Knowing those parameters, the probabilityof the event “the student of ability θ answers the questionof difficulty d correctly”, denoted by success, is modeled by:
Pr{success|θ} = 1
1 + e−(θ−d).
The aim is first to optimize the parameters dj for each ques-tion j and θi for each student i in order to fit a given traindataset. Then, throughout the test, a probability distribu-tion over θi is updated after each question answered, usingthe Bayes’ rule.
2.2 Cognitive Diagnosis Model: Q-matrixWe now present a model that tries to be more informativeabout the student’s knowledge components. Every studentis modeled by a vector of binary values (a1, . . . , aK), calledknowledge vector, representing her mastery of K distinctKCs. A q-matrix Q [7] represents the different KCs involvedin answering every question. In the NIDA model consideredhere [3], Qij is equal to 1 if the KC j is required to succeedat question i, 0 otherwise. More precisely, we denote by si(gi) the slip (guess) parameter of item i. The probability ofa correct response at item i is 1− si if all KCs involved aremastered, gi if any required KC is not mastered.
The KCs are considered independent, thus the student’sknowledge vector is implemented as a vector of size K indi-cating for each KC the probability of the student to masterit. Throughout the test, this vector is updated using Bayes’rule. From this probability distribution and with the helpof our q-matrix, we can derive the probability for a givenstudent to answer correctly any question of the test.
Proceedings of the 8th International Conference on Educational Data Mining 618

3. ADAPTIVE TESTING FRAMEWORKOur student data is a dichotomous matrix of size NS ×NQ
where NS and NQ denote respectively the number of stu-dents and the number of questions, and cij equals 1 if stu-dent i answered the question j correctly, 0 otherwise.
We detail our random subsampling validation method. Oncethe model has been trained, for each student of the testdataset, a CAT session is simulated. In order to reduceuncertainty at most, at each step we pick the question thatmaximizes the Fisher information and ask it to the student.The student parameters are updated according to her answerand a performance indicator at the current step is computed.To compare it to the ground truth, we choose the negativelog-likelihood [5], that we will denote by “mean error”.
4. EVALUATIONWe compared an R implementation of the Rasch model(IRT) and our implementation of the NIDA q-matrix model(Q) for different values of the parameter K, the number ofcolumns of the q-matrix. Our algorithms were tested overthree real datasets:SAT dataset [4]. Results from 296 students on 40 ques-tions from the 4 following topics of a SAT test: Mathematics,Biology, World History and French.Fraction dataset [2]. Responses of 536 students to 20questions about fraction subtraction.Castor dataset. Answers of 6th and 7th graders competingin a K-12 Computer Science contest which was composed of17 tasks. It is a 58939× 17 matrix, where the (i, j) entry is1 if contestant i got full score on task j, 0 otherwise.
Results are presented in Table 1 where the best performancesare shown in bold. As a reference, 1.0 is the error obtainedby the trivial algorithm affecting 1/2 to every probability.On the Castor dataset, IRT performs better than Q for anyvalue of K throughout the whole test. On the Fractiondataset, the handmade q-matrix achieves the highest error.In the early questions of the test, Q algorithms forK = 8 and11 perform slightly better than IRT. The Fraction datasetis a calculus test: it requires tangible, easy-to-define knowl-edge components. Therefore, after a few carefully chosenquestions Q can estimate reasonably the performance of anexaminee over the remaining ones. On the SAT dataset, IRTachieves the lowest error among all tested algorithms. Wealso observe that the variance increases throughout the test,probably because the behavior of the algorithm may varysubstantially if the remaining questions are from a differenttopic than the beginning of the test.
5. DISCUSSION AND FUTURE WORKOur comparison of the cognitive diagnosis model with IRTseems to indicate that q-matrices perform better on a certaintype of tests; in the Fraction test, there are redundanciesfrom one question to another in order to check that a notionis known and mastered. Conversely, IRT performs better onboth the SAT test and Castor contest, which is remarkablegiven its simplicity. The fact that the SAT test is multidis-ciplinary explains the difficulty of all considered algorithmsin predicting the answers, and the nature of Castor as acontest may require a notion of level instead of knowledgemastery. Therefore, in those cases, we will prefer to use theRasch model. In order to confirm this behavior, we plan totest our implementation on many other datasets.
Castor Fraction
5 10 15
0.0
0.1
0.2
0.3
0.4
0.5
IRTQ−matrix K = 5Q−matrix K = 8Q−matrix K = 14
Number of questions asked
Mea
n er
ror
5 10 15 20
0.0
0.2
0.4
0.6
0.8
IRTQ−matrix K = 8 handmadeQ−matrix K = 8Q−matrix K = 11
Number of questions asked
Mea
n er
ror
Castor After 4 q. After 10 q. After 16 q.Q K = 2 0.555 ± 0.004 0.456 ± 0.005 0.167 ± 0.012Q K = 5 0.574 ± 0.004 0.460 ± 0.006 0.206 ± 0.016Q K = 8 0.520 ± 0.004 0.409 ± 0.006 0.148 ± 0.013Q K = 11 0.519 ± 0.004 0.462 ± 0.007 0.218 ± 0.014Q K = 14 0.515 ± 0.003 0.449 ± 0.006 0.169 ± 0.014
IRT 0.484 ± 0.003 0.346 ± 0.005 0.111 ± 0.010
FractionQ K = 2 0.464 ± 0.012 0.326 ± 0.013 0.196 ± 0.017Q K = 5 0.440 ± 0.011 0.289 ± 0.014 0.146 ± 0.013Q K = 8 0.407 ± 0.011 0.276 ± 0.015 0.159 ± 0.015Q K = 11 0.395 ± 0.009 0.255 ± 0.013 0.156 ± 0.015Q K = 14 0.422 ± 0.009 0.274 ± 0.014 0.180 ± 0.018
IRT 0.435 ± 0.012 0.304 ± 0.013 0.142 ± 0.012Q* K = 8 0.596 ± 0.008 0.346 ± 0.007 0.182 ± 0.007
SATQ K = 2 0.522 ± 0.007 0.417 ± 0.010 0.315 ± 0.018Q K = 5 0.469 ± 0.007 0.365 ± 0.012 0.306 ± 0.019Q K = 8 0.463 ± 0.007 0.367 ± 0.013 0.242 ± 0.018Q K = 11 0.456 ± 0.008 0.364 ± 0.013 0.331 ± 0.023Q K = 14 0.441 ± 0.007 0.350 ± 0.012 0.296 ± 0.021
IRT 0.409 ± 0.008 0.285 ± 0.012 0.248 ± 0.022
Table 1: Mean error of the different algorithms over the re-maining questions of the Castor and Fraction datasets, aftera certain number of questions have been asked. The dashedcurve denotes the Rasch model (IRT), while the curves ofgrowing thickness denote q-matrices (Q) of growing num-ber of columns. The dotted curve in Fraction denotes thehandmade q-matrix (Q*) [2].
6. ACKNOWLEDGEMENTSWe thank Chia-Tche Chang, Le Thanh Dung Nguyen andespecially Antoine Amarilli for their valuable comments. Wealso thank Mathias Hiron for providing the Castor dataset.This work is supported by the Paris-Saclay Institut de laSociete Numerique funded by the IDEX Paris-Saclay, ANR-11-IDEX-0003-02.
7. REFERENCES[1] Y. Cheng. When cognitive diagnosis meets computerized
adaptive testing: CD-CAT. Psychometrika, 74(4):619–632,2009.
[2] L. T. DeCarlo. On the analysis of fraction subtraction data:The dina model, classification, latent class sizes, and theq-matrix. Applied Psychological Measurement, 2010.
[3] M. C. Desmarais and R. S. Baker. A review of recentadvances in learner and skill modeling in intelligent learningenvironments. User Modeling and User-Adapted Interaction,22(1-2):9–38, 2012.
[4] M. C. Desmarais et al. Conditions for effectively deriving aq-matrix from data with non-negative matrix factorization.In 4th International Conference on Educational DataMining, EDM, pages 41–50, 2011.
[5] T. Gneiting and A. E. Raftery. Strictly proper scoring rules,prediction, and estimation. Journal of the AmericanStatistical Association, 102(477):359–378, 2007.
[6] R. K. Hambleton, H. Swaminathan, and H. J. Rogers.Fundamentals of item response theory. Sage, 1991.
[7] K. K. Tatsuoka. Rule space: An approach for dealing withmisconceptions based on item response theory. Journal ofEducational Measurement, 20(4):345–354, 1983.
Proceedings of the 8th International Conference on Educational Data Mining 619

The Effect of the Distribution of Predictions of User ModelsEric G. Van Inwegen Yan Wang Seth Adjei Neil Heffernan
100 Institute RdWorcester, MA, 01609-2280
+1-508-831-5569{egvaninwegen, ywang14, saadjei, nth} @wpi.edu
ABSTRACTWe hypothesize that there are two basic ways that a user model can perform better than another: 1.) having test data averages that match the prediction values (we call this the coherence of the model) and 2.) having fewer instances near the mean prediction (we call this the differentiation of the model). There are several common metrics used to determine the goodness of user models; these metrics conflate coherence and differentiation. We believe that user model analyses will be improved if authors report the differentiation, as well as to include an ordering metric (e.g. AUC/A’ or R2) and an error measurement (Efron’s R2, RMSE or MAE). Lastly, we share a simplified spreadsheet that enables readers to examine these effects on their own datasets and models.
1. INTRODUCTION AND BACKGROUNDOne of the goals of many in the online educational community is to more accurately predict whether a student will get the next question correct. In order to predict student responses, algorithms such as Knowledge Tracing [2], Performance Factors Analysis[6], and tabling methods [10] etc. have been developed. (See [3] for a thorough review of various user models.) Looking at only papers presented at EDM 2014, we find more than 6 new models or modifications proposed in the full papers alone [14]. Common metrics used to determine when a model is better than another include AUC/A’, RMSE, MAE, and R-squared. There has been some work done (e.g. [1, 4]) looking into what metrics to use and how to interpret them [5, 11].
One can argue that current models predict the probability that a student-problem-instance (hereafter “instance”) will be correct. Models such as Knowledge-Tracing (“KT”), Performance Factors Analysis (“PFA”), and their derivatives create a theoretically continuous range of predictions from 0.00 to 1.00. Even tabling models (eg. [10]) may predict a (near) continuous range of valuesthrough regressions. We argue that there are two properties of a model that will make it more accurate: 1.) How well a prediction matches the aggregate test-data, and 2.) How well the model can make predictions away from the mean.
1.1 Our Definitions1.1.1 “Coherence” Given a large enough data-set, we argue that an accurate model’s predictions should match the test data average for a given group of instances. For example, if a model were to identify a group of instances and give that group a predicted value of 0.25, we argue that the model is most accurate when exactly one out of every four students in that condition gets the correct answer. If the model predicts 0.25, but only one out of every ten gets it right, the model’s “scores” by most metrics will be improved, however, it is not as accurate as a similar model that groups that same instances together, but predicts 0.10.
1.1.2 “Differentiation”A naive model of student knowledge might use the average score from a training dataset and predict with that probability for all
instances. Arguably, more complicated user models seek to find reasons not to do this. The more features that a model can incorporate to move predictions away from the mean value, the better a model is at not making the mean prediction. We use the term “differentiation” in much the same way as “distribution”, but do so to avoid possible confusion with the distribution of the training data.
2. METHODSIn order to visualize the impact of differentiation and coherence on the various metrics, we generate not synthetic data, but rather synthetic model outputs. To examine the effect of differentiation,a spreadsheet was created that allows the user to input prediction value, test group average, and number of instances within that group, for up to eleven groups. The spreadsheet then calculates values for AUC, A’, R2, Efron’s R2, RMSE, and MAE. A publicly shared copy of the spreadsheet can be found at: http://tinyurl.com/kznthk7. In addition to using synthetic data, the results of three models fitted to real data are explored.
3. RESULTS AND DISCUSSIONFigure 1 is a plot of the six metrics as a differentiation changes from an exceptionally steep “V” to flat to increasingly steep “A”.All “models” have perfect coherence. E.g., when the model predicts 0.20, exactly 2/10 students are correct. From Figure 1, we can see that differentiation plays a role in user model “scores”.
To see if these ideas have merit on real data, we analyze three different models fitted to the same (~400K instance) dataset. In another paper [16], we have submitted a new user model. In that paper, the new model, called “SuperBins” (SB), is compared to Knowledge Tracing and Performance Factors Analysis, and found to be “better”, according to RMSE, R2, and AUC. If we create a frequency table of 11 groups, we will certainly lose precision, but the analysis is useful. To do so, we average the prediction values (according to their frequency) across eleven equal lengths of prediction values of the data set; we do the same for the test data
Figure 1: Chart of synthetic model outcomes showing the basic effect of changing differentiation.
Proceedings of the 8th International Conference on Educational Data Mining 620

averages. E.g.., the average prediction value from 0 to 0.0909, as weighted by the frequency of each prediction was found to be 0.08 for the SuperBins model. There were no predictions in that range for KT. There were nine for PFA (eight were right), with an average prediction value of 0.01.
The analysis of coherence shows that, from 0.60 and up, all three models are reasonably accurate; i.e., the predictions closely match the test data averages. However, KT has over-predicted in the three largest of the 6 groups below 0.60. PFA appears to be reasonably consistent; however, one could argue that PFA consistently under-predicts in this range. Others [7] have previously reported on KT over-reporting. With this analysis, we can say that PFA has done the worst of the three at moving instances away from the mean. The major reason why SB scores so well against the other two could be its ability to bring more predictions below 0.50, while maintaining coherence.
The easiest way to measure the differentiation of the prediction values might be to report the standard deviation of prediction values. As a way to compare to the “ideal” (for that dataset), we could report either the standard deviation of the test data (0.439), or the standard deviation of the training data (0.440).
4. CONCLUSIONThere are times when the metrics “scoring” user models disagree; in addition, it may be helpful for a deeper comparison.
We conclude that, if we are to accurately compare knowledge predicting models to each other, we need to look at new metrics, in addition to a mix of old metrics. We do not believe that we are proposing the “ultimate” single metric that will definitively state which model is “better”. We are stating that we believe model comparison is improved when it contains (AUC or A’, or R2), and (Efron’s R2, RMSE, or MAE) and the standard deviation of the predictions. A more thorough comparison might also include coherence-frequency table analysis in an attempt to identify regions of habitual over or under prediction.
5. ACKNOWLEDGEMENTS We would like to thank Ryan Baker and Joseph Beck for taking the time to discuss these ideas with us and make suggestions. We also acknowledge and thank funding for ASSISTments from the NSF (1316736, 1252297, 1109483, 1031398, 0742503, and1440753), the U.S. Dept. of Ed. GAANN (P200A120238), ONR’s “STEM Grand Challenges,” and IES (R305A120125, R305C100024).
6. REFERENCES[1] Beck, J. E., & Xiong, X. (2013). Limits to accuracy: How well can we do at student modeling. Educational Data Mining.
[2] Corbett, A. T., & Anderson, J. R. (1994). Knowledge tracing: Modeling the acquisition of procedural knowledge. User modeling and user-adapted interaction, 4(4), 253-278.
[3] Desmarais, M. C., & d Baker, R. S. (2012). A review of recent advances in
learner and skill modeling in intelligent learning environments. User Modeling and User-Adapted Interaction,22(1-2), 9-38.
[4] Dhanani, A., Lee, S. Y., Phothilimthana, P., & Pardos, Z. (2014). A comparison of error metrics for learning model parameters in bayesian knowledge tracing. Technical Report UCB/EECS-2014-131, EECS Department, University of California, Berkeley.
[5] Fogarty, J., Baker, R. S., & Hudson, S. E. (2005). Case studies in the use of ROC curve analysis for sensor-based estimates in human computer interaction. Proceedings of Graphics Interface 2005. Canadian Human-Computer Communications Society.
[6] Pavlik Jr, P. I., Cen, H., & Koedinger, K. R. (2009). Performance Factors Analysis--A New Alternative to Knowledge Tracing. Online Submission.
[7] Qiu, Y., Pardos, Z. & Heffernan, N. (2012). Towards data driven user model improvement. Proceedings of the Twenty-Fifth International Florida Artificial Intelligence Research Society Conference. Florida Artificial Intelligence Research Society (FLAIRS 2012). pp. 462-465.
[8] Stamper, J., Pardos, Z., Mavrikis, M., McLaren, B.M. (eds.) Proceedings of the 7th International Conference on Educational Data Mining.
[9] Van Inwegen, E. G., Adjei, S. A., Wang, Y., & Heffernan, N. T. “Using Partial Credit and Response History to Model User Knowledge” accepted into Educational Data Mining 2015.
[10] Wang, Y., & Heffernan, N. T. (2011). The" Assistance" Model: Leveraging How Many Hints and Attempts a Student Needs. FLAIRS Conference.
[11] Yudelson, M., Pavlik Jr, P. I., & Koedinger, K. R. (2011). User Modeling–A Notoriously Black Art. User Modeling, Adaption and Personalization, 317-328.
Table 1: A coherence-frequency table of results from three knowledge models trained and tested on the same real dataset (80/20). Model results have been averaged across 11 intervals for demonstration purposes. The prediction and test values are the weighted averages of each model within the ranges on the left.
SB KT PFARange pred test n pred test n pred test n0.0000 - 0.0909 0.08 0.00 5 n/a n/a 0 0.01 0.78 90.0910 - 0.1818 0.14 0.13 516 0.16 0.75 4 0.13 0.53 170.1819 - 0.2727 0.22 0.23 892 0.24 0.30 64 0.23 0.46 560.2728 - 0.3636 0.31 0.32 1829 0.33 0.28 704 0.31 0.49 1680.3637 - 0.4545 0.41 0.41 3235 0.40 0.36 2565 0.41 0.42 6430.4546 - 0.5454 0.50 0.51 4878 0.51 0.48 6978 0.50 0.49 35390.5455 - 0.6363 0.60 0.60 6355 0.60 0.61 8776 0.61 0.59 73760.6364 - 0.7272 0.69 0.69 9772 0.69 0.71 12149 0.70 0.70 258190.7273 - 0.8181 0.79 0.79 25296 0.78 0.78 18518 0.77 0.78 255800.8182 - 0.9090 0.86 0.87 23347 0.87 0.85 23600 0.87 0.87 138110.9091 - 1.0000 0.97 0.97 3074 0.95 0.95 5841 0.97 0.96 2181
MetricsAUC0.728
R2
0.145RMSE0.406
AUC0.710
R2
0.115RMSE0.413
AUC0.653
R2
0.058RMSE0.426
stdev (pred): 0.166 stdev(pred): 0.147 stdev(pred): 0.107
Proceedings of the 8th International Conference on Educational Data Mining 621

Predicting Student Aptitude Using Performance History
Anthony F. BotelhoWorcester Polytechnic Institute
100 Institute Rd.Worcester, MA [email protected]
Seth A. AdjeiWorcester Polytechnic Institute
100 Institute Rd.Worcester, MA 01609-2280
Hao WanWorcester Polytechnic Institute
100 Institute Rd.Worcester, MA 01609-2280
[email protected] T. Heffernan
Worcester Polytechnic Institute100 Institute Rd.
Worcester, MA [email protected]
ABSTRACTMany tutoring systems currently in use provide a wealth ofinformation pertaining to student learning over long periodsof time. Providing meaningful representations of studentperformance can indicate levels of knowledge and under-standing that can alert instructors to potential strugglingstudents in order to provide aid where it is needed; it isthe goal of many researchers to even provide such indicationpreemptively in order to intervene before students becomefrustrated when attempting new skills. The goal of this workis to utilize student performance history to provide a meansof quantizing student aptitude, defined here as the speed atwhich a student learns, and then using this measurementto predict the speed at which each student will learn thenext skill before beginning. Observing a dataset of 21 skills,we compare two methods of predicting aptitude to major-ity class predictions at the skill level. Our results illustratehow our proposed methods exhibit different strengths in pre-dicting student aptitude when compared to majority class,and may be used to direct attention to a struggling studentbefore attempting a new skill.
KeywordsAptitude, Student Knowledge, Intelligent Tutoring Systems
1. INTRODUCTIONMany instructors rely on intelligent tutoring systems (ITS)as a means of extending student learning outside the class-room. Many such systems, such as the ASSISTments sys-tem used in this work, provide a wealth of student perfor-mance data that is often underutilized. While many systemshave focused on and have shown success in predicting nextproblem correctness, such information is only useful to in-structors in a short time-span as students are completing
assignments. Furthermore, many of these models rely onlatent variables that leas to problems of identifiability [1]when attempting to draw conclusions of student knowledge.
The purpose of this work is to observe and predict studentlearning rates, referenced throughout this paper as aptitude;this value is expressed as a metric in terms of completionspeed (cs), or the number of problems a student needs tocomplete the assignment (described further in the next sec-tion). Such a measure of aptitude in prerequisite skills hasshown to be successful in predicting initial knowledge, rep-resented as correctness, on a subsequent skill [2], illustratingthat the two concepts are related, but from that work, it isunclear as to whether student aptitude is transitive acrossskills. In this work, therefore, we strive to answer the fol-lowing research questions:1. Do students exhibit similar degrees of aptitude acrossskills?2. Are changes in student aptitude across skills predictable?3. Can a student’s aptitude in previous skills be used to con-struct a reliable prediction of completion speed in a new skillbefore it is begun?
2. METHODOLOGYThe dataset1 used in this work is comprised of real-worlddata from PLACEments test data reported from the AS-SISTments tutoring system. Data pertaining to 21 uniqueobservable skills was extracted. Here, we define a skill asobservable if it contains data from more than 10 uniquestudents, and no less than half of the students must havecompleted the skill. ASSISTments defines skill completionin terms of 3 consecutive correct answers.
We used a simple binning method implemented in similarresearch [2][3] to place students into one of five categoriesbased on completion speed in order to represent differentlevels of aptitude. As aptitude is an independent concept ofdomain knowledge, a student’s entire recorded performancehistory, regardless of the prerequisite structure, was usedto categorize each student. Observing each student’s per-formance over several skills, we used a moving average ofstudent completion rates of each skill ordered from oldest
1The original raw dataset can be found at the following link:http://bit.ly/1DVbHdB.
Proceedings of the 8th International Conference on Educational Data Mining 622

to most recent. Equation 1 displays the formula for thismethod. For our implementation, we used a value of 0.3 foralpha.
At = ((1− α) ∗At−1) + (α ∗ Vt) (1)
Table 1: The ranges of completion speed representedby each bin with corresponding the quantized apti-tude value.Bin Number Completion Speed(cs) Quantized Value
1 3 ≤ cs ≤ 4 12 4 < cs < 8 0.753 8 ≤ cs 0.54 DNF, pcor ≥ .667 0.255 DNF, pcor < .667 0
Once an average completion speed, in terms of number ofproblems needed to reach three sequential correct responses,each student is placed in the corresponding bin described inTable 1. Bins 4 and 5 contain students that did not finish(DNF) at least one previous skill, and are instead split basedon the average percent correctness (pcor) across all previousskills. The quantized values are chosen arbitrarily to dis-cretize the learning rate that is intended to be representedby each bin.
2.1 ExperimentsOur first prediction method, referenced as Same Bin Pre-diction (SBP) in our results section, simply uses the averagecompletion speed of each student’s performance history todetermine in which bin to place each student. The methodthen simply uses that bin’s quantized value as a predictionfor the new skill. Both the SBP and majority class arethen compared to each student’s actual completion speed,expressed as a quantized bin value, to determine both errorrates.
Our second experiment attempts to make predictions againusing each student’s performance history, but by also takinginto account changes in aptitude across skills. Our first ex-periment assumes that most students will exhibit the samelevel of aptitude in a new skill as in previous skills. This ex-periment takes into account the realization that differencesin skill difficulty may cause fluctuations in our aptitude mea-surements. Our second method, referenced as TransitioningBin Prediction (TBP) in our results section, builds off of theprevious SBP prediction by calculating an offset transitionvalue. For example, if half the students in bin 1 (value =1) remained in that bin for the new skill, while half transi-tioned to bin 2 (value = 0.75), an offset value of -0.125 wouldbe applied to all predictions of bin 1. A negative offset in-dicates that many students required more opportunities tocomplete than normal, while a positive offset indicates thereverse. The prediction is normalized to a value between 0and 1 to make full use of our quantized values
3. RESULTS AND CONCLUSIONSTable 2 contains the RMSE results of each prediction methoddivided by each bin of the new skill. The success of the ma-jority class predictions extends across higher aptitude stu-dents, while the TBP method provides the most accuratepredictions over students in the lower aptitude bins.
Table 2: Average RMSE of the skill level analysisdivided by bin.
Bin of New Skill Majority Class SBP TBP1 0.230 0.498 0.3582 0.120 0.356 0.1703 0.284 0.362 0.2054 0.307 0.526 0.2515 0.571 0.659 0.497
Table 3: Percent correctness at the skill level dividedby bin.
Bin of New Skill Majority Class SBP TBP1 0.709 0.479 0.5002 0.280 0.245 0.2683 0.102 0.251 0.2004 0 0.029 0.1295 0 0.041 0.333
Each method described in this work exhibited different strengths,including the simple majority class predictions. It is oftenfor the benefit of both teachers and students that a modelrepresent meaningful information beyond the provision ofpredictive accuracy. The SBP method, for example, whilenot excelling in any one category, illustrates tendencies ofaptitude mobility. Such methods may act as a means ofbetter understanding and developing course structure andskill relationships.
The fact that the proposed prediction methods fail to out-perform majority class overall suggests that using all per-formance history is not by itself a strong predictor of futureperformance, and is instead dependent to some degree onskill-based attributes. This work ignores prerequisite skillhierarchies available in many tutoring systems and MOOCs,using all previous performance history. Using prerequisitedata may lead to stronger predictions, or at the very leastprovide indications of strong and weak skill relationships.Knowing more information about such skill relationshipscould provide better indications of when performance his-tory is most useful as a predictor.
4. ACKNOWLEDGMENTSWe acknowledge funding for ASSISTments from the NSF(1316736, 1252297, 1109483, 1031398, 0742503, 1440753),the U.S. Dept. of Ed. GAANN (P200A120238), ONR’s”STEMGrand Challenges,”and IES (R305A120125, R305C100024).
5. REFERENCES[1] J. E. Beck and K. min Chang. Identifiability: A
fundamental problem of student modeling. In UserModeling 2007, pages 137–146. Springer BerlinHeidelberg, 2007.
[2] A. Botelho, H. Wan, and N. Heffernan. The predictionof student first response using prerequisite skills. InLearning at Scale, 2015.
[3] X. Xiong, S. Li, and J. E. Beck. Will you get it rightnext week: Predict delayed performance in enhanced itsmastery cycle. In FLAIRS Conference, 2013.
Proceedings of the 8th International Conference on Educational Data Mining 623

Discovering Concept Maps from Textual Sources
R.P. Jagadeesh Chandra Bose Om Deshmukh B. Ravindra
Xerox Research Center IndiaEtamin Block 3, 4th Floor, Wing-A, Prestige Tech Park II, Bangalore, India 560103.
{jagadeesh.prabhakara, om.deshmukh}@xerox.com
ABSTRACTConcept maps and knowledge maps, often used as learn-ing materials, enable users to recognize important conceptsand the relationships between them. For example, conceptmaps can be used to provide adaptive learning guidance forlearners such as path systems for curriculum sequencing toimprove the effectiveness of learning process. Generation ofconcept maps typically involve domain experts, which makesit costly. In this paper, we propose a framework for discov-ering concepts and their relationships (such as prerequisitesand relatedness) by analyzing content from textual sourcessuch as a textbook. We present a prototype implementationof the framework and show that meaningful relationshipscan be uncovered.
1. INTRODUCTIONIn any given learning setting, a hierarchy of concepts (setby experts) is provided and the learner is expected to fol-low through these concepts in the specified order, e.g., Tableof Contents (ToC), which indicates that concepts appearingin earlier chapters are (sometimes ’may be’ ) pre-requisitesfor the concepts discussed in the later chapters. Similarly,end-of-the-book index indicates prominent occurrences ofthe main concepts (and some relationships between them)discussed in the book. In both the cases, the relationshipis static, is designed by the experts and is restricted to thepre-populated list of concepts. As we move towards person-alized learning, such a knowledge-driven static elicitationis inadequate. e.g., if the immediate goal of the learner isto understand concepts in chapter L, s/he may only haveto go through a select ‘n’ sections of some chapters till L.Consider another example, if a learner has to know whichconcepts co-occur or which concepts predominantly occurbefore a particular concept C and are relevant to the con-cept C. This information is not easily available either fromthe ToC or from the “end-of-the-book index”.
Concept map is a knowledge visualization tool that repre-sents concepts and relationships between them as a graph.Nodes in the graph correspond to concepts and edges depictthe relationship between concepts. In recent years, conceptmaps are widely used for facilitating meaningful learning,
capturing and archiving expert knowledge, and organizingand navigating large volumes of information. In adaptivelearning, concept maps can be used to give learning guidanceby demonstrating how the learning status of a concept canpossibly be influenced by learning status of other concepts[3]. Construction of concept maps is a complex task andtypically requires manual effort of domain experts, which iscostly and time consuming.
In this paper, we propose a framework for automatic gener-ation of concept maps from textual sources such as a text-book and course webpages. We discover concepts by exploit-ing the structural information such as table of contents andfont information and establish how closely two concepts arerelated to each other where the relation is defined on howstrongly one concept is being referred to/discussed in an-other. The proposed approach is implemented and appliedon several subjects. Our initial results indicate that we areable to discover meaningful relationships.
The remainder of this paper is organized as follows. Relatedwork is presented in Section 2. We discuss our approach ofdiscovering concept maps in Section 3. Section 4 presentssome experimental results. Section 5 concludes with somedirections for future work.
2. RELATED WORKConcept map mining refers to the automatic or semi-automaticcreation of concept maps from documents [4]. Concept mapmining can be broadly divided into two stages: (i) con-cept identification and (ii) concept relationships association.Concept identification is typically done using dictionaries orstatistical means (e.g., frequent words). Relation betweenconcepts is typically defined over word-cooccurrences. Inour work, we do not use any dictionary of terms. Instead, werely on structural information such as bookmarks, table ofcontents, and font information manifested in data sources todiscover concepts. Furthemore, when discovering relation-ships, we not only look at co-occurence of concepts withina sentence but scope it to larger segments such as a sectionand chapter.
3. GENERATION OF CONCEPT MAPSConcept maps should provide support for modular nature ofthe subject matter and the interconnections between knowl-edge modules (concepts). Formally, a concept map can bedefined as a tuple < C,R,L > where C = {c1, c2, . . . , cn}is a set of concepts; L = {l1, l2, . . . , lk} is a set of labels.R = {r1, r2, . . . , rm} ⊆ C × C × L is a set of relationshipsamong concepts. Each relation rj = (cp, cq, ls) ∈ R, p �=q, 1 ≤ p, q ≤ n, 1 ≤ j ≤ m, 1 ≤ s ≤ k defines a relation-
Proceedings of the 8th International Conference on Educational Data Mining 624

Figure 1: Approach Overview
ship between concept cp and cq which is labeled ls. Option-ally each relation rj can also be associated with a weightwj ∈ �+. Figure 1 presents an overview of our approachand is comprised of five steps:
1. Identify Concepts: We exploit structural and font in-formation such as bookmarks, table of contents, and index(glossary) in e-textbooks, and headers and font informationin html pages for this step. Text processing such as tok-enizing, stemming, and stop word removal are then applied.Concepts are identified as either individual words or n-words(n > 1)2. Estimate Concept Significance: We estimate thesignificance of concepts automatically using different crite-ria: (i) frequency of occurrence (frequent concepts are moresignificant than infrequent ones) (ii) importance of a conceptw.r.t the examinations/evaluations and (iii) font related in-formation (larger font concepts are more significant thansmaller fonts). The three criteria mentioned above can begrouped together using weights.3. Identify Concept Relationships: Several types of re-lationships can be defined among concepts, e.g., superclass-subclass (one concept is more general than another), pre-requisite relation (a concept A is said to be a pre-requisitefor concept B), etc. The table of contents in a documentdirectly gives a (partial) hierarchical structure among con-cepts. Apart from the hierarchical relationship, conceptscan also be horizontally related e.g., relevant to and men-tioned by as discussed in [1]. We consider the mentioned byrelation, which is used to express the fact that two conceptsare related of the type A refers-to B, A discusses B, A men-tions B. Note that mentioned by is an asymmetric and notnecessarily transitive relation.4. Estimate Relationship Significance: Relationshipsignificance is estimated using term co-occurrence as a basis.For each concept, in the pages where it manifests, we alsoestimate which other concepts manifest in those pages andhow often do they manifest. The degree of relatedness is ob-tained by the frequency at which the concept is used, e.g.,if concept cj manifests fj times when describing concept ciand if fi is the frequency of occurrence of concept ci, thenthe weight of the edge between cj and ci can be defined asfj/fi. We also consider normalized weights.5. Visualize and Navigate Map: The concepts andtheir relationships can be visualized as a graph G = (V,E)where V , the set of vertices, correspond to the concepts andE, the set of edges, correspond to the relationship betweenconcepts. Nodes and edges can be annotated to provide richinformation and enable the navigation of these maps e.g.,size of the node can be used to depict the significance of aconcept, color of the node can be used to indicate its im-portance w.r.t student examinations/evaluation, thicknessof the node can be used to depict the relative knowledge ofthe student on the concept. Similarly, edges can be anno-tated to reveal different kinds of information e.g., thicknessof an edge can be used to signify the relatedness betweentwo concepts.
4. EXPERIMENTS AND DISCUSSIONWe have implemented the proposed framework in Java andPython and tested it on several examples. Visualization of
concept maps is implemented using d3js. In this section, wepresent the results of one such experiment of generating con-cept maps using the pdf textbook on databases [2]. Figure 2depicts a subgraph corresponding to the concepts related torelational algebra. We showed the uncovered concept maps
Figure 2: Concept map pertaining to the core concept rela-tional algebra
to a few experts in databases and they mostly agree to thediscovered relations. We have applied our approach to sev-eral subjects (e.g., operating systems, computer networksetc.) and found that in each of those, we are able to uncovermeaningful and important relations. We realize that there isa need for an objective evaluation method to automaticallyassess the goodness of discovered concept maps, e.g., usinggold standard.
5. CONCLUSIONSGeneration of concept maps is an important means of sup-porting deep understanding of a subject matter. In this pa-per, we presented an approach for identifying concepts andestablishing how closely two concepts are related to eachother. We believe that these concept maps enable users toquickly get knowledge about the centrality or importanceof each concept and its significance in understanding otherconcepts. As future work, we would like to further enrich thediscovered concept maps with additional information basedon the user of the application. For example, upon clicking ona node, teachers/faculty can be provided with informationsuch as the average/distribution score of students on thisconcept in various tests conducted; students can be providedwith links to lecture material, questions/solutions asked inprevious exams, etc.
6. REFERENCES[1] Darina Dicheva and Christo Dichev. Authoring
educational topic maps: can we make it easier? InICALT, pages 216–218, 2005.
[2] R. Elmasri and S.B. Navathe. Fundamentals of databasesystems. Pearson Education India, 6 edition, 2010.
[3] Shian-Shyong Tseng, Pei-Chi Sue, Jun-Ming Su,Jui-Feng Weng, and Wen-Nung Tsai. A new approachfor constructing the concept map. Computers &Education, 49(3):691–707, 2007.
[4] Jorge J. Villalon and Rafael A. Calvo. Concept mapmining: A definition and a framework for itsevaluation. WI-IAT ’08, pages 357–360, 2008.
Proceedings of the 8th International Conference on Educational Data Mining 625

Integrating Product and Process Data in an Online Automated Writing Evaluation System
Chaitanya Ramineni Educational Testing Service
Princeton NJ, 08541
01+609-734-5403 [email protected]
Tiago Calico University of Maryland
College Park MD, 20742
01+301-405-1000 [email protected]
Chen Li Educational Testing Service
Princeton NJ, 08541
01+609-734-5993 [email protected]
ABSTRACTWe explore how data generated by an online formative automated writing evaluation tool can help connect student writing product and processes, and thereby provide evidence for improvement in student writing. Data for 12,337 8th grade students were retrieved from the Criterion database and analyzed using statistical methods. The data primarily consisted of automated holistic scores on the student writing samples, and the number of attempts on a writing assignment. The data revealed trends of positive association between the number of revisions and the mean writing scores. User logs were sparse to support study of additional behaviors related to the writing processes of planning and editing, and their relation to the writing scores. Implications for enhancing automated scoring based feedback with learner analytics based information are discussed.
KeywordsAutomated scoring, learner analytics, formative writing, automated feedback, process and product
1. INTRODUCTION The Criterion® Online Writing Evaluation Service [3], is a web-based writing tool that allows easy collection of writing samples, efficient scoring, and immediate feedback through the e-rater®
automated essay scoring (AES) engine [2].
Criterion supports essay writing practice with a library of more than 400 essay assignments in multiple discourse modes (expository and persuasive) for students in elementary, middle, and high schools as well as in college. These prompts are used for classroom writing assignments and their scoring is supported by AES models. As a formative writing tool, Criterion has several features to facilitate writing processes and help learners improve their writing. These include planning templates, immediate feedback, multiple attempts to revise and edit, and resources such as a Writer’s Handbook, a spell checker, a thesaurus and sample essays at different score points. The holistic scoring and feedback in Criterion is supported by e-rater. The analyses of errors and feedback are available for linguistic features of grammar, usage, mechanics, style and organization and development. There are limited studies on the pedagogical effectiveness of Criterion and AES systems in general [1, 5], and examining relation of product and process data for assessing writing quality [4]. Our motivation for this study was to analyze product data (holistic scores) in relation to process data (for revising) to provide evidence for effectiveness of the tool and automated feedback and scoring for
improving writing. We report the observed trends for association between the two types of data, the cautions warranted in making strong claims based on these data, and the next steps.
2. METHODS Data were extracted for 8th grade students for one school year from the Criterion database. The data spanned 295 days, and included 12,337 students from 183 schools; a total of 95,261 attempts were made across 41,473 assignments on 2,447 prompts.
Mean holistic scores by the assignment and by the attempt were examined to relate the revising behavior with improvement in writing scores. The results from the assignment and the attempt level analyses can easily be preliminary indicators of the tool’s usefulness and effectiveness, and enhanced data logging capabilities of student actions in the system can provide richer information on writing processes.
3. RESULTS 3.1 Assignment Level Of the 12,337 students who submitted assignments in the system, a little over 4,000 students submitted only one assignment over the full school year. About half of the students (N=6,663) completed atotal of 2 to 6 assignments. A handful of students submitted as many as a total of 15 assignments. We identified groups of students who completed 2 to 5 unique assignments over the period of the full school year (the Ns were small for groups of students completing 6or more assignments and hence excluded). The assignments in Criterion can be scored on a 4-point or a 6-point scale. We analyzed the data for responses evaluated on a 6-point scale only, and hence after filtering out the responses scored on the 4-point scale, the remaining sample size was 5,235 students. It should be noted that within each assignment, a user can have multiple attempts.
Figures 1a and 1b present the trends for the mean writing scores across assignments for the different groups based on the first attempt and the last attempt on the assignment, respectively. We draw quite a few interesting observations from the two graphs. The mean writing scores on the last attempt are always higher than the mean writing scores on the first attempt across all the assignments. Further, the mean writing score on the last attempt of the first assignment (first data point in Figure 1b) is almost always higher than the mean writing score on the first attempt of the fifth assignment (last data point in Figure 1a), suggesting that multiple attempts on an assignment is associated with a higher mean writing score than the total number of assignments completed by a user in the system.
Proceedings of the 8th International Conference on Educational Data Mining 626

Figure 1a. Mean holistic score on the first attempt, per ordered assignment conditioned on total number of assignments
Figure 1b. Mean holistic score on the last attempt, per ordered assignment conditioned on total number of assignments
3.2 Attempt Level After filtering for responses evaluated using 6-point scale, a total of 34,196 completed attempts were recorded in the system over the full school year. 15,841 of these attempts were instances of one attempt only per assignment. A few students completed as many as 10 attempts on an assignment which is the maximum limit by default. We identified groups of 2 to 6 attempts per assignment that included 16,846 instances (the Ns were small for groups of 7 or more attempts and hence excluded). Figure 2 presents the trends of mean writing scores across attempts for the different groups. The uniform trend of increase in the mean writing scores across the attempts for all the groups once again suggests that the revising process is associated with gains on the writing scores.
4. LIMITATIONS The data on which trends have been reported were derived from a non-experimental setting. Large groups of students completed only one assignment or submitted only one attempt. Students who did engage in multiple assignments and/or multiple attempts hint at self-selection. The data are unbalanced and highly non-normal, and hence do not support rigorous statistical analyses but rather only lend themselves to exploration for trends.
Server log files were sparse for digital traces of student actions to support nuanced analyses of the corresponding writing processes. Information on students such as background variables is
Figure 2. Mean holistic score, per ordered attempt by total number of attempts
not available in the system. We analyzed data for only one grade level, but it would be of interest to examine if and how the trends based on product data as well as students’ usage of the system vary across the different grade levels. Similar analyses of linguistic feature values or error analyses on the product can provide further insight into the process of improvement in student writing.
5. CONCLUSION Data currently available from Criterion are primarily on the work product; limited data are available for writing processes based on user actions. The additional data from our ongoing work on extension of Criterion to capture extended learner usage data will support further analysis of associations between the writing product and the processes, and their relation to change in student writing ability over time. This work has implications for extending application of automated scoring systems in formative contexts with the potential to provide richer feedback on product as well as processes, and enhancing the validity argument for automated scores as supported by response process data.
6. REFERENCES [1] Attali, Y. 2004. Exploring the feedback and revision features
of Criterion. Paper presented at the National Council on Measurement in Education, San Diego, CA.
[2] Attali, Y. & Burstein, J.C. 2006. Automated essay scoring with e-rater v.2. Journal of Technology, Learning, and Assessment, 4(3), (2006), 1–31.
[3] Burstein, J.C., Chodorow, M, & Leacock, C. 2004.Automated essay evaluation: the Criterion online writing service. AI Magazine 25(3), (2004), 27–36.
[4] Deane, P. 2014. Using writing product and process features to assess writing quality and explore how those features relate to other literacy tasks. ETS Research Report No. 14-03. Princeton, NJ: ETS.
[5] Foltz, P., Rosentsein, M., Dronen, N., & Dooley, S. 2014. Automated feedback in a large-scale implementation of a formative writing system: Implications for improving student writing. Paper presented at the annual meeting of the American Educational Research Association, Philadelphia, PA.
4
4.25
4.5
4.75
5
1 2 3 4 5
Mea
n Sc
ore
Assignment
2 (n=2080)
3 (n=1348)
4 (n=970)
5 (n=837)
4
4.25
4.5
4.75
5
1 2 3 4 5
Mea
n Sc
ore
Assignment
2 (n=2080)
3 (n=1348)
4 (n=970)
5 (n=837)
4
4.25
4.5
4.75
5
1 2 3 4 5 6
Mea
n Sc
ore
Attempt
2 (n=7133)
3 (n=4311)
4 (n=2997)
5 (n=1447)
6 (n=958)
Proceedings of the 8th International Conference on Educational Data Mining 627

Application of Sentiment and Topic Analysis to TeacherEvaluation Policy in the U.S.
Antonio Moretti∗
Educator Learning &EffectivenessPearson
Kathy McKnightEducator Learning &
EffectivenessPearson
Ansaf Salleb-AouissiCenter for Computational
Learning SystemsColumbia University
ABSTRACTWe examine the potential value of Internet text to under-stand education policy related to teacher evaluation. Wediscuss the use of sentiment analysis and topic modeling us-ing articles from the New York Times and Time Magazine,to explore media portrayal of these policies. Findings indi-cate that sentiment analysis and topic modeling are promis-ing methods for analyzing Internet data in ways that caninform policy decision-making, but there are limitations toaccount for when interpreting patterns over time.
KeywordsTeacher evaluation, topic modeling, sentiment analysis
1. MOTIVATIONIn the United States and abroad, teacher evaluation systemsare increasingly becoming a common component of schoolreform efforts. Because teacher effectiveness is central toimproving student learning, education policy in the U.S. hastargeted teacher evaluation systems, with the rationale thatevaluating teachers will lead to improved effectiveness. Theresult is an often contentious debate among researchers, ed-ucators and policy-makers about the utility of these systemsin improving teacher effectiveness. Issues include which per-formance measures to use, how to collect and combine thedata, and how it will be used with teachers.
A significant arena for debate about education policy, in-cluding teacher evaluations, occurs via the Internet. As the2013 report “Social Media and Public Policy” notes [Leavy,2013], use of data produced by Internet users may be usefulin understanding policy issues and social problems, and per-haps ultimately, can provide insight to enable governmentsto develop more informed and better policy. The data maylead to better understanding of policy impact, and could
∗Contact author. [email protected]
potentially inform the different organizations that deliverpublic services, such as public education systems.
Given the potential value of Internet data to inform policy,our aim for this study is to conduct a preliminary analysisof publicly available Internet data from media outlets re-porting on U.S. education policy, to evaluate what mightbe learned from such data that could inform policy-makingregarding teacher evaluation. Therefore, we narrowed thefocus to two popular media sources that cover national aswell as local education policy – the NY Times, and TimeMagazine–to analyze public sentiment and topics of concernregarding education policy focused on teacher evaluation.Given the increased emphasis on teacher evaluations overthe past decade, we gathered data from 2004 - 2014. Weused two approaches for analyzing data from the online me-dia articles: a topic modeling approach [Blei, 2012] and sen-timent analysis [Liu, 2010, pan, ]. The research questionswe addressed included:
1. What trends, if any, exist in public sentiment regardingteacher evaluation policy over the past decade?
2. What are the recurring topics most associated withmedia portrayal of teacher evaluation policies?
2. DATA COLLECTION AND ANALYSISWe used the NY Times API and Time Magazine searchquery using “teacher evaluation” as the search term. Be-cause there are no tools for collecting the full NY Timesand Time Magazine articles,we scraped the websites afterretrieving the relevant URLs. We retrieved a total of 348articles on “teacher evaluation” from the NY Times duringthe period 2004 to 2014, and 292 articles from Time Maga-zine during the same period. We examined the articles fortheir relevance and removed those for which the focus wasnot primarily on teacher evaluation. The resulting datasetincluded 171 NY Times articles from 2009 to 2014, and 45Time Magazine Articles from 2010 to 2014.
For the current study, we used the “topicmodels” package inR [Grun and Hornik, 2011]. We compared two variants oftopic modeling: latent dirichlet allocation (LDA) and Corre-lated Topic Models (CTM). Both approaches are based onBlei [Blei et al., 2003, Blei and Lafferty, 2007]. To deter-mine the number of topics to specify, we used the perplex-ity score.For our analyses, we specified a ten topic model,i.e. we set k = 10 to interpret results. In addition to theentropy measure, we used word clouds to display and make
Proceedings of the 8th International Conference on Educational Data Mining 628

(a) Topic 1(b) Topic 2
Figure 1: Word clouds for generated from NY Times articles.
sense of the topics generated from topic models. Figure illus-trates word clouds for topic 1 and 2 generated from the NewYork Times articles. The topics that appeared to dominatethe NY Times reporting included focus on federal require-ments for teacher evaluation systems (e.g., reliance on stu-dent test data and relatedly, value-added models, for evalu-ating teachers); the impact of those requirements on teachersat both a federal and local (NYC) level, e.g., accountability,merit pay, lay offs and budgets; and the reaction of teacherunions to federal and local legislation (e.g., Chicago’s teach-ers strike). In Times Magazine, where coverage of teacherevaluation policy was often combined with coverage of otherfederal education policies, the focus appeared to be on stu-dent achievement testing; changing education policies by theObama Administration and in Washington DC, led by DC’sformer Chancellor of Education Michelle Rhee; and policyproposals during the 2012 presidential campaign. Teacherunion reactions to teacher evaluation policy were also of fo-cus, including the Chicago teachers strike.
We use the Natural Language Toolkit (NLTK) [Bird, 2006],a leading python platform to harvest textual data. The sen-timent analysis tool in NLTK uses naive Bayes classifierstrained on both twitter sentiment as well as movie reviews.In Figure 2, a time series of the sentiment polarity of boththe New York Times (left) and Times Magazine (right) ar-ticles is presented for 2009 - 2014. We used a simple movingaverage to plot the sentiment over time. In these graphs, weobserve a similar trend in both the NY Times and TimesMagazine articles. In both, we see somewhat similar peaksand troughs, as well as a similar trend of decreasing positivesentiment from 2010 to 2014.
3. DISCUSSION & FUTURE WORKA number of federal and local (to NY) events took placeover that period of time, that could be related to the senti-ment trends. Nationally, the Obama Administration’s RaceTo the Top (RTTT) legislation was initiated in July 2009,which among other policies, required states to develop andimplement teacher evaluation systems that included studentachievement as a ”significant” component of a teacher’s ef-fectiveness rating. In 2010, RTTT was rolled out and thestates awarded funding were announced. The state of NewYork was awarded 700M dollars in August, 2010. A result ofthis legislation was a contentious battle between lawmakersand the teachers union over the details of the evaluation sys-tem, among other policies. In September 2012 in Chicago,teachers took to the streets and went on strike against arange of education policies, including the teacher evaluationsystem that was to be put in place. NYC and the teachersunion settled on an evaluation system in March, 2013.
Apr 02 2009 Jul 02 2010 Jul 05 2011 Sep 12 2012 Oct 26 2013
0.04
0.06
0.08
0.10
0.12
0.14
0.16
Article Sentiment
Date
Pol
arity
(a) Topic 1
Jan 2010 Jan 2011 Oct 2011 Jul 2012 Jun 2013 Apr 2014
0.09
0.10
0.11
0.12
0.13
Article Sentiment
Date
Pola
rity
(b) Topic 2
Figure 2: Article Sentiment over Time
In the case study for this paper, issues regarding the use ofstudent test scores for evaluating teachers; the response ofteacher unions to federal and local teacher evaluation systemrequirements; and the budgets for implementing these sys-tems were just some of the more prominent issues reflectedin the results. Our ultimate goal is to advance the under-standing of the impact of new policies on the well-beingof public schools and teachers. While the methodology ispromising, it needs to be harnessed through a useful visu-alization interface to facilitate the exploration and analysisof the topics produced to make it more useful to leveragein decision making. We acknowledge that there are limi-tations and potential problems with these approaches. Aknown challenge is choosing the granularity level of the top-ics that is related to the number of topics k provided as aparameter. A second challenge is in the interpretation andlabeling of the derived topics that require a manual humanintervention. In some cases, what is rated as positive or neg-ative analytically might not reflect how human raters wouldcode those words. Moreover, in our example, although sen-timent appeared to decline in the negative direction, it stillremained on the positive end of the polarity continuum.
4. REFERENCES[pan, ]
[Bird, 2006] Bird, S. (2006). Nltk: the natural languagetoolkit. In Proceedings of the COLING/ACL onInteractive presentation sessions, pages 69–72.Association for Computational Linguistics.
[Blei, 2012] Blei, D. M. (2012). Probabilistic topic models.Commun. ACM, 55(4):77–84.
[Blei and Lafferty, 2007] Blei, D. M. and Lafferty, J. D.(2007). A correlated topic model of science. AAS,1(1):17–35.
[Blei et al., 2003] Blei, D. M., Ng, A. Y., and Jordan, M. I.(2003). Latent dirichlet allocation. the Journal ofmachine Learning research, 3:993–1022.
[Grun and Hornik, 2011] Grun, B. and Hornik, K. (2011).topicmodels: An r package for fitting topic models.Journal of Statistical Software, 40(13):1–30.
[Leavy, 2013] Leavy, J. (2013). Social media and publicpolicy: What is the evidence? Technical report, Alliancefor Useful Evidence.
[Liu, 2010] Liu, B. (2010). Sentiment analysis andsubjectivity. In Handbook of Natural LanguageProcessing, Second Edition. Taylor and Francis Group,Boca.
Proceedings of the 8th International Conference on Educational Data Mining 629

Defining Mastery: Knowledge Tracing Versus N- Consecutive Correct Responses
Kim Kelly Worcester Polytechnic Institute
100 Institute Road Worcester, MA 01609
508-461-6386 [email protected]
Yan Wang & Tamisha Thompson
Worcester Polytechnic Institute 100 Institute Road
Worcester, MA 01609 [email protected]
Neil Heffernan Worcester Polytechnic Institute
100 Institute Road Worcester, MA 01609
508-831-5569 [email protected]
ABSTRACT Knowledge tracing (KT) is well known for its ability to predict student knowledge. However, some intelligent tutoring systems use a threshold of consecutive correct responses (N-CCR) to determine student mastery, and therefore individualize the amount of practice provided to students. The present work uses a data set provided by ASSISTments, an intelligent tutoring system, to determine the accuracy of these methods in detecting mastery. Study I explores mastery as measured by next problem correctness. While KT appears to provide a more stringent threshold for detecting mastery, N-CCR is more accurate. An incremental efficiency analysis reveals that a threshold of 3 consecutive correct responses provides adequate practice, especially for students who reach the threshold without making an error. Study II uses a randomized- controlled trial to explore the efficacy of various N-CCR thresholds to detect mastery, as defined by performance on a transfer question. Results indicate that higher thresholds of N-CCR lead to more accurate predictions of performance on a transfer question than lower thresholds of N-CCR or KT.
Keywords
Intelligent Tutoring System, Knowledge Tracing, Mastery Learning.
1. INTRODUCTION Intelligent tutoring systems are known for their ability to personalize the learning experience for students. One way that learning is individualized is by providing just the right amount of practice to meet the student’s needs. Determining the correct amount of practice is critical because over-practice might bore students and take an un-necessarily long time, while under-practice might not provide enough opportunities for a student to learn a skill. To determine the correct amount of practice, systems must identify the point in time when students have learned the skill, otherwise referred to as reaching mastery. Defining mastery may vary between systems. One measure of mastery includes next problem correctness, another is performance on a transfer question, and yet another is performance on a delayed retention test. Some systems rely on knowledge tracing (KT) [1-2], others use a predetermined number of consecutive correct responses (N-CCR) [3, 4, 9}. In each case, mastery status is used by the system to determine the end of an assignment.
2. METHODOLOGY This research is comprised of two studies, the first was a data analysis of large data sets provided by ASSISTments, and the second was a randomized controlled trial. Study I of the present study leverages data generated by an intelligent tutoring system to explore the ability of N-CCR and KT to detect mastery. Mastery will be measured by next problem correctness. Additionally, an incremental efficiency analysis will also be presented that sheds light on the number of additional questions students must answer to reach a given threshold.
Next problem correctness is arguably a weak measure of mastery as slips are possible. A measure of more robust learning is performance on a transfer task [10]. Therefore, in Study II, a randomized-controlled trial was conducted to compare the accuracy of different potential thresholds of number of consecutive correct responses. This data was then used to further explore KT predictions, compared to N-CCR in an attempt to determine which method should be used in intelligent tutoring systems who rely on mastery to determine amount of practice.
3. RESULTS 3.1 NCCR When mastery is defined by next problem correctness, results indicate that 3-CCR is an adequate threshold for accurately detecting mastery. Table 1 shows that 80% of students who answer three questions correctly, go on to answer the fourth and fifth correctly as well.
Table 1: Percentage of students with each response combination of the fourth and fifth question following 3-CCR.
3 Consecutive No Errors Fourth Question
Fifth Question
Incorrect Correct
Incorrect 1.8% (5) 9.8% (24)
Correct 8.4% (28) 80.0% (228)
When mastery is defined by performance on a transfer question, results indicate that 5-CCR (Table 3) more accurately detects mastery than 3-CCR (Table 2). Accuracy is defined by the percentage of students who met the threshold and were successful on the transfer questions combined with the percentage of students who failed to meet the threshold and answered the transfer questions incorrectly. Identifying students who met the threshold yet answered the transfer incorrectly are considered false positives and students who answered the transfer question
Proceedings of the 8th International Conference on Educational Data Mining 630

correctly yet failed to meet the threshold are considered false negatives.
Table 2: Student performance on transfer question based on 3-CCR. Percent(Number) of students
Threshold Met Threshold Not Met
Transfer Correct 46%(17) 0%
Transfer Incorrect
43%(16) 11%(4)
Table 3: Student performance on transfer question based on 5-CCR. Percent(Number) of students
Threshold Met Threshold Not Met
Transfer Correct 43%(16) 8%(3)
Transfer Incorrect
19%(7) 30%(11)
3.2 KT When mastery is defined by next problem correctness, results indicate that KT is comparable to 3-CCR in accurately detecting mastery for students who do not make an error (Table 4).
Table 4: Accuracy of KT detecting mastery for students who answered three consecutive questions correctly without an error. (n=287) Threshold Met
(>95%) Threshold Not Met (<95%)
Next Question Correct 80.5% (231) 9.4% (27)
Next Question Incorrect 8.4% (24) 1.7% (5)
When mastery is defined by performance on a transfer question, results indicate that KT is comparable to 3-CCR, but less accurate than 5-CCR (Table 5).
Table 5: . Student performance on the transfer question based on KT’s 95% threshold.
Percent(Number) of students*
Threshold Met Threshold Not Met
Transfer Correct 42%(31) 7%(5)
Transfer Incorrect
39%(29) 12%(9)
3.3 Incremental Efficiency Analysis Using the data generated from the students reaching the 5-CCR threshold, we determined how many additional questions were required to reach each incremental threshold. This provides insight into the tradeoff between potential increased mastery detection and time consumption, as measured by number of questions completed. 3-CCR is a sufficient threshold, as over 90%
students go on to reach the higher threshold. Of the students who reached the final 5-CCR threshold, 90% of them reached it without an error. Those who made at least one error, tended to reach the threshold with N attempts following the error. This suggests that the error was a slip.
4. DISCUSSION Accurately predicting or detecting mastery status is critical to intelligent tutoring systems, because the amount of practice provided to students depends on this. An overly cautious prediction will lead to unnecessary practice (false negatives), while less strict criteria will not provide enough (false positives). N-CCR, specifically 3-CCR, is a simple, yet effective way to determine mastery within an ITS. This threshold has been found to predict next problem correctness with at least 80% accuracy. However, when predicting performance on a transfer task, a higher threshold (5-CCR) is more effective. Both thresholds of N-CCR were more accurate than the more complicated method, knowledge tracing, when determining mastery.
5. ACKNOWLEDGMENTS We thank multiple NSF grant (ACI-1440753, DRL-1252297,DRL-1109483,DRL-1316736 & DRL-1031398) , the US Dept of Ed's (IES R305A120125 & R305C100024 and GAANN), the ONR, and the Gates Foundation.
6. REFERENCES [1] Corbett, A., Anderson, J. (1995). Knowledge Tracing: Modeling the Acquisition of Procedural Knowledge. User Modeling and User-Adapted Interaction, 4, 253-278. [2] Fanscali, Stephen E., Nixon, Tristan, & Ritter, Stephen (2013). Optimal and worst-case performance of mastery learning assessment with bayesian knowledge tracing. Proceedings of the 6th International Conference on Educational Data Mining. D’Mello, S., Calvo, R., Olney, A. (Eds). 35-42. [3] Faus, M. (2014). Improving Khan Academy’s student knowledge model for better predictions. MattFaus.com [web log]. Retrieved October, 2014, from http://mattfaus.com/2014/05/improving-khan-academys-student-knowledge-model-for-better-predictions/ [4] Feng, M., Heffernan, N. T., Koedinger, K. R.: Addressing the assessment challenge in an Intelligent Tutoring System that tutors as it assesses. User Modeling and User-Adapted Interaction, 19, 243-266 (2009) [9] Hu, D. (2011). How Khan Academy is using Machine Learning to Assess Student Mastery. David-Hu.com [web log]. Retrieved October, 2014, from http://david-hu.com/2011/11/02/how-khan-academy-is-using-machine-learning-to-assess-student-mastery.html
Proceedings of the 8th International Conference on Educational Data Mining 631

A Toolbox for Adaptive Sequence Dissimilarity Measuresfor Intelligent Tutoring Systems
Benjamin PaassenCITEC Center of Excellence
Bielefeld, [email protected]
Bassam MokbelCITEC Center of Excellence
Bielefeld, [email protected]
Barbara HammerCITEC Center of Excellence
Bielefeld, [email protected]
ABSTRACT
We present the TCS Alignment Toolbox, which offers a flexi-ble framework to calculate and visualize (dis)similarities be-tween sequences in the context of educational data miningand intelligent tutoring systems. The toolbox offers a varietyof alignment algorithms, allows for complex input sequencescomprised of multi-dimensional elements, and is adjustablevia rich parameterization options, including mechanisms foran automatic adaptation based on given data. Our demoshows an example in which the alignment measure is adaptedto distinguish students’ Java programs w.r.t. different solu-tion strategies, via a machine learning technique.
1. INTRODUCTION
Systems for computer-aided education and educational data
mining (EDM) often process complex structured informa-tion, such as learner solutions or student behavior patternsfor a given learning task. In order to abstract from rawinput information, the given data is frequently representedin form of sequences, such as (multi-dimensional) symbolicstrings, or sequences of numeric vectors. These sequencesmay represent single solutions, as in some intelligent tutor-
ing systems (ITSs) [2, 6]; or may encode time-dependentdata, like learner development or activity paths [1, 7].
Once a meaningful sequence representation is established,there are many possibilities to process sequential data withexisting machine learning or data mining tools. A crucialcomponent for this purpose is a (dis)similarity measure forpairs of sequences, which enables operations like finding clos-est matches in a given data set, clustering all instances, orvisualizing their neighborhood structure [5]. One particu-larly flexible approach to determine the (dis)similarity ofsequences is sequence alignment [3].
For applications in the context of EDM and ITSs, sequencealignment offers two key features: On the one hand, thestructural characteristics of sequences are taken into ac-count, while calculation remains efficient, even with com-plex parameterization options. On the other hand, align-ment provides an intuitive matching scheme for a given se-quence pair, since both sequences are extended, so that sim-ilar parts are aligned. However, we believe the full potentialof sequence alignment is rarely utilized in EDM or ITSs.
Acknowledgments: Funding by the DFG under grantnumbers HA 2719/6-1 and HA 2719/6-2 and the CITECcenter of excellence is gratefully acknowledged.
2. ALIGNMENT TOOLBOX
We present the TCS Alignment Toolbox1, an open-source,Matlab-compatible Java library, which provides a flexibleframework for sequence alignments, as follows:
Multi-dimensional input sequences are possible, such thatevery element of the sequence can contain multiple values ofdifferent types (namely discrete symbols, vectors or strings).
A variety of alignment variants is implemented, coveringcommon cases, such as edit distance, dynamic time warping
and affine sequence alignment [3].
The parameterization of the alignment measure is definedby costs of operations (replacement, insertion, and deletion)between sequence elements, which can be adjusted by theuser, or left at reasonable defaults. Users can even plug incustom functions to yield meaningful problem-specific costs.
A visualization feature displays the aligned sequences in acomprehensive HTML view, as well as the dissimilarity ma-trix for an entire set of input sequences.
An approximate differential of the alignment functionsw.r.t.its parameters is provided, which enables users to automat-ically tune the rich parameter set with gradient-based ma-chine learning methods, e.g. to facilitate a classification [4].
In this demo, we present an example for a set of real studentsolutions for a Java programming task: After programs aretransformed to sequences, the parameters of an alignmentalgorithm are automatically adapted to distinguish betweendifferent underlying solution strategies, and the resultingalignments are visualized. Thus, the adapted measure im-proves the classification accuracy for the given data.
3. REFERENCES[1] S. Bryfczynski, R. P. Pargas, M. M. Cooper, M. Klymkowsky,
and B. C. Dean. Teaching data structures with besocratic. InITiCSE 2013, pages 105–110. ACM, 2013.
[2] S. Gross, B. Mokbel, B. Hammer, and N. Pinkwart. How toselect an example? A comparison of selection strategies inexample-based learning. In ITS 2014, pages 340–347, 2014.
[3] D. Gusfield. Algorithms on Strings, Trees, and Sequences.Cambridge University Press, New York, NY, USA, 1997.
[4] B. Mokbel, B. Paassen, F.-M. Schleif, and B. Hammer. Metriclearning for sequences in relational LVQ. Neurocomputing, 2015.(accepted/in press).
[5] E. Pekalska and B. Duin. The Dissimilarity Representation for
Pattern Recognition. World Scientific, 2005.
[6] E. R. Sykes and F. Franek. A prototype for an intelligenttutoring system for students learning to program in Java (TM).IASTED 2003, pages 78–83, 2003.
[7] N. van Labeke, G. D. Magoulas, and A. Poulovassilis. Searchingfor ”people like me” in a lifelong learning system. In EC-TEL
2009, volume 5794 of LNCS, pages 106–111. Springer, 2009.
1Available at http://opensource.cit-ec.de/projects/tcs
Proceedings of the 8th International Conference on Educational Data Mining 632

Carnegie Learning’s Adaptive Learning Products Steven Ritter Ryan Carlson
Michael Sandbothe Stephen E. Fancsali Carnegie Learning, Inc.
437 Grant Street, 20th Floor Pittsburgh, PA 15219 USA
1.888.851.7094 {x122, x219} {sritter, rcarlson, msandbothe,
sfancsali}@ carnegielearning.com
ABSTRACT Carnegie Learning, developers of the widely deployed Cognitive Tutor, has been working on several new adaptive learning products. In addition to demoing the Cognitive Tutor, an educationally effective intelligent tutoring system for mathematics that has been the subject of a great deal of educational and educational data mining research, we demo two iPad apps, an equation solving app that recognizes hand writing and a game for developing math fluency using fraction comparison tasks. A wide variety of datasets over the years have been analyzed from the Cognitive Tutor, and in recent years several new features have been introduced that may be important to researchers. This demonstration will introduce those unfamiliar with Cognitive Tutor to the system and serve as a refresher for those unaware of recent developments. It will also introduce our new iPad apps to researchers.
Keywords
Cognitive Tutor, intelligent tutoring systems, real-world implementation, mathematics education, educational games, iPad, mathematics fluency, fractions, decimals, multiple representations, equation solving, cognitive modeling
1. COGNITIVE TUTOR Carnegie Learning’s Cognitive Tutor (CT) [7] is one of the most widely used intelligent tutoring systems (ITSs) in the world, with hundreds of thousands of users in middle schools, high schools, and universities throughout the United States and abroad. CT has been demonstrated effective in one of the largest randomized trials of its kind involving educational software, providing substantive and significant improvement in learning gains, compared to a control group using traditional textbooks, in the second year of implementation for a large cohort of high school students from diverse regions of the United States [6].
A variety of datasets providing information about learner interactions with the CT have been made available by Carnegie
Learning via the Pittsburgh Science of Learning Center LearnLab’s DataShop repository [5]; the learning sciences community and others have used these and other datasets in a correspondingly wide variety of educational and educational data mining (EDM) research projects, including many throughout the history of the International Conference on EDM. Some datasets used are from relatively older versions of the CT software. Even relatively old data can enable discovery and insight into issues likes improving cognitive models and improving the predictive accuracy of models of student behavior, but as can be expected, CT, like any other piece of widely deployed software, evolves over time. Elements of this evolution may impact the types of substantive conclusions that can be drawn from CT data or contribute to creative new modeling approaches and target educational phenomena. In this demonstration, we will provide an overview of the basic interface of the CT and its approach to mathematics education as well as highlighting several newer features that have been deployed in the last few years. We will also, as appropriate, highlight several nuances and issues that arise when CT and Carnegie Learning’s middle school math product based on CT, called MATHia, are deployed in real-world classrooms. Some of these nuances and issues may have important implications for how EDM analyses are conducted using CT data.
Our demo will provide a general overview with CT and focus on the following features of CT and MATHia: lesson content and manipulatives, step-by-step examples, review mode, promotion & placement changes, interest area & name customization (MATHia), and math “Fluency Challenge” Games (MATHia).
2. AN IPAD RACING GAME TO ENHANCE MATH FLUENCY Developers at Carnegie Learning are also developing an iPad car racing game (Figure 1) to enhance math fluency for tasks like comparing fractions. The game integrates with the Hyper-Personalized Intelligent Tutoring (HPIT) system [4], a distributed web service plugin architecture that enables “on-the-fly” personalization based on (non-)cognitive factors. Gameplay is predicated on learners rotating the iPad to direct a car to the right, left, and in between “flags” that display values of fractions (or decimals, etc.) based on whether a value displayed on the car is greater than or less than values displayed on flags, creating a sort of number line on the game’s “road.”
Time pressure, introduced via a countdown clock, serves gameplay and cognitive functions. Time pressure on tasks like fraction comparison will encourage learners to develop dynamic
Proceedings of the 8th International Conference on Educational Data Mining 633

strategies to carry out such tasks (e.g., imagining slices of a pie vs. finding common denominators). Learners’ successful adoption of diverse strategies is a marker of math fluency that will decrease working memory load on such tasks. We posit that fluent math learners are more likely to succeed in more advanced math.
Game content and behavior are configurable to allow education researchers, without programming, to rapidly prototype and build a range of experiments. Researchers can, for example, specify number sequences encountered as well as “level” structure that groups similar content together. We support in-game feedback (e.g., text displayed after questions, pausing after incorrect actions for review) via an XML run-time scripting engine.
Figure 1. Sample problem: The player’s value is 1/9, and since
1/9 < 1/7 the player moves to the left lane before passing the flags.
A conceivable experiment uses multiple graphical representations to develop fluency [1]. Curricula can begin with a level containing common numerator fractions, then common denominator fractions, and then mixed fractions. Scripting provides for dynamic annotations of each fraction with pie slice or number line images above flags to help players visualize the comparison (e.g., loading web images and reacting to each level’s content). Help can be offered only when a student is struggling (e.g., making at least one error), and HPIT can drive A/B tests, distributing content/scripts to control and experimental groups.
3. AN IPAD APP FOR EQUATION SOLVING Researchers at Carnegie Learning are also working on an iPad app to support math equation solving practice. The app combines technology from CT with an interface that recognizes human handwriting (Figure 2). Following the lead of CT and building on earlier work on handwriting-based tutors [2], the app provides context sensitive feedback and hints while also providing the capability to “trace” student knowledge using, like CT, the Bayesian Knowledge Tracing (BKT) [3]. Integrating the app with HPIT provides the ability to adapt to cognitive factors (e.g., BKT) and non-cognitive factors (e.g., grit, self-efficacy, etc.).
The app will advance student learning about equation solving and our understanding of that learning in at least two ways. First, handwriting recognition will provide for an experience that is more akin to a traditional “pencil and paper” approach to equation solving practice than the approach provided by CT in which actions like “combining like terms” to manipulate sides of an equation are chosen from a drop-down menu. Second, logging such equation solving will provide rich data to better understand the learning of equation solving in this more natural setting. Moving away from the menu-based CT approach introduces challenges. Handwritten equation solving allows for a variety of math errors that simply are not allowed by CT. Further, new
knowledge components (or skills) must be introduced to the cognitive/skill model for this app; skills, for example, related to the understanding of equality (e.g., that the equation symbol must persist from line to line as the student works toward an equation solution) should be tracked. Such skills are not tracked in CT’s menu-based equation solving because the equation symbol persists from step-to-step in CT. Comparing skill models and learner performance across platforms is a key area for future research; translation of skill models across platforms is an important issue as technology permeates teaching and instruction.
Figure 2. A user solves the equation 3x+4 = 5, writing the final
step of the equation as x = 1/3.
4. ACKNOWLEDGMENTS App development is funded by the U.S. Department of Defense Advanced Distributed Learning Initiative Contract #W911QY-13-C-0026.
5. REFERENCES [1] Ainsworth, S. 2006. DeFT: A conceptual framework for
considering learning with multiple representations. Learn. Instr. 16 (Jun. 2006), 183-198.
[2] Anthony, L., Yang, J., Koedinger, K.R. 2014. A paradigm for handwriting-based intelligent tutors. Int. J. Human-Computer Studies, 70, 866–887.
[3] Corbett, A.T., Anderson, J.R. 1995. Knowledge tracing: Modeling the acquisition of procedural knowledge. User Model. User-Adap. 4, 253-278.
[4] Fancsali, S.E., Ritter, S., Stamper, J., Nixon, T. 2013. Toward “hyper-personalized” Cognitive Tutors: Non-cognitive personalization in the Generalized Intelligent Framework for Tutoring. In AIED 2013 Workshops Proceedings Volume 7 (Memphis, TN, July, 2013). Sun SITE Central Europe (CEUR), 71-79.
[5] Koedinger, K.R., Baker, R.S.J.d., Cunningham, K., Skogsholm, A., Leber, B., Stamper, J. 2011. A data repository for the EDM community: the PSLC DataShop. In Handbook of Educational Data Mining, C. Romero, S. Ventura, M. Pechenizkiy, & R.S.J.d. Baker, Eds. CRC, Boca Raton, FL.
[6] Pane, J., Griffin, B. A., McCaffrey, D. F., Karam, R. 2014. Effectiveness of Cognitive Tutor Algebra I at scale. Educ. Eval. Policy. An. 36 (2014), 127-144.
[7] Ritter, S., Anderson, J.R., Koedinger, K.R., Corbett, A.T. 2007. Cognitive Tutor: applied research in mathematics education. Psychon. B. Rev. 14 (2007), 249-255.
Proceedings of the 8th International Conference on Educational Data Mining 634

SAP: Student Attrition Predictor
Devendra Singh ChaplotSamsung Electronics Co., Ltd.
Seoul, South [email protected]
Eunhee RhimSamsung Electronics Co., Ltd.
Seoul, South [email protected]
Jihie KimSamsung Electronics Co., Ltd.
Seoul, South [email protected]
ABSTRACTIncreasing rates of student drop-outs with increase in pop-ularity of Massive Open Online Courses (MOOCs) makespredicting student attrition an important problem to solve.Recently, we developed an algorithm based on artificial neu-ral network for predicting student attrition in MOOCs usingstudent sentiments. In this paper, we present a web-basedtool based on our algorithm which can be used by educa-tors to predict and reduce attrition during a course and byresearchers to design and train their own system to predictstudent attrition.
KeywordsStudent Attrition, MOOC, Sentiment Analysis, Neural Net-work, Educational Data Mining, Student Drop-out
1. OVERVIEWGrowing popularity of MOOCs is attributed to their acces-sibility, scalability and flexibility. With scalability, MOOCsalso provide huge amounts of data of student activity whichcan be used to predict their behavior. We have developed analgorithm to predict student attrition [4] which uses click-stream log and forum posts from MOOCs to extract featuressuch as number of page views, clicks, study sessions, etc. assuggested by previous studies [1, 3, 5, 6]. A unique featureused by our algorithm is student sentiments in forum posts,which is calculated using lexicon-based Sentiment Analysiswith SentiWordNet 3.0 [2] as the knowledge resource. Thevalues of all these features for current week are passed asinputs into an artificial neural network, whose output in-dicates whether student is going to drop out in the follow-ing week. Using data from Coursera course ’Introduction toPsychology’, we get 74.4% accuracy with false negative ratioof 0.136, leading to a Cohen’s Kappa value of 0.435.
2. STUDENT ATTRITION PREDICTORWe present a web tool having three interfaces for educatorsand researchers to predict and study student attrition.
2.1 Sentiment AnalysisSentiment Analysis of student’s forum posts is the uniquefeature which wasn’t used by previous algorithms and im-proves the Cohen’s Kappa value of our algorithm by about13%. Effectiveness of using sentiment analysis can be seenby the changes in results from neural network when studentsentiments are added as input. Our tool also provides optionto get the Sentiment score of any student’s forum post.
2.2 Pre-trained Neural NetworkUsers have the option to use our pre-trained neural networkto predict student drop-out. This allows our tool to be usedfreely by educators to predict student attrition. Since wepredict whether student is going to drop-out in the follow-ing week and not whether student is going to complete thecourse, our algorithm pin-points the exact week when stu-dent is predicted to drop-out and thus, educators can use ourtool during the course in order to take necessary student-specific actions to prevent or reduce attrition. Apart fromMOOCs, Student Attrition Predictor can also be used bytraditional classroom setting educators, using digital medi-ums for study and interaction in schools, which are becomingincreasingly popular in recent years.
2.3 Design new Neural NetworkOur tool also provides an interactive graphical interface forthe users to design their own unique neural network. Ascreenshot of design interface is shown in Figure 1. It showsan input panel, training and testing data panels, a neuralnetwork design canvas and a results panel. The process ofusing Design interface can be divided into 3 phases:-
• Design: Users can add their own nodes in the ‘Input’panel and select any number of hidden layer nodes.The canvas in the middle of Figure 1 shows the struc-ture of designed neural network.
• Train: Training data can be uploaded in ‘TrainingData’ panel and used to train the designed neural net-work. Options for selecting number of training iter-ations, classification boundary and learning heuristic(like back-propagation, resilient propagation, etc.) fortraining Neural Network will also be provided.
• Test: After training, individual input values can beentered in the input panel or test data can be uploadedin ‘Test Data’ panel to get results from trained neuralnetwork. ‘Results’ panel shows metrics such as Accu-racy, False Negative Rate and Cohen’s Kappa value.
Proceedings of the 8th International Conference on Educational Data Mining 635

Figure 1: Screenshot of Design Interface of Student Attrition Predictor
This interface is especially useful for researchers who candecide the input features and structure of their own neuralnetwork, train and test it by uploading their own data andoptimize the parameters and learning heuristic according totheir application. The designed and trained neural networkcan be saved and loaded into the tool at any point.
3. CONCLUSIONThere has been lot of research in recent years on predictingstudent attrition. In contrast to many studies trying to findreasons behind attrition, we focus on predicting and reduc-ing attrition. Student Attrition Predictor not only predictsstudent drop-out, but also identifies the precise week whenstudent is likely to drop-out in order to reduce attrition dur-ing the course. To the best of our knowledge, there is nodirect way for educators to benefit from years of research onpredicting student attrition. This tool acts as a medium foreducators to directly utilize our research in this field. Thetool also provides an easy graphical interface to researchersfor further experiments.
4. REFERENCES[1] B. Amnueypornsakul, S. Bhat, and
P. Chinprutthiwong. Predicting Attrition Along theWay: The UIUC Model. In Proceedings of the EMNLP2014 Workshop on Analysis of Large Scale Social
Interaction in MOOCs, pages 55–59, Doha, Qatar,October 2014.
[2] S. Baccianella, A. Esuli, and F. Sebastiani.Sentiwordnet 3.0: An enhanced lexical resource forsentiment analysis and opinion mining. In Proceedingsof the Seventh International Conference on LanguageResources and Evaluation (LREC’10), Valletta, Malta,2010.
[3] G. Balakrishnan. Predicting student retention inmassive open online courses using hidden markovmodels. Master’s thesis, EECS Department, Universityof California, Berkeley, May 2013.
[4] D. S. Chaplot, E. Rhim, and J. Kim. Predictingstudent attrition in moocs using sentiment analysis andneural networks. In Proceedings of AIED 2015 FourthWorkshop on Intelligent Support for Learning inGroups, Madrid, Spain, 2015.
[5] M. Kloft, F. Stiehler, Z. Zheng, and N. Pinkwart.Predicting MOOC Dropout over Weeks Using MachineLearning Methods. In Proceedings of the EMNLP 2014Workshop on Analysis of Large Scale Social Interactionin MOOCs, pages 60–65, Doha, Qatar, October 2014.
[6] M. Sharkey and R. Sanders. A Process for PredictingMOOC Attrition. In Proceedings of the EMNLP 2014Workshop on Analysis of Large Scale Social Interactionin MOOCs, pages 50–54, Doha, Qatar, October 2014.
Proceedings of the 8th International Conference on Educational Data Mining 636