Post-Keynesian models of growth and distribution Marc Lavoie.
44
Post-Keynesian models of growth and distribution Marc Lavoie
-
Upload
brendan-mcdaniel -
Category
Documents
-
view
224 -
download
4
Transcript of Post-Keynesian models of growth and distribution Marc Lavoie.
Post-Keynesian models of
growth and distribution
Marc Lavoie
Outline
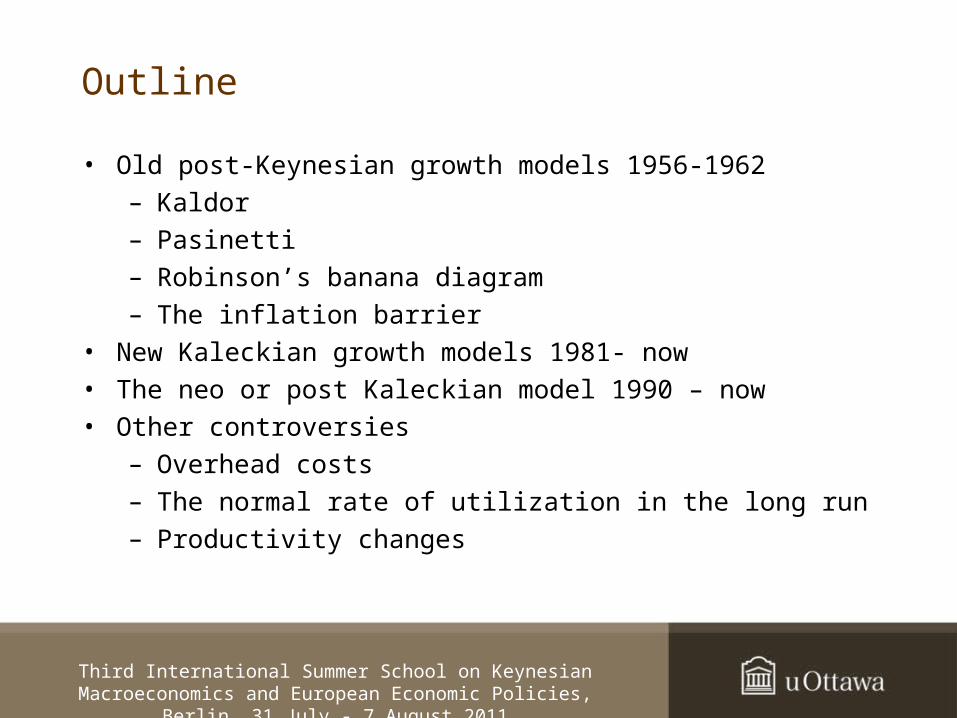
• Old post-Keynesian growth models 1956-1962– Kaldor– Pasinetti– Robinson’s banana diagram– The inflation barrier
• New Kaleckian growth models 1981- now• The neo or post Kaleckian model 1990 – now• Other controversies
– Overhead costs– The normal rate of utilization in the long run– Productivity changes
Third International Summer School on Keynesian Macroeconomics and European Economic Policies, Berlin, 31 July - 7 August 2011
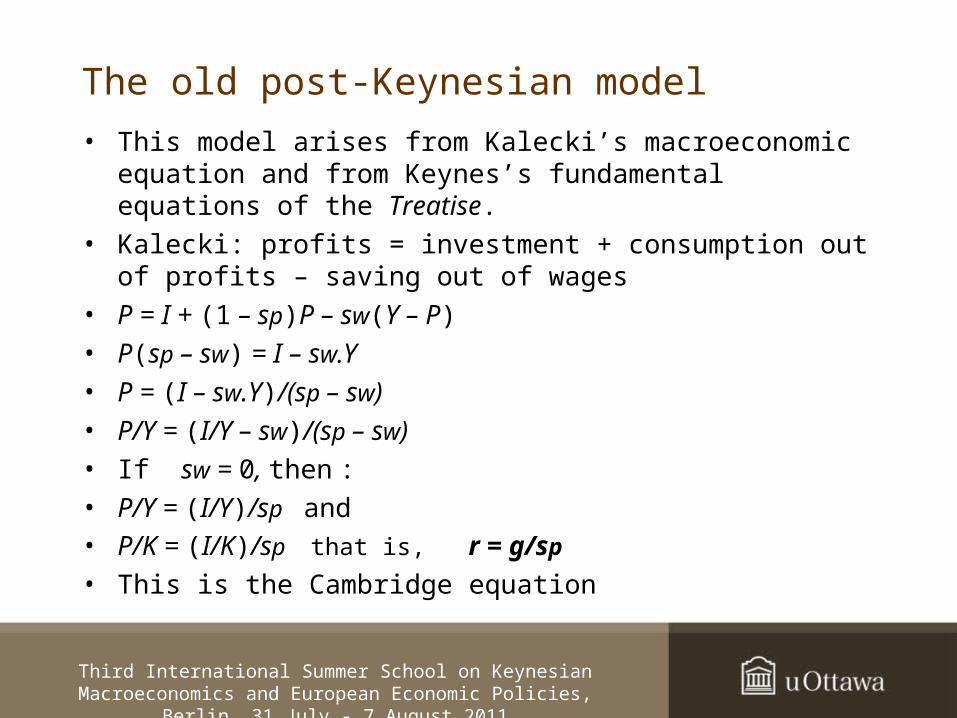
The old post-Keynesian model
• This model arises from Kalecki’s macroeconomic equation and from Keynes’s fundamental equations of the Treatise.
• Kalecki: profits = investment + consumption out of profits – saving out of wages
• P = I + (1 – sp)P – sw(Y – P)
• P(sp – sw) = I – sw.Y
• P = (I – sw.Y)/(sp – sw)
• P/Y = (I/Y – sw)/(sp – sw)
• If sw = 0, then :
• P/Y = (I/Y)/sp and• P/K = (I/K)/sp that is, r = g/sp
• This is the Cambridge equation
Third International Summer School on Keynesian Macroeconomics and European Economic Policies, Berlin, 31 July - 7 August 2011
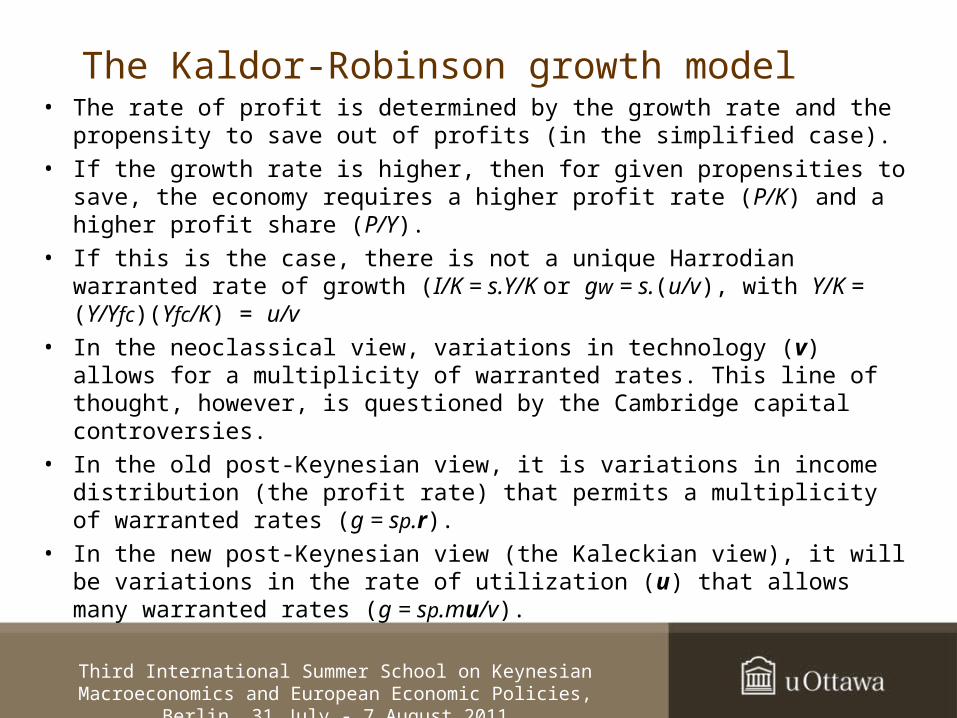
The Kaldor-Robinson growth model• The rate of profit is determined by the growth rate and the propensity
to save out of profits (in the simplified case).• If the growth rate is higher, then for given propensities to save, the
economy requires a higher profit rate (P/K) and a higher profit share (P/Y).
• If this is the case, there is not a unique Harrodian warranted rate of growth (I/K = s.Y/K or gw = s.(u/v), with Y/K = (Y/Yfc)(Yfc/K) = u/v
• In the neoclassical view, variations in technology (v) allows for a multiplicity of warranted rates. This line of thought, however, is questioned by the Cambridge capital controversies.
• In the old post-Keynesian view, it is variations in income distribution (the profit rate) that permits a multiplicity of warranted rates (g = sp.r).
• In the new post-Keynesian view (the Kaleckian view), it will be variations in the rate of utilization (u) that allows many warranted rates (g = sp.mu/v).
Third International Summer School on Keynesian Macroeconomics and European Economic Policies, Berlin, 31 July - 7 August 2011
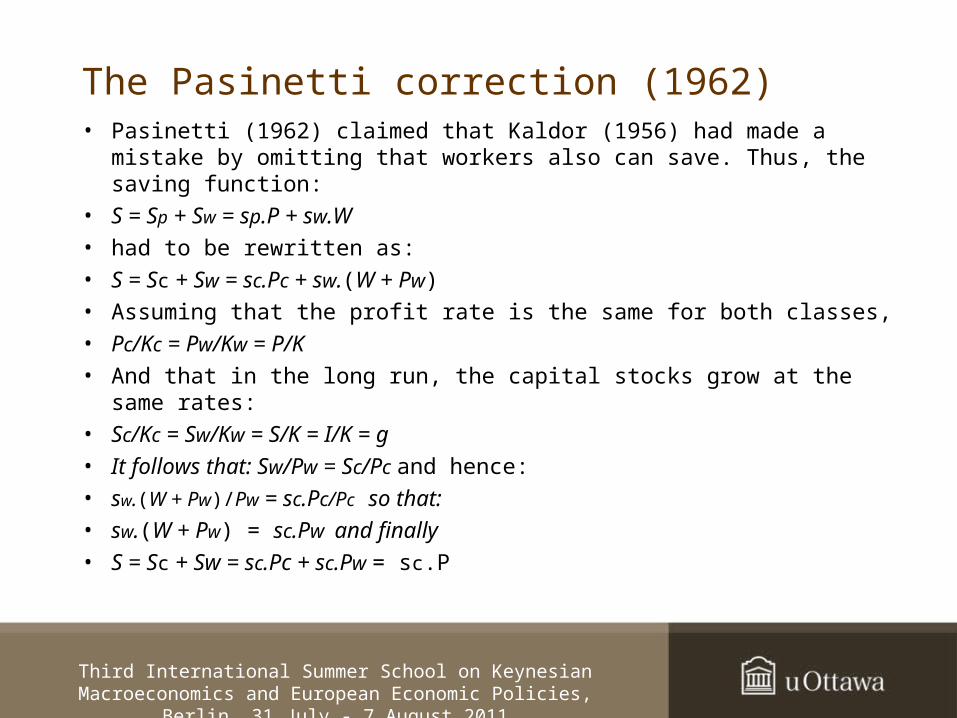
The Pasinetti correction (1962)• Pasinetti (1962) claimed that Kaldor (1956) had made a mistake by
omitting that workers also can save. Thus, the saving function:
• S = Sp + Sw = sp.P + sw.W
• had to be rewritten as:
• S = Sc + Sw = sc.Pc + sw.(W + Pw)
• Assuming that the profit rate is the same for both classes,
• Pc/Kc = Pw/Kw = P/K
• And that in the long run, the capital stocks grow at the same rates:
• Sc/Kc = Sw/Kw = S/K = I/K = g
• It follows that: Sw/Pw = Sc/Pc and hence:
• sw.(W + Pw)/Pw = sc.Pc/Pc so that:
• sw.(W + Pw) = sc.Pw and finally
• S = Sc + Sw = sc.Pc + sc.Pw = sc.P
Third International Summer School on Keynesian Macroeconomics and European Economic Policies, Berlin, 31 July - 7 August 2011

The Pasinetti paradox
• Thus, we have a revised Cambridge equation, valid however only in the very long run, where:
• r = g/sc• The propensity to save of capitalists (who earn only profits,
not wages) determines the profit rate, independently of the propensity to save of workers.
• This result, along with Kaldor’s equation, has given rise to over 500 articles or book chapters by 200 different scholars, many of which tried to see what conditions could be changed while keeping the Pasinetti paradox!
Third International Summer School on Keynesian Macroeconomics and European Economic Policies, Berlin, 31 July - 7 August 2011

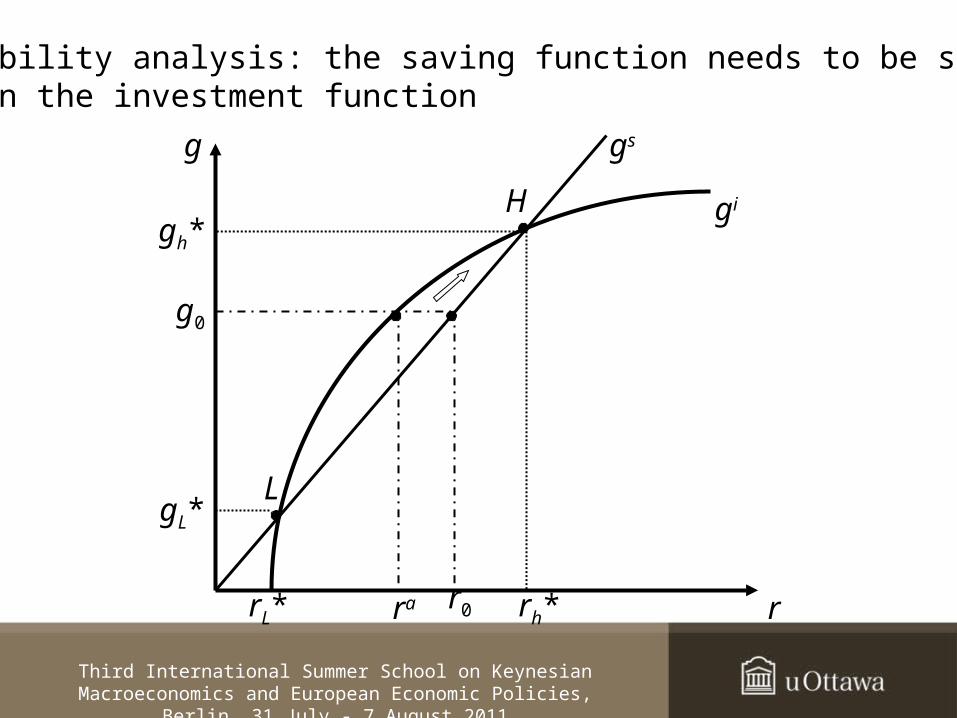
Joan Robinson’s banana diagram
• In her 1962 book Robinson adds a behavioural equation to the Cambridge equation (which determines the profit rate, or which is seen as the saving function).
• gs = spr• The investment function, in its linear form, would be• gi = γ + grre
• With a non-linear investment function, we would have two possible equilibria, one of them being stable.
Third International Summer School on Keynesian Macroeconomics and European Economic Policies, Berlin, 31 July - 7 August 2011
rL* rh*ra r0 r
g
gL*
g0
gh*
L
H
gs
gi
Stability analysis: the saving function needs to be steeperthan the investment function
Third International Summer School on Keynesian Macroeconomics and European Economic Policies, Berlin, 31 July - 7 August 2011
r0r
g
g0
HH’
gs
gi
gs(sp2)
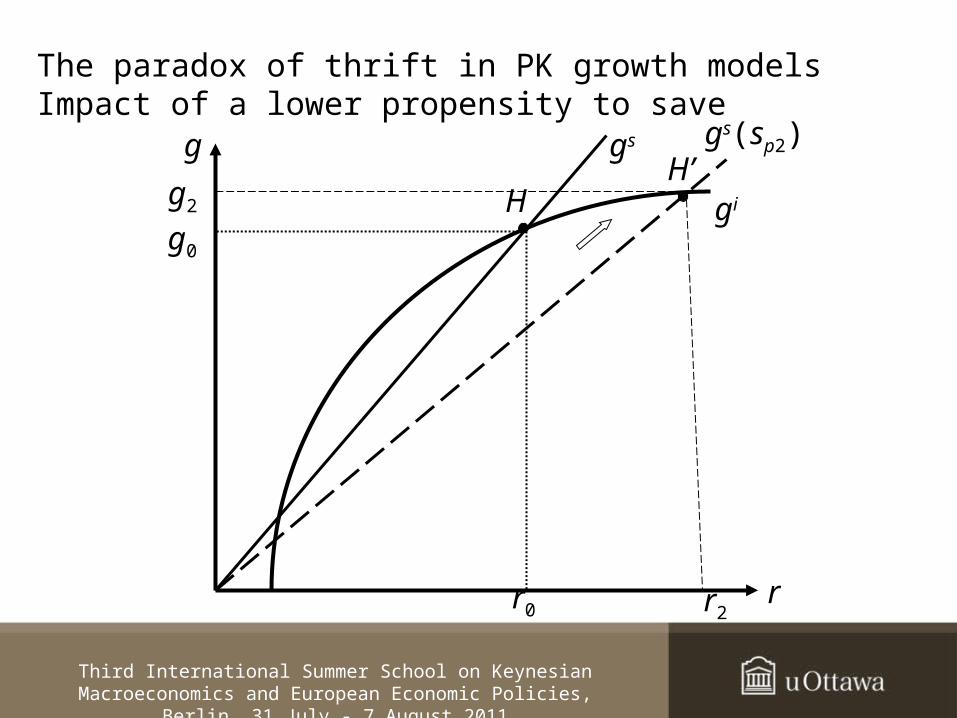
The paradox of thrift in PK growth modelsImpact of a lower propensity to save
r2
g2
Third International Summer School on Keynesian Macroeconomics and European Economic Policies, Berlin, 31 July - 7 August 2011
r0r
g
g0
HH’
gs
gi
gs(sp2)
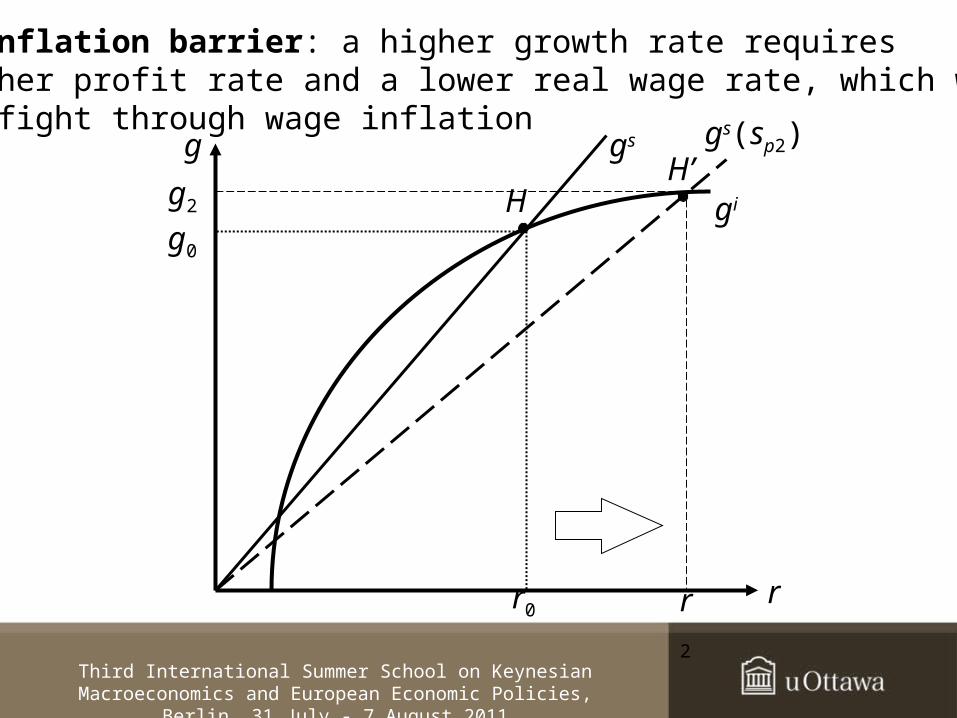
The inflation barrier: a higher growth rate requiresa higher profit rate and a lower real wage rate, which workerswill fight through wage inflation
r2
g2
Third International Summer School on Keynesian Macroeconomics and European Economic Policies, Berlin, 31 July - 7 August 2011
r0r
g
g0 H
H’
gs
gi
gs(sp2)
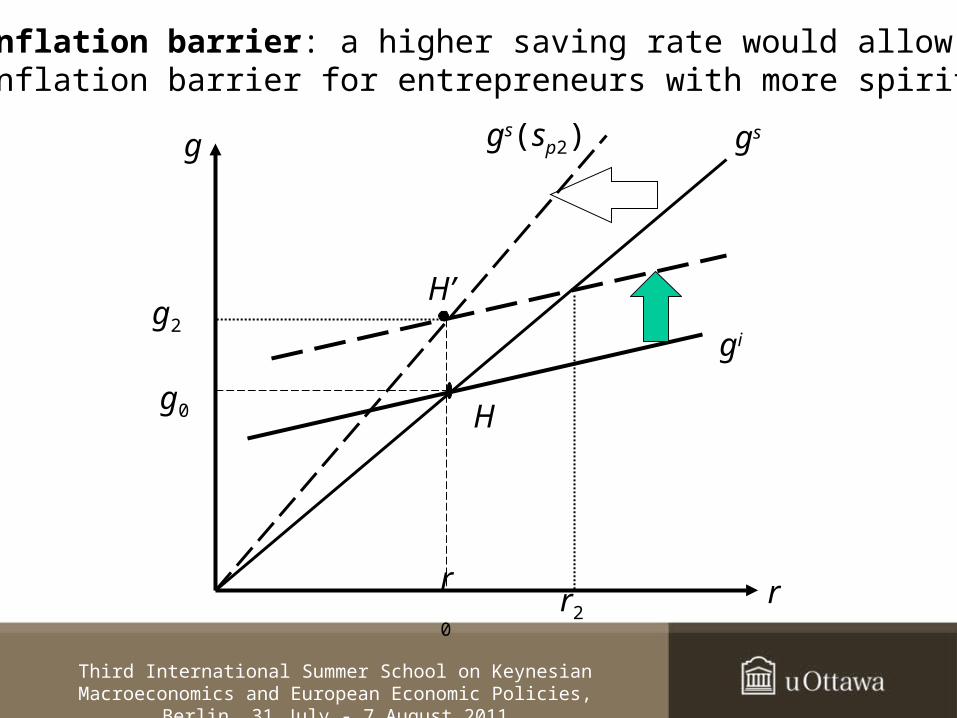
The inflation barrier: a higher saving rate would allow to evade the inflation barrier for entrepreneurs with more spirits.
r2
g2
Third International Summer School on Keynesian Macroeconomics and European Economic Policies, Berlin, 31 July - 7 August 2011
First problem with the old PK growth model
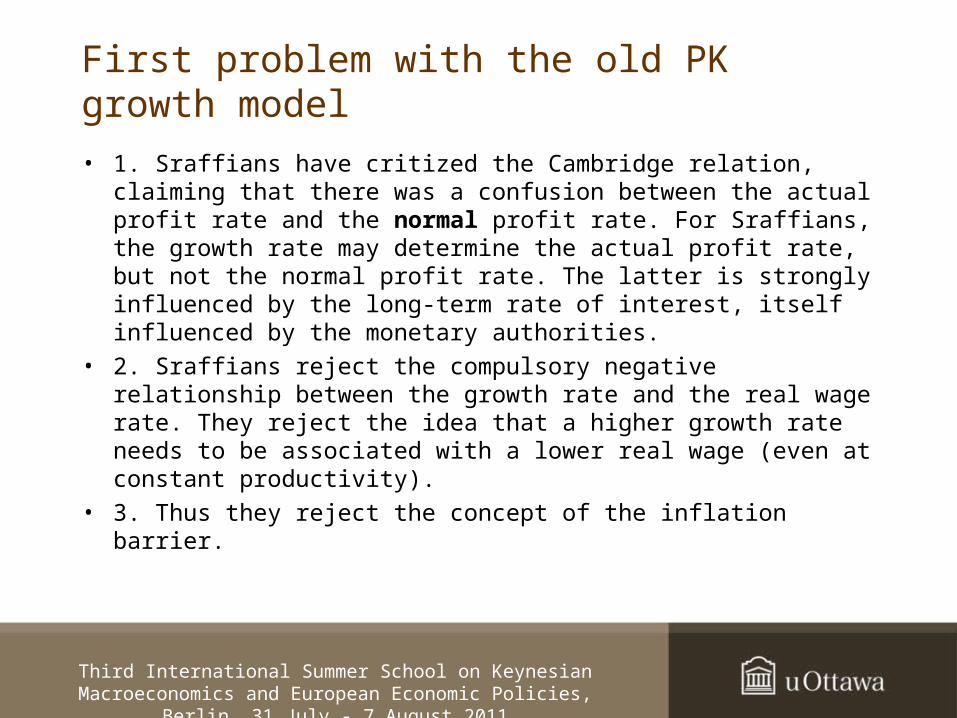
• 1. Sraffians have critized the Cambridge relation, claiming that there was a confusion between the actual profit rate and the normal profit rate. For Sraffians, the growth rate may determine the actual profit rate, but not the normal profit rate. The latter is strongly influenced by the long-term rate of interest, itself influenced by the monetary authorities.
• 2. Sraffians reject the compulsory negative relationship between the growth rate and the real wage rate. They reject the idea that a higher growth rate needs to be associated with a lower real wage (even at constant productivity).
• 3. Thus they reject the concept of the inflation barrier.
Third International Summer School on Keynesian Macroeconomics and European Economic Policies, Berlin, 31 July - 7 August 2011
Second problem with the old PK growth model
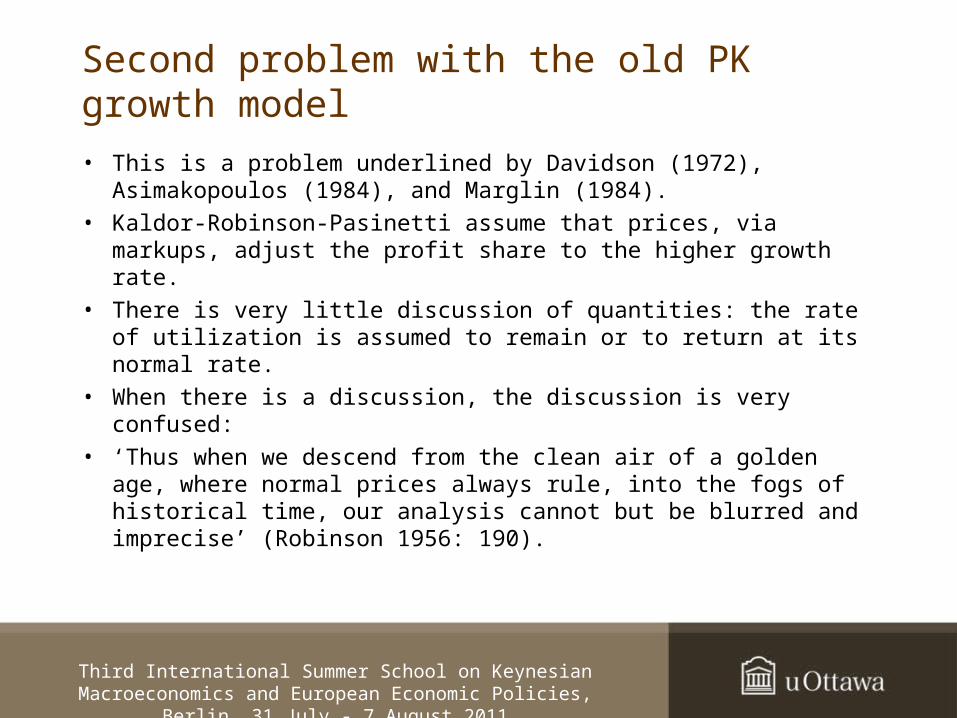
• This is a problem underlined by Davidson (1972), Asimakopoulos (1984), and Marglin (1984).
• Kaldor-Robinson-Pasinetti assume that prices, via markups, adjust the profit share to the higher growth rate.
• There is very little discussion of quantities: the rate of utilization is assumed to remain or to return at its normal rate.
• When there is a discussion, the discussion is very confused:• ‘Thus when we descend from the clean air of a golden age,
where normal prices always rule, into the fogs of historical time, our analysis cannot but be blurred and imprecise’ (Robinson 1956: 190).
Third International Summer School on Keynesian Macroeconomics and European Economic Policies, Berlin, 31 July - 7 August 2011
Davidson’s critique
• “The neo-Keynesian models of Robinson, Kaldor and Pasinetti, which are more directly derived from Kalecki's work and Keynes's Treatise on Money ... lay emphasis on changes in the distribution of income and prices as the primary adjustment mechanism to short-period disequilibrium, and adjustments via changes in employment and output are considered either to be of secondary importance or assumed away. In Joan Robinson's model, if realised aggregate demand is below expected demand, then it is assumed that competition brings down market prices (and profit margins) at the normal or standard value of output.” (Davidson 1972:124-5)
Third International Summer School on Keynesian Macroeconomics and European Economic Policies, Berlin, 31 July - 7 August 2011

Marglin’s critique
• `In the short run, fluctuations in investment demand are reflected in fluctuations in output; the rate of capacity utilization changes in accordance with aggregate demand.... But in the long run, ... there is no excess capacity to accommodate investment demand. Distribution must bear the brunt of adjusting aggregate demand to supply” (Marglin 1984: 474-5)
Third International Summer School on Keynesian Macroeconomics and European Economic Policies, Berlin, 31 July - 7 August 2011

Robinson’s failed traverse with higher profit margins
• “Now let us suppose that Alaph entrepreneurs begin to form themselves into rings and raise prices.... As prices rise, with constant money wages, the volume of sales of consumption goods gradually falls (or rather fails to rise at its former rate). Workers become unemployed, and the utilisation of capital equipment in the consumption sector falls below capacity.... Initially employment in the investment sector is unaffected.... But with redundant equipment in the consumption sector the demand for replacements falls off, there is unemployment in the investment sector and a fall in the rate of profit. We may suppose that after passing through a period of disinvestment, accumulation recovers to its former level (though there is no necessary reason why it should do so).” (Robinson 1956: 77-8).
Third International Summer School on Keynesian Macroeconomics and European Economic Policies, Berlin, 31 July - 7 August 2011

Robinson’s claim
• “Firms may be working plant below designed capacity and still charging the "full cost" prices at which they were earlier able to sell their normal capacity output', while assuming however that `competition (in the short-period sense) is sufficiently keen to keep prices at the level at which normal capacity output can be sold” (Robinson, 1962: 46).
• `Although variations in the degree of utilization of capacity are admitted for the short period, Robinson excludes them as far as the long period is concerned‘ (Ciccone 1986: 22)
Third International Summer School on Keynesian Macroeconomics and European Economic Policies, Berlin, 31 July - 7 August 2011

The new PK model: Kaleckian model
• Del Monte (1975), Rowthorn (1981), Taylor (1983), Dutt (1984)• Changes in quantities are the main driver.• It is assumed that income distribution variables, such as the
markup, or the target rate of return, are exogenous. The feedback effects of growth or employment on income distribution are omitted in the simple versions.
• The model is made up of three equations: the saving function, the investment function, and the pricing function.
Third International Summer School on Keynesian Macroeconomics and European Economic Policies, Berlin, 31 July - 7 August 2011
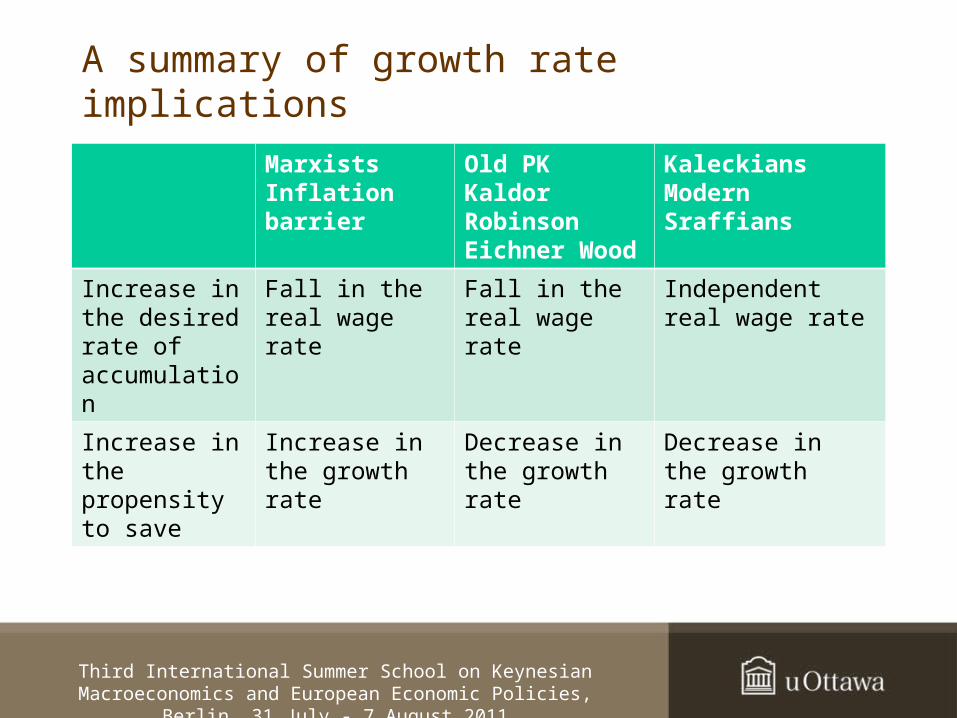
A summary of growth rate implications
MarxistsInflation barrier
Old PKKaldorRobinsonEichner Wood
KaleckiansModern Sraffians
Increase in the desired rate of accumulation
Fall in the real wage rate
Fall in the real wage rate
Independent real wage rate
Increase in the propensity to save
Increase in the growth rate
Decrease in the growth rate
Decrease in the growth rate
Third International Summer School on Keynesian Macroeconomics and European Economic Policies, Berlin, 31 July - 7 August 2011
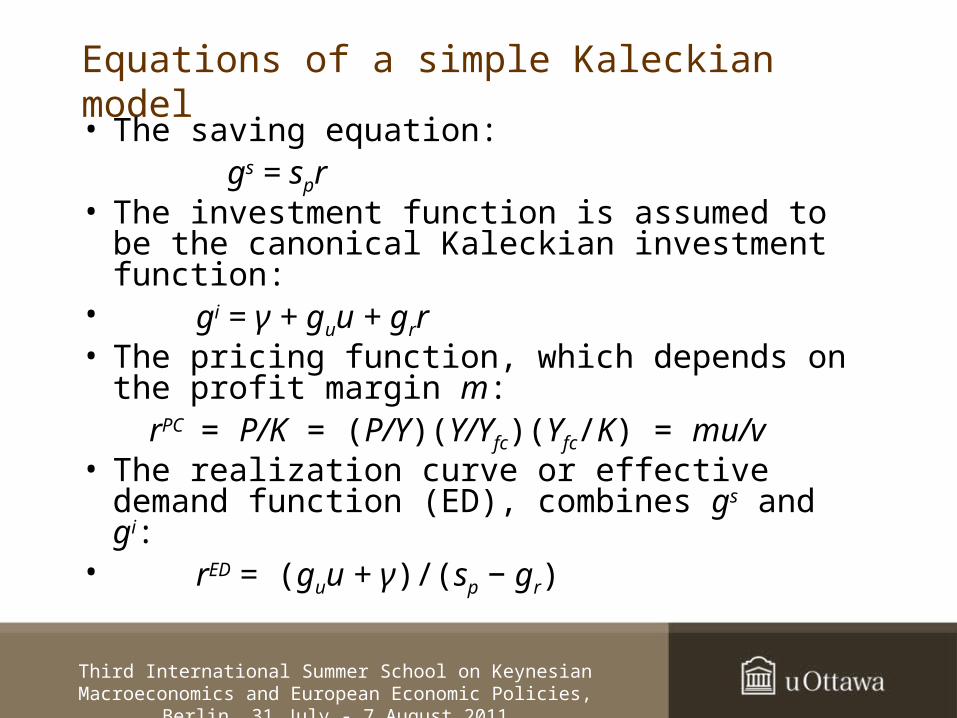
Equations of a simple Kaleckian model• The saving equation:
gs = spr• The investment function is assumed to be the
canonical Kaleckian investment function:• gi = γ + guu + grr• The pricing function, which depends on the profit
margin m:rPC = P/K = (P/Y)(Y/Yfc)(Yfc/K) = mu/v
• The realization curve or effective demand function (ED), combines gs and gi:
• rED = (guu + γ)/(sp − gr)
Third International Summer School on Keynesian Macroeconomics and European Economic Policies, Berlin, 31 July - 7 August 2011
A change in income distribution
• What happens if there is a reduction in the markup (or in the profit share) and hence an increase in the real wage (or an increase in the wage share)?
• Initially, in the short run, as explained by Robinson (1956), there will be an increase in consumption, and hence an increase in the rate of utilization.
• Initially, also there will be no change in the rate of profit, as long as we assume that investment (and propensities to consume) is not modified. Recall Kalecki’s equation!
• However, the increase in the rate of utilization will eventually lead to an increase in the rate of accumulation (the accelerator effect) and hence in the profit rate! This is the paradox of costs!
• Real wages, profit rates and growth rates all rise together.
Third International Summer School on Keynesian Macroeconomics and European Economic Policies, Berlin, 31 July - 7 August 2011
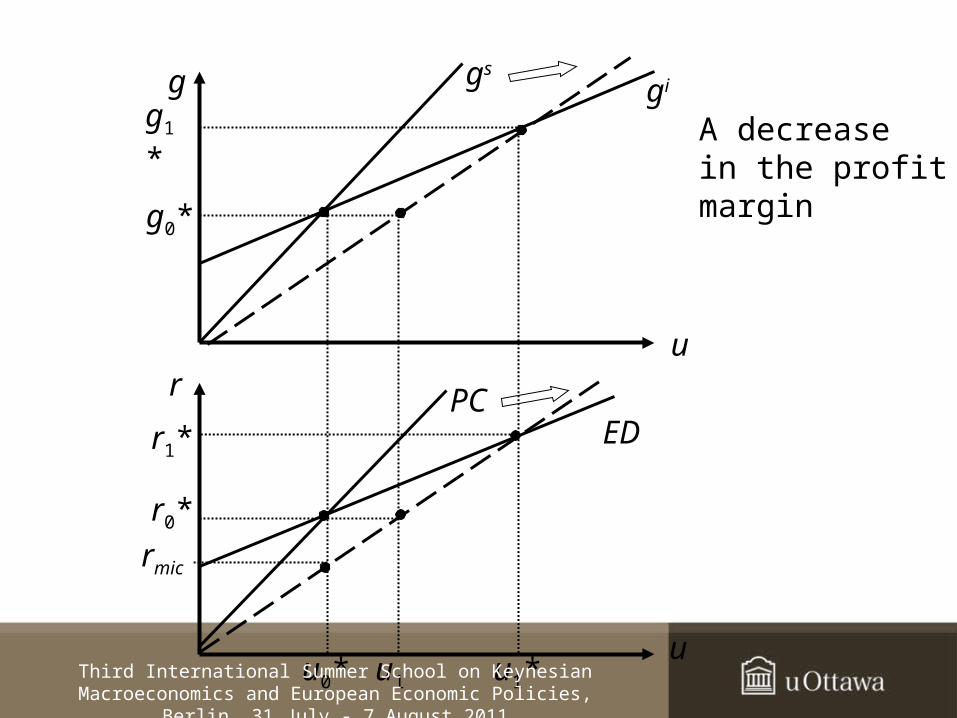
g
u
u
r PCED
gs
gi
u0* u1*u1
r0*
r1*
g0*
g1*
rmic
A decreasein the profit margin
Third International Summer School on Keynesian Macroeconomics and European Economic Policies, Berlin, 31 July - 7 August 2011
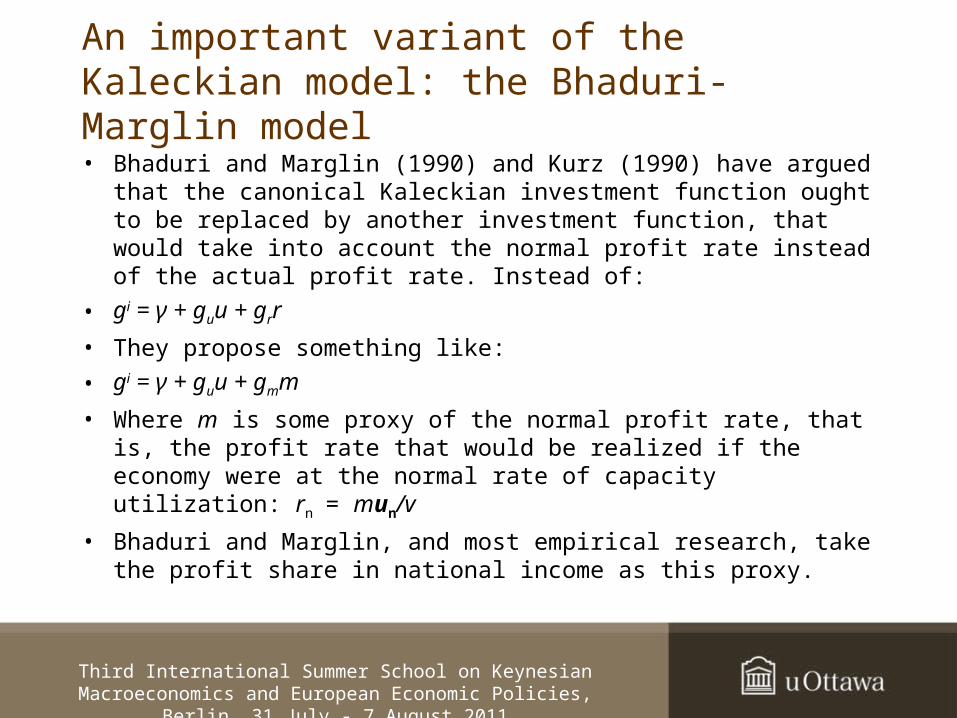
An important variant of the Kaleckian model: the Bhaduri-Marglin model
• Bhaduri and Marglin (1990) and Kurz (1990) have argued that the canonical Kaleckian investment function ought to be replaced by another investment function, that would take into account the normal profit rate instead of the actual profit rate. Instead of:
• gi = γ + guu + grr
• They propose something like:
• gi = γ + guu + gmm
• Where m is some proxy of the normal profit rate, that is, the profit rate that would be realized if the economy were at the normal rate of capacity utilization: rn = mun/v
• Bhaduri and Marglin, and most empirical research, take the profit share in national income as this proxy.
Third International Summer School on Keynesian Macroeconomics and European Economic Policies, Berlin, 31 July - 7 August 2011
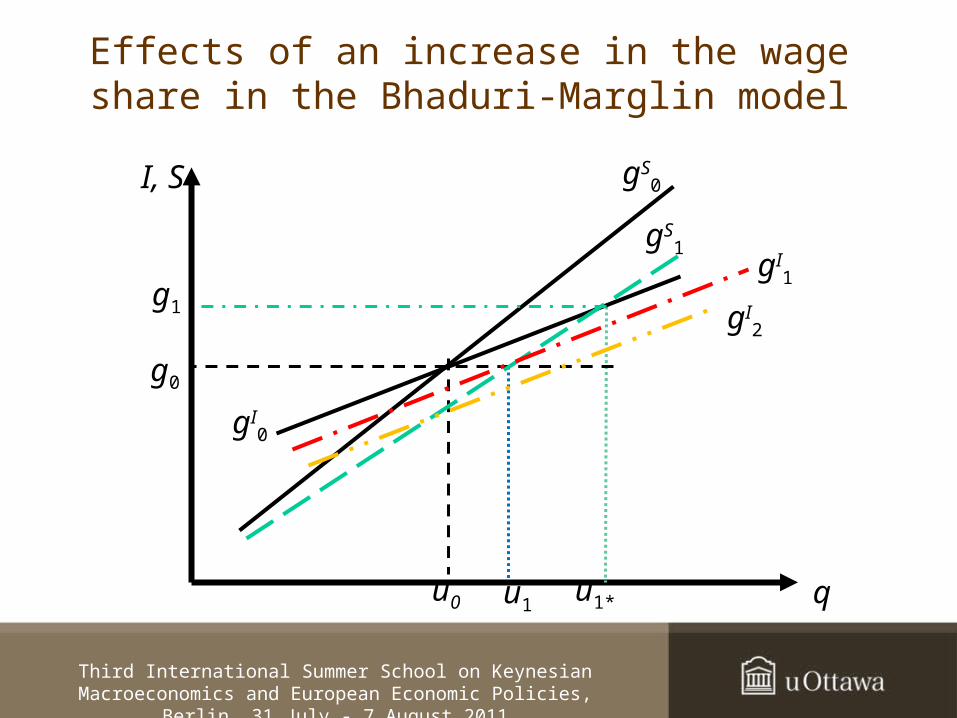
qu1*
gI0
gS0
g0
I, S
u0
g1
u1
gS1
gI2
gI1
Effects of an increase in the wage share in the Bhaduri-Marglin model
Third International Summer School on Keynesian Macroeconomics and European Economic Policies, Berlin, 31 July - 7 August 2011
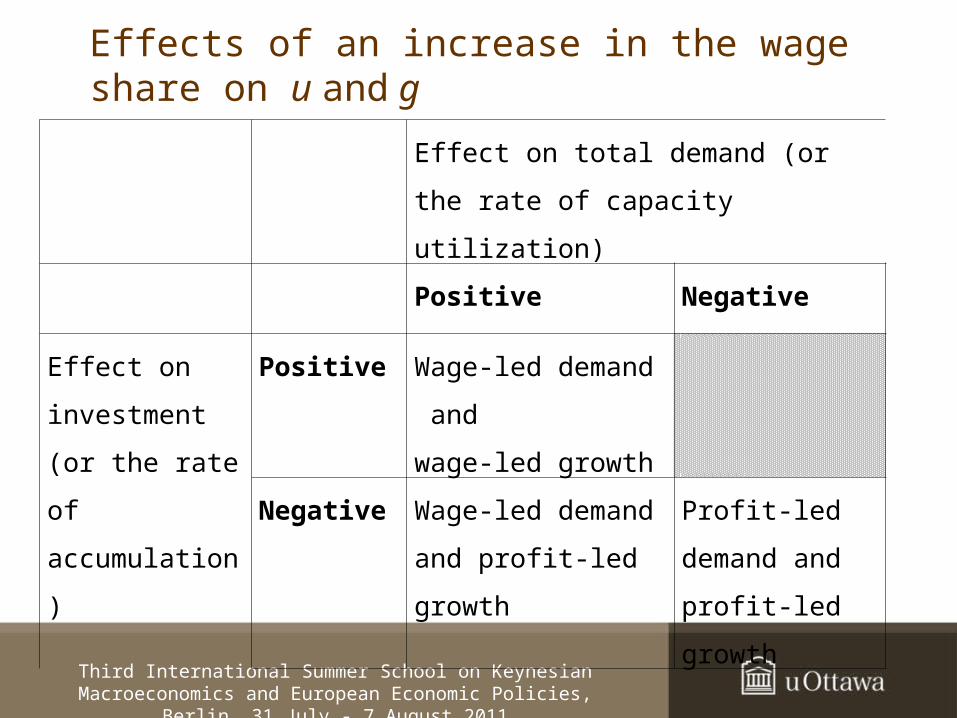
Effects of an increase in the wage share on u and g
Third International Summer School on Keynesian Macroeconomics and European Economic Policies, Berlin, 31 July - 7 August 2011
Effect on total demand (or the
rate of capacity utilization)
Positive Negative
Effect on
investment
(or the rate of
accumulation)
Positive Wage-led demand
and
wage-led growth
Negative Wage-led demand
and profit-led
growth
Profit-led
demand and
profit-led
growth
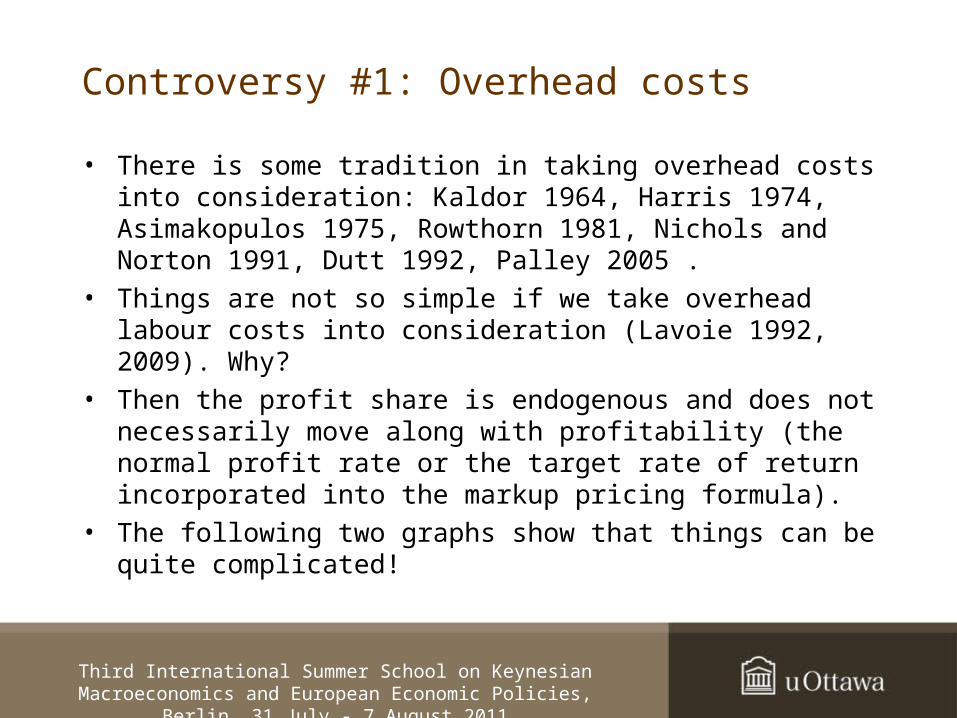
Controversy #1: Overhead costs
• There is some tradition in taking overhead costs into consideration: Kaldor 1964, Harris 1974, Asimakopulos 1975, Rowthorn 1981, Nichols and Norton 1991, Dutt 1992, Palley 2005 .
• Things are not so simple if we take overhead labour costs into consideration (Lavoie 1992, 2009). Why?
• Then the profit share is endogenous and does not necessarily move along with profitability (the normal profit rate or the target rate of return incorporated into the markup pricing formula).
• The following two graphs show that things can be quite complicated!
Third International Summer School on Keynesian Macroeconomics and European Economic Policies, Berlin, 31 July - 7 August 2011
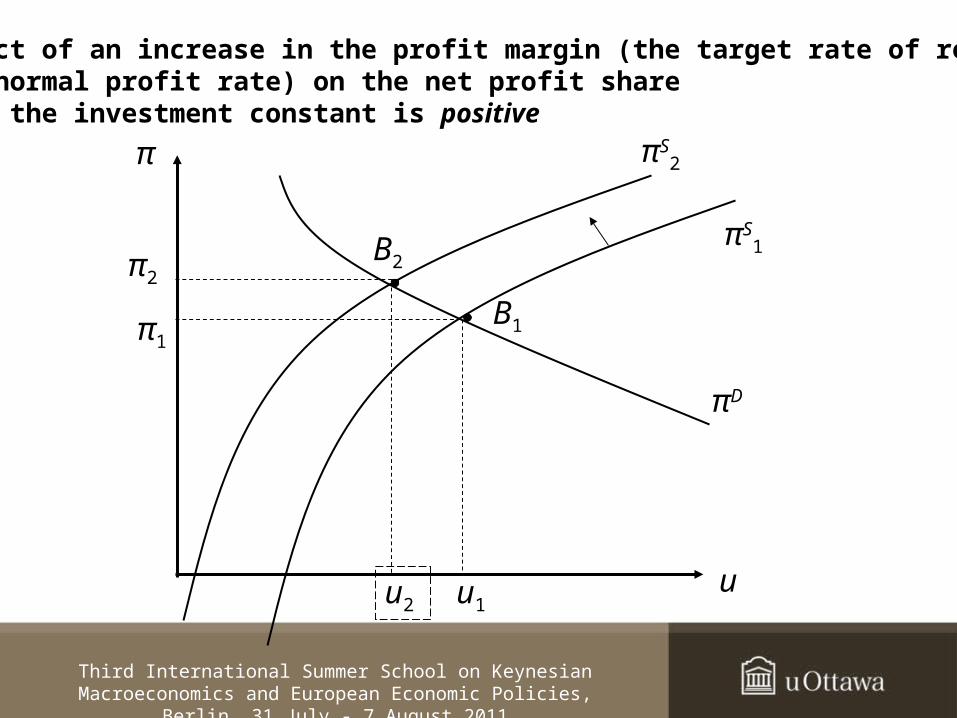
u
π
π1
πD
u1u2
πS1
πS2
B1
B2
Impact of an increase in the profit margin (the target rate of return orthe normal profit rate) on the net profit share when the investment constant is positive
π2
Third International Summer School on Keynesian Macroeconomics and European Economic Policies, Berlin, 31 July - 7 August 2011
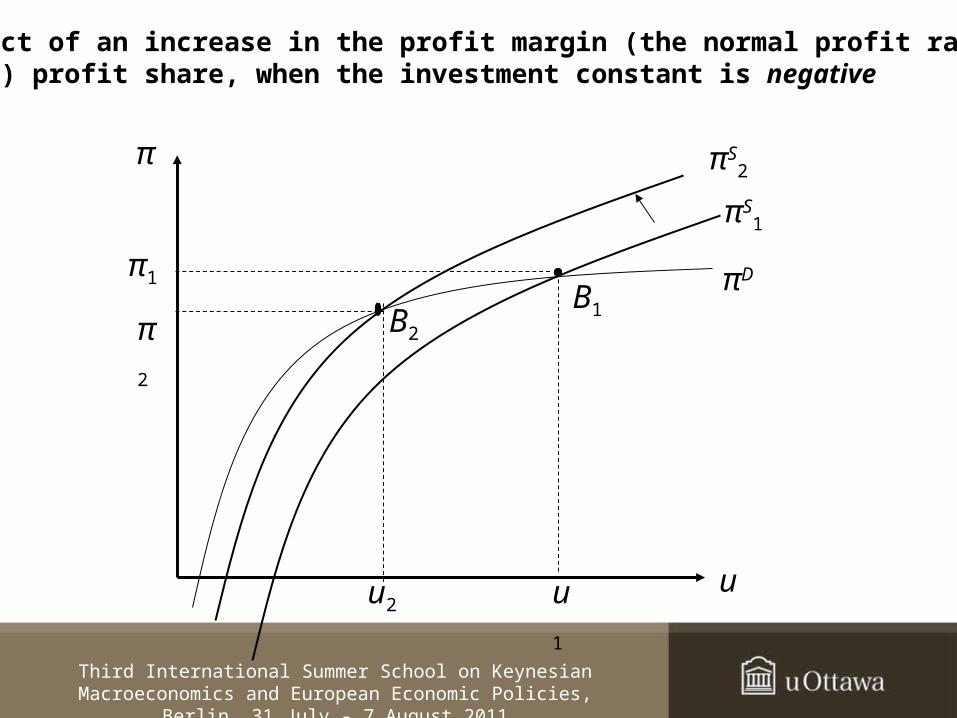
u
π
π2
u1
πS1
πS2
B1B2
Impact of an increase in the profit margin (the normal profit rate) on the(net) profit share, when the investment constant is negative
πD
u2
π1
Third International Summer School on Keynesian Macroeconomics and European Economic Policies, Berlin, 31 July - 7 August 2011

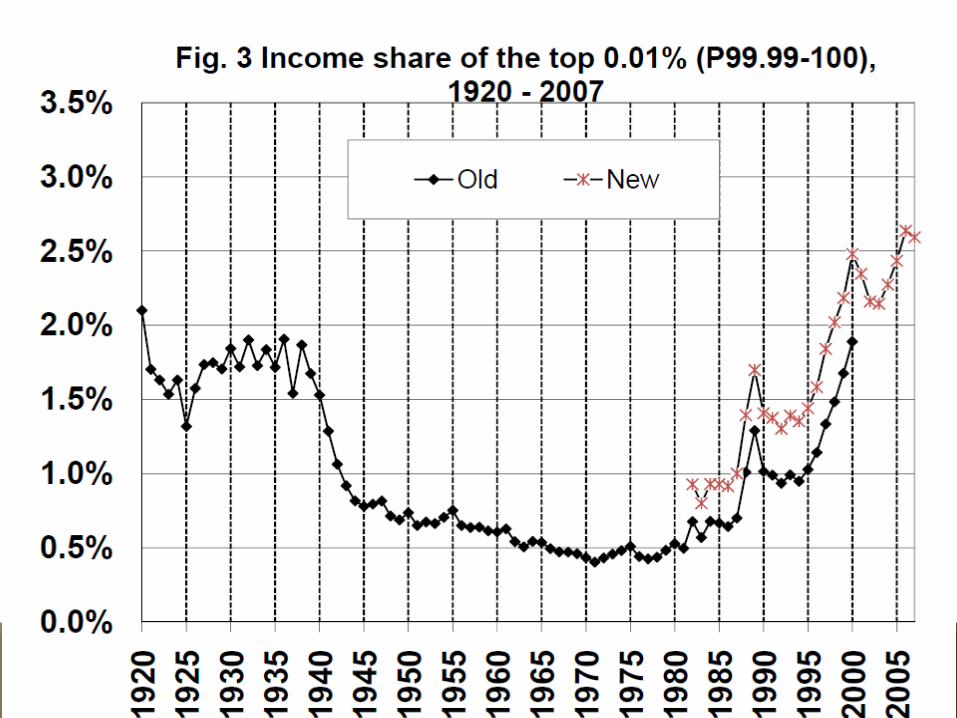
Overheads
• Overhead costs are particularly important now since it has been shown that the top centiles in income distribution earn most of their money through salaries and wage bonuses.
• The impact on the economy also depends on how overhead salaries are included into the pricing formula (here it has been assumed that firms follow a target-return pricing formula and hence add overhead costs under the assumption that the firm operates at its normal rate of capacity utilization).
• Thus changes in the wage share may underestimate the changes in income distribution which are occurring.
• Also an increase in the proportion of wages going to overhead labour (supervisory workers) does not always have the same effect!
Third International Summer School on Keynesian Macroeconomics and European Economic Policies, Berlin, 31 July - 7 August 2011

US top .01% earners
Third International Summer School on Keynesian Macroeconomics and European Economic Policies, Berlin, 31 July - 7 August 2011
Third International Summer School on Keynesian Macroeconomics and European Economic Policies, Berlin, 31 July - 7 August 2011
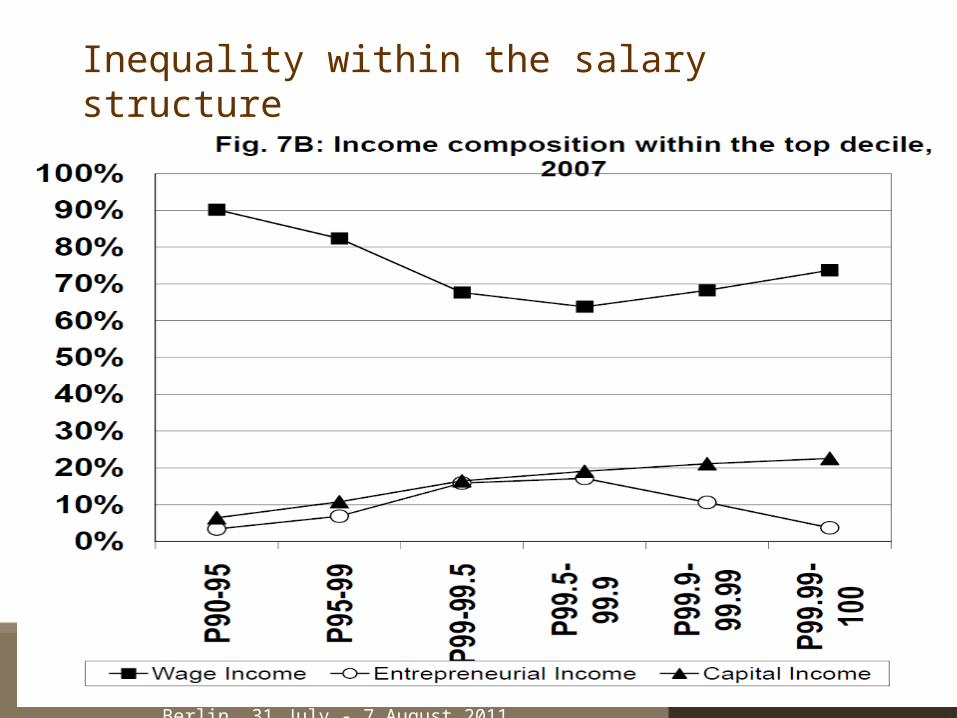
Inequality within the salary structure
Third International Summer School on Keynesian Macroeconomics and European Economic Policies, Berlin, 31 July - 7 August 2011

u
r
rn
EDB
EDA
un
PC1
PC2
A1A2
B1
B2
Macroeconomic impact of an increase in managerial costs, with target return pricing (positive or negative on u)
Third International Summer School on Keynesian Macroeconomics and European Economic Policies, Berlin, 31 July - 7 August 2011
u
π
πn
πDB
πDA
un
πS1
πS2
A1
A2
B1
B2
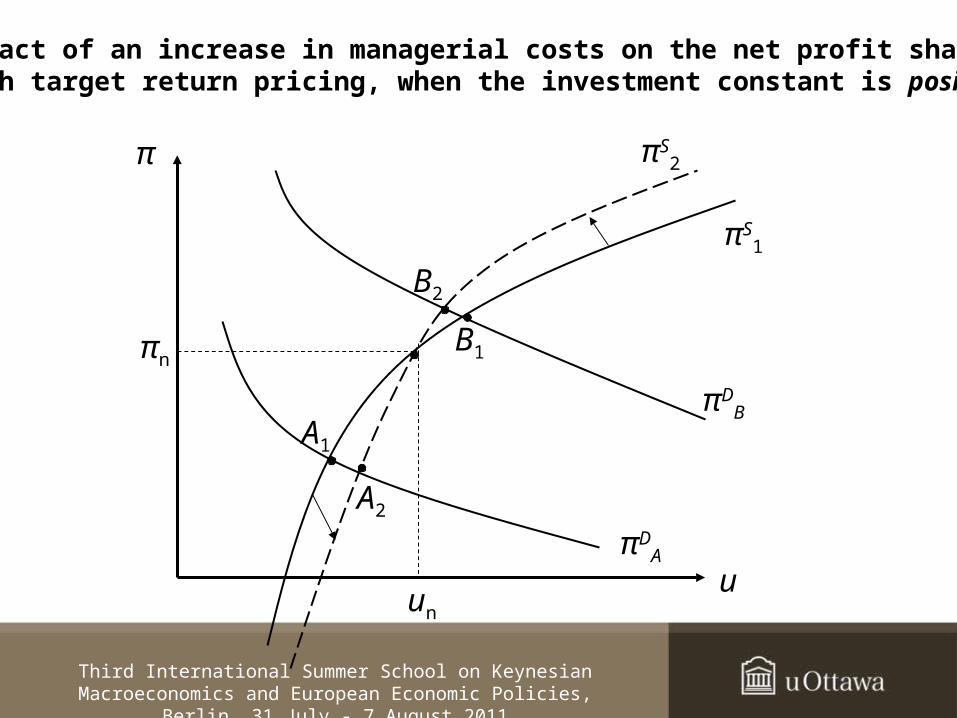
Impact of an increase in managerial costs on the net profit share, with target return pricing, when the investment constant is positive
Third International Summer School on Keynesian Macroeconomics and European Economic Policies, Berlin, 31 July - 7 August 2011
u
π
πn
πDA
un
πS1
πS2
A1 A2
B1
B2
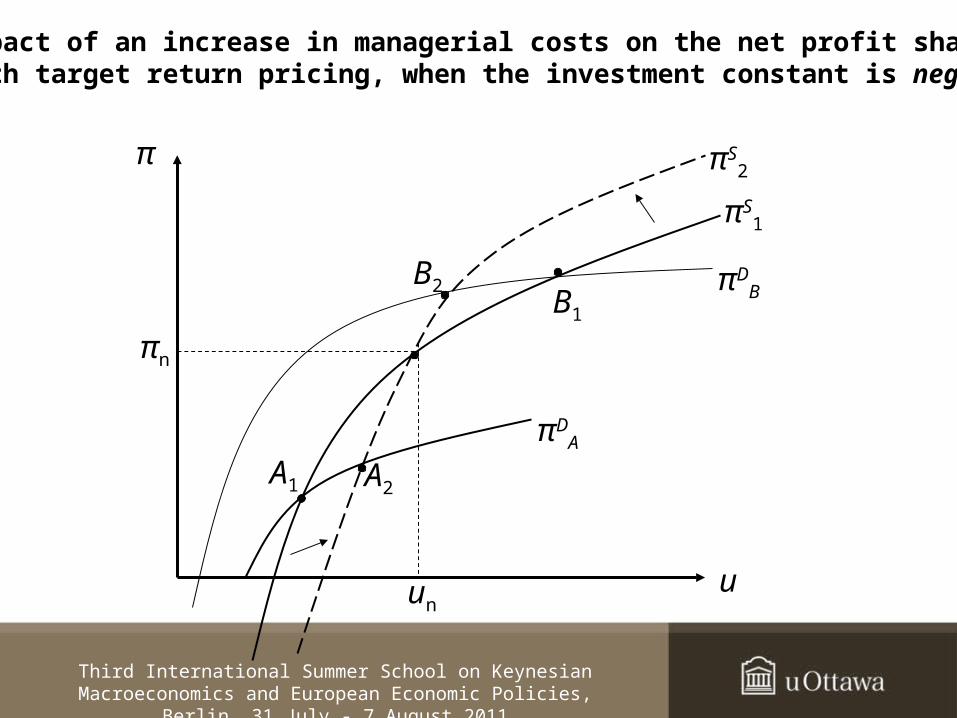
Impact of an increase in managerial costs on the net profit share, with target return pricing, when the investment constant is negative
πDB
Third International Summer School on Keynesian Macroeconomics and European Economic Policies, Berlin, 31 July - 7 August 2011
Controversy #2: Should the rate of utilization be equal to its normal value in the long run?
• Several authors, mainly Marxist ones (Shaikh, Duménil and Lévy), but also some post-Keynesians (Skott), argue that the Kaleckian model is under-determined because it does not assume a mechanism that will bring back the economy to its normal rate of capacity utilization in the long run.
• This has been the subject of several articles, both in the mid-1980s and also more recently.
• It has been argued in particular that economists ought to be Kaleckians (or Keynesians) in the short run, but that they should be classical (Marxist) in the long run.
Third International Summer School on Keynesian Macroeconomics and European Economic Policies, Berlin, 31 July - 7 August 2011

Mechanisms that bring the economy back to the normal rate of utilization
• The Cambridge price mechanism (Robinson)• The central bank (fear of inflation) (Duménil and Lévy)• The business fear of full employment or full capacity (Skott)• Some form of rational expectations (Shaikh)• Changes in the retained earnings ratio of firms (Shaikh)• • See Hein, Lavoie, van Treeck (CJE 2011)
Third International Summer School on Keynesian Macroeconomics and European Economic Policies, Berlin, 31 July - 7 August 2011

The Kaleckian response
• Firms are content with a large range of rates of utilization (Dutt).• Firms would like to bring the rate of utilization back to its normal
value, but they face other constraints that stop them from being able to do so (Dallery and can Treeck).
• The normal rate of utilization will adjust itself to the actual rates of capacity utilization (path-dependence, Lavoie).
• See Hein, Lavoie, van Treeck (Metroeconomica 2011)
• A mechanism to explore: scrapping unused machines
Third International Summer School on Keynesian Macroeconomics and European Economic Policies, Berlin, 31 July - 7 August 2011
The Kaldorian influence
• Kaldor can be said to have a multiple influence on models of growth:– In arguing that the natural rate of growth is influenced by
growth in demand;– In arguing about productivity effects;– In arguing about cumulative causation;– In introducing open economy constraints on growth.
Third International Summer School on Keynesian Macroeconomics and European Economic Policies, Berlin, 31 July - 7 August 2011

Productivity growth
• Kaldorians have for a long time argued that supply-side growth is endogenous, thus predating the mainstream theories of endogenous growth.
• This is the so-called Kaldor-Verdoorn law, for which there is a substantial amount of empirical evidence (McCombie and Thirlwall 1994, McCombie 2002) and the formal origins of which can be traced back to Kaldor’s (1957) technical progress function.
• The Kaldor-Verdoorn law claims that there is a positive causal relation going from the growth rates of GDP to the growth rate of labour productivity.
Third International Summer School on Keynesian Macroeconomics and European Economic Policies, Berlin, 31 July - 7 August 2011

The Kaldor-Verdoorn law
• In other words, demand-led growth will have an impact on the supply components of growth (Léon-Ledesma and Thirwall 2002, Dray and Thirwall 2011).
• More simply, it is claimed that there is a positive causal relationship going from the growth rate of the economy to the growth rate of labour productivity (and even the growth rate of the labour force).
• McCombie (2002, p. 106) says that the Verdoorn coefficient is in the 0.3 to 0.6 range, meaning that a one percentage point addition to the growth rate will generate a 0.3 to 0.6 percentage point increase in the growth rate of labour productivity.
• This number is also consistent with the one obtained recently by Storm and Naastepad (2008). Their average estimate is 0.5
Third International Summer School on Keynesian Macroeconomics and European Economic Policies, Berlin, 31 July - 7 August 2011

Productivity regimes (revised Storm and Naastepad)
• λ = β0 + β1.g + β2.w
• g = ε0 + ε1(w – λ) + ε2. λ = ε0 + ε1.w + ε3. λ
• Where ε3 = ε2 – ε1
• λ is the growth rate of labour productivity;
• g is the growth rate of the economy;
• w is the growth rate of real wages .
• If ε1 > 0 then we have a wage-led demand regime (as before)
• The question then is whether productivity growth λ is also wage-led.
• There are two effects: a direct effect through parameter β2; and a multiple indirect effect, through the Kaldor-Verdoorn effect.
• Also, do increases in real wages lead to employment growth or not?
Third International Summer School on Keynesian Macroeconomics and European Economic Policies, Berlin, 31 July - 7 August 2011

Total productivity effect of an increase in the wage share, when the partial productivity regime is wage led
Third International Summer School on Keynesian Macroeconomics and European Economic Policies, Berlin, 31 July - 7 August 2011
Demand
Regime
Direct
(partial)
productivity
effect
Indirect
productivity
effect
(Kaldor-
Verdoorn
effect)
Overall
combined
productivity
and demand
effect
Profit led Positive Negative Positive or
negative
Wage led Positive Positive Positive

Conclusion
• The Kaleckian growth model is very flexible.• It has been used by authors coming from several schools of
thought• It has allowed discussions between different traditions.• It has an empirical content.• It can also handle monetary matters (Hein)• And open-economy matters (Blecker)
Third International Summer School on Keynesian Macroeconomics and European Economic Policies, Berlin, 31 July - 7 August 2011