POST HARVEST HANDLING AND STORAGE (PHHS) PROJECT · PDF file · 2014-03-06POST...
45
POST HARVEST HANDLING AND STORAGE (PHHS) PROJECT FINAL REPORT ANNEX II: MAIZE POST-HARVEST PRACTICES, REVISED LOSS ESTIMATES AND TRAINING NEEDS SEASONS A AND B, 2012 PROJECT # EEM-I-00-07-00006-00 Task Order 09 DISCLAIMER The authors’ views expressed in this publication do not necessarily reflect the views of the United States Agency for International Development or the United States Government.
Transcript of POST HARVEST HANDLING AND STORAGE (PHHS) PROJECT · PDF file · 2014-03-06POST...
POST HARVEST HANDLING AND STORAGE (PHHS) PROJECT FINAL REPORT
ANNEX II: MAIZE POST-HARVEST PRACTICES, REVISED LOSS ESTIMATES AND TRAINING NEEDS SEASONS A AND B, 2012 PROJECT # EEM-I-00-07-00006-00 Task Order 09
DISCLAIMER
The authors’ views expressed in this publication do not necessarily reflect the views of the United States Agency for International Development or the United States Government.
CONTENTS
EXECUTIVE SUMMARY .................................................................................................................................. 3
SAMPLING SUMMARY ................................................................................................................................... 8
KEY BASE PRODUCTION AND SUPPLY PARAMETERS .................................................................................... 9
MAIZE PURCHASING ............................................................................................................................... 11
MARKET OUTLETS ................................................................................................................................... 11
HARVESTING CONDITIONS, PRACTICES, AND LOSSES ................................................................................ 13
SEASON B 2012 QUESTIONNAIRE HARVEST LOSS RESULTS .................................................................... 14
SEASON A 2013 PILOT FIELD VERIFICATION RESULTS............................................................................. 16
DRYING PRACTICES ..................................................................................................................................... 19
MAIZE SHELLING ......................................................................................................................................... 20
MAIZE STORAGE .......................................................................................................................................... 22
STORAGE FOR CONSUMED MAIZE .......................................................................................................... 22
STORAGE OF MARKETED MAIZE ............................................................................................................. 24
PROTECTANT USE IN STORAGE ............................................................................................................... 26
STORAGE LOSSES (SEASON B ONLY) ....................................................................................................... 29
TRAINING BY SUBJECT AND PROVINCE ....................................................................................................... 32
APHLIS POST HARVEST LOSSES ................................................................................................................... 34
COMPARISON OF POST-HARVEST LOSS ESTIMATES FROM APHLIS VS. MINAGRI SURVEYS ...................... 36
COMPARATIVE INCORPORATION OF FIELD MEASURED “HARVEST/DRYING LOSSES” TO BACK-CAST PREVIOUS SEASONS .................................................................................................................................... 38
SHIFTS IN SEASON B 2012 POST-HARVEST LOSSES IF EXCLUDING THE NORTHERN PROVINCE ................. 39
SUMMARY AND EXTENSION RECOMMENDATIONS ................................................................................... 41
GENERAL ................................................................................................................................................. 41
TRAINING ................................................................................................................................................ 41
POST-HARVEST LOSSES MODEL PARAMETER ESTIMATIONS .................................................................. 42
REFERENCES ................................................................................................................................................ 43
LIST OF TABLES ............................................................................................................................................ 44
EXECUTIVE SUMMARY Following the completion of the first baseline survey of postharvest handling and storage of maize in 2011, MinAgri and USAID’s Post-Harvest Handling and Storage (PHHS) - Rwanda undertook two national post-harvest assessments in Season A and Season B of 2012. The Season A survey was administered from May 14-25, 2012 with a total of 637 national surveys. The Season B survey was administered Oct 9-17, 2012 with a total of 416 surveys (in two versions). A third pilot exercise was conducted in 9 districts with 54 farmers in Season A 2013 to verify harvest and drying loss estimates with Season B 2012 questionnaire results.
In Season A, general data were taken on environmental conditions at harvest as well as post-harvest technology use and marketing practices, very similar to data collected in 2011. Post-harvest loss estimates were made for Season A using general parameters and formatting from the African Post-Harvest Losses Information System (APHLIS).
In Season B, this assessment was expanded to gather more detailed information about practices, marketing, grain quality, and farmers’ losses at several key stages of the post-harvest process.
These key stages investigated in Season B 2012 include 1) Harvesting/Field Drying, 2) Further Drying [APHLIS notes ‘platform drying’], and 3) On-farm storage. This was a cross-sectional survey in which farmers recalled events and condition of grain at certain end-use points, aided by a wide range of visual cues in grain damage samples. Five visual samples of maize per enumerator were utilized, with 0, 5, 10, 20, and 30% grain damage. Loss parameters from this survey were targeted to contextualize the APHLIS parameters to the Rwandan environment and serve as better local estimators of post-harvest losses. Recognizing the imperfect nature of cross-sectional data collection for this purpose, the data at a minimum serves to identify key zones of disparity between APHLIS and MinAgri estimates to prioritize the next step of in-depth field data collection.
Both Season A and B surveys note various training courses farmers have taken, which can then be cross-tabulated with technology use and post-harvest practices to note potential influences of extension education.
The Season A 2013 pilot field validation was a physical measurement of discarded and damaged maize during the harvest/drying period. Physical measurement of losses was not possible in the Season B 2012 survey due to late survey timing. Results provide loss estimates for farmers with rainy harvest periods and farmers with dry harvest periods. The validation served to compare methodologies of simple questionnaire (2012B) vs. physical measurement with balances (2013A).
Major findings for each report section are as follows:
Base production, supply parameters, and purchasing
Maize is grown on 78.0% - 98.3% consolidated land primarily as a cash crop. In Season A, 86.7% of national maize grown was marketed and 83.4% was marketed in Season B. At the individual level, 75.1% of farmers sell some maize in Season A and 77.8% in Season B. Farmers generally sell maize locally,
3
either bringing to markets, selling directly to traders, or selling to neighbors. Cooperatives become important or dominant outlets in the South year round and Kigali in Season A.
At the provincial level, maize is stored an average of 2.9 - 4.8 months in Season A, with a national average of 4.1 months. In Season B, maize was stored between 2.7 - 3.9 months, with a national average of 3.2 months. Most marketed maize is sold within three months of harvest, the quantity considered by the APHLIS system to be “sold soon after harvest”, totaling 66% of all maize sold in Season A and 89% in Season B. Farmers report saving maize for consumption as well, with an average of 22.3kg per household member in Season A and 18.9kg per member in Season B.
Nationally, 31.7% of households buy some form of maize in Season A and 45.9% in Season B. Kigali farmers are more likely to buy than any other province. Purchasing in the Eastern province is very uncommon in Season A (3.3%) but quite common in Season B (65.9%). Flour is the dominant exclusive form purchased (85.4% and 64.2%), though grain purchase (or ‘both’) is increases significantly in Season B.
Harvesting Conditions and Practices
Farmers experience more rain at harvest in Season A (56%) than Season B (12%). This has strong implications for post-harvest losses in the harvest and drying stages. Season B survey data go deeper into loss implications. When there is rain at harvest, 40.0% of farmers discard at least some cobs at harvest, while without rain this drops to 25.7%. Farmers in Kigali were more affected (71.4%) while Eastern province farmers had a much lower incidence (9.6%).
Season B 2012 questionnaire data reported farmers discarding a national average of 8.3% of cobs (weighted by provincial production). Provincial averages range from 4.9% in Western Province to 12.6% in the North. When rain is present at harvest, the provincial average quantity of cobs left is consistently higher than in non-rainy conditions. Nationally weighted by provincial production, this totals 9.6% with rain at harvest and 7.8% without. These two parameters are the first utilized in “Harvest/Field Drying” contextualized APHLIS measurements.
The Season A 2013 field verification provided very different parameter estimates than the questionnaire methodology. The questionnaire method asked farmers to recall specific data several months after harvest activities in an imperfect format, while the field verification methodology brought MinAgri agents to farmers’ homes to physically measure damaged and undamaged cobs with a balance. The accuracy of the physical measurement approach is much more reliable and also ultimately judged to more accurately reflect the Rwandan ground realities.
Farmers evaluating combined harvest/drying losses discarded 3.1% of maize cobs in rainy harvest zones and 0.9% in drier harvest zones. The field measurement thus drives a much different overall post-harvest loss estimate than APHLIS, as this general model provides estimates of 16.3% in rainy harvest zones and 6.4% in dry harvest zones.
Losses in the harvest/drying period in rainy harvest regions of the Northern Province at 6.3% were double the national average. Encouragingly, farmers in rainy harvest zones who received training had more than 50% lower harvest/drying losses than producers who did not receive training. This is a very
4
positive sign for education impact and it is recommended to focus harvest/drying education in the rainy harvest zones for maximum future impact.
Drying Practices
Farmers use diverse mechanisms to dry maize, varying greatly by geographic region. In Season A and B, the most common methods were suspended (35% and 28%), on a plastic sheet (30% and 20%), and drying rack or covered platform (27% and 18%). When there is no rain at harvest, farmers report almost no losses (0.4%), however when there is rain this rises considerably (3.7%). These parameters are taken for use in the “Platform Drying” part of the APHLIS model. At the provincial level, this ranges from 0.0% reported losses to 8.3%.
Maize Shelling
Shelling practices remain diverse as well. In both seasons, about half of Rwandan producers use only their hands. This rate is consistently high in the Western Province (76.6% and 90%). Producers receiving training were much more likely to use a mechanical hand sheller (16% compared to 36% in Season A, and 11% to 30% in Season B). Training seems to provide exposure and/or facilitated access to this technology. There is some, albeit weak, evidence that farmers engage less in “beating to shell in sack”, with 7% compared to 3% in Season A and 2% compared to 1% in Season B.
Maize Storage
Maize is more likely to be stored as grain vs. cob when destined for the market in both seasons (83 and 94.6% vs. 72.9 and 81.5%). This corresponds with higher usage of polypropylene sacks for storage. Season B data delves deeper into storage practices. Polypropylene sacks are generally used “new”, however, for both consumed and marketed maize storage, there are groups in the South (18% and 8.2%) and West (13% and 6.5%) who re-use old untreated sacks. This may be an opportunity for further extension education. As well, rates of palette use are consistently lower in the Northern and Western province than others – not just associated with suspended storage. That stated, the North and West are the dominant locations for suspended maize cob storage.
The majority of Rwandan farmers do not use storage protectants. National rates of application are 44.5% in Season A and 38.3% in Season B. This varies tremendously by province and season. In Season A, 80.2% of Eastern province farmers applied while 18.5% did so in the Western province. In Season B, 58.1% of Eastern farmers applied while only 16.7% did in the West. In Season A, farmers receiving training in pesticide application to stores or grain have a large and statistically significant greater application rate (80.0%) than those not receiving education (39.5%). In Season B, 37.5% with training applied while 27.3% without training applied, though the difference is not statistically significant. Training seems particularly responsive in the Western province, where, in Season A, 100% of farmers receiving training applied while only 13.1% without training applied protectants. Malathion is by far the most common storage protectant used, employed by 45.3% and 65.8% of farmers in Season A and B who applied some form of protectant. As Malathion is referred to as “DDT” by many untrained farmers, this market share may be as high as 66.8% in Season A and 75.7% in Season B. Insecticide application may be associated with a slight increase in storage before sale, however less than one week.
5
This study found storage losses in maize which were higher than those predicted by the APHLIS model. To estimate physical (weight) losses, visual samples were used with nine possible quality specifications (including “between” displayed sample levels). While APHLIS predicts zero losses in less than four months of storage, the weighted national average was 4.9% losses in on-farm storage. This parameter is the third and final used in a revised format of the APHLIS losses model.
Within this 4.9% loss, rats composed 2.9%, while insects averaged 1.3% and molds 0.7%. The highest storage losses reported are in Northern (7.6%) and Western (6.2%) provinces, driven primarily by rats. This highlights an important point, as rats rarely receive attention in post-harvest extension education programs. The South reported the highest losses from insects (1.9%), followed by Western province (1.5%). Kigali province actually did report no losses in storage, possibly driven by quick sales of most of the harvest and use of storage protectants. Average damage rates in sold maize (1.1%) were considerably lower than average rates for consumed maize (4.8%). This undoubtedly reflects very rapid sales. There is some evidence that use of insecticide is related to lower damage rates in sold maize (2.0% vs. 0.5%) and consumed maize (5.7% vs. 2.5%).
Extrapolating loss rates with national production, it is estimated that the economic impact of maize storage losses in Season B 2012 alone are between RWF 1.78 – 2.58 Billion. While considerable variance is present, farmers receiving storage training had 28.6% lower storage losses. This reflects a potential benefit of storage education in Season B 2012 of about RWF 300 Million.
Training
About half of farmers reported education in harvesting (50.8 and 49.7%), drying (50.0 and 45.9%), and shelling (42.3 and 41.0%). This average masks great provincial diversity, however, as few to no producers in Kigali province report receiving training. While populations and production are small in Kigali, this is also the province with the highest reported incidence of rain in harvest periods and highest APHLIS loss estimates, and may be a point of attention for education regimens.
Training is particularly low in use of pesticides on grain (11.3 and 11.7%) and use of pesticides on structures (10.2 and 6.1%). As rates of storage protectant application were a significant 40% higher among trained farmers, this could serve as a useful point of attention.
APHLIS Post-Harvest Losses Calculation and comparison with new MinAgri parameter estimates
The national average post-harvest losses, according to the APHLIS system, were 21.1% in Season A and 17.5% in Season B. The increased losses in Season A are driven by higher incidence of rain at harvest as well as breaking the “4 month” storage threshold, at which point modeled APHLIS storage losses increase from 0% to 2.6%. The total APHLIS-calculated losses for the year 2012 is 19.8%.
Parameters from the most accurate MinAgri physical loss evaluations suggest significantly lower losses. With field-measured harvest/drying losses and storage losses assessed through questionnaires and grain samples as visual aids, maize post-harvest losses for Season B 2012 are estimated at 9.1% (±.1.0%). When APHLIS predicts 16.3% total losses for areas without rain at harvest, contextualized Rwandan parameters predict 8.8% (±0.9%). When APHLIS predicts 25.0% for rainy harvest regions,
6
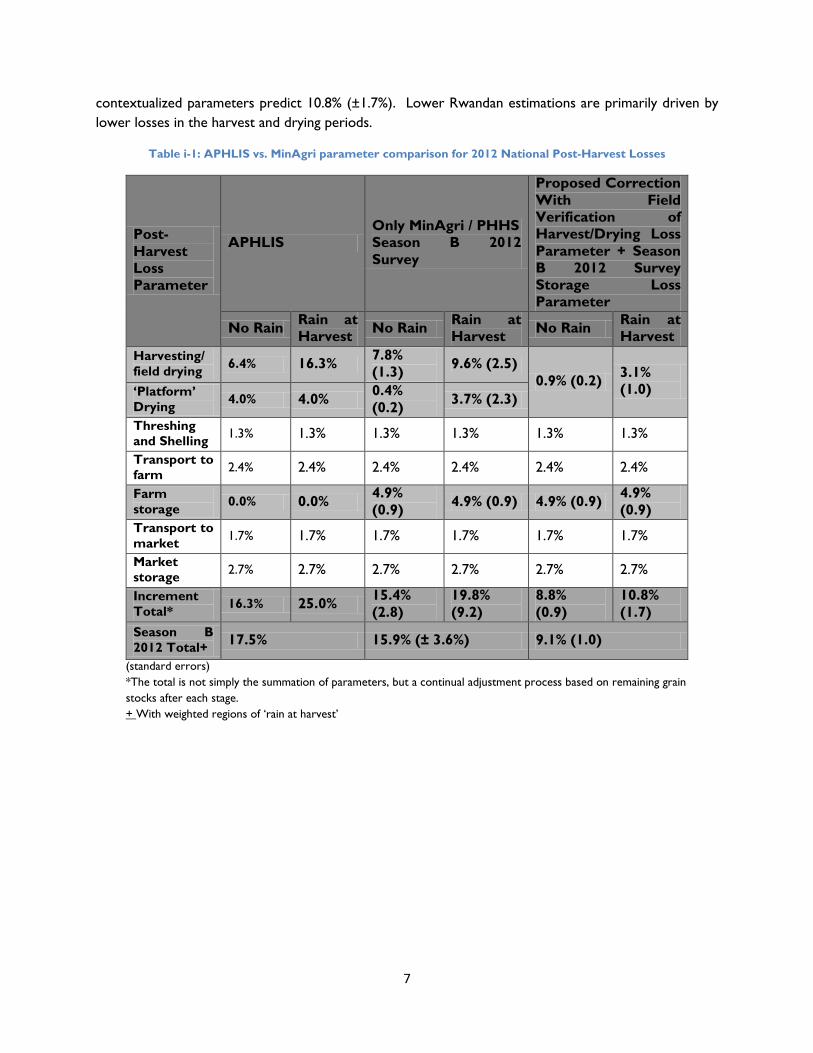
contextualized parameters predict 10.8% (±1.7%). Lower Rwandan estimations are primarily driven by lower losses in the harvest and drying periods.
Table i-1: APHLIS vs. MinAgri parameter comparison for 2012 National Post-Harvest Losses
Post-Harvest Loss Parameter
APHLIS Only MinAgri / PHHS Season B 2012 Survey
Proposed Correction With Field Verification of Harvest/Drying Loss Parameter + Season B 2012 Survey Storage Loss Parameter
No Rain Rain at Harvest No Rain Rain at
Harvest No Rain Rain at Harvest
Harvesting/ field drying 6.4% 16.3% 7.8%
(1.3) 9.6% (2.5) 0.9% (0.2) 3.1%
(1.0) ‘Platform’ Drying 4.0% 4.0% 0.4%
(0.2) 3.7% (2.3)
Threshing and Shelling 1.3% 1.3% 1.3% 1.3% 1.3% 1.3%
Transport to farm 2.4% 2.4% 2.4% 2.4% 2.4% 2.4%
Farm storage 0.0% 0.0% 4.9%
(0.9) 4.9% (0.9) 4.9% (0.9) 4.9% (0.9)
Transport to market 1.7% 1.7% 1.7% 1.7% 1.7% 1.7%
Market storage 2.7% 2.7% 2.7% 2.7% 2.7% 2.7%
Increment Total* 16.3% 25.0% 15.4%
(2.8) 19.8% (9.2)
8.8% (0.9)
10.8% (1.7)
Season B 2012 Total+ 17.5% 15.9% (± 3.6%) 9.1% (1.0)
(standard errors) *The total is not simply the summation of parameters, but a continual adjustment process based on remaining grain stocks after each stage. + With weighted regions of ‘rain at harvest’
7
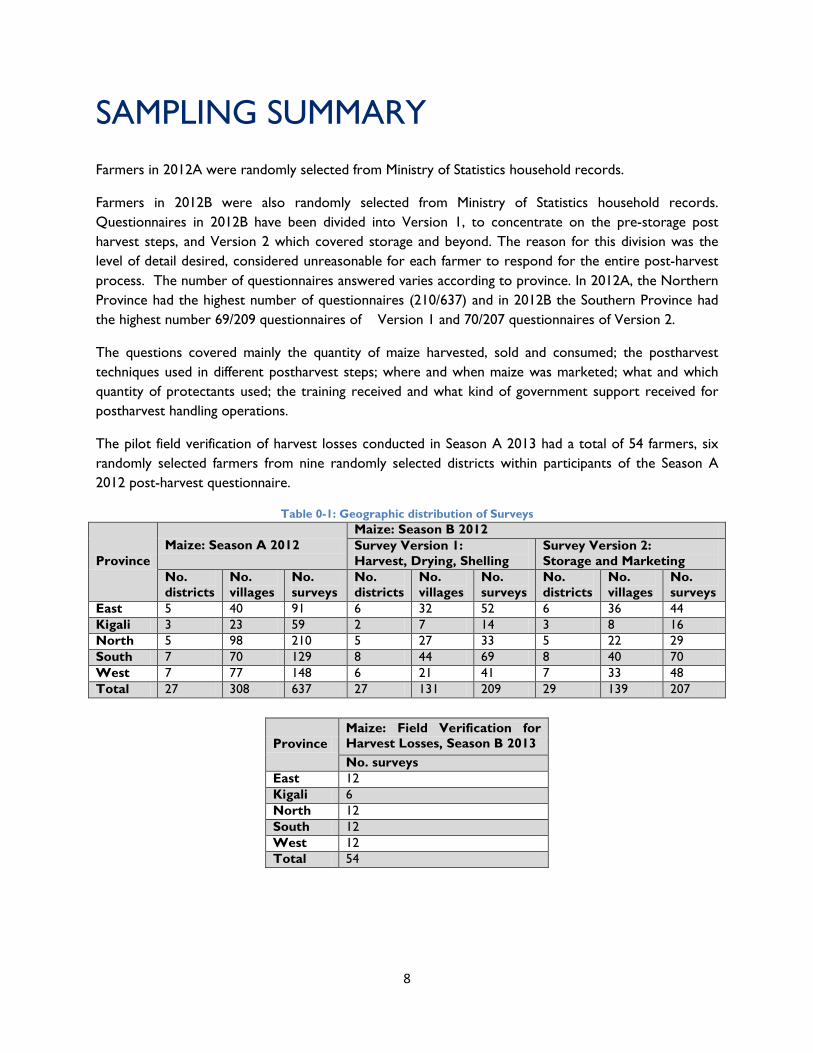
SAMPLING SUMMARY Farmers in 2012A were randomly selected from Ministry of Statistics household records.
Farmers in 2012B were also randomly selected from Ministry of Statistics household records. Questionnaires in 2012B have been divided into Version 1, to concentrate on the pre-storage post harvest steps, and Version 2 which covered storage and beyond. The reason for this division was the level of detail desired, considered unreasonable for each farmer to respond for the entire post-harvest process. The number of questionnaires answered varies according to province. In 2012A, the Northern Province had the highest number of questionnaires (210/637) and in 2012B the Southern Province had the highest number 69/209 questionnaires of Version 1 and 70/207 questionnaires of Version 2.
The questions covered mainly the quantity of maize harvested, sold and consumed; the postharvest techniques used in different postharvest steps; where and when maize was marketed; what and which quantity of protectants used; the training received and what kind of government support received for postharvest handling operations.
The pilot field verification of harvest losses conducted in Season A 2013 had a total of 54 farmers, six randomly selected farmers from nine randomly selected districts within participants of the Season A 2012 post-harvest questionnaire.
Table 0-1: Geographic distribution of Surveys
Province Maize: Season A 2012
Maize: Season B 2012 Survey Version 1: Harvest, Drying, Shelling
Survey Version 2: Storage and Marketing
No. districts
No. villages
No. surveys
No. districts
No. villages
No. surveys
No. districts
No. villages
No. surveys
East 5 40 91 6 32 52 6 36 44 Kigali 3 23 59 2 7 14 3 8 16 North 5 98 210 5 27 33 5 22 29 South 7 70 129 8 44 69 8 40 70 West 7 77 148 6 21 41 7 33 48 Total 27 308 637 27 131 209 29 139 207
Province Maize: Field Verification for Harvest Losses, Season B 2013 No. surveys
East 12 Kigali 6 North 12 South 12 West 12 Total 54
8
KEY BASE PRODUCTION AND SUPPLY PARAMETERS Nationally, average area of maize cultivation is quite similar for Season A and B, at 0.73 and 0.67 hectares, respectively. Almost all farmers are cultivating on consolidated land. In Season A, only the Eastern and Western province drops below 80% consolidated land production. In Season B, only Kigali province drops below 90%. Green maize is harvested by nearly half of national farmers in both seasons, though farmers may have an incentive to under-report this quantity due to official restrictions. However, reported green maize harvested only composes a small percentage of total maize production, at 1.3 and 0.9 bags in Seasons A and B. Average households successfully harvested 1,014kg in Season A with highest productions per household in Eastern and Kigali province. In the comparatively minor Season B, households harvested 725kg, with the greatest production in Eastern province. Reported yields averaged 1,504kg/ha in 1,344kg/ha in Seasons A and B, respectively. Notable outliers in provincial yield data are Kigali province in Season A, reporting 3,050kg/Ha, and Western province in Season B, reporting 699kg/Ha.
Maize in Rwanda is largely grown as a cash crop. In Season A, households sold or intended to sell 87% of maize production, similar to nearly 84% in Season B. About two-thirds (66%) of maize sold in Season A was sold before 3 months, the period designated by the African Post-Harvest Losses Information System (APHLIS) as “soon after harvest”. In Season B, maize sold “soon after harvest” increases to 89%. Notably, maize stored for market longer than 3 months composed more than half (59.6%) of maize sold by Eastern province households and just less than half (48.6%) in Southern province in Season A. In Season B, this shrinks to 15.5% in the Eastern province and 4.3% in the Southern province.
Reported maize per person retained for consumption is similar in Seasons A and B, at 22.3kg and 18.9kg, respectively. Average storage time for all maize was 4.1 and 3.2 months in Season A and B, respectively.
9
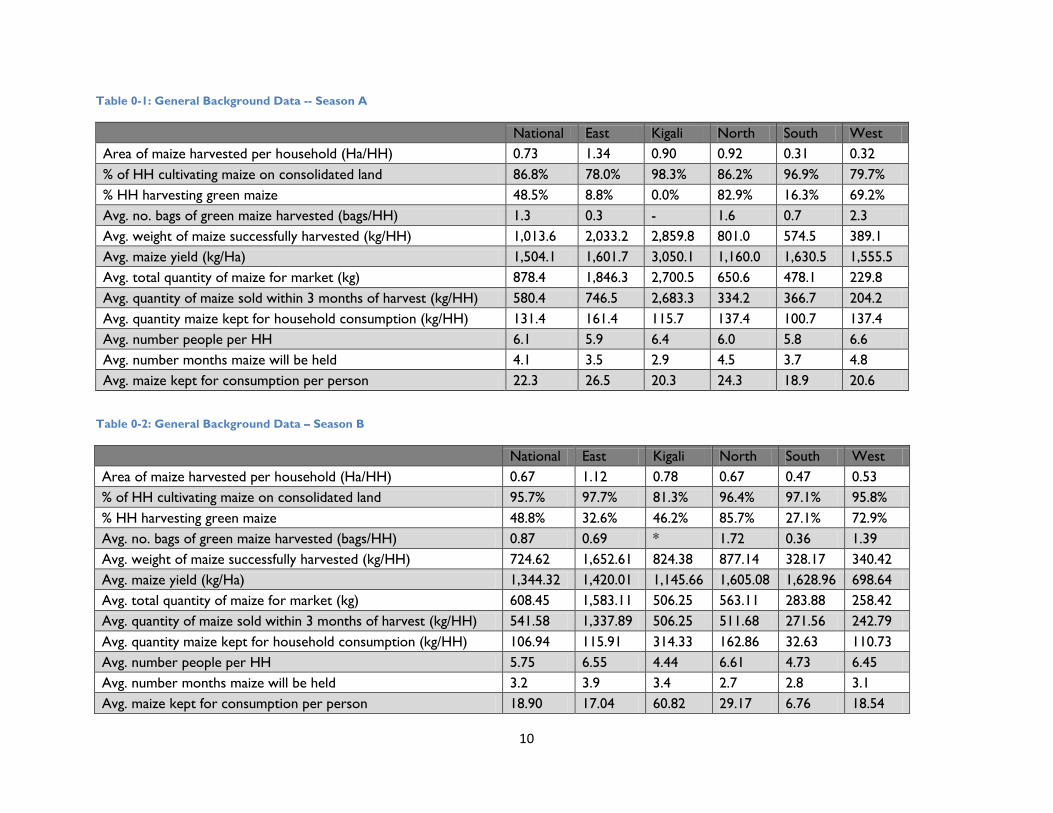
Table 0-1: General Background Data -- Season A
National East Kigali North South West
Area of maize harvested per household (Ha/HH) 0.73 1.34 0.90 0.92 0.31 0.32 % of HH cultivating maize on consolidated land 86.8% 78.0% 98.3% 86.2% 96.9% 79.7% % HH harvesting green maize 48.5% 8.8% 0.0% 82.9% 16.3% 69.2% Avg. no. bags of green maize harvested (bags/HH) 1.3 0.3 - 1.6 0.7 2.3 Avg. weight of maize successfully harvested (kg/HH) 1,013.6 2,033.2 2,859.8 801.0 574.5 389.1 Avg. maize yield (kg/Ha) 1,504.1 1,601.7 3,050.1 1,160.0 1,630.5 1,555.5 Avg. total quantity of maize for market (kg) 878.4 1,846.3 2,700.5 650.6 478.1 229.8 Avg. quantity of maize sold within 3 months of harvest (kg/HH) 580.4 746.5 2,683.3 334.2 366.7 204.2 Avg. quantity maize kept for household consumption (kg/HH) 131.4 161.4 115.7 137.4 100.7 137.4 Avg. number people per HH 6.1 5.9 6.4 6.0 5.8 6.6 Avg. number months maize will be held 4.1 3.5 2.9 4.5 3.7 4.8 Avg. maize kept for consumption per person 22.3 26.5 20.3 24.3 18.9 20.6
Table 0-2: General Background Data – Season B
National East Kigali North South West
Area of maize harvested per household (Ha/HH) 0.67 1.12 0.78 0.67 0.47 0.53 % of HH cultivating maize on consolidated land 95.7% 97.7% 81.3% 96.4% 97.1% 95.8% % HH harvesting green maize 48.8% 32.6% 46.2% 85.7% 27.1% 72.9% Avg. no. bags of green maize harvested (bags/HH) 0.87 0.69 * 1.72 0.36 1.39 Avg. weight of maize successfully harvested (kg/HH) 724.62 1,652.61 824.38 877.14 328.17 340.42 Avg. maize yield (kg/Ha) 1,344.32 1,420.01 1,145.66 1,605.08 1,628.96 698.64 Avg. total quantity of maize for market (kg) 608.45 1,583.11 506.25 563.11 283.88 258.42 Avg. quantity of maize sold within 3 months of harvest (kg/HH) 541.58 1,337.89 506.25 511.68 271.56 242.79 Avg. quantity maize kept for household consumption (kg/HH) 106.94 115.91 314.33 162.86 32.63 110.73 Avg. number people per HH 5.75 6.55 4.44 6.61 4.73 6.45 Avg. number months maize will be held 3.2 3.9 3.4 2.7 2.8 3.1 Avg. maize kept for consumption per person 18.90 17.04 60.82 29.17 6.76 18.54
10
MAIZE PURCHASING
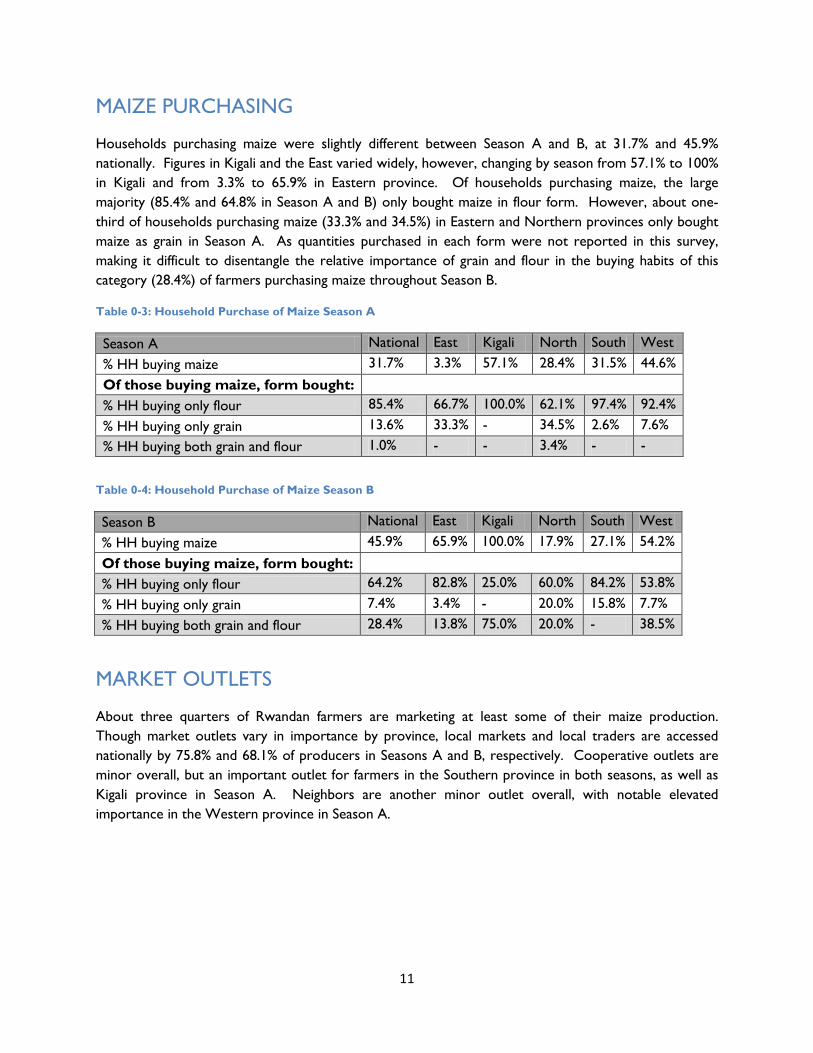
Households purchasing maize were slightly different between Season A and B, at 31.7% and 45.9% nationally. Figures in Kigali and the East varied widely, however, changing by season from 57.1% to 100% in Kigali and from 3.3% to 65.9% in Eastern province. Of households purchasing maize, the large majority (85.4% and 64.8% in Season A and B) only bought maize in flour form. However, about one-third of households purchasing maize (33.3% and 34.5%) in Eastern and Northern provinces only bought maize as grain in Season A. As quantities purchased in each form were not reported in this survey, making it difficult to disentangle the relative importance of grain and flour in the buying habits of this category (28.4%) of farmers purchasing maize throughout Season B.
Table 0-3: Household Purchase of Maize Season A
Season A National East Kigali North South West % HH buying maize 31.7% 3.3% 57.1% 28.4% 31.5% 44.6%
Of those buying maize, form bought: % HH buying only flour 85.4% 66.7% 100.0% 62.1% 97.4% 92.4%
% HH buying only grain 13.6% 33.3% - 34.5% 2.6% 7.6% % HH buying both grain and flour 1.0% - - 3.4% - -
Table 0-4: Household Purchase of Maize Season B
Season B National East Kigali North South West % HH buying maize 45.9% 65.9% 100.0% 17.9% 27.1% 54.2%
Of those buying maize, form bought: % HH buying only flour 64.2% 82.8% 25.0% 60.0% 84.2% 53.8%
% HH buying only grain 7.4% 3.4% - 20.0% 15.8% 7.7%
% HH buying both grain and flour 28.4% 13.8% 75.0% 20.0% - 38.5%
MARKET OUTLETS
About three quarters of Rwandan farmers are marketing at least some of their maize production. Though market outlets vary in importance by province, local markets and local traders are accessed nationally by 75.8% and 68.1% of producers in Seasons A and B, respectively. Cooperative outlets are minor overall, but an important outlet for farmers in the Southern province in both seasons, as well as Kigali province in Season A. Neighbors are another minor outlet overall, with notable elevated importance in the Western province in Season A.
11

Table 0-5: Maize Market Outlets Season A
Season A Selling Maize
Market Outlet Co-operatives
Local market
Local trader
National trader
Neighbor RADA Market outside Rwanda
National 75.1% 16.3% 54.9% 20.9% - 13.4% 4.3% 0.2%
East 83.0% 13.3% 65.3% 21.3% - - - -
Kigali 91.1% 39.2% 5.9% 54.9% - - - -
North 78.1% 0.7% 79.3% 15.2% - 16.6% 0.7% - South 69.8% 36.0% 29.3% 16.0% - 10.7% 24.0% - West 64.9% 14.7% 55.8% 14.7% - 28.4% - 1.1%
Table 0-6: Maize Market Outlets Season B
Season B Selling Maize
Market Outlet Co-operatives
Local market
Local trader
National trader
Neighbor RADA Market outside Rwanda
National 77.8% 28.6% 38.8% 29.3% 4.1% 6.1% 2.0% -
East 90.9% 15.0% 42.5% 37.5% 5.0% 2.5% - -
Kigali 81.3% - 100.0% - - - - -
North 67.9% - 50.0% 50.0% - 16.7% - - South 77.1% 64.8% 20.4% 9.3% - 1.9% 3.7% -
West 70.8% 3.6% 46.4% 46.4% 7.1% 14.3% 3.6% -
12
HARVESTING CONDITIONS, PRACTICES, AND LOSSES Harvest conditions, confirming common knowledge, were much wetter for farmers in Season A 2012 (56%) than Season B 2012 (12%). In Season A, rain at harvest was a particular problem for farmers in Kigali, Southern, and Western provinces. In Season B, farmers in Kigali and Western provinces had higher relative rates of rain at harvest.
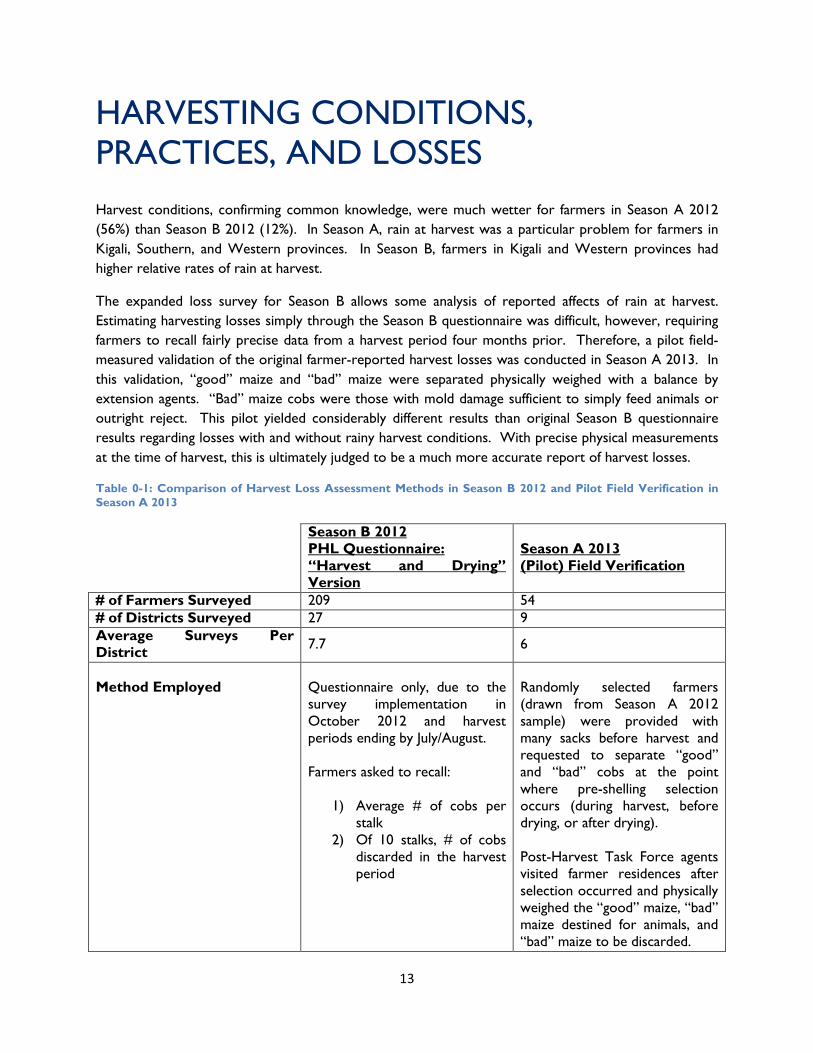
The expanded loss survey for Season B allows some analysis of reported affects of rain at harvest. Estimating harvesting losses simply through the Season B questionnaire was difficult, however, requiring farmers to recall fairly precise data from a harvest period four months prior. Therefore, a pilot field-measured validation of the original farmer-reported harvest losses was conducted in Season A 2013. In this validation, “good” maize and “bad” maize were separated physically weighed with a balance by extension agents. “Bad” maize cobs were those with mold damage sufficient to simply feed animals or outright reject. This pilot yielded considerably different results than original Season B questionnaire results regarding losses with and without rainy harvest conditions. With precise physical measurements at the time of harvest, this is ultimately judged to be a much more accurate report of harvest losses.
Table 0-1: Comparison of Harvest Loss Assessment Methods in Season B 2012 and Pilot Field Verification in Season A 2013
Season B 2012 PHL Questionnaire: “Harvest and Drying” Version
Season A 2013 (Pilot) Field Verification
# of Farmers Surveyed 209 54 # of Districts Surveyed 27 9 Average Surveys Per District 7.7 6
Method Employed
Questionnaire only, due to the survey implementation in October 2012 and harvest periods ending by July/August. Farmers asked to recall:
1) Average # of cobs per stalk
2) Of 10 stalks, # of cobs discarded in the harvest period
Randomly selected farmers (drawn from Season A 2012 sample) were provided with many sacks before harvest and requested to separate “good” and “bad” cobs at the point where pre-shelling selection occurs (during harvest, before drying, or after drying). Post-Harvest Task Force agents visited farmer residences after selection occurred and physically weighed the “good” maize, “bad” maize destined for animals, and “bad” maize to be discarded.
13
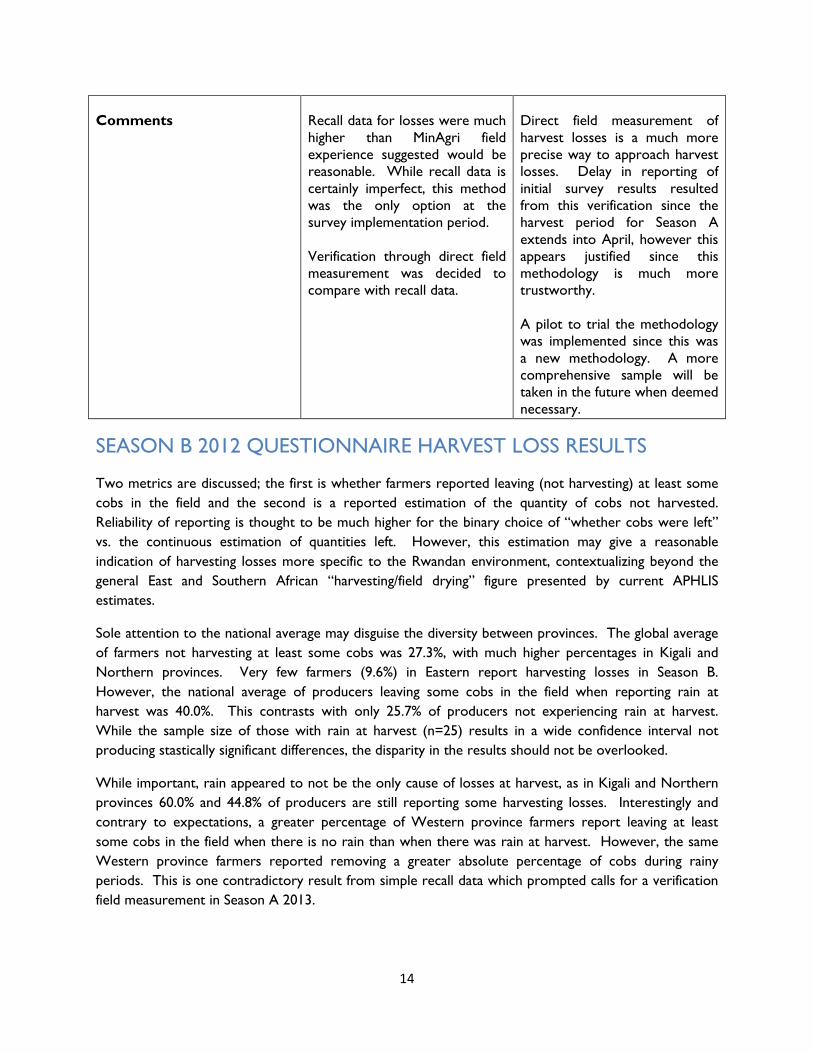
Comments
Recall data for losses were much higher than MinAgri field experience suggested would be reasonable. While recall data is certainly imperfect, this method was the only option at the survey implementation period. Verification through direct field measurement was decided to compare with recall data.
Direct field measurement of harvest losses is a much more precise way to approach harvest losses. Delay in reporting of initial survey results resulted from this verification since the harvest period for Season A extends into April, however this appears justified since this methodology is much more trustworthy. A pilot to trial the methodology was implemented since this was a new methodology. A more comprehensive sample will be taken in the future when deemed necessary.
SEASON B 2012 QUESTIONNAIRE HARVEST LOSS RESULTS
Two metrics are discussed; the first is whether farmers reported leaving (not harvesting) at least some cobs in the field and the second is a reported estimation of the quantity of cobs not harvested. Reliability of reporting is thought to be much higher for the binary choice of “whether cobs were left” vs. the continuous estimation of quantities left. However, this estimation may give a reasonable indication of harvesting losses more specific to the Rwandan environment, contextualizing beyond the general East and Southern African “harvesting/field drying” figure presented by current APHLIS estimates.
Sole attention to the national average may disguise the diversity between provinces. The global average of farmers not harvesting at least some cobs was 27.3%, with much higher percentages in Kigali and Northern provinces. Very few farmers (9.6%) in Eastern report harvesting losses in Season B. However, the national average of producers leaving some cobs in the field when reporting rain at harvest was 40.0%. This contrasts with only 25.7% of producers not experiencing rain at harvest. While the sample size of those with rain at harvest (n=25) results in a wide confidence interval not producing stastically significant differences, the disparity in the results should not be overlooked.
While important, rain appeared to not be the only cause of losses at harvest, as in Kigali and Northern provinces 60.0% and 44.8% of producers are still reporting some harvesting losses. Interestingly and contrary to expectations, a greater percentage of Western province farmers report leaving at least some cobs in the field when there is no rain than when there was rain at harvest. However, the same Western province farmers reported removing a greater absolute percentage of cobs during rainy periods. This is one contradictory result from simple recall data which prompted calls for a verification field measurement in Season A 2013.
14
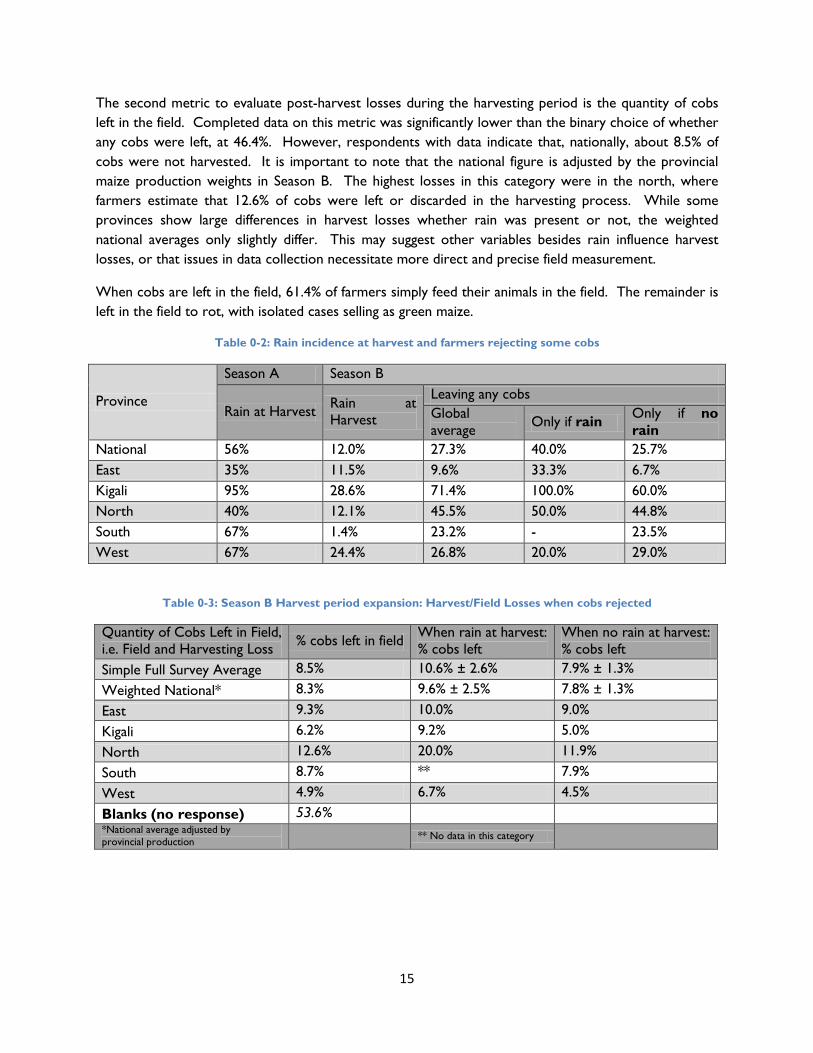
The second metric to evaluate post-harvest losses during the harvesting period is the quantity of cobs left in the field. Completed data on this metric was significantly lower than the binary choice of whether any cobs were left, at 46.4%. However, respondents with data indicate that, nationally, about 8.5% of cobs were not harvested. It is important to note that the national figure is adjusted by the provincial maize production weights in Season B. The highest losses in this category were in the north, where farmers estimate that 12.6% of cobs were left or discarded in the harvesting process. While some provinces show large differences in harvest losses whether rain was present or not, the weighted national averages only slightly differ. This may suggest other variables besides rain influence harvest losses, or that issues in data collection necessitate more direct and precise field measurement.
When cobs are left in the field, 61.4% of farmers simply feed their animals in the field. The remainder is left in the field to rot, with isolated cases selling as green maize.
Table 0-2: Rain incidence at harvest and farmers rejecting some cobs
Province
Season A Season B
Rain at Harvest Rain at Harvest
Leaving any cobs Global average Only if rain Only if no
rain National 56% 12.0% 27.3% 40.0% 25.7% East 35% 11.5% 9.6% 33.3% 6.7% Kigali 95% 28.6% 71.4% 100.0% 60.0% North 40% 12.1% 45.5% 50.0% 44.8% South 67% 1.4% 23.2% - 23.5% West 67% 24.4% 26.8% 20.0% 29.0%
Table 0-3: Season B Harvest period expansion: Harvest/Field Losses when cobs rejected
Quantity of Cobs Left in Field, i.e. Field and Harvesting Loss % cobs left in field When rain at harvest:
% cobs left When no rain at harvest: % cobs left
Simple Full Survey Average 8.5% 10.6% ± 2.6% 7.9% ± 1.3%
Weighted National* 8.3% 9.6% ± 2.5% 7.8% ± 1.3%
East 9.3% 10.0% 9.0% Kigali 6.2% 9.2% 5.0%
North 12.6% 20.0% 11.9% South 8.7% ** 7.9%
West 4.9% 6.7% 4.5%
Blanks (no response) 53.6% *National average adjusted by provincial production ** No data in this category
15
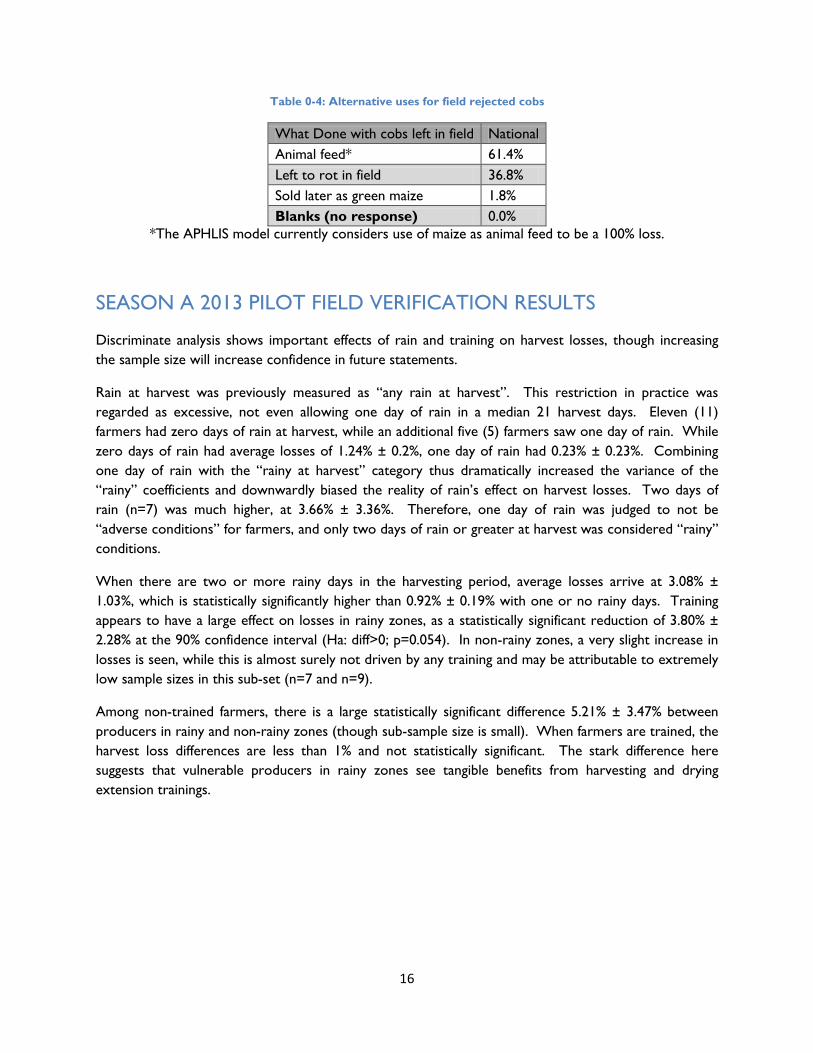
Table 0-4: Alternative uses for field rejected cobs
What Done with cobs left in field National Animal feed* 61.4% Left to rot in field 36.8% Sold later as green maize 1.8% Blanks (no response) 0.0%
*The APHLIS model currently considers use of maize as animal feed to be a 100% loss.
SEASON A 2013 PILOT FIELD VERIFICATION RESULTS
Discriminate analysis shows important effects of rain and training on harvest losses, though increasing the sample size will increase confidence in future statements.
Rain at harvest was previously measured as “any rain at harvest”. This restriction in practice was regarded as excessive, not even allowing one day of rain in a median 21 harvest days. Eleven (11) farmers had zero days of rain at harvest, while an additional five (5) farmers saw one day of rain. While zero days of rain had average losses of 1.24% ± 0.2%, one day of rain had 0.23% ± 0.23%. Combining one day of rain with the “rainy at harvest” category thus dramatically increased the variance of the “rainy” coefficients and downwardly biased the reality of rain’s effect on harvest losses. Two days of rain (n=7) was much higher, at 3.66% ± 3.36%. Therefore, one day of rain was judged to not be “adverse conditions” for farmers, and only two days of rain or greater at harvest was considered “rainy” conditions.
When there are two or more rainy days in the harvesting period, average losses arrive at 3.08% ± 1.03%, which is statistically significantly higher than 0.92% ± 0.19% with one or no rainy days. Training appears to have a large effect on losses in rainy zones, as a statistically significant reduction of 3.80% ± 2.28% at the 90% confidence interval (Ha: diff>0; p=0.054). In non-rainy zones, a very slight increase in losses is seen, while this is almost surely not driven by any training and may be attributable to extremely low sample sizes in this sub-set (n=7 and n=9).
Among non-trained farmers, there is a large statistically significant difference 5.21% ± 3.47% between producers in rainy and non-rainy zones (though sub-sample size is small). When farmers are trained, the harvest loss differences are less than 1% and not statistically significant. The stark difference here suggests that vulnerable producers in rainy zones see tangible benefits from harvesting and drying extension trainings.
16
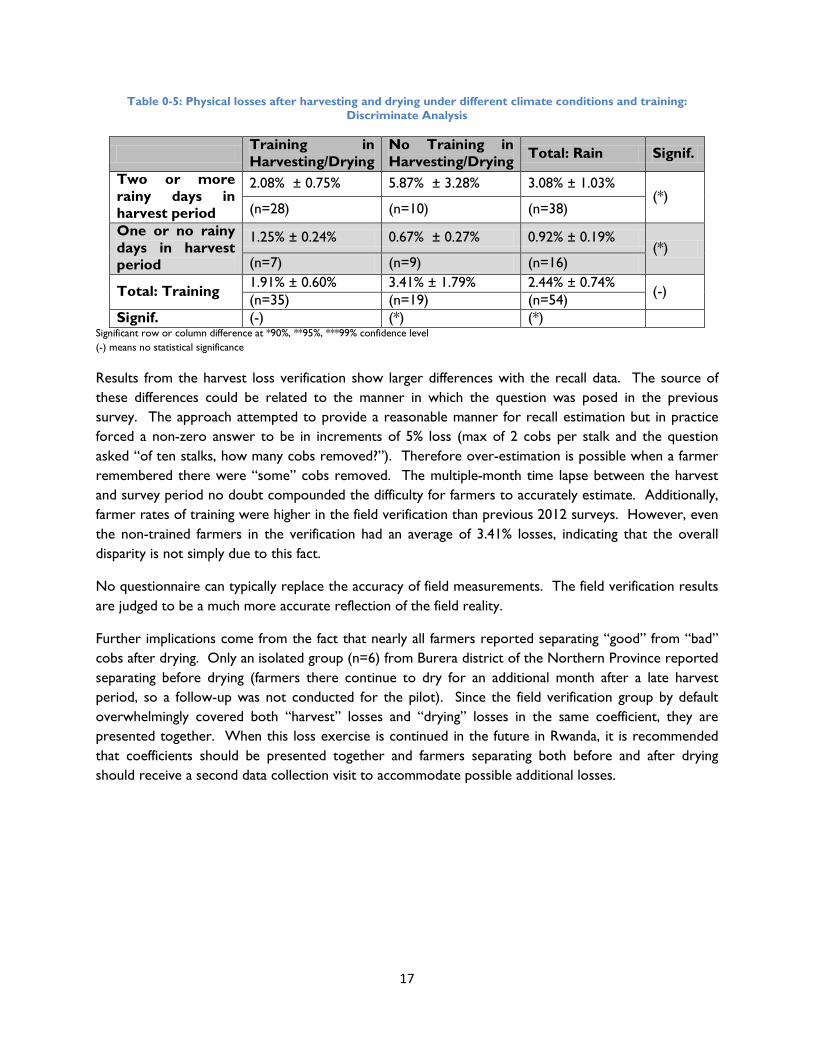
Table 0-5: Physical losses after harvesting and drying under different climate conditions and training: Discriminate Analysis
Training in Harvesting/Drying
No Training in Harvesting/Drying Total: Rain Signif.
Two or more rainy days in harvest period
2.08% ± 0.75% 5.87% ± 3.28% 3.08% ± 1.03% (*)
(n=28) (n=10) (n=38) One or no rainy days in harvest period
1.25% ± 0.24% 0.67% ± 0.27% 0.92% ± 0.19% (*)
(n=7) (n=9) (n=16)
Total: Training 1.91% ± 0.60% 3.41% ± 1.79% 2.44% ± 0.74% (-) (n=35) (n=19) (n=54)
Signif. (-) (*) (*) Significant row or column difference at *90%, **95%, ***99% confidence level (-) means no statistical significance
Results from the harvest loss verification show larger differences with the recall data. The source of these differences could be related to the manner in which the question was posed in the previous survey. The approach attempted to provide a reasonable manner for recall estimation but in practice forced a non-zero answer to be in increments of 5% loss (max of 2 cobs per stalk and the question asked “of ten stalks, how many cobs removed?”). Therefore over-estimation is possible when a farmer remembered there were “some” cobs removed. The multiple-month time lapse between the harvest and survey period no doubt compounded the difficulty for farmers to accurately estimate. Additionally, farmer rates of training were higher in the field verification than previous 2012 surveys. However, even the non-trained farmers in the verification had an average of 3.41% losses, indicating that the overall disparity is not simply due to this fact.
No questionnaire can typically replace the accuracy of field measurements. The field verification results are judged to be a much more accurate reflection of the field reality.
Further implications come from the fact that nearly all farmers reported separating “good” from “bad” cobs after drying. Only an isolated group (n=6) from Burera district of the Northern Province reported separating before drying (farmers there continue to dry for an additional month after a late harvest period, so a follow-up was not conducted for the pilot). Since the field verification group by default overwhelmingly covered both “harvest” losses and “drying” losses in the same coefficient, they are presented together. When this loss exercise is continued in the future in Rwanda, it is recommended that coefficients should be presented together and farmers separating both before and after drying should receive a second data collection visit to accommodate possible additional losses.
17
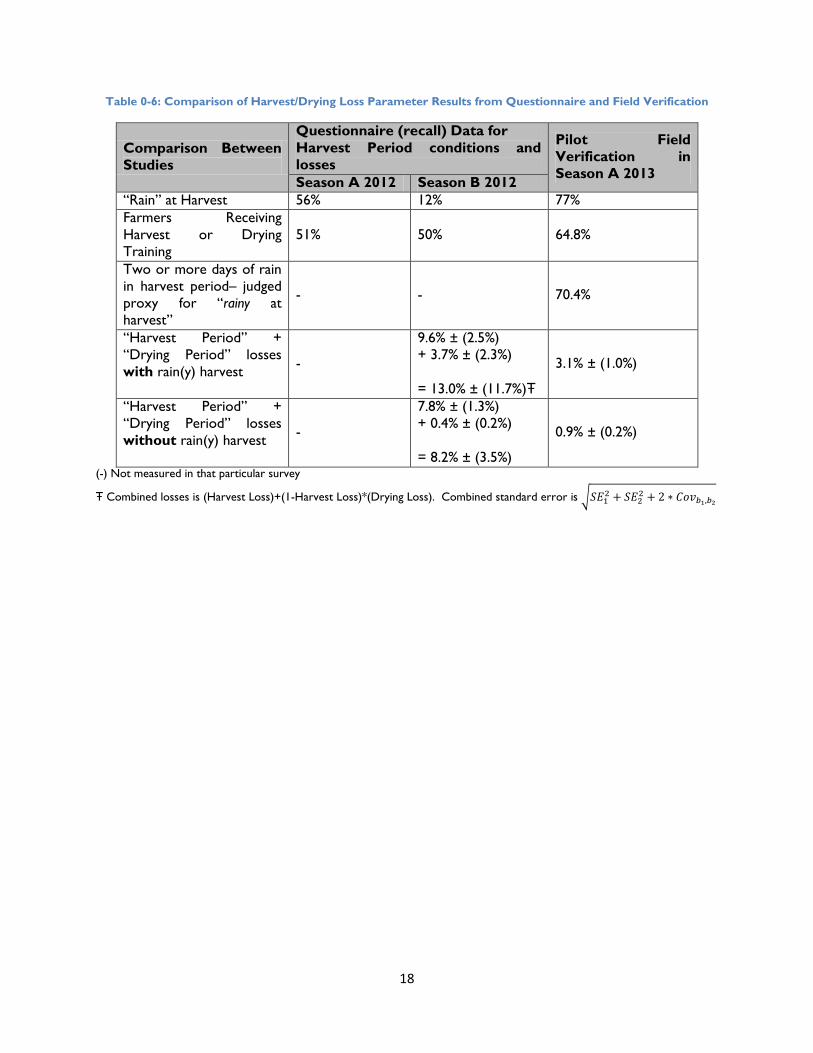
Table 0-6: Comparison of Harvest/Drying Loss Parameter Results from Questionnaire and Field Verification
Comparison Between Studies
Questionnaire (recall) Data for Harvest Period conditions and losses
Pilot Field Verification in Season A 2013 Season A 2012 Season B 2012
“Rain” at Harvest 56% 12% 77% Farmers Receiving Harvest or Drying Training
51% 50% 64.8%
Two or more days of rain in harvest period– judged proxy for “rainy at harvest”
- - 70.4%
“Harvest Period” + “Drying Period” losses with rain(y) harvest
-
9.6% ± (2.5%) + 3.7% ± (2.3%) = 13.0% ± (11.7%)Ŧ
3.1% ± (1.0%)
“Harvest Period” + “Drying Period” losses without rain(y) harvest
-
7.8% ± (1.3%) + 0.4% ± (0.2%) = 8.2% ± (3.5%)
0.9% ± (0.2%)
(-) Not measured in that particular survey
Ŧ Combined losses is (Harvest Loss)+(1-Harvest Loss)*(Drying Loss). Combined standard error is �𝑆𝐸12 + 𝑆𝐸22 + 2 ∗ 𝐶𝑜𝑣𝑏1,𝑏2
18
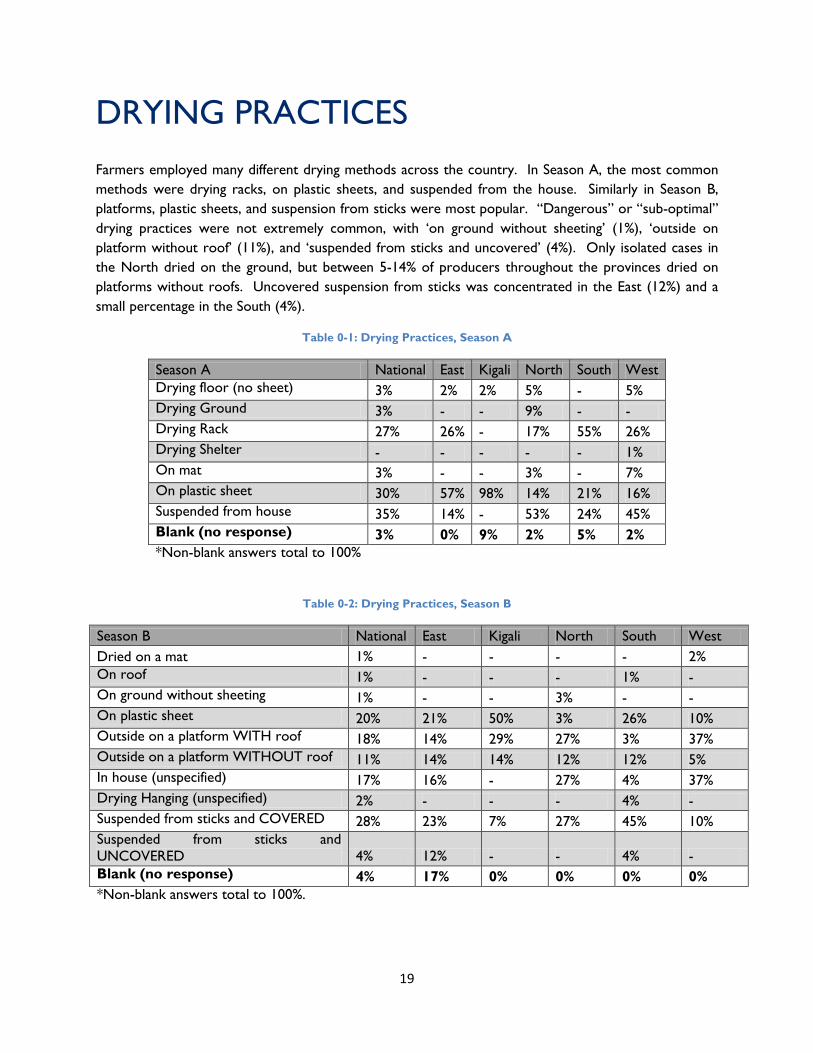
DRYING PRACTICES Farmers employed many different drying methods across the country. In Season A, the most common methods were drying racks, on plastic sheets, and suspended from the house. Similarly in Season B, platforms, plastic sheets, and suspension from sticks were most popular. “Dangerous” or “sub-optimal” drying practices were not extremely common, with ‘on ground without sheeting’ (1%), ‘outside on platform without roof’ (11%), and ‘suspended from sticks and uncovered’ (4%). Only isolated cases in the North dried on the ground, but between 5-14% of producers throughout the provinces dried on platforms without roofs. Uncovered suspension from sticks was concentrated in the East (12%) and a small percentage in the South (4%).
Table 0-1: Drying Practices, Season A
Season A National East Kigali North South West Drying floor (no sheet) 3% 2% 2% 5% - 5% Drying Ground 3% - - 9% - - Drying Rack 27% 26% - 17% 55% 26% Drying Shelter - - - - - 1% On mat 3% - - 3% - 7% On plastic sheet 30% 57% 98% 14% 21% 16% Suspended from house 35% 14% - 53% 24% 45% Blank (no response) 3% 0% 9% 2% 5% 2% *Non-blank answers total to 100%
Table 0-2: Drying Practices, Season B
Season B National East Kigali North South West Dried on a mat 1% - - - - 2% On roof 1% - - - 1% - On ground without sheeting 1% - - 3% - - On plastic sheet 20% 21% 50% 3% 26% 10% Outside on a platform WITH roof 18% 14% 29% 27% 3% 37% Outside on a platform WITHOUT roof 11% 14% 14% 12% 12% 5% In house (unspecified) 17% 16% - 27% 4% 37% Drying Hanging (unspecified) 2% - - - 4% - Suspended from sticks and COVERED 28% 23% 7% 27% 45% 10% Suspended from sticks and UNCOVERED 4% 12% - - 4% - Blank (no response) 4% 17% 0% 0% 0% 0% *Non-blank answers total to 100%.
19
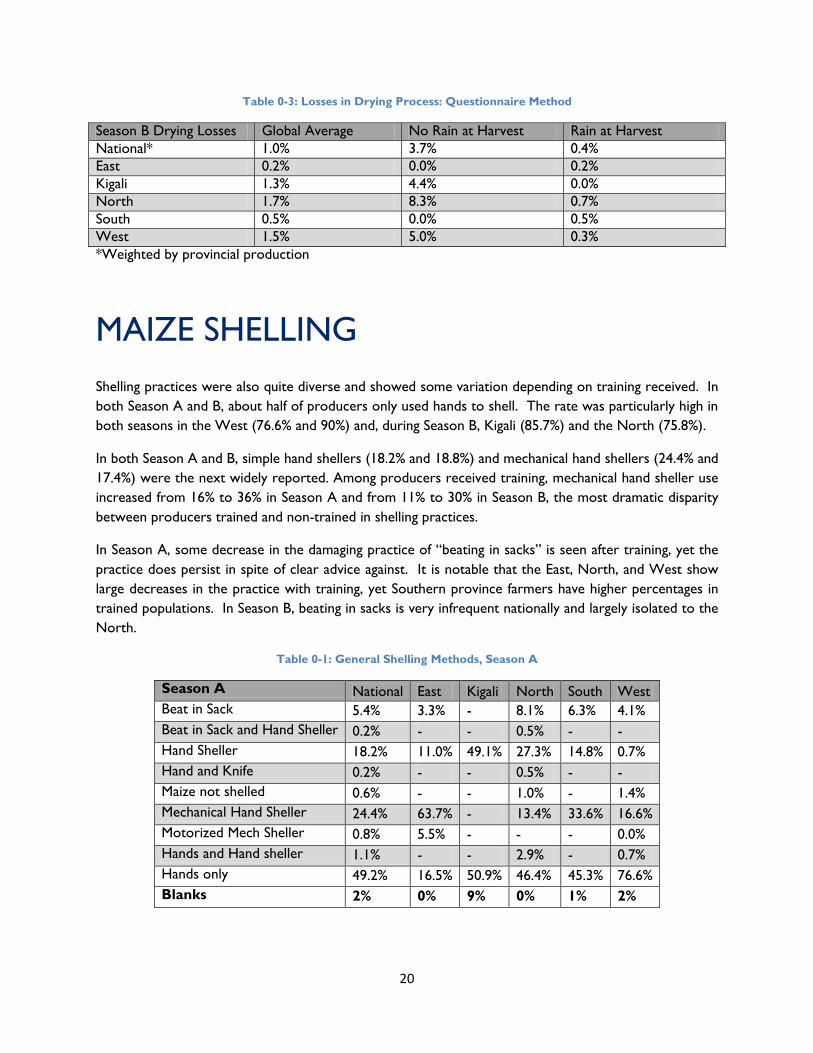
Table 0-3: Losses in Drying Process: Questionnaire Method
Season B Drying Losses Global Average No Rain at Harvest Rain at Harvest National* 1.0% 3.7% 0.4% East 0.2% 0.0% 0.2% Kigali 1.3% 4.4% 0.0% North 1.7% 8.3% 0.7% South 0.5% 0.0% 0.5% West 1.5% 5.0% 0.3% *Weighted by provincial production
MAIZE SHELLING Shelling practices were also quite diverse and showed some variation depending on training received. In both Season A and B, about half of producers only used hands to shell. The rate was particularly high in both seasons in the West (76.6% and 90%) and, during Season B, Kigali (85.7%) and the North (75.8%).
In both Season A and B, simple hand shellers (18.2% and 18.8%) and mechanical hand shellers (24.4% and 17.4%) were the next widely reported. Among producers received training, mechanical hand sheller use increased from 16% to 36% in Season A and from 11% to 30% in Season B, the most dramatic disparity between producers trained and non-trained in shelling practices.
In Season A, some decrease in the damaging practice of “beating in sacks” is seen after training, yet the practice does persist in spite of clear advice against. It is notable that the East, North, and West show large decreases in the practice with training, yet Southern province farmers have higher percentages in trained populations. In Season B, beating in sacks is very infrequent nationally and largely isolated to the North.
Table 0-1: General Shelling Methods, Season A
Season A National East Kigali North South West Beat in Sack 5.4% 3.3% - 8.1% 6.3% 4.1% Beat in Sack and Hand Sheller 0.2% - - 0.5% - - Hand Sheller 18.2% 11.0% 49.1% 27.3% 14.8% 0.7% Hand and Knife 0.2% - - 0.5% - - Maize not shelled 0.6% - - 1.0% - 1.4% Mechanical Hand Sheller 24.4% 63.7% - 13.4% 33.6% 16.6% Motorized Mech Sheller 0.8% 5.5% - - - 0.0% Hands and Hand sheller 1.1% - - 2.9% - 0.7% Hands only 49.2% 16.5% 50.9% 46.4% 45.3% 76.6% Blanks 2% 0% 9% 0% 1% 2%
20
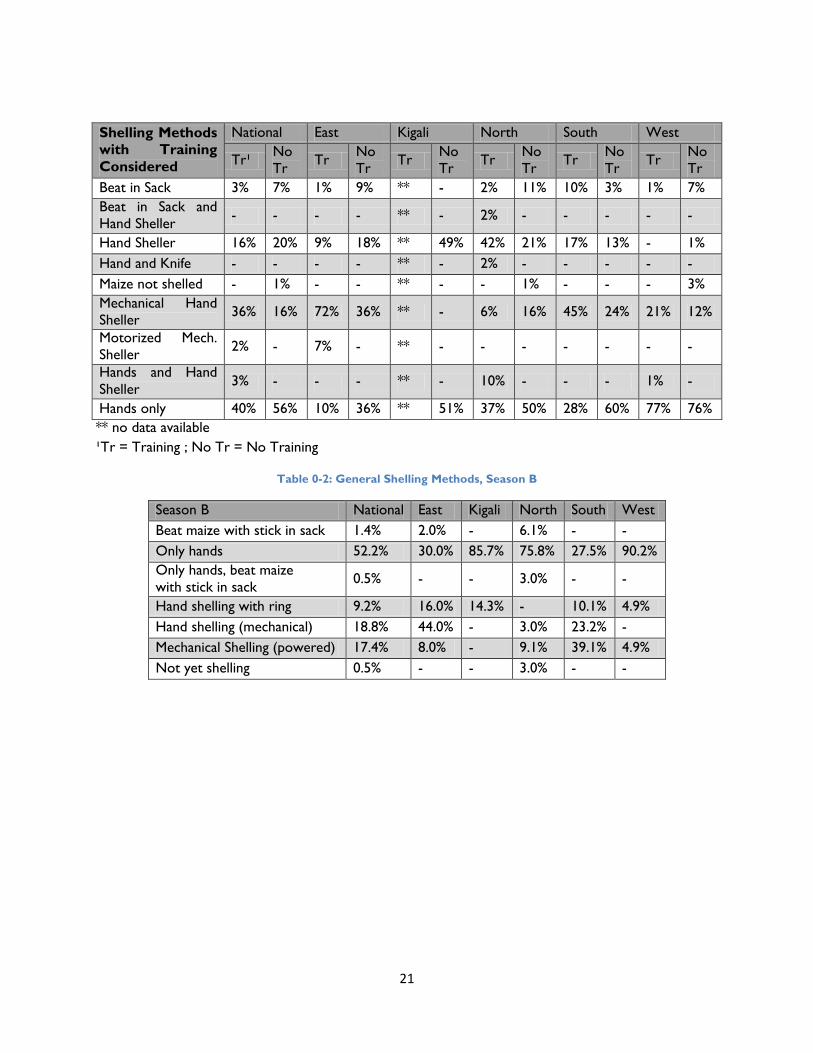
Shelling Methods with Training Considered
National East Kigali North South West
Tr¹ No Tr Tr No
Tr Tr No Tr Tr No
Tr Tr No Tr Tr No
Tr Beat in Sack 3% 7% 1% 9% ** - 2% 11% 10% 3% 1% 7% Beat in Sack and Hand Sheller - - - - ** - 2% - - - - -
Hand Sheller 16% 20% 9% 18% ** 49% 42% 21% 17% 13% - 1% Hand and Knife - - - - ** - 2% - - - - - Maize not shelled - 1% - - ** - - 1% - - - 3% Mechanical Hand Sheller 36% 16% 72% 36% ** - 6% 16% 45% 24% 21% 12%
Motorized Mech. Sheller 2% - 7% - ** - - - - - - -
Hands and Hand Sheller 3% - - - ** - 10% - - - 1% -
Hands only 40% 56% 10% 36% ** 51% 37% 50% 28% 60% 77% 76% ** no data available ¹Tr = Training ; No Tr = No Training
Table 0-2: General Shelling Methods, Season B
Season B National East Kigali North South West Beat maize with stick in sack 1.4% 2.0% - 6.1% - - Only hands 52.2% 30.0% 85.7% 75.8% 27.5% 90.2% Only hands, beat maize with stick in sack 0.5% - - 3.0% - -
Hand shelling with ring 9.2% 16.0% 14.3% - 10.1% 4.9% Hand shelling (mechanical) 18.8% 44.0% - 3.0% 23.2% - Mechanical Shelling (powered) 17.4% 8.0% - 9.1% 39.1% 4.9% Not yet shelling 0.5% - - 3.0% - -
21
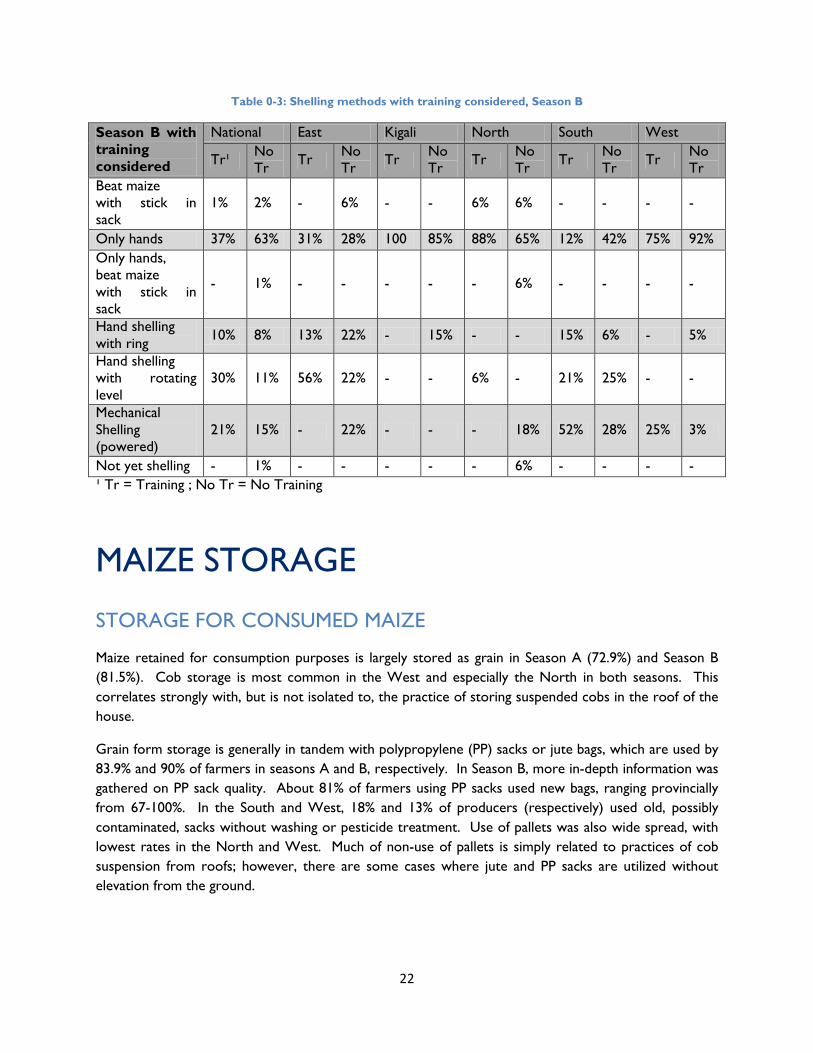
Table 0-3: Shelling methods with training considered, Season B
Season B with training considered
National East Kigali North South West
Tr¹ No Tr Tr No
Tr Tr No Tr Tr No
Tr Tr No Tr Tr No
Tr Beat maize with stick in sack
1% 2% - 6% - - 6% 6% - - - -
Only hands 37% 63% 31% 28% 100 85% 88% 65% 12% 42% 75% 92% Only hands, beat maize with stick in sack
- 1% - - - - - 6% - - - -
Hand shelling with ring 10% 8% 13% 22% - 15% - - 15% 6% - 5%
Hand shelling with rotating level
30% 11% 56% 22% - - 6% - 21% 25% - -
Mechanical Shelling (powered)
21% 15% - 22% - - - 18% 52% 28% 25% 3%
Not yet shelling - 1% - - - - - 6% - - - - ¹ Tr = Training ; No Tr = No Training
MAIZE STORAGE
STORAGE FOR CONSUMED MAIZE
Maize retained for consumption purposes is largely stored as grain in Season A (72.9%) and Season B (81.5%). Cob storage is most common in the West and especially the North in both seasons. This correlates strongly with, but is not isolated to, the practice of storing suspended cobs in the roof of the house.
Grain form storage is generally in tandem with polypropylene (PP) sacks or jute bags, which are used by 83.9% and 90% of farmers in seasons A and B, respectively. In Season B, more in-depth information was gathered on PP sack quality. About 81% of farmers using PP sacks used new bags, ranging provincially from 67-100%. In the South and West, 18% and 13% of producers (respectively) used old, possibly contaminated, sacks without washing or pesticide treatment. Use of pallets was also wide spread, with lowest rates in the North and West. Much of non-use of pallets is simply related to practices of cob suspension from roofs; however, there are some cases where jute and PP sacks are utilized without elevation from the ground.
22
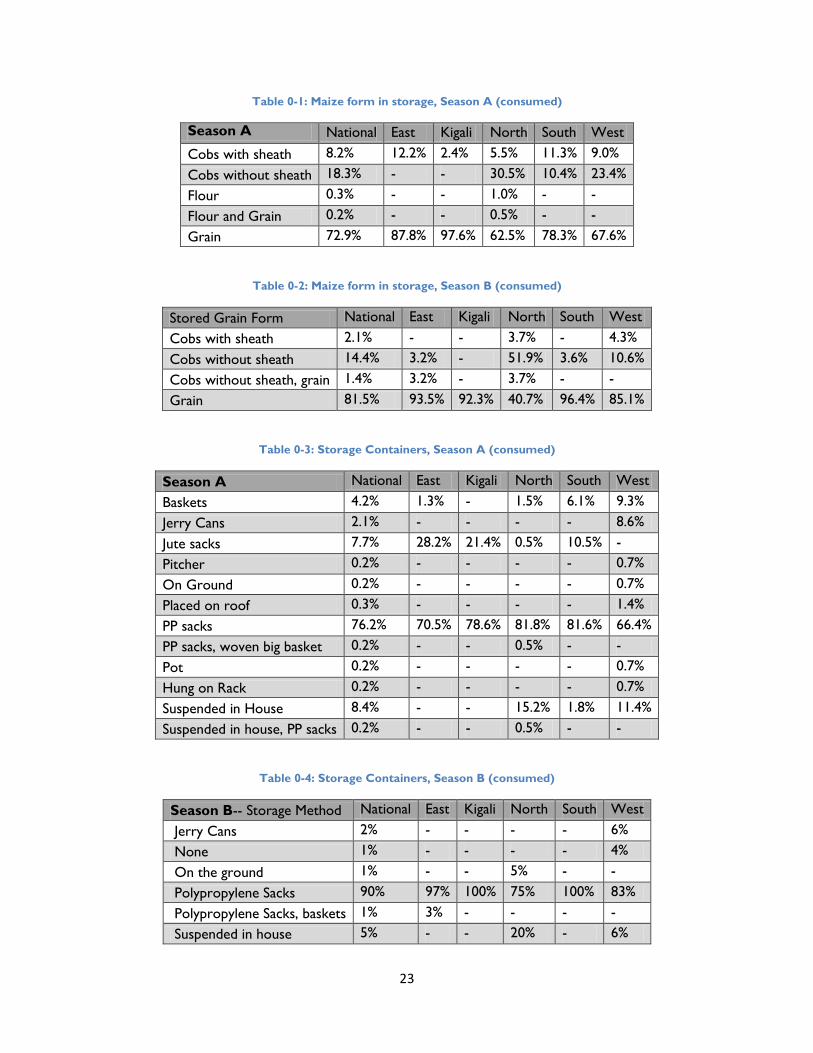
Table 0-1: Maize form in storage, Season A (consumed)
Season A National East Kigali North South West Cobs with sheath 8.2% 12.2% 2.4% 5.5% 11.3% 9.0%
Cobs without sheath 18.3% - - 30.5% 10.4% 23.4%
Flour 0.3% - - 1.0% - -
Flour and Grain 0.2% - - 0.5% - -
Grain 72.9% 87.8% 97.6% 62.5% 78.3% 67.6%
Table 0-2: Maize form in storage, Season B (consumed)
Stored Grain Form National East Kigali North South West Cobs with sheath 2.1% - - 3.7% - 4.3%
Cobs without sheath 14.4% 3.2% - 51.9% 3.6% 10.6%
Cobs without sheath, grain 1.4% 3.2% - 3.7% - -
Grain 81.5% 93.5% 92.3% 40.7% 96.4% 85.1%
Table 0-3: Storage Containers, Season A (consumed)
Season A National East Kigali North South West Baskets 4.2% 1.3% - 1.5% 6.1% 9.3% Jerry Cans 2.1% - - - - 8.6%
Jute sacks 7.7% 28.2% 21.4% 0.5% 10.5% -
Pitcher 0.2% - - - - 0.7%
On Ground 0.2% - - - - 0.7% Placed on roof 0.3% - - - - 1.4% PP sacks 76.2% 70.5% 78.6% 81.8% 81.6% 66.4% PP sacks, woven big basket 0.2% - - 0.5% - -
Pot 0.2% - - - - 0.7%
Hung on Rack 0.2% - - - - 0.7%
Suspended in House 8.4% - - 15.2% 1.8% 11.4% Suspended in house, PP sacks 0.2% - - 0.5% - -
Table 0-4: Storage Containers, Season B (consumed)
Season B-- Storage Method National East Kigali North South West
Jerry Cans 2% - - - - 6%
None 1% - - - - 4%
On the ground 1% - - 5% - -
Polypropylene Sacks 90% 97% 100% 75% 100% 83% Polypropylene Sacks, baskets 1% 3% - - - - Suspended in house 5% - - 20% - 6%
23
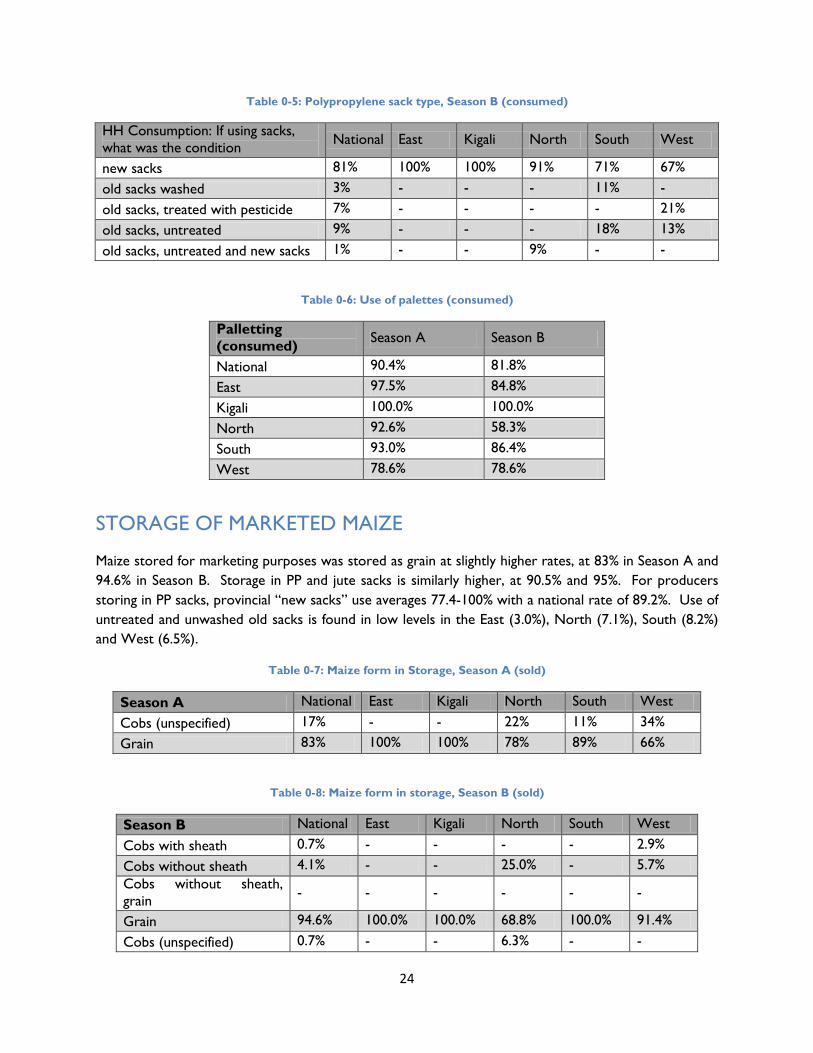
Table 0-5: Polypropylene sack type, Season B (consumed)
HH Consumption: If using sacks, what was the condition National East Kigali North South West
new sacks 81% 100% 100% 91% 71% 67% old sacks washed 3% - - - 11% -
old sacks, treated with pesticide 7% - - - - 21% old sacks, untreated 9% - - - 18% 13%
old sacks, untreated and new sacks 1% - - 9% - -
Table 0-6: Use of palettes (consumed)
Palletting (consumed) Season A Season B
National 90.4% 81.8%
East 97.5% 84.8%
Kigali 100.0% 100.0%
North 92.6% 58.3% South 93.0% 86.4% West 78.6% 78.6%
STORAGE OF MARKETED MAIZE
Maize stored for marketing purposes was stored as grain at slightly higher rates, at 83% in Season A and 94.6% in Season B. Storage in PP and jute sacks is similarly higher, at 90.5% and 95%. For producers storing in PP sacks, provincial “new sacks” use averages 77.4-100% with a national rate of 89.2%. Use of untreated and unwashed old sacks is found in low levels in the East (3.0%), North (7.1%), South (8.2%) and West (6.5%).
Table 0-7: Maize form in Storage, Season A (sold)
Season A National East Kigali North South West
Cobs (unspecified) 17% - - 22% 11% 34% Grain 83% 100% 100% 78% 89% 66%
Table 0-8: Maize form in storage, Season B (sold)
Season B National East Kigali North South West
Cobs with sheath 0.7% - - - - 2.9%
Cobs without sheath 4.1% - - 25.0% - 5.7% Cobs without sheath, grain - - - - - -
Grain 94.6% 100.0% 100.0% 68.8% 100.0% 91.4%
Cobs (unspecified) 0.7% - - 6.3% - -
24
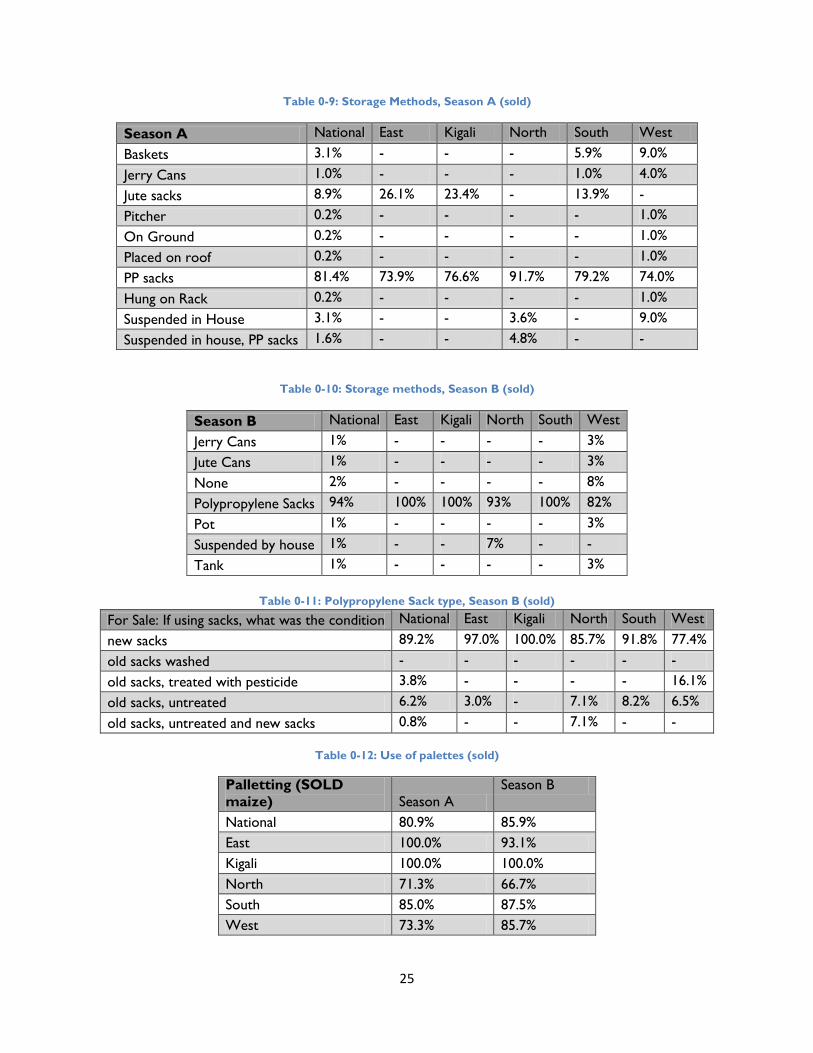
Table 0-9: Storage Methods, Season A (sold)
Season A National East Kigali North South West Baskets 3.1% - - - 5.9% 9.0%
Jerry Cans 1.0% - - - 1.0% 4.0%
Jute sacks 8.9% 26.1% 23.4% - 13.9% -
Pitcher 0.2% - - - - 1.0%
On Ground 0.2% - - - - 1.0%
Placed on roof 0.2% - - - - 1.0% PP sacks 81.4% 73.9% 76.6% 91.7% 79.2% 74.0%
Hung on Rack 0.2% - - - - 1.0%
Suspended in House 3.1% - - 3.6% - 9.0%
Suspended in house, PP sacks 1.6% - - 4.8% - -
Table 0-10: Storage methods, Season B (sold)
Season B National East Kigali North South West Jerry Cans 1% - - - - 3% Jute Cans 1% - - - - 3%
None 2% - - - - 8%
Polypropylene Sacks 94% 100% 100% 93% 100% 82%
Pot 1% - - - - 3% Suspended by house 1% - - 7% - -
Tank 1% - - - - 3%
Table 0-11: Polypropylene Sack type, Season B (sold)
For Sale: If using sacks, what was the condition National East Kigali North South West
new sacks 89.2% 97.0% 100.0% 85.7% 91.8% 77.4% old sacks washed - - - - - - old sacks, treated with pesticide 3.8% - - - - 16.1% old sacks, untreated 6.2% 3.0% - 7.1% 8.2% 6.5%
old sacks, untreated and new sacks 0.8% - - 7.1% - -
Table 0-12: Use of palettes (sold)
Palletting (SOLD maize) Season A
Season B
National 80.9% 85.9% East 100.0% 93.1% Kigali 100.0% 100.0% North 71.3% 66.7% South 85.0% 87.5% West 73.3% 85.7%
25
PROTECTANT USE IN STORAGE
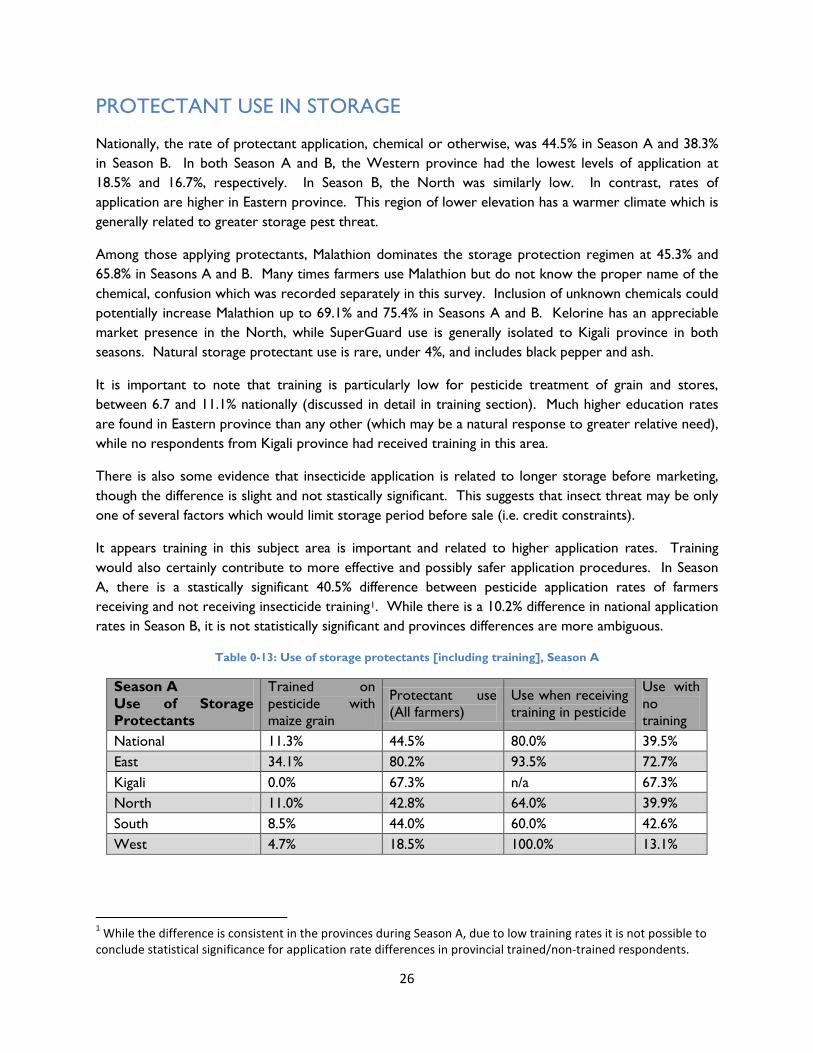
Nationally, the rate of protectant application, chemical or otherwise, was 44.5% in Season A and 38.3% in Season B. In both Season A and B, the Western province had the lowest levels of application at 18.5% and 16.7%, respectively. In Season B, the North was similarly low. In contrast, rates of application are higher in Eastern province. This region of lower elevation has a warmer climate which is generally related to greater storage pest threat.
Among those applying protectants, Malathion dominates the storage protection regimen at 45.3% and 65.8% in Seasons A and B. Many times farmers use Malathion but do not know the proper name of the chemical, confusion which was recorded separately in this survey. Inclusion of unknown chemicals could potentially increase Malathion up to 69.1% and 75.4% in Seasons A and B. Kelorine has an appreciable market presence in the North, while SuperGuard use is generally isolated to Kigali province in both seasons. Natural storage protectant use is rare, under 4%, and includes black pepper and ash.
It is important to note that training is particularly low for pesticide treatment of grain and stores, between 6.7 and 11.1% nationally (discussed in detail in training section). Much higher education rates are found in Eastern province than any other (which may be a natural response to greater relative need), while no respondents from Kigali province had received training in this area.
There is also some evidence that insecticide application is related to longer storage before marketing, though the difference is slight and not stastically significant. This suggests that insect threat may be only one of several factors which would limit storage period before sale (i.e. credit constraints).
It appears training in this subject area is important and related to higher application rates. Training would also certainly contribute to more effective and possibly safer application procedures. In Season A, there is a stastically significant 40.5% difference between pesticide application rates of farmers receiving and not receiving insecticide training1. While there is a 10.2% difference in national application rates in Season B, it is not statistically significant and provinces differences are more ambiguous.
Table 0-13: Use of storage protectants [including training], Season A
Season A Use of Storage Protectants
Trained on pesticide with maize grain
Protectant use (All farmers)
Use when receiving training in pesticide
Use with no training
National 11.3% 44.5% 80.0% 39.5% East 34.1% 80.2% 93.5% 72.7% Kigali 0.0% 67.3% n/a 67.3% North 11.0% 42.8% 64.0% 39.9% South 8.5% 44.0% 60.0% 42.6% West 4.7% 18.5% 100.0% 13.1%
1 While the difference is consistent in the provinces during Season A, due to low training rates it is not possible to conclude statistical significance for application rate differences in provincial trained/non-trained respondents.
26
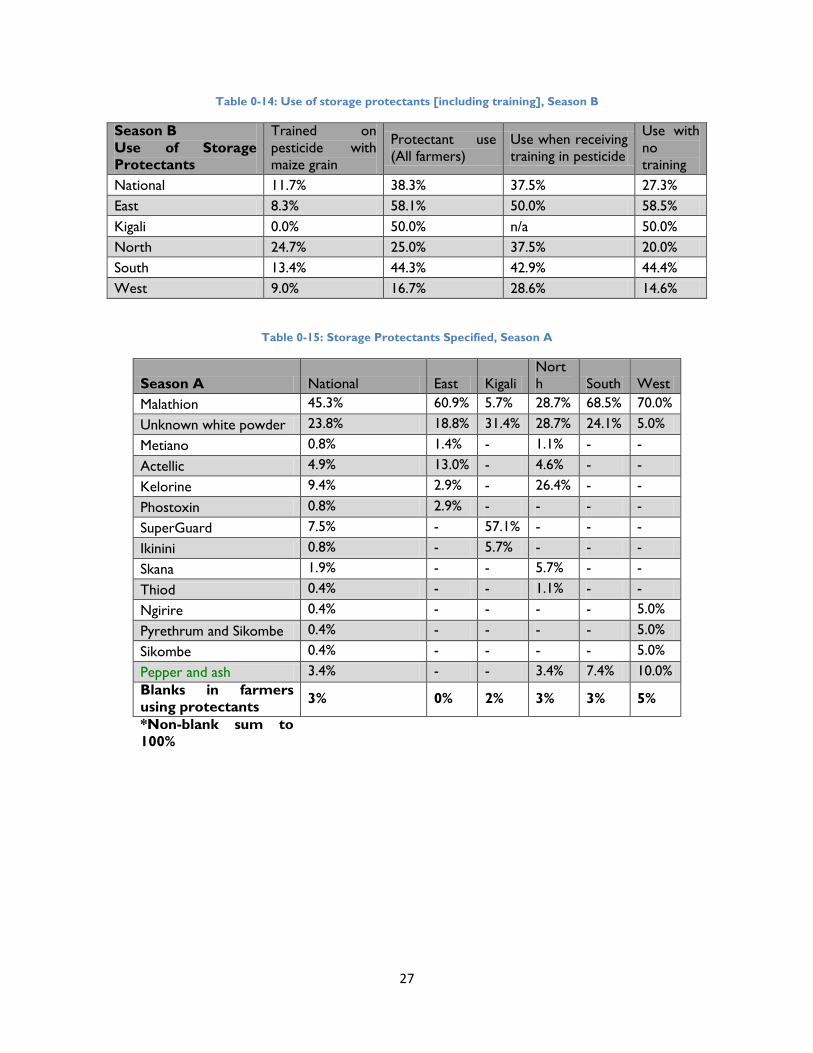
Table 0-14: Use of storage protectants [including training], Season B
Season B Use of Storage Protectants
Trained on pesticide with maize grain
Protectant use (All farmers)
Use when receiving training in pesticide
Use with no training
National 11.7% 38.3% 37.5% 27.3% East 8.3% 58.1% 50.0% 58.5% Kigali 0.0% 50.0% n/a 50.0% North 24.7% 25.0% 37.5% 20.0% South 13.4% 44.3% 42.9% 44.4% West 9.0% 16.7% 28.6% 14.6%
Table 0-15: Storage Protectants Specified, Season A
Season A National East Kigali North South West
Malathion 45.3% 60.9% 5.7% 28.7% 68.5% 70.0% Unknown white powder 23.8% 18.8% 31.4% 28.7% 24.1% 5.0%
Metiano 0.8% 1.4% - 1.1% - -
Actellic 4.9% 13.0% - 4.6% - -
Kelorine 9.4% 2.9% - 26.4% - -
Phostoxin 0.8% 2.9% - - - - SuperGuard 7.5% - 57.1% - - - Ikinini 0.8% - 5.7% - - -
Skana 1.9% - - 5.7% - -
Thiod 0.4% - - 1.1% - -
Ngirire 0.4% - - - - 5.0%
Pyrethrum and Sikombe 0.4% - - - - 5.0% Sikombe 0.4% - - - - 5.0%
Pepper and ash 3.4% - - 3.4% 7.4% 10.0% Blanks in farmers using protectants 3% 0% 2% 3% 3% 5%
*Non-blank sum to 100%
27
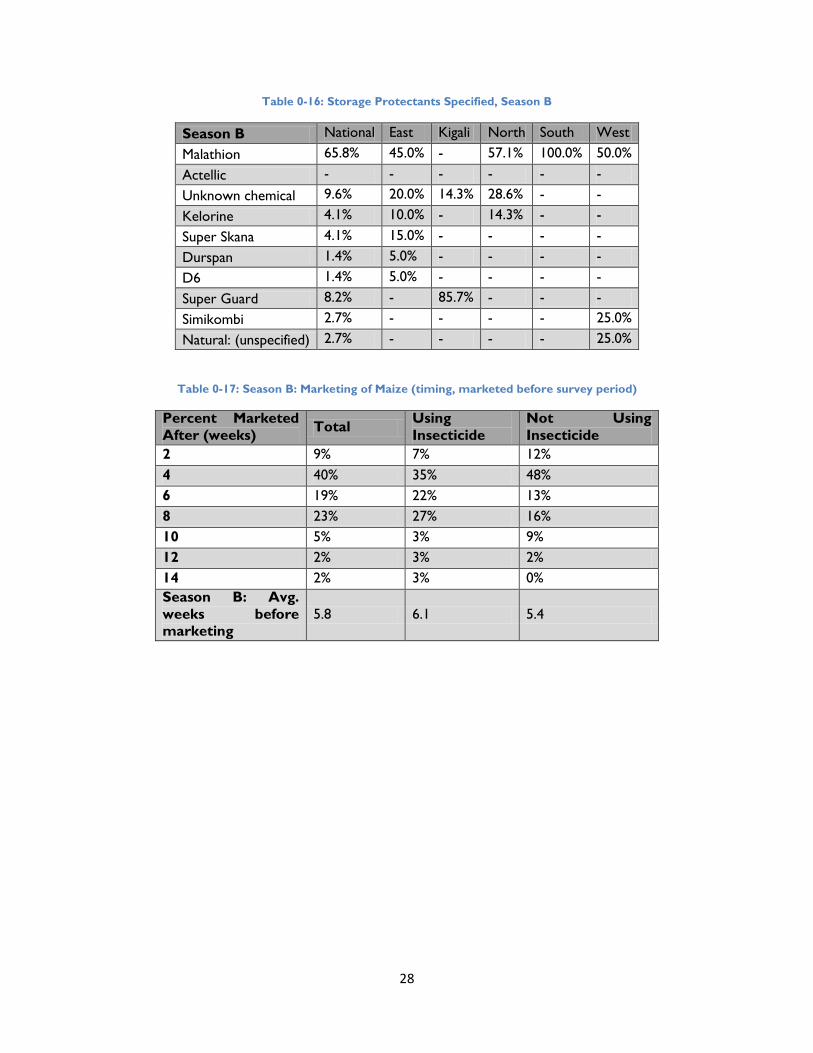
Table 0-16: Storage Protectants Specified, Season B
Season B National East Kigali North South West Malathion 65.8% 45.0% - 57.1% 100.0% 50.0%
Actellic - - - - - -
Unknown chemical 9.6% 20.0% 14.3% 28.6% - -
Kelorine 4.1% 10.0% - 14.3% - -
Super Skana 4.1% 15.0% - - - -
Durspan 1.4% 5.0% - - - - D6 1.4% 5.0% - - - -
Super Guard 8.2% - 85.7% - - -
Simikombi 2.7% - - - - 25.0%
Natural: (unspecified) 2.7% - - - - 25.0%
Table 0-17: Season B: Marketing of Maize (timing, marketed before survey period)
Percent Marketed After (weeks) Total Using
Insecticide Not Using Insecticide
2 9% 7% 12% 4 40% 35% 48% 6 19% 22% 13% 8 23% 27% 16% 10 5% 3% 9% 12 2% 3% 2% 14 2% 3% 0% Season B: Avg. weeks before marketing
5.8 6.1 5.4
28
STORAGE LOSSES (SEASON B ONLY)
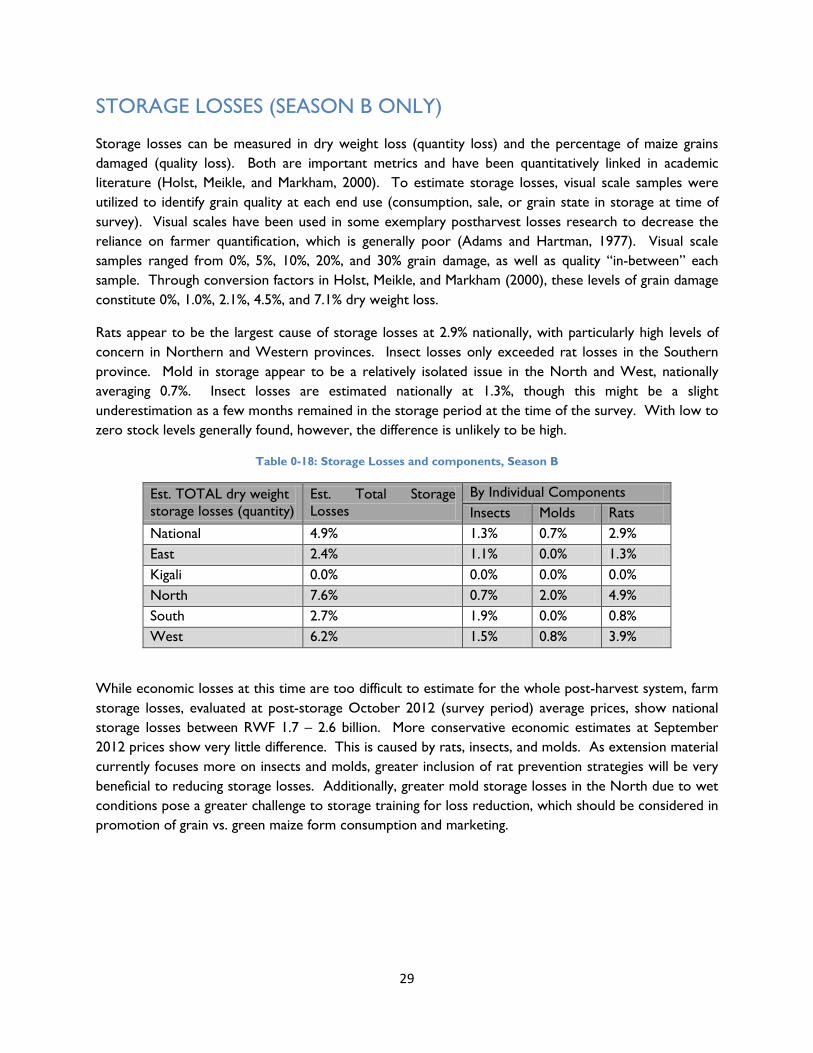
Storage losses can be measured in dry weight loss (quantity loss) and the percentage of maize grains damaged (quality loss). Both are important metrics and have been quantitatively linked in academic literature (Holst, Meikle, and Markham, 2000). To estimate storage losses, visual scale samples were utilized to identify grain quality at each end use (consumption, sale, or grain state in storage at time of survey). Visual scales have been used in some exemplary postharvest losses research to decrease the reliance on farmer quantification, which is generally poor (Adams and Hartman, 1977). Visual scale samples ranged from 0%, 5%, 10%, 20%, and 30% grain damage, as well as quality “in-between” each sample. Through conversion factors in Holst, Meikle, and Markham (2000), these levels of grain damage constitute 0%, 1.0%, 2.1%, 4.5%, and 7.1% dry weight loss.
Rats appear to be the largest cause of storage losses at 2.9% nationally, with particularly high levels of concern in Northern and Western provinces. Insect losses only exceeded rat losses in the Southern province. Mold in storage appear to be a relatively isolated issue in the North and West, nationally averaging 0.7%. Insect losses are estimated nationally at 1.3%, though this might be a slight underestimation as a few months remained in the storage period at the time of the survey. With low to zero stock levels generally found, however, the difference is unlikely to be high.
Table 0-18: Storage Losses and components, Season B
Est. TOTAL dry weight storage losses (quantity)
Est. Total Storage Losses
By Individual Components Insects Molds Rats
National 4.9% 1.3% 0.7% 2.9% East 2.4% 1.1% 0.0% 1.3% Kigali 0.0% 0.0% 0.0% 0.0% North 7.6% 0.7% 2.0% 4.9% South 2.7% 1.9% 0.0% 0.8% West 6.2% 1.5% 0.8% 3.9%
While economic losses at this time are too difficult to estimate for the whole post-harvest system, farm storage losses, evaluated at post-storage October 2012 (survey period) average prices, show national storage losses between RWF 1.7 – 2.6 billion. More conservative economic estimates at September 2012 prices show very little difference. This is caused by rats, insects, and molds. As extension material currently focuses more on insects and molds, greater inclusion of rat prevention strategies will be very beneficial to reducing storage losses. Additionally, greater mold storage losses in the North due to wet conditions pose a greater challenge to storage training for loss reduction, which should be considered in promotion of grain vs. green maize form consumption and marketing.
29
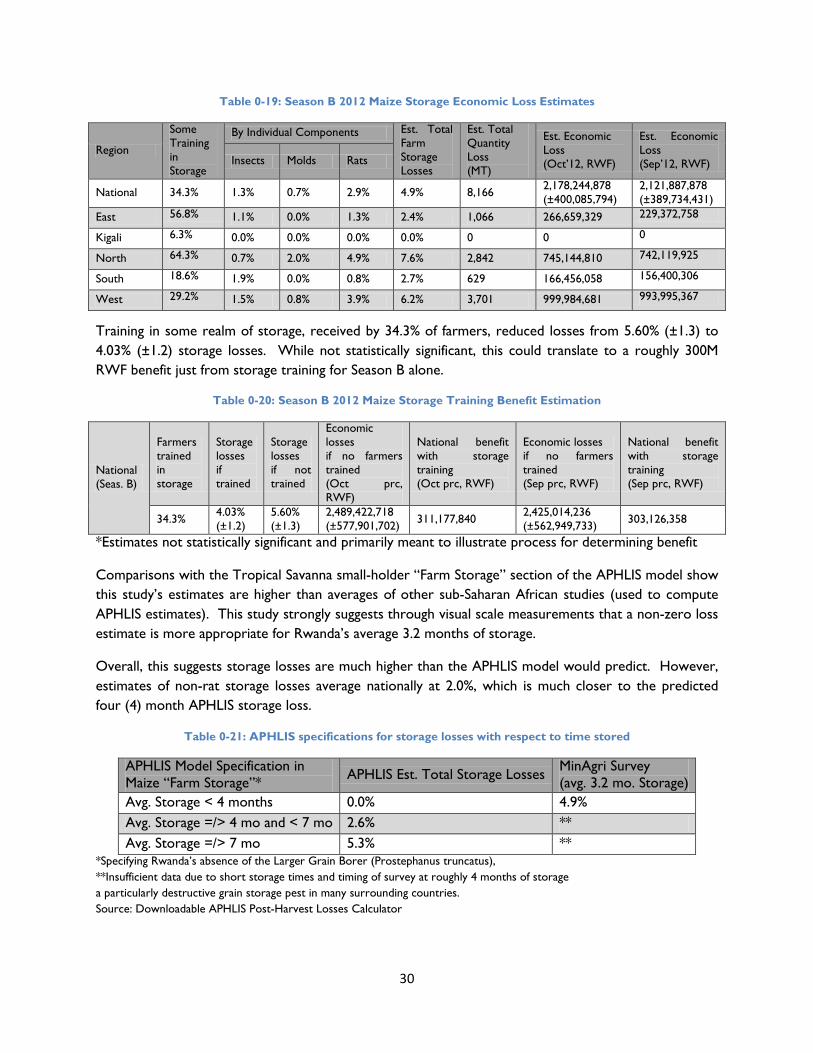
Table 0-19: Season B 2012 Maize Storage Economic Loss Estimates
Region
Some Training in Storage
By Individual Components Est. Total Farm Storage Losses
Est. Total Quantity Loss (MT)
Est. Economic Loss (Oct’12, RWF)
Est. Economic Loss (Sep’12, RWF) Insects Molds Rats
National 34.3% 1.3% 0.7% 2.9% 4.9% 8,166 2,178,244,878 (±400,085,794)
2,121,887,878 (±389,734,431)
East 56.8% 1.1% 0.0% 1.3% 2.4% 1,066 266,659,329 229,372,758
Kigali 6.3% 0.0% 0.0% 0.0% 0.0% 0 0 0
North 64.3% 0.7% 2.0% 4.9% 7.6% 2,842 745,144,810 742,119,925
South 18.6% 1.9% 0.0% 0.8% 2.7% 629 166,456,058 156,400,306
West 29.2% 1.5% 0.8% 3.9% 6.2% 3,701 999,984,681 993,995,367
Training in some realm of storage, received by 34.3% of farmers, reduced losses from 5.60% (±1.3) to 4.03% (±1.2) storage losses. While not statistically significant, this could translate to a roughly 300M RWF benefit just from storage training for Season B alone.
Table 0-20: Season B 2012 Maize Storage Training Benefit Estimation
National (Seas. B)
Farmers trained in storage
Storage losses if trained
Storage losses if not trained
Economic losses if no farmers trained (Oct prc, RWF)
National benefit with storage training (Oct prc, RWF)
Economic losses if no farmers trained (Sep prc, RWF)
National benefit with storage training (Sep prc, RWF)
34.3% 4.03% (±1.2)
5.60% (±1.3)
2,489,422,718 (±577,901,702) 311,177,840 2,425,014,236
(±562,949,733) 303,126,358
*Estimates not statistically significant and primarily meant to illustrate process for determining benefit
Comparisons with the Tropical Savanna small-holder “Farm Storage” section of the APHLIS model show this study’s estimates are higher than averages of other sub-Saharan African studies (used to compute APHLIS estimates). This study strongly suggests through visual scale measurements that a non-zero loss estimate is more appropriate for Rwanda’s average 3.2 months of storage.
Overall, this suggests storage losses are much higher than the APHLIS model would predict. However, estimates of non-rat storage losses average nationally at 2.0%, which is much closer to the predicted four (4) month APHLIS storage loss.
Table 0-21: APHLIS specifications for storage losses with respect to time stored
APHLIS Model Specification in Maize “Farm Storage”* APHLIS Est. Total Storage Losses MinAgri Survey
(avg. 3.2 mo. Storage) Avg. Storage < 4 months 0.0% 4.9% Avg. Storage =/> 4 mo and < 7 mo 2.6% ** Avg. Storage =/> 7 mo 5.3% **
*Specifying Rwanda’s absence of the Larger Grain Borer (Prostephanus truncatus), **Insufficient data due to short storage times and timing of survey at roughly 4 months of storage a particularly destructive grain storage pest in many surrounding countries. Source: Downloadable APHLIS Post-Harvest Losses Calculator
30
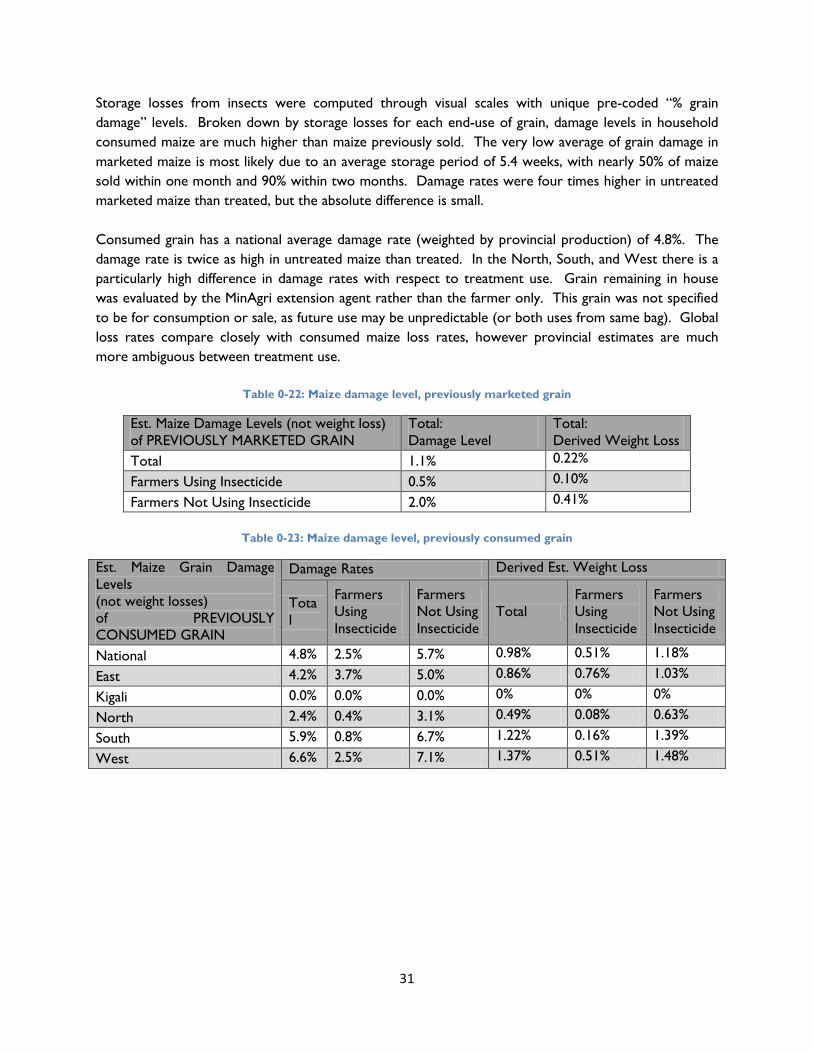
Storage losses from insects were computed through visual scales with unique pre-coded “% grain damage” levels. Broken down by storage losses for each end-use of grain, damage levels in household consumed maize are much higher than maize previously sold. The very low average of grain damage in marketed maize is most likely due to an average storage period of 5.4 weeks, with nearly 50% of maize sold within one month and 90% within two months. Damage rates were four times higher in untreated marketed maize than treated, but the absolute difference is small. Consumed grain has a national average damage rate (weighted by provincial production) of 4.8%. The damage rate is twice as high in untreated maize than treated. In the North, South, and West there is a particularly high difference in damage rates with respect to treatment use. Grain remaining in house was evaluated by the MinAgri extension agent rather than the farmer only. This grain was not specified to be for consumption or sale, as future use may be unpredictable (or both uses from same bag). Global loss rates compare closely with consumed maize loss rates, however provincial estimates are much more ambiguous between treatment use.
Table 0-22: Maize damage level, previously marketed grain
Est. Maize Damage Levels (not weight loss) of PREVIOUSLY MARKETED GRAIN
Total: Damage Level
Total: Derived Weight Loss
Total 1.1% 0.22%
Farmers Using Insecticide 0.5% 0.10%
Farmers Not Using Insecticide 2.0% 0.41%
Table 0-23: Maize damage level, previously consumed grain
Est. Maize Grain Damage Levels (not weight losses) of PREVIOUSLY CONSUMED GRAIN
Damage Rates Derived Est. Weight Loss
Total
Farmers Using Insecticide
Farmers Not Using Insecticide
Total Farmers Using Insecticide
Farmers Not Using Insecticide
National 4.8% 2.5% 5.7% 0.98% 0.51% 1.18%
East 4.2% 3.7% 5.0% 0.86% 0.76% 1.03%
Kigali 0.0% 0.0% 0.0% 0% 0% 0%
North 2.4% 0.4% 3.1% 0.49% 0.08% 0.63%
South 5.9% 0.8% 6.7% 1.22% 0.16% 1.39%
West 6.6% 2.5% 7.1% 1.37% 0.51% 1.48%
31
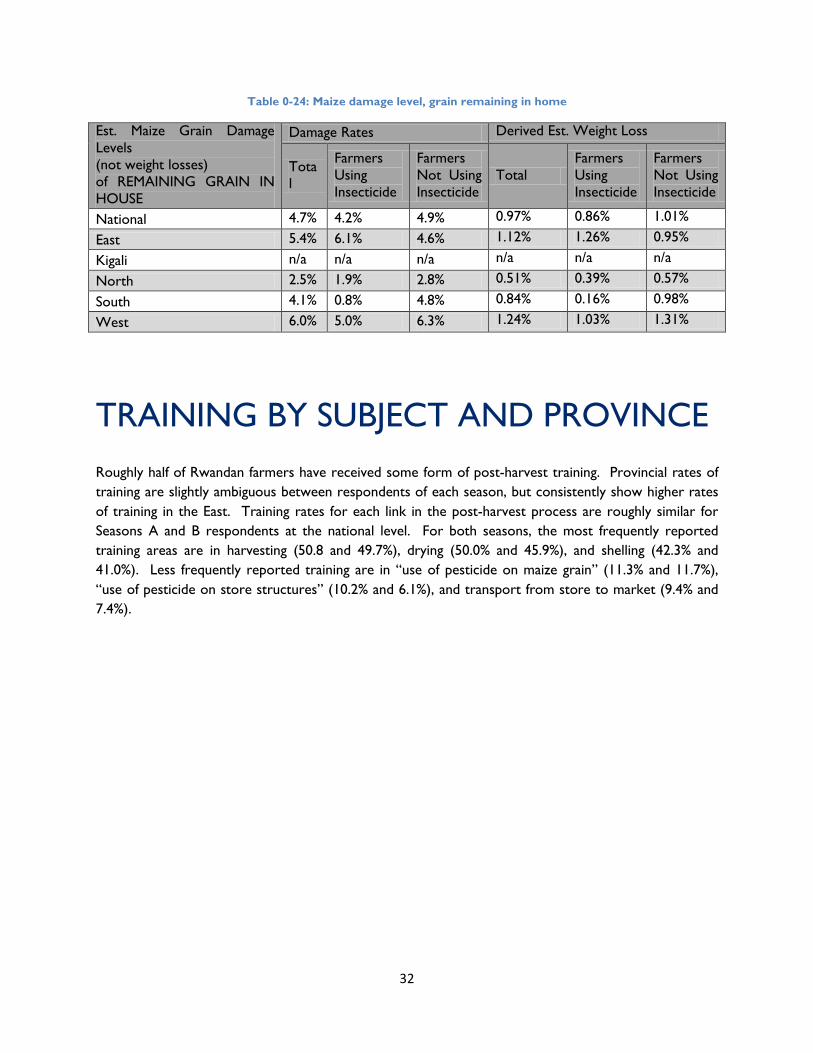
Table 0-24: Maize damage level, grain remaining in home
Est. Maize Grain Damage Levels (not weight losses) of REMAINING GRAIN IN HOUSE
Damage Rates Derived Est. Weight Loss
Total
Farmers Using Insecticide
Farmers Not Using Insecticide
Total Farmers Using Insecticide
Farmers Not Using Insecticide
National 4.7% 4.2% 4.9% 0.97% 0.86% 1.01%
East 5.4% 6.1% 4.6% 1.12% 1.26% 0.95%
Kigali n/a n/a n/a n/a n/a n/a
North 2.5% 1.9% 2.8% 0.51% 0.39% 0.57%
South 4.1% 0.8% 4.8% 0.84% 0.16% 0.98%
West 6.0% 5.0% 6.3% 1.24% 1.03% 1.31%
TRAINING BY SUBJECT AND PROVINCE Roughly half of Rwandan farmers have received some form of post-harvest training. Provincial rates of training are slightly ambiguous between respondents of each season, but consistently show higher rates of training in the East. Training rates for each link in the post-harvest process are roughly similar for Seasons A and B respondents at the national level. For both seasons, the most frequently reported training areas are in harvesting (50.8 and 49.7%), drying (50.0% and 45.9%), and shelling (42.3% and 41.0%). Less frequently reported training are in “use of pesticide on maize grain” (11.3% and 11.7%), “use of pesticide on store structures” (10.2% and 6.1%), and transport from store to market (9.4% and 7.4%).
32
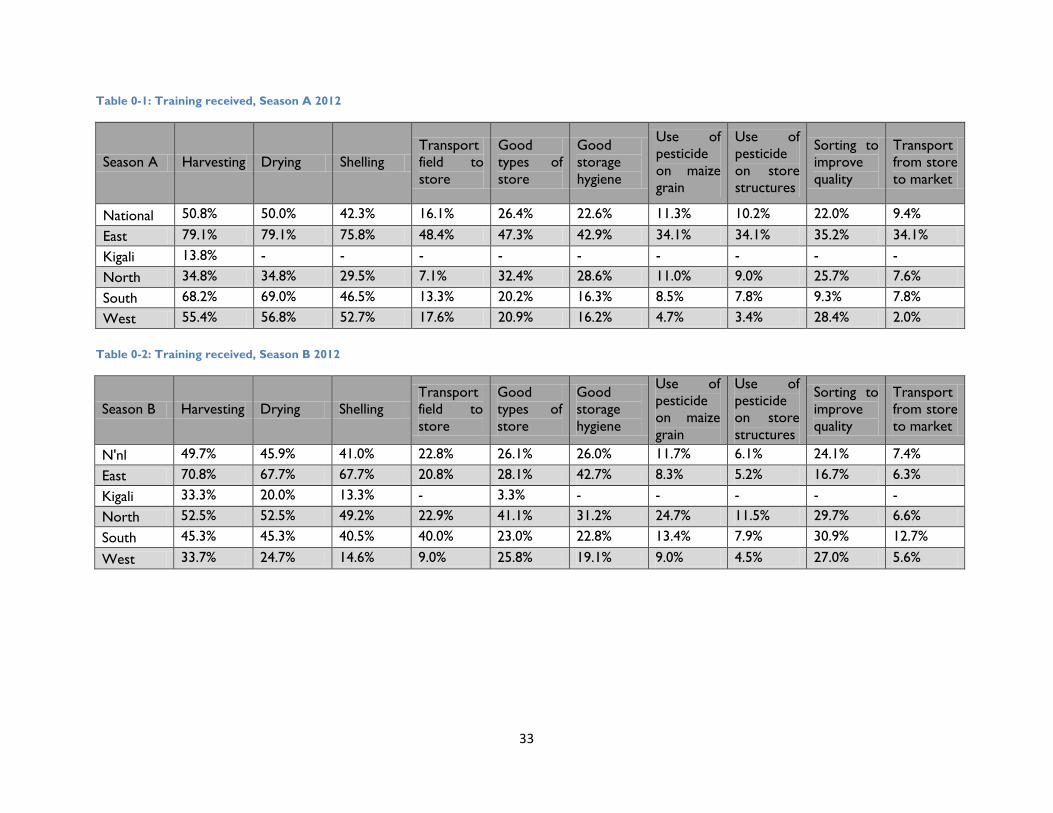
Table 0-1: Training received, Season A 2012
Season A Harvesting Drying Shelling Transport field to store
Good types of store
Good storage hygiene
Use of pesticide on maize grain
Use of pesticide on store structures
Sorting to improve quality
Transport from store to market
National 50.8% 50.0% 42.3% 16.1% 26.4% 22.6% 11.3% 10.2% 22.0% 9.4%
East 79.1% 79.1% 75.8% 48.4% 47.3% 42.9% 34.1% 34.1% 35.2% 34.1% Kigali 13.8% - - - - - - - - - North 34.8% 34.8% 29.5% 7.1% 32.4% 28.6% 11.0% 9.0% 25.7% 7.6%
South 68.2% 69.0% 46.5% 13.3% 20.2% 16.3% 8.5% 7.8% 9.3% 7.8%
West 55.4% 56.8% 52.7% 17.6% 20.9% 16.2% 4.7% 3.4% 28.4% 2.0% Table 0-2: Training received, Season B 2012
Season B Harvesting Drying Shelling Transport field to store
Good types of store
Good storage hygiene
Use of pesticide on maize grain
Use of pesticide on store structures
Sorting to improve quality
Transport from store to market
N'nl 49.7% 45.9% 41.0% 22.8% 26.1% 26.0% 11.7% 6.1% 24.1% 7.4% East 70.8% 67.7% 67.7% 20.8% 28.1% 42.7% 8.3% 5.2% 16.7% 6.3% Kigali 33.3% 20.0% 13.3% - 3.3% - - - - - North 52.5% 52.5% 49.2% 22.9% 41.1% 31.2% 24.7% 11.5% 29.7% 6.6%
South 45.3% 45.3% 40.5% 40.0% 23.0% 22.8% 13.4% 7.9% 30.9% 12.7%
West 33.7% 24.7% 14.6% 9.0% 25.8% 19.1% 9.0% 4.5% 27.0% 5.6%
33
APHLIS POST HARVEST LOSSES Losses are calculated using the African Post Harvest Losses Information system, a general modeling tool for East and Southern Africa developed by the National Research Institute (NRI). The model functions as a meta-analysis of a wide range of post-harvest losses studies across Africa. Unfortunately, no parameter-contributing studies have yet been produced in Rwanda. With the absence of local data, APHLIS can provide an evidence-based estimate to inform discourse. Limitations of the model stem from its generality, as this calculator only takes into consideration three main parameters: rain at harvest, period of storage and the production marketed immediately after harvest. Therefore, individual farmer characteristics, practices, or training levels cannot be considered. In this calculation, rain at harvest is weighted by percentage incidence to avoid only a binary “yes” or “no” generalization for the province, while other parameters are held constant.
Under APHLIS specifications, Season A provincial losses range from 19.8% to 24.9%, with a national average of 20.1%. In Season B, due to significantly less incidences of rain at harvest, provincial loss estimates range from 13.8% to 17.7%. The national average in Season B is 15.4%. APHLIS estimates that the full 2012 year weighted average post-harvest losses would be 18.4%.
34
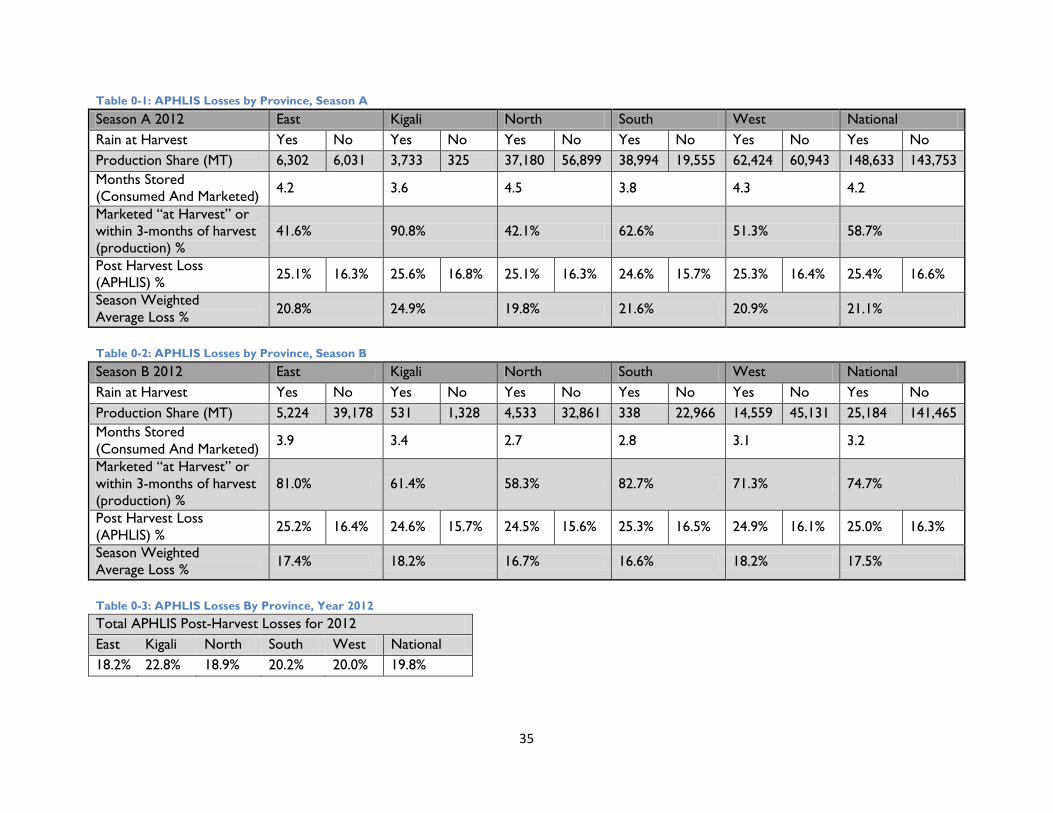
Table 0-1: APHLIS Losses by Province, Season A
Season A 2012 East Kigali North South West National Rain at Harvest Yes No Yes No Yes No Yes No Yes No Yes No Production Share (MT) 6,302 6,031 3,733 325 37,180 56,899 38,994 19,555 62,424 60,943 148,633 143,753 Months Stored (Consumed And Marketed) 4.2 3.6 4.5 3.8 4.3 4.2
Marketed “at Harvest” or within 3-months of harvest (production) %
41.6% 90.8% 42.1% 62.6% 51.3% 58.7%
Post Harvest Loss (APHLIS) % 25.1% 16.3% 25.6% 16.8% 25.1% 16.3% 24.6% 15.7% 25.3% 16.4% 25.4% 16.6%
Season Weighted Average Loss % 20.8% 24.9% 19.8% 21.6% 20.9% 21.1%
Table 0-2: APHLIS Losses by Province, Season B
Season B 2012 East Kigali North South West National Rain at Harvest Yes No Yes No Yes No Yes No Yes No Yes No Production Share (MT) 5,224 39,178 531 1,328 4,533 32,861 338 22,966 14,559 45,131 25,184 141,465 Months Stored (Consumed And Marketed) 3.9 3.4 2.7 2.8 3.1 3.2
Marketed “at Harvest” or within 3-months of harvest (production) %
81.0% 61.4% 58.3% 82.7% 71.3% 74.7%
Post Harvest Loss (APHLIS) % 25.2% 16.4% 24.6% 15.7% 24.5% 15.6% 25.3% 16.5% 24.9% 16.1% 25.0% 16.3%
Season Weighted Average Loss % 17.4% 18.2% 16.7% 16.6% 18.2% 17.5%
Table 0-3: APHLIS Losses By Province, Year 2012 Total APHLIS Post-Harvest Losses for 2012 East Kigali North South West National 18.2% 22.8% 18.9% 20.2% 20.0% 19.8%
35
COMPARISON OF POST-HARVEST LOSS ESTIMATES FROM APHLIS VS. MINAGRI SURVEYS This current Season B 2012 survey attempted to gain local context for post-harvest loss parameters through farmer-reported data. The variables in question to contextualize were 1) Harvesting/Field Drying, 2) Further Drying, and 3) Farm Storage. Some study results were quite similar to APHLIS estimates, while others differed. APHLIS parameters themselves are built from averages of many study parameters, most of which vary considerably within each category. Therefore, it would not be unusual for this study’s parameters to deviate somewhat from APHLIS “average” parameter estimates.
The APHLIS parameter for “Harvesting/Field Drying” with and without ‘rain at harvest’ comes from a Swaziland study in the early 1990s (Rick Hodges, personal communication, 2012). MinAgri-determined parameters are slightly higher than APHLIS without rain at harvest (6.4 to 7.8%), a relative difference of 21.8% greater and an absolute difference of 1.4%. With rain at harvest, MinAgri estimates are much below APHLIS (16.3 to 9.6%), with a relative difference of 41.1% less and an absolute difference of 6.7%.
The title of ‘platform drying’ to describe the drying process would only apply to a select group of farmers in this sample (see drying section), however the vocabulary of APHLIS is maintained. While the MinAgri estimate with ‘rain at harvest’ was quite close to the APHLIS parameter, without rain there is little to no reported loss.
The APHLIS parameter “Farm Storage” simply returns zero (0.0%) losses if storage is less than four months. However, this study suggests a non-zero on-farm storage loss for an average storage period of 3.2 months; ultimately this was a national production-weighted average of 4.9%. This measurement was not just farmer-reported estimations, but also through the use of visual scales and agent evaluation of present stocks.
Overall, the end resulting “total post-harvest losses” are quite similar. Compared to APHLIS estimates, the final estimates when weighting for regions with and without ‘rain at harvest’ are 17.5% to 16.1%. This represents a relative difference of 8.0% and an absolute difference of 1.4%.
Notably, key parameter differences are canceled out in a slightly disguising way. This difference would be more exaggerated if there was 1) a greater instance of ‘rain at harvest’ [i.e. Season A], or 2) longer maize storage periods on-farm.
Interestingly with the current model format, the disparity decreases if less maize is marketed within three months of harvest. This is because less marketed maize signifies larger stores on-farm, which raises the MinAgri parameter loss estimate (since APHLIS maintains a zero ‘farm storage’ coefficient for less than 4 months storage).
36
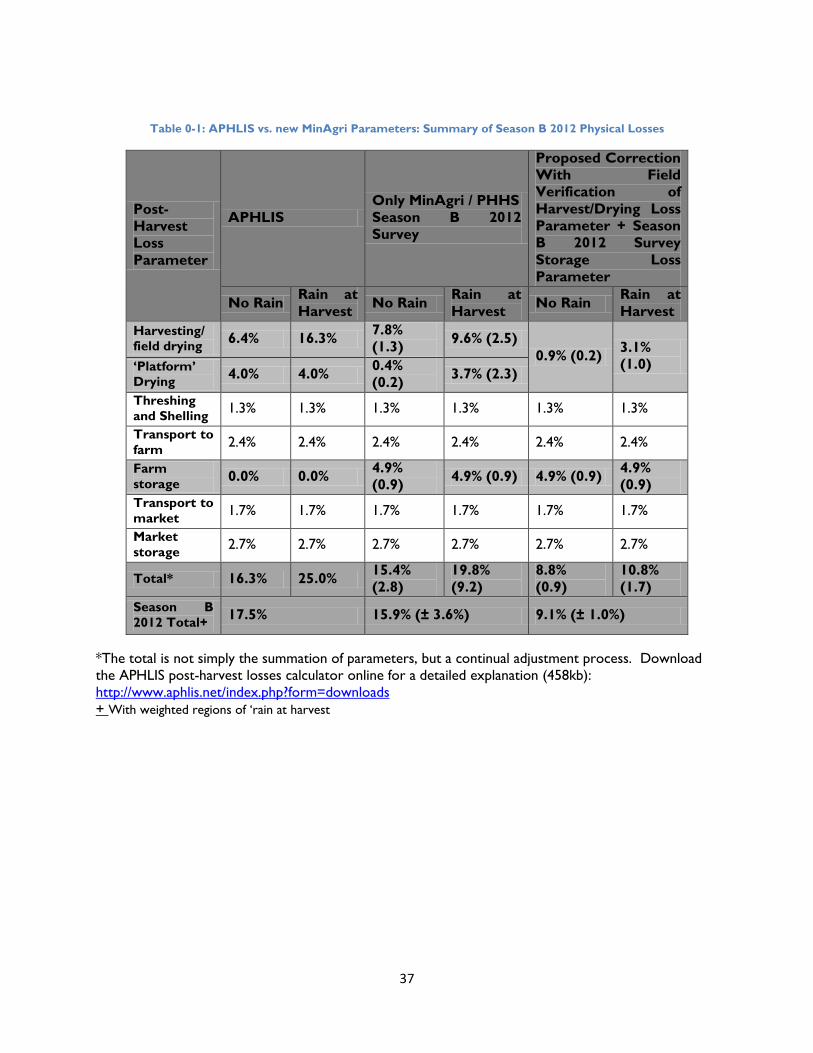
Table 0-1: APHLIS vs. new MinAgri Parameters: Summary of Season B 2012 Physical Losses
Post-Harvest Loss Parameter
APHLIS Only MinAgri / PHHS Season B 2012 Survey
Proposed Correction With Field Verification of Harvest/Drying Loss Parameter + Season B 2012 Survey Storage Loss Parameter
No Rain Rain at Harvest No Rain Rain at
Harvest No Rain Rain at Harvest
Harvesting/ field drying 6.4% 16.3% 7.8%
(1.3) 9.6% (2.5) 0.9% (0.2) 3.1%
(1.0) ‘Platform’ Drying 4.0% 4.0% 0.4%
(0.2) 3.7% (2.3)
Threshing and Shelling 1.3% 1.3% 1.3% 1.3% 1.3% 1.3%
Transport to farm 2.4% 2.4% 2.4% 2.4% 2.4% 2.4%
Farm storage 0.0% 0.0% 4.9%
(0.9) 4.9% (0.9) 4.9% (0.9) 4.9% (0.9)
Transport to market 1.7% 1.7% 1.7% 1.7% 1.7% 1.7%
Market storage 2.7% 2.7% 2.7% 2.7% 2.7% 2.7%
Total* 16.3% 25.0% 15.4% (2.8)
19.8% (9.2)
8.8% (0.9)
10.8% (1.7)
Season B 2012 Total+ 17.5% 15.9% (± 3.6%) 9.1% (± 1.0%)
*The total is not simply the summation of parameters, but a continual adjustment process. Download the APHLIS post-harvest losses calculator online for a detailed explanation (458kb): http://www.aphlis.net/index.php?form=downloads + With weighted regions of ‘rain at harvest
37

COMPARATIVE INCORPORATION OF FIELD MEASURED “HARVEST/DRYING LOSSES” TO BACK-CAST PREVIOUS SEASONS In light of new harvest/drying and storage loss parameter estimates which have been contextualized for Rwanda, it becomes necessary to address past post-harvest loss estimations made only with general model parameters. While revised estimates are made for harvest/drying and storage (the most impactful parameters which needed Rwandan context), it should be noted that the other four APHLIS loss “categories” are still taken from the general model parameters. The revision reveals post-harvest losses which were most likely lower than previous estimates suggested.
Harvest/Drying and Storage loss parameters were chosen for verification because they have the largest impact on losses in the APHLIS model. As the remaining variables are investigated to get Rwanda-specific parameters, overall post-harvest losses will most likely continue to change. Back-casting will be an important way to track losses over time without mixing methodologies. The large difference in overall post-harvest loss estimates for Season B 2012 between methodologies, presented in Table 9.1, underscores this point.
Table 0-1: Back-casting Post-Harvest Losses with New Field Measurements
2011 A 2011 B 2012 A 2012 B Rain at Harvest (%) 65% 34% 56% 12% Est. Post-Harvest Losses* 10.25% (1.5) 9.76% (1.3) 9.85% (1.3) 9.14% (1.1)
Total quantity reported produced (MT) 341,479 166,644 406,389 166,649
Est. total quantity lost during post-harvest (MT)**
35,000 16,264 40,029 15,231
(standard errors) *Weighted by provincial production and rain at harvest **Based on production estimation methodology of measuring in the field prior to harvest. If production was estimated from farmer questionnaires, then harvest and drying losses of dried grain would be excluded.
38
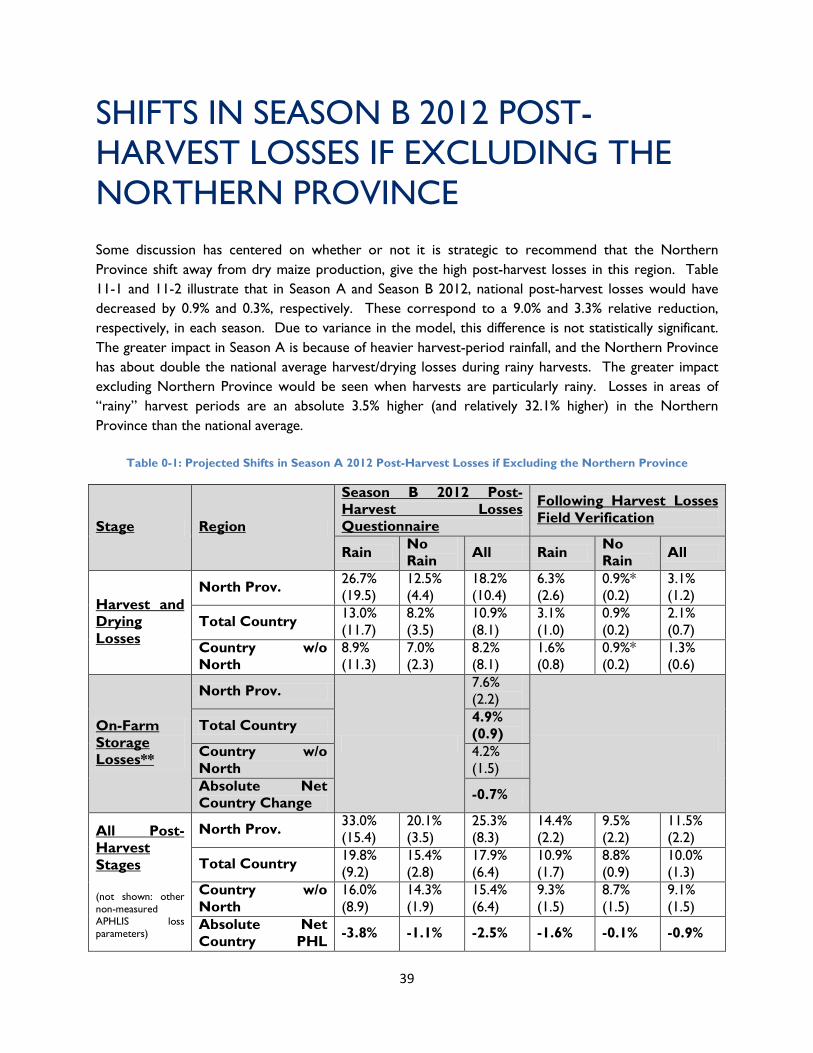
SHIFTS IN SEASON B 2012 POST-HARVEST LOSSES IF EXCLUDING THE NORTHERN PROVINCE Some discussion has centered on whether or not it is strategic to recommend that the Northern Province shift away from dry maize production, give the high post-harvest losses in this region. Table 11-1 and 11-2 illustrate that in Season A and Season B 2012, national post-harvest losses would have decreased by 0.9% and 0.3%, respectively. These correspond to a 9.0% and 3.3% relative reduction, respectively, in each season. Due to variance in the model, this difference is not statistically significant. The greater impact in Season A is because of heavier harvest-period rainfall, and the Northern Province has about double the national average harvest/drying losses during rainy harvests. The greater impact excluding Northern Province would be seen when harvests are particularly rainy. Losses in areas of “rainy” harvest periods are an absolute 3.5% higher (and relatively 32.1% higher) in the Northern Province than the national average.
Table 0-1: Projected Shifts in Season A 2012 Post-Harvest Losses if Excluding the Northern Province
Stage Region
Season B 2012 Post-Harvest Losses Questionnaire
Following Harvest Losses Field Verification
Rain No Rain All Rain No
Rain All
Harvest and Drying Losses
North Prov. 26.7% (19.5)
12.5% (4.4)
18.2% (10.4)
6.3% (2.6)
0.9%* (0.2)
3.1% (1.2)
Total Country 13.0% (11.7)
8.2% (3.5)
10.9% (8.1)
3.1% (1.0)
0.9% (0.2)
2.1% (0.7)
Country w/o North
8.9% (11.3)
7.0% (2.3)
8.2% (8.1)
1.6% (0.8)
0.9%* (0.2)
1.3% (0.6)
On-Farm Storage Losses**
North Prov.
7.6% (2.2)
Total Country 4.9%
(0.9) Country w/o North
4.2% (1.5)
Absolute Net Country Change -0.7%
All Post-Harvest Stages (not shown: other non-measured APHLIS loss parameters)
North Prov. 33.0% (15.4)
20.1% (3.5)
25.3% (8.3)
14.4% (2.2)
9.5% (2.2)
11.5% (2.2)
Total Country 19.8% (9.2)
15.4% (2.8)
17.9% (6.4)
10.9% (1.7)
8.8% (0.9)
10.0% (1.3)
Country w/o North
16.0% (8.9)
14.3% (1.9)
15.4% (6.4)
9.3% (1.5)
8.7% (1.5)
9.1% (1.5)
Absolute Net Country PHL -3.8% -1.1% -2.5% -1.6% -0.1% -0.9%
39
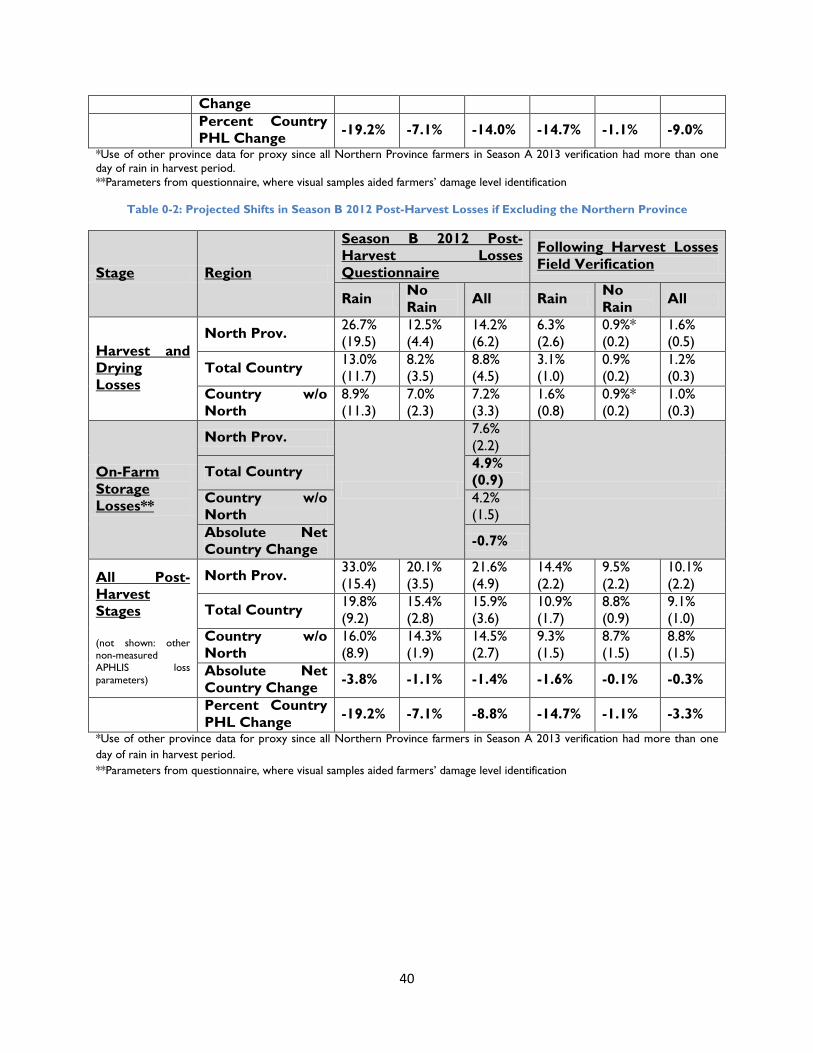
Change
Percent Country PHL Change -19.2% -7.1% -14.0% -14.7% -1.1% -9.0%
*Use of other province data for proxy since all Northern Province farmers in Season A 2013 verification had more than one day of rain in harvest period. **Parameters from questionnaire, where visual samples aided farmers’ damage level identification
Table 0-2: Projected Shifts in Season B 2012 Post-Harvest Losses if Excluding the Northern Province
Stage Region
Season B 2012 Post-Harvest Losses Questionnaire
Following Harvest Losses Field Verification
Rain No Rain All Rain No
Rain All
Harvest and Drying Losses
North Prov. 26.7% (19.5)
12.5% (4.4)
14.2% (6.2)
6.3% (2.6)
0.9%* (0.2)
1.6% (0.5)
Total Country 13.0% (11.7)
8.2% (3.5)
8.8% (4.5)
3.1% (1.0)
0.9% (0.2)
1.2% (0.3)
Country w/o North
8.9% (11.3)
7.0% (2.3)
7.2% (3.3)
1.6% (0.8)
0.9%* (0.2)
1.0% (0.3)
On-Farm Storage Losses**
North Prov.
7.6% (2.2)
Total Country 4.9%
(0.9) Country w/o North
4.2% (1.5)
Absolute Net Country Change -0.7%
All Post-Harvest Stages (not shown: other non-measured APHLIS loss parameters)
North Prov. 33.0% (15.4)
20.1% (3.5)
21.6% (4.9)
14.4% (2.2)
9.5% (2.2)
10.1% (2.2)
Total Country 19.8% (9.2)
15.4% (2.8)
15.9% (3.6)
10.9% (1.7)
8.8% (0.9)
9.1% (1.0)
Country w/o North
16.0% (8.9)
14.3% (1.9)
14.5% (2.7)
9.3% (1.5)
8.7% (1.5)
8.8% (1.5)
Absolute Net Country Change -3.8% -1.1% -1.4% -1.6% -0.1% -0.3%
Percent Country PHL Change -19.2% -7.1% -8.8% -14.7% -1.1% -3.3%
*Use of other province data for proxy since all Northern Province farmers in Season A 2013 verification had more than one day of rain in harvest period. **Parameters from questionnaire, where visual samples aided farmers’ damage level identification
40
SUMMARY AND EXTENSION RECOMMENDATIONS
GENERAL
1) Maize continues to primarily be a cash crop, with 87% of production sold in Season A and 84% in Season B.
2) Maize is stored longer in Season A than Season B, at 4.1 months vs. 3.2 months. This correlates with higher production in Season A.
3) Post-Harvest losses in Season A 2012 are estimated to be higher than Season B 2012, at 9.85% and 9.14%, respectively, due to greater Season A incidence of rain at harvest.
4) Most maize destined for the market is sold very quickly after harvest. In Season B, nearly 50% was sold within one month and 90% sold within two months. Mostly due to shorter holding periods, insect damage in marketed maize is a low average 1.1% compared to 4.8% in consumed maize.
5) If farmers desire to increase this period of storage before sale, careful attention must be paid to their dominant constraints—financial or technical ability to store.
a. If technical ability to store is the dominant constraint, the Post-Harvest Task Force can help to increase knowledge about grain preservation technologies and proper structures.
b. If the dominant constraint is financial, credit support is a more crucial focus.
TRAINING
Many farmer post-harvest practices have notable differences depending on training received.
1) Trained farmers in areas with rainy harvests have significantly lower harvest/drying losses. Harvest/Drying education seems to make little impact in areas with dry harvest periods. Therefore, expansion of harvest/drying training programs will have a greater impact on reducing post-harvest losses if concentrated on areas within provinces with rainy harvest periods.
2) Farmers trained in shelling practices and exposed to new technologies have notably higher adoption rates of more sophisticated shelling equipment.
3) Training in storage protectant use is the lowest of all post-harvest activities. There is a greatly elevated and statistically significant rate of storage protectant adoption among limited farmers who have received training. This category should be pursued in training regimens.
4) Rats are the largest reported contributor to on-farm storage losses, yet training on rat prevention techniques is largely absent from current curriculum. Rats should receive a greater focus in future post-harvest training.
5) The Western province is behind other provinces in many categories. The West has consistently higher usage of old and untreated sacks, low palette use, and simple technology utilization. This could be a region to particularly focus expansion of post-harvest education.
41
POST-HARVEST LOSSES MODEL PARAMETER ESTIMATIONS
1) Farmer-reported estimates in this study are meant to start a constructive discourse about contextualizing APHLIS parameters to Rwandan conditions, while maintaining the APHLIS calculation format.
2) A questionnaire should not be used to estimate harvest/drying losses. Instead, agents should use the simple methodology from the field verification to measure damaged and undamaged maize with balances. While the questionnaire method resulted in estimates somewhat close to the APHLIS general model parameters, the field verification loss parameters are significantly lower. A larger sample size for subsequent harvest/drying loss studies would help expand analysis on training and rain impact.
3) There are large differences between storage losses from this study and the APHLIS general model parameters. This Rwandan study suggests a non-zero parameter is much more appropriate for losses when storing for less than 4 months.
4) It is recommended to continue refining post-harvest loss parameters from the general model to the Rwandan context. The next most impactful parameters to contextualize are transport to farm (2.4% loss) and market storage (2.7% loss).
42
REFERENCES Adams, J. M. and Harman G.W. (1977). The evaluation of losses in maize stored on a selection of small farms in Zambia with particular reference to the development of methodology. Rep. Trop. Prod. Inst. G109, xi + 149.
Holst, N., Meikle, W.G., and Markham, R.H. (2000). Grain Injury Models for Prostephanus truncatus (Coleoptera: Bostrichidae) and Sitophilus zeamais (Coleoptera: Curculionidae) in Rural Maize Stores in West Africa. Journal of Economic Entomology. 93(4):1338-1346.
43
LIST OF TABLES Table i-1: APHLIS vs. MinAgri parameter comparison for 2012 National Post-Harvest Losses .................... 7 Table 1-1: Geographic distribution of Surveys ........................................................................................................... 8 Table 2-1: General Background Data -- Season A ................................................................................................... 10 Table 2-2: General Background Data – Season B .................................................................................................... 10 Table 2-3: Household Purchase of Maize Season A ................................................................................................ 11 Table 2-4: Household Purchase of Maize Season B ................................................................................................. 11 Table 2-5: Maize Market Outlets Season A ............................................................................................................... 12 Table 2-6: Maize Market Outlets Season B ............................................................................................................... 12 Table 3-1: Comparison of Harvest Loss Assessment Methods in Season B 2012 and Pilot Field Verification in Season A 2013 ....................................................................................................................................... 13 Table 3-2: Rain incidence at harvest and farmers rejecting some cobs .............................................................. 15 Table 3-3: Season B Harvest period expansion: Harvest/Field Losses when cobs rejected .......................... 15 Table 3-4: Alternative uses for field rejected cobs .................................................................................................. 16 Table 3-5: Physical losses after harvesting and drying under different climate conditions and training: Discriminate Analysis ...................................................................................................................................................... 17 Table 3-6: Comparison of Harvest/Drying Loss Parameter Results from Questionnaire and Field Verification ........................................................................................................................................................................ 18 Table 4-1: Drying Practices, Season A ........................................................................................................................ 19 Table 4-2: Drying Practices, Season B ........................................................................................................................ 19 Table 4-3: Losses in Drying Process: Questionnaire Method ............................................................................... 20 Table 5-1: General Shelling Methods, Season A ....................................................................................................... 20 Table 5-2: Shelling Methods with Training Considered, Season A ........... Error! Bookmark not defined. Table 5-3: General Shelling Methods, Season B ....................................................................................................... 21 Table 5-4: Shelling methods with training considered, Season B ......................................................................... 22 Table 6-1: Maize form in storage, Season A (consumed) ....................................................................................... 23 Table 6-2: Maize form in storage, Season B (consumed) ....................................................................................... 23 Table 6-3: Storage Containers, Season A (consumed) ........................................................................................... 23 Table 6-4: Storage Containers, Season B (consumed)............................................................................................ 23 Table 6-5: Polypropylene sack type, Season B (consumed) ................................................................................... 24 Table 6-6: Use of palettes (consumed) ....................................................................................................................... 24 Table 6-7: Maize form in Storage, Season A (sold).................................................................................................. 24 Table 6-8: Maize form in storage, Season B (sold) .................................................................................................. 24 Table 6-9: Storage Methods, Season A (sold) ........................................................................................................... 25 Table 6-10: Storage methods, Season B (sold) ......................................................................................................... 25 Table 6-11: Polypropylene Sack type, Season B (sold) ........................................................................................... 25 Table 6-12: Use of palettes (sold) ................................................................................................................................ 25 Table 6-13: Use of storage protectants [including training], Season A .............................................................. 26 Table 6-14: Use of storage protectants [including training], Season B ............................................................... 27 Table 6-15: Storage Protectants Specified, Season A .............................................................................................. 27 Table 6-16: Storage Protectants Specified, Season B .............................................................................................. 28
44
Table 6-17: Season B: Marketing of Maize (timing, marketed before survey period) ..................................... 28 Table 6-18: Storage Losses and components, Season B ......................................................................................... 29 Table 6-19: Season B 2012 Maize Storage Economic Loss Estimates ................................................................. 30 Table 6-20: Season B 2012 Maize Storage Training Benefit Estimation .............................................................. 30 Table 6-21: APHLIS specifications for storage losses with respect to time stored ......................................... 30 Table 6-22: Maize damage level, previously marketed grain ................................................................................. 31 Table 6-23: Maize damage level, previously consumed grain ................................................................................ 31 Table 6-24: Maize damage level, grain remaining in home ..................................................................................... 32 Table 7-1: Training received, Season A 2012 ............................................................................................................ 33 Table 7-2: Training received, Season B 2012 ............................................................................................................ 33 Table 8-1: APHLIS Losses by Province, Season A ................................................................................................... 35 Table 8-2: APHLIS Losses by Province, Season B .................................................................................................... 35 Table 8-3: APHLIS Losses By Province, Year 2012 ................................................................................................. 35 Table 9-1: APHLIS vs. new MinAgri Parameters: Summary of Season B 2012 Physical Losses .................... 37 Table 10-1: Back-casting Post-Harvest Losses with New Field Measurements................................................ 38 Table 11-1: Projected Shifts in Season A 2012 Post-Harvest Losses if Excluding the Northern Province 39 Table 11-2: Projected Shifts in Season B 2012 Post-Harvest Losses if Excluding the Northern Province 40
45