Post-apartheid Transformation of the South African ‘Hidden ... case study... · Post-apartheid...
38
Post-apartheid Transformation of the South African ‘Hidden Urbanites’: Reflections from Mdantsane Township ‘Still entrenched in the apartheid paradise’ Pakama Q. Siyongwana & Nelson Chanza Department of Geosciences Nelson Mandela Metropolitan University Port Elizabeth
Transcript of Post-apartheid Transformation of the South African ‘Hidden ... case study... · Post-apartheid...

Post-apartheid Transformation of the South African ‘Hidden Urbanites’:
Reflections from Mdantsane Township
‘Still entrenched in the apartheid paradise’
Pakama Q. Siyongwana & Nelson Chanza Department of Geosciences
Nelson Mandela Metropolitan University Port Elizabeth

Mdantsane | Page ii
Contents
EXECUTIVE SUMMARY ...................................................................................................... iv
2. INTRODUCTION .............................................................................................................. 6
3. HISTORY ......................................................................................................................... 7 2.1 Phase 1: Mdantsane during the British Administration (1847- 1949) ........................................... 7 2.2 Phase 2: Duncan Village and Mdantsane during apartheid (1950- 1962) ................................... 8 2.3 Phase 3: Mdantsane’s isolation from East London during the Bantustan Regime (1963- 1993). 9 2.4 Phase 4: Mdantsane’s integration into Buffalo City (post-1994) ................................................ 10 2.5 Synthesis .................................................................................................................................... 10
4. POLICY CONSIDERATIONS AND PLANS .................................................................... 11 3.1 The Reconstruction and Development Programme, 1994 ......................................................... 11 3.2 The Development Facilitation Act (Act No. 67 of 1995) ............................................................. 11 3.3 The Urban Spatial Development Framework (USDF) of 1997 .................................................. 11 3.4 The National Development Plan (NDP), 2012 ............................................................................ 12 3.5 The Spatial Planning and Land Use Management Act (SPLUMA) of 2013 ............................... 12 3.6 The Integrated Urban Development Framework (IUDF) of 2014 ............................................... 12 3.7 Synthesis .................................................................................................................................... 12
5. POPULATION ATTRIBUTES AND TRENDS ................................................................. 13 4.1 The Population Profile and Migration Patterns ....................................................................... 13 4.2 The Changing Pattern in Education ............................................................................................ 16 4.3 Employment and Unemployment ............................................................................................... 18 4.4 Development Indicators .............................................................................................................. 20 4.5 Allocation of Government Grants ............................................................................................... 21 4.6 Synthesis .................................................................................................................................... 22
5. HOUSING AND SERVICES ........................................................................................... 23 5.1 Changes in the Housing Landscape ........................................................................................... 23 5.2 Upgrading of Informal Settlements ............................................................................................. 24 5.3 Public Health, Water and Sanitation Services ............................................................................ 24 5.4 Security Services and the Eradication of Crime ......................................................................... 24 5.5 Transport Services ...................................................................................................................... 25 5.6 Electricity Provision ..................................................................................................................... 26 5.7 Other Services ............................................................................................................................ 26 5.8 Synthesis .................................................................................................................................... 26
6. THE ECONOMY ............................................................................................................. 27 6.1 Economic Growth ....................................................................................................................... 27 6.2 Economic Structure and Change ................................................................................................ 27 6.3 Economic and Industrial Development ....................................................................................... 28
6.3.1 Mdantsane’s Development Nodes ....................................................................................... 29 6.3.2 The Mdantsane Urban Renewal Programme (MURP) ........................................................ 30
6.4 Informal Sector Trading Activities ............................................................................................... 31 6.5 Synthesis .................................................................................................................................... 32
7. CONCLUSION: CHANGING FUNCTIONAL ROLES? .................................................... 32
8. 35

Mdantsane | Page iii
9. 35
10. 36
References ......................................................................................................................... 37
List of Figures
Figure 1: The Location of Mdantsane ..................................................................................................... 8 Figure 2: : Comparison of the population growth in Mdantsane, Duncan Village and Buffalo City,
1996-2011 (1996 was calculated as 100%) ............................................................................. 14 Figure 3: Changes in the Mdantsane population according to age composition (1996, 2001 and 2011
from the inner to the outer circle, respectively) ........................................................................ 15 Figure 4: The pass rate of students in Buffalo city for the period 2010-2012 ....................................... 17 Figure 5: : Changing patterns in respect of the economically active population and the unemployed in
Mdantsane, and for the black population in Buffalo City, between 1996 and 2013 (1996 figures taken as 100%) ............................................................................................................ 19
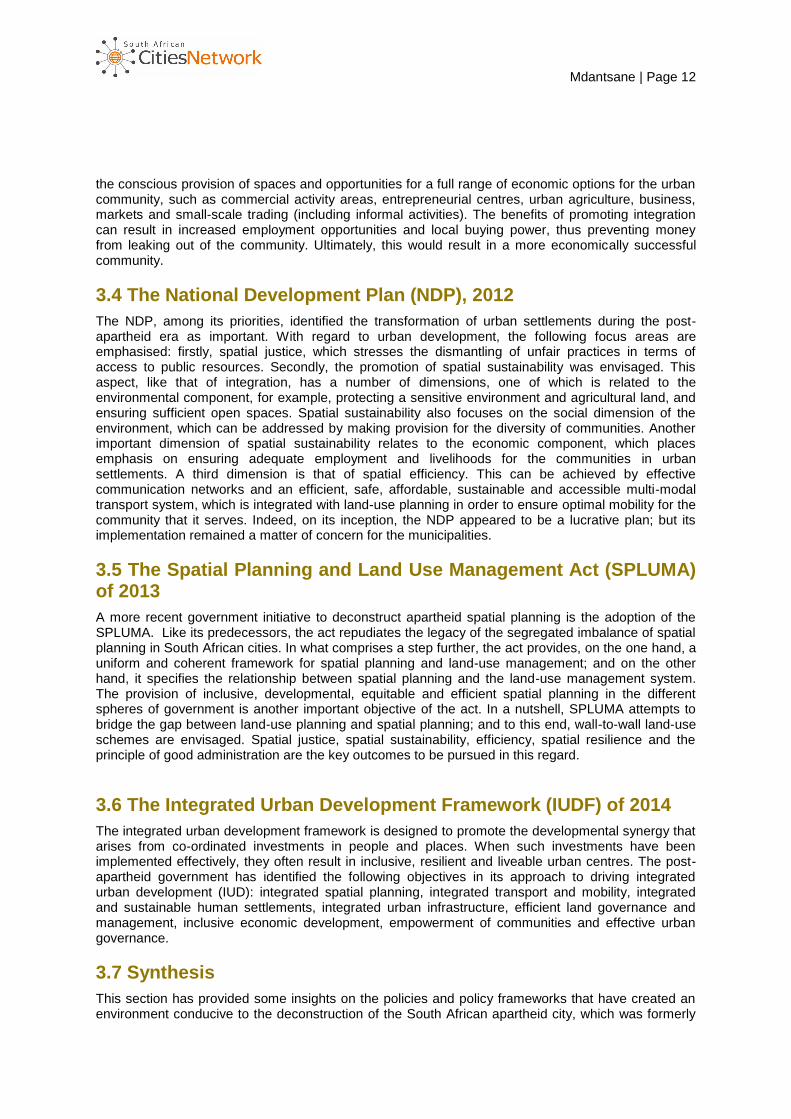
Figure 6: The growth in the number of government social grant beneficiaries in Mdantsane, 2010 to 2013 ......................................................................................................................................... 22
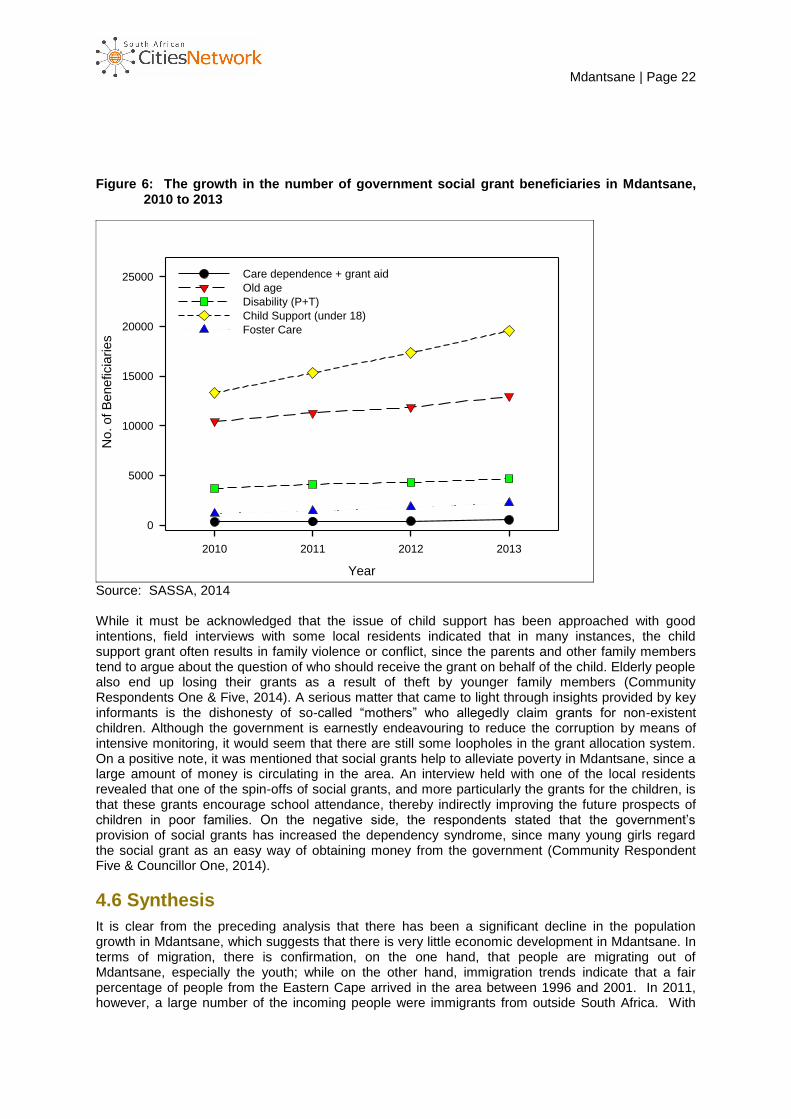
Figure 7: The changing housing landscape (formal vs informal dwelling units) in Mdantsane – 1996, 2001 and 2011 ............................................................................................................... 23
Figure 8: Apartheid planning and Mdantsane ...................................................................................... 35 Figure 9: Post-apartheid trends in Mdantsane ..................................................................................... 36
List of Tables
Table 1: A synthesis of the development phases of Mdantsane, 1847-2014 ................................. 10 Table 2: Population of Mdantsane, Duncan Village and Buffalo City (1996, 2001 & 2011) ................. 13 Table 3: Racial breakdown of population in Mdantsane, Duncan Village and Buffalo City .................. 16 Table 4: Migration patterns in Mdantsane (1996, 2001, and 2011) ...................................................... 16 Table 5: The percentage of people employed per economic sector for Buffalo City and Mdantsane – 1996 and 2013 ...................................................................................................................................... 20 Table 6: Poverty situation in Mdantsane and Buffalo City (black population) ................................. 20 Table 7: GDP growth in East London & Mdantsane – 1996, 2001, 2011 and 2013 ....................... 27 Table 8: GVA per sector in East London and Mdantsane – 1996 and 2013 ........................................ 28 Table 9: The implementation of MURP ................................................................................................. 30 Table 10: A comparison of apartheid and post-apartheid trends in respect of Mdantsane .................. 33

EXECUTIVE SUMMARY As in the case of all South African urban centres, racial segregation in East London was a popular practice during apartheid. During the late 1950s, the East London Municipality Council proposed that a black settlement further away from East London would be ‘more appropriate’ for the relocation of the black populace. Despite some local resistance, the creation of Mdantsane in 1959 paved the way for the relocation of people from Duncan Village. At the same time, the apartheid regime was promoting black urbanisation as one of the strategies to solve racial conflicts. Consequently, the black population in East London, and more particularly Duncan Village, had to be channelled to Mdantsane, which was located about 18 km from East London. Against this background, the term ‘Hidden Urbanites’ best describes the Mdantsane Township. Although the settlement was not initially established as an R293 town, the promulgation of the Regulation in 1962 resulted in Mdantsane being managed in terms thereof. The first blacks took up residence in Mdantsane in 1961; and thereafter, the township grew rapidly, with spacious houses compared with those of Duncan Village. Employment opportunities attracted numerous black people. The introduction of the Regional Industrial Decentralisation Programme (1962) in the country led to the establishment of the border industries (Wilsonia) and later, in 1979, of industries in Mdantsane (Fort Jackson). Such initiatives also contributed to employment opportunities. To facilitate communication in the area, a subsidised bus system was also introduced – an initiative which did not last long, owing to the bus boycotts of the late 1970s. A non-subsidised taxi system replaced the bus service. Propaganda of the apartheid state suggested that Mdantsane would be a model town, with a diversity of amenities making it comfortable for the black population. Although social amenities such as schools, tertiary educational facilities and hospitals were provided, interviews with key informants suggest a very different scenario. In actual fact, the relocation from Duncan Village and East London meant that much of the community spirit and social cohesion was eroded. The transition period as from the early 1990s brought its own challenges to Mdantsane’s black population, with a considerable decline in employment in Fort Jackson and, to a lesser degree, in Wilsonia. By the end of the 1980s, nearly 30,000 job opportunities were available in Wilsonia and nearly 7,500 in Fort Jackson. The withdrawal of decentralisation subsidies meant that the larger part of Fort Jackson is underutilised. Yet, the considerable growth in the auto-motive industry in East-London during the past twenty years has to a large degree counteracted the unemployment created by the withdrawal of state industrial manufacturing subsidies. A major breakthrough for the Mdantsane Township in the mid-1990s was its functional integration into the East London Transitional Local Council. Later, in 2001, wall-to-wall municipalities were introduced in South Africa and the Buffalo City Metropolitan Municipality (BCMM) was created, consisting of Buffalo City (East London), King William’s Town, Bisho and the surrounding rural areas. Since Mdantsane is located between East London and King William’s Town, it was envisioned that it would perform an infilling role. Various attempts were undertaken to upgrade the basic facilities in the area. Although the levels of basic services in Mdantsane were relatively high by 1996 (for example, 76% of households had water on the stand), substantial improvements have been made in terms of water provision, sanitation and electricity access. For example, access to electricity rose from 46% in 1996 to nearly 80% in 2011. These improvements have, in the main, been effectuated through national attempts to bring about urban renewal. Mdantsane was declared an urban renewal node in 2001. However, the initial euphoria was short-lived, since it transpired that only limited funds were available for this purpose. The European Union then stood up to the plate and funded a substantial portion of the endeavour before this attempt was also halted, because proper financial accounting procedures had not been followed. Although the contribution of the various attempts should be acknowledged, evidence on the ground suggests that the impact in general was minimal. Essential to note in this analysis is that, despite unfulfilled promises coupled with meagre investments and poor service delivery in the areas, Mdantsane remains a stronghold for the ruling party, the African National Congress (ANC), with influential people having their roots in the area.

Mdantsane | Page v Mdantsane has also lost people in real terms over the past twenty years. The population, which once stood at approximately 195,000 (in 1996), dropped sharply to approximately 165,000 in 2011 according to official statistics. However, an increase in the number of households was recorded between 1996 and 2001. Strangely enough, Duncan Village also lost people, but Buffalo City grew at a moderate rate. This trend could be attributed to increased desegregation in East London and the decline in secondary manufacturing. Yet, the considerable growth of the automotive industry near the East London harbour served as a magnet to attract people from the two townships. The population age profile of Mdantsane also suggests the outflow of working-age people and the overall ageing of the population. The percentage of people aged 15-34 dropped from 39% in 1996 to 36% in 2011. Although migration occurs on a limited scale, there is evidence that most migrants are from the Eastern Cape, and also some evidence of a small but increasing number of non-South Africans. In terms of the real numbers of people employed in Mdantsane, a considerable drop has been reported, from about 40,000 formally employed people in 1996 to just over 10,000 in 2013. The most significant sectoral drop was recorded in the manufacturing sector. The loss of employment greatly affected household income, forcing many people to rely on government social grants. The Buffalo City Municipality has also made great strides in improving services and facilities through the Integrated Development Plan (IDP). During the current five-year cycle, the provision of roads and housing is a top priority. It was indicated during interviews that the growth of housing tended to occur mainly towards King William’s Town, owing to the effect of the topography. Thus, it can be surmised that the lack of sufficient capital investment and the undulating and fragmented terrain are among the major impediments to urban development in the area. Regrettably, the unavailability of good social services in Mdantsane is a matter of concern – residents complained about poor schools, poor health facilities and the lack of recreation centres. This has led to the continued dependence of the Mdantsane community on East London for better social facilities. It is clear in this report that since its establishment, and particularly following its integration into the BCMM in 2001, Mdantsane has undergone a metamorphosis. Thus, the intention of this study is to reflect on the transformation of ‘Mdantsane Urbanites’ during the post-apartheid period. In this reflection, therefore, the intention is to draw some comparisons in order to identify some resemblances and dissimilarities in relation to other hidden urbanites, namely Botshabelo, Seshego and Winterveld(t).

1. INTRODUCTION Between the late 1950s and the early 1980s, the apartheid regime re-directed blacks to certain designated spaces in order to promote black urbanisation (Christopher, 1994). According to Mabin (1990), this re-routing peaked between the 1960s and the early 1980s, a period when blacks were being resettled outside the municipal city boundaries (e.g., areas behind the homelands). This policy, according to Williams (2000), resulted in the de-integration of blacks from the main urban cores. This situation often resulted in the formation of unique settlements which were commonly known as ‘hidden urbanites’ or ‘displaced settlements’. These settlements can best be described as functionally urban but predominantly residential; and services were limited in extent. In some cases, these settlements were located far away from the main core. A case in point is Mdantsane in the Buffalo City Metropolitan Municipality (BCMM), which is situated about 18km from East London (Buffalo City). These shortcomings caused the settlements to be predominantly dependent on the main urban centres. In many instances the displaced settlements coincided with the creation of what were known as R293 towns (referring to the Regulation for Administration and Control of Black Townships). During the resettlement process, the communities’ lives were disrupted and the dispossession of land also occurred with meagre compensation to some, and none at all to others. The resettled communities in black dormitory towns usually had one or more common characteristics, including the following: They were far from the former white cities and consequently, also from services and facilities; they were not economically sustainable; and in terms of the provision of better services, they were neglected. Even more surprising is the fact that they were administrated separately and politically cut off from their former towns which comprised part of White South Africa. These settlements were effectively isolated. All these factors placed these communities in a losing position in terms of development during the apartheid era. Notwithstanding the fact that the ‘hidden urbanites’ were criticised for being the creation of the Bantustan policy, it should also be taken into consideration that they had a well-defined administration which was run according to certain rules and regulations. Essentially, this practice was not without its consequences for the urban landscape, the most prominent being the fact that it prohibited black people from urbanising in the core economic areas of South Africa, notably towns and cities. Mdantsane emerges as a distinctive township established under such segregation policies. The community was established in the 1960s by the then apartheid government; and this practice of separation lasted into the mid-1990s. Given that the practice began to subside in the late 1980s, as South Africans were looking anxiously towards the attainment of democracy, it is necessary to understand how the post-apartheid situation influenced developments in Mdantsane. Of particular importance in this analysis is the fact that Mdantsane is not a unique case in South Africa. Other hidden communities characterised by similar experiences include, for example, Botshabelo in Bloemfontein, Winterveld in Pretoria, Seshego-Makweng in Pietersbug, Dimbaza and Zwelitsha in King William’s Town, Glenmore in Grahamstown, Wittlesea and Ezibeleni in Queenstown and Loskop in Estcourt. Against this background, and under the auspices of the South African Cities Network (SACN), this study comprises part of the ongoing discourse to reflect on the geography of post-apartheid displaced settlements against the post-apartheid development orientation. The research followed a case-study methodology entailing field visits, observations and interviews with selected participants, including residents, municipal and government officials, ward councillors and other key informants. Participants were identified through chain referrals. Specifically, the research aimed to address the following questions:
How have the socio-economic profiles of Mdantsane changed over the past two to three decades and what drove these changes?
How have certain key policies (at the local, provincial and national government levels) impacted positively/negatively on this displaced settlement?
What is the main direction, and what are the main drivers, of change in Mdantsane?

Mdantsane | Page 7 The report starts off by profiling the key historical aspects that influenced the establishment of Mdantsane. Thereafter, the influence of national, provincial and local government regimes in shaping developments in the township, during both the apartheid and post-apartheid periods is discussed. The demographic and migration trends of the area are also traced with a view to establishing the implications of such trends. It is also necessary to understand the economic situation of the area, since it has implications for the livelihoods of the residents. In addition, there is a need to analyse the infrastructure investments and the services involved, so as to understand the development priorities and interventions made by the responsible authorities. A detailed exposition of the spatial development of the area, as effectuated by the implementation of the Integrated Development Plan (IDP), is provided. The focus also falls on the implementation of Mdantsane Urban Renewal Programme (MURP). In addition, reference is made to governance and political developments over the past two decades and how these aspects have impacted on development in the area. Some conceptual reflections on the existing literature on displaced settlements are incorporated throughout the report. In conclusion, the main directions and drivers of change and the post-apartheid implications of such developments in South Africa, are discussed.
2. HISTORY This section spells out the key historical processes behind the establishment of Mdantsane as an apartheid ‘creation’ or hidden settlement. However, it is not easy to appreciate the history of Mdantsane without referring to both the history of the development of East London and that of Duncan Village, a neighbourhood adjacent to East London that shares a close history with Mdantsane. Similarly, it is also necessary to consider South Africa’s resettlement policies, as these impacted on such hidden settlements. A road map of East London’s development and resettlement initiatives will be discussed. For the purposes of greater clarity, the discussion is divided into chronological phases. Each phase was defined in terms of concomitant major developments in the East London landscape and resettlement schemes.
2.1 Phase 1: Mdantsane during the British Administration (1847- 1949)
Formerly, in this area (later known as Mdantsane), a white farmer practised extensive farming between 1847 and 1949. This German farmer was responding to a need to supply people with food, particularly the soldiers at Port Rex (later known as East London) during frontier wars. East London was established in 1847 and was later the area of the port of East London; and the adjacent areas were annexed as part of the Cape Colony. The black people, who were destitute and famished, decided to migrate to the port of East London in order to exchange their labour for food. The migration process was convenient to both the white community and the black community, as the former could thereby exploit the blacks, while the blacks were saved from starvation. The rapid influx of blacks to East London compelled the colonial government to find accommodation for them; and finally they were accommodated separately in Duncan Village. Thus, from the early development of East London, segregation was accepted as the norm; and consequently, the first black/African location was formalised as early as 1849 (Tankard, 1985). As in any other South African white town, the presence of blacks /Africans in East London was always precarious, as was the presence of the Asian community, owing to rampant segregation during that time. Indeed, radical measures to impose black African segregation were a response to health issues (the sanitary syndrome and land laws). The Native Urban Areas Act of 1923 is a typical example. The cornerstone of the Act was the basic principle that the blacks should be treated with integrity by providing them with accommodation. This led to the establishment of black townships. Compounding this situation, the outbreak of diseases in mixed areas created a strong case for land zoning, which was justified on the basis of health – a proposal that was recommended by the Thornton Commission of 1937. The recommendations of this Commission resulted in the establishment of Duncan Village.
Mdantsane | Page 8
2.2 Phase 2: Duncan Village and Mdantsane during apartheid (1950- 1962)
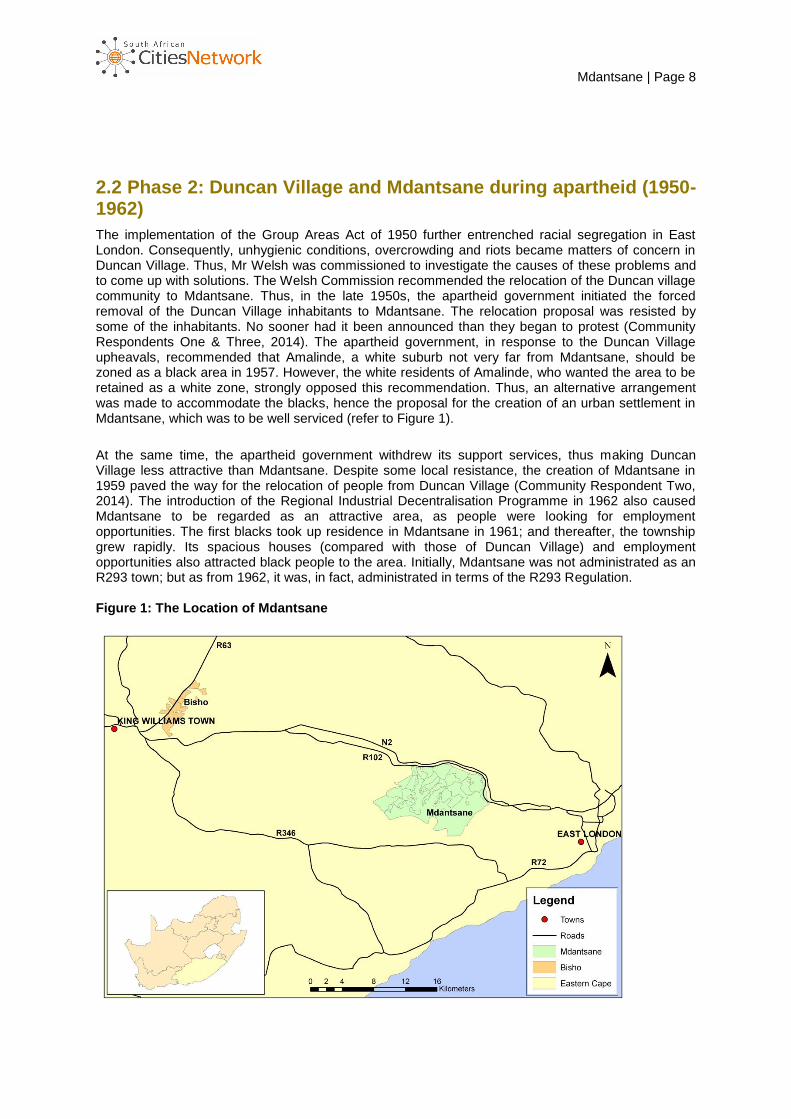
The implementation of the Group Areas Act of 1950 further entrenched racial segregation in East London. Consequently, unhygienic conditions, overcrowding and riots became matters of concern in Duncan Village. Thus, Mr Welsh was commissioned to investigate the causes of these problems and to come up with solutions. The Welsh Commission recommended the relocation of the Duncan village community to Mdantsane. Thus, in the late 1950s, the apartheid government initiated the forced removal of the Duncan Village inhabitants to Mdantsane. The relocation proposal was resisted by some of the inhabitants. No sooner had it been announced than they began to protest (Community Respondents One & Three, 2014). The apartheid government, in response to the Duncan Village upheavals, recommended that Amalinde, a white suburb not very far from Mdantsane, should be zoned as a black area in 1957. However, the white residents of Amalinde, who wanted the area to be retained as a white zone, strongly opposed this recommendation. Thus, an alternative arrangement was made to accommodate the blacks, hence the proposal for the creation of an urban settlement in Mdantsane, which was to be well serviced (refer to Figure 1).
At the same time, the apartheid government withdrew its support services, thus making Duncan Village less attractive than Mdantsane. Despite some local resistance, the creation of Mdantsane in 1959 paved the way for the relocation of people from Duncan Village (Community Respondent Two, 2014). The introduction of the Regional Industrial Decentralisation Programme in 1962 also caused Mdantsane to be regarded as an attractive area, as people were looking for employment opportunities. The first blacks took up residence in Mdantsane in 1961; and thereafter, the township grew rapidly. Its spacious houses (compared with those of Duncan Village) and employment opportunities also attracted black people to the area. Initially, Mdantsane was not administrated as an R293 town; but as from 1962, it was, in fact, administrated in terms of the R293 Regulation. Figure 1: The Location of Mdantsane

Mdantsane | Page 9 While some agreed to be relocated to Mdantsane, others remained in Duncan Village. How the people’s lives changed following their relocation from Duncan Village (Tsolo) to Mdantsane can be inferred from this narrative by one of the respondents: When I was in Tsolo there were a lot of activities that used to keep the youth busy. These included playing cricket and rugby in township schools; going to Victory cinema; watching Karate and boxing; accompanying our parents to town and in turn they would give us lifts on their bicycles. This good life in Tsolo came to an end when the government made a ruling that the Blacks in Tsolo should be relocated to the homeland in Mdantsane (Community Respondent One, 2014). Furthermore, stricter measures were imposed on those who remained in Duncan Village. According to one of the old residents, the Africans who remained in Duncan Village were required to provide proof that they had been born in the city, and had no home based either in the Ciskei or the Transkei homeland.
2.3 Phase 3: Mdantsane’s isolation from East London during the Bantustan Regime (1963- 1993)
While the apartheid government was encouraging the black inhabitants of Duncan Village to relocate to Mdantsane, the Department of Bantu Administration and Development was actively pursuing the homeland policy and black urbanisation. Mdantsane became “an ideal place to build a Ciskei homeland city which, itself, could also provide employment for the influx of the population as far away as the Western Cape” (Gordon, in Dauda, 1966:1). More important is the fact that the apartheid government made Mdantsane a liveable place which was attractive to blacks. A number of strategies adopted characterise this development. Firstly, the implementation of the Regional Decentralisation Programme (RIDP) in the 1960s saw the establishment of industries on the border of East London, particularly in Wilsonia and at Fort Jackson in Mdantsane. These industries provided employment opportunities to the Mdantsane residents. Nel (1990) confirms that in order to keep these industries operational, the government offered generous industrial subsidies and incentives. To cater for the absorption of a substantial number of employees, labour-intensive industries were established; for example, clothing, food, furniture and building-accessory factories. This means that a large proportion of the people in Mdantsane were employed in the industrial sector. According to Nel (1990), by the end of the 1980s, about 30,000 and 7,500 jobs respectively were available in Wilsonia and Fort Jackson. Notwithstanding the promising employment opportunities, those who were employed in the industrial sector were poorly remunerated (Community Respondent Two, 2014). This exploitation of Black employees is also reported by Pokwana (2013). The economic opportunities created did not last long, as evidenced by the industrial closure in the late 1980s and early 1990s. The following factors explain this development:
The emergence of labour unions in the 1980s, whose main role was to push for the recognition
of employees’ rights by means of the reviewing of working conditions and wages. At that time, the conservative employers would not comply with this transformation, resulting in protests.
The withdrawal of the government subsidies, which later made it impossible for some industries to keep on operating.
Secondly, to enable the workers to commute effectively, the apartheid government introduced heavily subsidised road and rail transport. Nonetheless, the 1970s witnessed bus boycotts which resulted in the discontinuation of the once-vibrant bus transport system. The public bus system has now been replaced by the taxi transport system, which is criticised as being very expensive, not user-friendly, and unsafe (Community Respondent One, 2014). Thirdly, through the ‘urban hibernate model’, the most urgently needed social services were provided. These included a tertiary institution (Ciskei Border Technikon), as well as the Rubusana Training College, the Cecilia Makiwane Hospital, residential houses, schools and police stations. It must be emphasised that all these tactics were aimed at ensuring that the blacks remained ‘locked’ in

Mdantsane | Page 10
Mdantsane so that they could not interfere with the whites (in East London).
2.4 Phase 4: Mdantsane’s integration into Buffalo City (post-1994)
The integration of Mdantsane with Buffalo City after 1994 was a major milestone. Following the implementation of Proclamation 79 of December 1994 in terms of the Local Government Transition Act (Act 209 of 1993, as amended), Mdantsane and Postdam officially became part of the East London Transitional Local Council (TLC). Thereafter, the status quo was retained until the year 2000. A major breakthrough was achieved when Mdantsane was entirely integrated into the Buffalo City Municipality. Another step further was achieved following the elevation of Buffalo City to the status of one of the South African metropolitan areas, the BCMM. Thus, the integration of Mdantsane with the BCMM provided it with numerous development opportunities that were not previously possible, owing to the inherent challenges discussed in the preceding sections.
2.5 Synthesis
The preceding analysis on the historical profile of Mdantsane is synthesised in Table 2.
Table 1: A synthesis of the development phases of Mdantsane, 1847-2014
Phases Mdantsane status Key attributes Main drivers
Phase 1: (1847- 1949)
Isolated rural farming – German
Cultivation of crops Rearing of stock Forestry
Demand for food and wood in East London and demand for food by the passing sailors in East London Harbour
Phase 2: (1950- 1962) :
Mdantsane newly established township
Initially not administered as R293 town Planned urban settlement with services for the black people Services and facilities Establishment of border industries
Racial segregation Dormitory town The need to alleviate over-congestion in Duncan Village Strategy to keep blacks away from East London Providing Mdantsane people with employment opportunities
Phase 3: (1963- 1993):
Bantustan City but mainly linked to the Ciskei
Administrated as R293 township from 1962-1994 Planned four-roomed houses Basic but limited services and facilities Labour-intensive industries at Fort Jackson and border industries near East London Subsidised bus services Emergence of taxi industries
Territorial segregation Homeland/Bantustan town Strategy to retain residents in Mdantsane and keep them away from East London Providing Mdantsane people with government-subsidised employment opportunities
Phase 4: (1994-2014)
South African Town co-opted to East London Transition Council (1994-2000) South African Town integrated into East London or Buffalo City (from 2001 onwards)
Administrated as South African Town Deterioration of apartheid industrial infrastructure and social infrastructure Urban Renewal Planning Private-sector investment initiatives
Integration with East London Integrated Spatial Planning Closure of the subsidised secondary manufacturing industries Decline of employment opportunities in the manufacturing industries More significant dependence on government services for growth

Mdantsane | Page 11
3. POLICY CONSIDERATIONS AND PLANS The section above provided a ‘historical diagnosis’ of Mdantsane during the different phases, as well as the influence of the apartheid legislative frameworks in shaping the township’s morphology. This section discusses the post-apartheid legislative frameworks which serve as a basis for reflecting on post-apartheid transformation. Since the attainment of South African democracy, the post-apartheid government has, among other important reforms, introduced a number of policy frameworks with a view to deconstructing the apartheid urban form, which reflected the white minority development biases and black segregation.
3.1 The Reconstruction and Development Programme, 1994
The Reconstruction and Development Programme (RDP) was introduced in 1994 as a macro-socio-economic policy aimed at correcting the spatial and social ills and injustices that had been inflicted during almost seventy years of apartheid rule. Government set an ambitious target of constructing, at national level, a minimum of 1 million housing units over a period of five years up to 1999. In Mdantsane, RDP houses were also built. Whilst this target may or may not have been met (since records suggest that reported numbers vary substantially), the basic aims of the RDP were not achieved. The implementation of the policy of providing RDP housing was conducted on a high note in Mdantsane; and the area was also earmarked to be one of the pilot development nodes of urban renewal. Thus, in 2001, it was announced that Mdantsane was to be one of the eight national urban renewal nodes (Rauch, 2003). The objective was to improve development, which was lagging behind in such areas. The former president of South Africa, Thabo Mbeki (2001), sharing sentiments during the launch of the eight urban national renewal projects, stated that the urban revitalisation package was essential for the upliftment of the formerly excluded socio-economic regions in order to rescue them from their economic tailspin. He argued that the urban renewal stimulus was essential to avert an economic catastrophe. However, with regard to the Mdantsane Urban Renewal Programme (MURP), evidence on the ground shows that there were no funds to implement the programme. Thus, the European Union came on board to save the situation by funding the MURP – subject to the condition that the BCMM was to have a clean audit (Mhlekude, 2014).
3.2 The Development Facilitation Act (Act No. 67 of 1995)
This Act was aimed at introducing measures to facilitate and expedite the speedy delivery of reconstruction and development programmes in the country. From a spatial planning perspective, the Act rejected the concept of low-density, segregated, fragmented and mono-functionally ineffective developments such as rampant urban sprawl, which impacted negatively on the delivery of civil infrastructural services. Thus, the act emphasised the notion of the integrated development of settlements. In terms of promoting integration, emphasis was placed on integrating the previously excluded groups into the city and providing them with access to the benefits that it offered, and on ensuring the development of more integrated, functional and environmentally sustainable human settlements, towns and cities. Although the act was introduced in 1995, there were problems regarding its implementation; thus, the policies that were developed later reinforced these concepts.
3.3 The Urban Spatial Development Framework (USDF) of 1997
Regarding the USDF, the government’s intention was to implement drastic strategies to transform the spatial planning of South African cities, and to ensure that they would reflect a high degree of integration. The urban integration was to focus on the following dimensions: firstly, functional integration, which advocates mixed-use areas with good infrastructure and services; secondly, the social integration, to promote the integration of social and cultural groups. It was hoped that social integration could be achieved through the provision of mixed housing, different land tenure options and financing options. Later on, this type of integration was reinforced by the introduction of inclusionary housing policy. Thirdly, economic integration was envisaged to support a mix of different income groups and economic activities. The success of economic integration can be demonstrated by
Mdantsane | Page 12 the conscious provision of spaces and opportunities for a full range of economic options for the urban community, such as commercial activity areas, entrepreneurial centres, urban agriculture, business, markets and small-scale trading (including informal activities). The benefits of promoting integration can result in increased employment opportunities and local buying power, thus preventing money from leaking out of the community. Ultimately, this would result in a more economically successful community.
3.4 The National Development Plan (NDP), 2012
The NDP, among its priorities, identified the transformation of urban settlements during the post-apartheid era as important. With regard to urban development, the following focus areas are emphasised: firstly, spatial justice, which stresses the dismantling of unfair practices in terms of access to public resources. Secondly, the promotion of spatial sustainability was envisaged. This aspect, like that of integration, has a number of dimensions, one of which is related to the environmental component, for example, protecting a sensitive environment and agricultural land, and ensuring sufficient open spaces. Spatial sustainability also focuses on the social dimension of the environment, which can be addressed by making provision for the diversity of communities. Another important dimension of spatial sustainability relates to the economic component, which places emphasis on ensuring adequate employment and livelihoods for the communities in urban settlements. A third dimension is that of spatial efficiency. This can be achieved by effective communication networks and an efficient, safe, affordable, sustainable and accessible multi-modal transport system, which is integrated with land-use planning in order to ensure optimal mobility for the community that it serves. Indeed, on its inception, the NDP appeared to be a lucrative plan; but its implementation remained a matter of concern for the municipalities.
3.5 The Spatial Planning and Land Use Management Act (SPLUMA) of 2013
A more recent government initiative to deconstruct apartheid spatial planning is the adoption of the SPLUMA. Like its predecessors, the act repudiates the legacy of the segregated imbalance of spatial planning in South African cities. In what comprises a step further, the act provides, on the one hand, a uniform and coherent framework for spatial planning and land-use management; and on the other hand, it specifies the relationship between spatial planning and the land-use management system. The provision of inclusive, developmental, equitable and efficient spatial planning in the different spheres of government is another important objective of the act. In a nutshell, SPLUMA attempts to bridge the gap between land-use planning and spatial planning; and to this end, wall-to-wall land-use schemes are envisaged. Spatial justice, spatial sustainability, efficiency, spatial resilience and the principle of good administration are the key outcomes to be pursued in this regard.
3.6 The Integrated Urban Development Framework (IUDF) of 2014
The integrated urban development framework is designed to promote the developmental synergy that arises from co-ordinated investments in people and places. When such investments have been implemented effectively, they often result in inclusive, resilient and liveable urban centres. The post-apartheid government has identified the following objectives in its approach to driving integrated urban development (IUD): integrated spatial planning, integrated transport and mobility, integrated and sustainable human settlements, integrated urban infrastructure, efficient land governance and management, inclusive economic development, empowerment of communities and effective urban governance.
3.7 Synthesis
This section has provided some insights on the policies and policy frameworks that have created an environment conducive to the deconstruction of the South African apartheid city, which was formerly

Mdantsane | Page 13 characterised by functional and structural inefficiencies accompanied by racial dichotomies, as manifested in inequalities in the accessing of public resources, as well as in income levels. In Mdantsane, however, it is yet to be seen whether these frameworks will be fully implemented to transform the socio-economic circumstances of formerly neglected citizens.
4. POPULATION ATTRIBUTES AND TRENDS The purpose of this section is to point out the major demographic developments in Mdantsane over the past three decades. Specifically, these developments will also be compared with those in other settlements in the BCMM, namely Duncan Village and Buffalo City, in order to contextualise the demographics. It should be noted from the outset that the trend in the demographics of the area has predominantly been shaped by apartheid segregation legislation that tended to detach black South Africans from the city, as evidenced by the active engagement of migrant labourers commuting from poor and underserviced settlements. Furthermore, it can also be argued that the post-1994 government’s approach to dealing with informal and poor settlements can best be described as a perpetuation of the old apartheid system.
4.1 The Population Profile and Migration Patterns
There are clear indications of a significant exodus of people from the Mdantsane area. This has serious implications for the current and future developmental aspects of the settlement. In tracing its population since 1996, it can be shown that Mdantsane is in a declining trend (see Table 3). Negative rates of annual population growth were recorded at -1.11% and -1.14% between 1996 and 2001, and between 2001 and 2011, respectively.
Table 2: Population of Mdantsane, Duncan Village and Buffalo City (1996, 2001 & 2011)
Area 1996 2001 2011 1996-2001 Annual growth rate
2001-2011 Annual growth rate
Mdantsane 195,165 184,600 164,681 -1.11 -1.14
Duncan Village
67,829 72,002 60,902 1.20 -1.66
Buffalo City 685,720 704,854 755,197 0.55 0.69
Source: StatsSA, 2014
It can be inferred from Table 3 that since 1996, Buffalo City has experienced an increase in population, while Mdantsane and Duncan Village are facing a decline. Between 1996 and 2001, Mdantsane’s population annually declined by 1.11%, in contrast to Duncan Village and Buffalo City, whose populations annually increased by 1.20% and 0.55, respectively. The decade between 2001 and 2011 saw a further annual decline of 1.14% in Mdantsane’s population. Duncan Village’s population figures also underwent an annual decrease of 1.66% in the same period. In contrast, Buffalo City’s population continued to grow at a rate of 0.69% per annum during the census decade of 2001-2011. The above situation is also further elucidated in Figure 2, which compares Mdantsane’s population growth with that of Duncan Village and Buffalo City. It can clearly be seen that both Mdantsane and Duncan Village are experiencing a significant decrease in population, while Buffalo City has increasingly been gaining more inhabitants since 1996. The reasons for this are related to poor service delivery and limited employment opportunities, which will be discussed later on in subsequent sections.

Mdantsane | Page 14 Figure 2: : Comparison of the population growth in Mdantsane, Duncan Village and Buffalo City, 1996-2011 (1996 was calculated as 100%)
Source: StatsSA, 2014
Another key demographic indicator relates to the composition and attributes of the population. This factor deals with the age structure, gender composition and poverty levels of the population in the areas assessed. With regard to gender composition, Mdantsane reflects the prevailing national statistics in South Africa, where the population is predominantly female. This can be confirmed by looking at the gender ratio, which refers to the mean number of males per 100 females. On average, South Africa has a gender ratio of 95 (that is, 95 males per 100 females). Mdantsane’s gender ratio of 90 is way below the national average. Alternatively, the gender composition can also be considered in terms of the proportion of the male population in relation to the female population. In 1996 and 2001, there were 53.6% females and 46.4% males in Mdantsane. The proportion of females slightly diminished to 52.7% in 2011. The reasons behind this trend could be related to limited employment opportunities, causing males to seek employment elsewhere in the country. The age categories that have been proportionately gaining in size over the three census periods are that of the aged population (60+ years) and that of persons in the age group of 35-59. It can be seen from Figure 3 that the number of persons over 60 increased from 6% in 1996 to 9% in 2011, while those in the 35-59 age group also increased from 25% to 28% during the same period. The increase in the aged population may suggest that most of the old people residing in Mdantsane are not willing to relocate to other places. When asked whether he was willing to relocate to another area outside Mdantsane, one of the respondents scoffed at this idea: At this age I will not go anywhere. Mdantsane is now my permanent home. Look at the developments that I have done to this house. Again, I can’t go to stay as a stranger in East London, while leaving my old friends behind (Community Respondent One, 2014). Thus, the reasons for the increasing proportion of those in the 35-59 age group could also be related to this sense of place and space, despite the limited employment opportunities and poor service delivery that characterise the area.

Mdantsane | Page 15 There is also evidence of a decrease in the youthful population (0-14 years) from 30% in 1996 to 27% in 2001. These figures subsequently stabilised until 2011. A more or less similar trend can also be observed in the 15-34 age group, which maintained a steady proportion of 39% from 1996 to 2011, before decreasing to 36% in 2011. It appears that the youths and young working-age inhabitants are leaving the area, probably to seek better education opportunities elsewhere. As shall be discussed later, the reduction in the youthful population has far-reaching implications for education services in the area. Figure 3: Changes in the Mdantsane population according to age composition (1996, 2001 and 2011 from the inner to the outer circle, respectively)
Source: StatsSA, 2014 Table 4 illustrates the racial breakdown of the population of Mdantsane, Duncan Village and Buffalo City. It can be seen that the populations of Mdantsane and Duncan Village are predominantly black Africans, followed by coloureds and then whites, and lastly Indians/Asians. However, in Duncan Village, the Indian/Asian population is higher than that of the whites. An exception can be seen in the case of Buffalo City, whose white population is second-highest, after its black African population. This means that most whites prefer to stay in Buffalo City, which has better services compared to the other settlements in the BCMM. A similar trend is reflected by all three censuses (see Table 4). The reason for this is historical, since settlements were designed according to racial groups during the apartheid era.

Mdantsane | Page 16 Table 3: Racial breakdown of population in Mdantsane, Duncan Village and Buffalo City
Area Black African
Coloured Indian/ Asian
White Unspecified/ Other
Mdantsane 1996 194,290 100 11 276 491
2001 184,120 108 18 353 0
2011 163,660 309 172 258 282
Duncan Village
1996 58,874 7,807 941 26 180
2001 65,056 6,222 683 43 0
2011 52,838 7,125 699 54 184
Buffalo City
1996 567,463 38,297 4,656 70,468 4,831
2001 601,250 40,023 4,371 59,209 0
2011 642,753 45,441 6,239 58,253 2,501
Source: StatsSA, 2014 In order to understand the migration patterns in Mdantsane, census data that indicate the previous places of residence between the years of 1996, 2001 and 2011, are compared (see Table 5). It can be seen that the majority of the migrants who entered the area came mainly from within the Eastern Cape Province, although it is also clear that a relatively high number of immigrants came mainly from Gauteng, as well as from the Western Cape and KwaZulu-Natal provinces. In 2011, there were also a large number of immigrants (494) from outside South Africa. A further analysis of the migration trends in the area reveals that about 44%, 1% and 3% of the migrants moved into Mdantsane in 1996, 2001 and 2011, respectively. Clearly, of late, very few people have been moving to Mdantsane. It can also be suggested here that, of the people moving into Mdantsane, a larger component may be members of the older population who choose to return to the area when they are no longer economically active.
Table 4: Migration patterns in Mdantsane (1996, 2001, and 2011)
Year Eastern Cape
Western Cape
Northern Cape
Free State
KZN North West
Gauteng Mpumalanga Limpopo Outside SA
Not specified
2011 152,137 432 38 47 116 11 376 37 23 494 3,122
2001 174,352 329 36 77 99 21 301 17 21 - 529
1996 108,288 935 197 104 93 6 334 14 10 - 15,807
Source: StatsSA, 2014
4.2 The Changing Pattern in Education
There is a common perception that the apartheid government built a diversity of schools and vocational training centres in the area. Figure 6 reveals that the pass rate of Grade 12 learners consistently remained low, at about 55%, between 2010 and 2012. This is in sharp contrast to the pass rate of learners in white, coloured and Duncan Village schools, which maintained a steady rise during the same period of reference. White schools, which fall into Quintile 5, tend to perform very well, as reflected by the average pass rate of over 90%. This is followed by coloured schools (Quintile 4) with a pass rate of over 80%, and Duncan Village, with over 65%. The performance of Mdantsane schools (Quintile 3) matches that of the rural schools (Quintile 2) in the BCMM, whose average pass rates are 53% and 52% respectively. Noting this poor performance, most parents have resorted to

Mdantsane | Page 17 transferring their children to the reputedly “better” schools in Buffalo City. One of the respondents observed: Sending our children to schools in East London is not only meant to enable them to access better quality education, but also to make sure that we equally enjoy the new democratic dispensation of racial integration. We want our kids to also learn in those schools previously reserved for whites, Indians and coloureds (Community Respondent Three, 2014). Figure 4: The pass rate of students in Buffalo city for the period 2010-2012
Source: Department of Basic Education, 2014 The reasons identified in order to explain the poor performance of Mdantsane schools are varied. They are mainly related to changes in the education policy itself. The policy’s failure to address fundamental aspects – such as learners’ development skills, teacher-learner ratios, teacher training and skills development, staff deployment and the enrolment of learners – is largely contributing to the poor quality of education in the country. Evidently, most of the teachers in Mdantsane are either under-qualified or lack the competence to impart skills such as computer literacy. Coupled with the reported lack of in-service training and the complacency of inspectors, the results of this situation can be seen in the poor education delivery system in the area. In addition, it is also evident that disparities in education services exist between East London and its townships, namely Mdantsane and Duncan Village. This is also reflected in the higher teacher-learner ratios in the latter case. During the interviews with the teachers, it transpired that in East London, teaching posts are created according to the number of learners, a practice that is not followed in Mdantsane (Teachers One & Two, 2014).
One respondent’s views on the low value attributed to education in the area are worth noting. She highlighted the need for the political will to address the education situation in these areas. In her opinion, both children and parents should embrace the culture of learning. The crucial question is: Do the parents value the education of their children? (Teacher Two, 2014). Another key informant had a different view regarding the deteriorating performance of schools in Mdantsane. According to him, the decline in the quality of education services can largely be attributed to the labour union movements, and particularly the South African Democratic Teachers Union (SADTU). It should also be noted that the demolishing of informal settlements has led to the displacement of learners, with a resulting

Mdantsane | Page 18 decline in school enrolment in Mdantsane (Principal One, 2014). A NAPTOSA representative also made the following comment regarding the status of education in Buffalo City: Parents see better education in town and they regard English as a magnet that attracts them to take their children from schools in Mdantsane township. To them fluency in English and good quality of education will make them competitive in the economic world in future. Poor results and not being fluent in English seem to be the major repellents in township schools (Teacher Three, 2014). It is also important to note that parents do not seem to be deterred by the associated daily commuting costs involved in seeking better education services in Buffalo City. One parent said: We are not at all deterred by the transport fares as long as our kids access quality education. Look, it is common knowledge that schools in Mdantsane are poorly resourced. I challenge you to identify any white, coloured or Indian pupil found in these schools. If [these schools] were nice then why is it that other racial groups are not studying here? (Community Respondent Two, 2014). The extent of the transport costs is reflected by the fact that the average taxi contract for one learner amounts to R400 per month. Nevertheless, the parents are prepared to pay the fees, as pointed out in the following quotation: “…One parent commented that for his child in Grade 7 he paid R700 per month but in grade 10-12 he had to pay R2800 per month in suburban schools. The educational expert alluded [to the fact] that although the fees were becoming higher, ordinary public schools were getting better in terms of provision of the services. In the Black townships students’ fees are marginal or [there is] no fee at all” (Nkonkobe Zisanda in the Daily Despatch of 8
th November, 2014).
The effects of this development can currently be clearly seen in the diminishing enrolment figures. Possible consequences may include school closures in a worst-case scenario. It has been reported that many schools are operating with diminishing learner numbers; for example, in some schools, the numbers have decreased from 600 to 200 (Former Principal, 2014). A similar declining trend in learner numbers was also reported in Duncan Village (Principal One, 2014). As a consequence, some schools face possible closure. A case in point is the Zwelibanzi Soga Secondary School located in the NU12 area. This school closed in 2011, and has subsequently been converted into a facility for infant learning (crèche). This factor has also affected the staff enrolment figures at some schools. At Lwandisa Lower Primary, for example, this figure decreased from the usual 12 to 2 in 2014.
4.3 Employment and Unemployment
According to Figure 5, the employment profile of Mdantsane compared to that of Buffalo City exhibits a sharp contrast. In order to make a proper comparison with the predominantly black population of Mdantsane, data for the black population of Buffalo City are used in this analysis. While the relevant profile of Buffalo City has maintained a steady increase, in keeping with the changes in the size of its economically active population, between 1996 and 2013, Mdantsane has witnessed a gradual fall in the population of formally employed people from 1996 to 2011, followed by a rapid fall between 2011 and 2013. The number of people formally employed in 1996 was 40,401, which had drastically declined to 10,344 by 2013. In Buffalo City, on the other hand, there were 89,000 people in formal employment in 1996; and this figure rose to 126,281 in 2013. Clearly, Mdantsane is not keeping up with its Buffalo City counterpart in terms of employment opportunities. The high unemployment rate in the area can be attributed to the closure and relocation of the industries at Fort Jackson and Wilsonia, mainly during the early 2000s. These industries had previously employed thousands of workers. One of the community members who used to work at Fort Jackson grumbled: Most of us here used to earn a living from the once vibrant factories at Fort Jackson. If you go to the area now, you will find that most of these factories are just shells. With the closure of such firms, we have been made destitute and our youth here are now found [loitering] in the streets pondering on new crime tricks (Community Respondent Four, 2014). The high rate of unemployment reflects the high rate of poverty in the area, which is examined in more detail in section 4.3.

Mdantsane | Page 19 Figure 5: : Changing patterns in respect of the economically active population and the unemployed in Mdantsane, and for the black population in Buffalo City, between 1996 and 2013 (1996 figures taken as 100%)
Source: Global Insight, 2014 A further analysis of the changes in the contribution of employment to the economic situation of Mdantsane for the periods 1996 and 2013 is provided in Table 6. The table shows that most of the people were employed in the manufacturing sector (33.47%) in 1996. After 1996, however, there was a moderate decline in the number of people who were employed in manufacturing. Thus, Table 6 reflects a moderate decline from 33.47% in 1996 to about 27% in 2013. The moderate decline was partly affected by the motor-vehicle investment, and more particularly the Mercedes Benz car manufacturing industry and its manufacturing linkages, which opened up opportunities, not only to the Buffalo city residents but also to Mdantsane residents. Table 6 also indicates that the proportion of those engaged in community services remained fairly stagnant at around 28%. The only economic sectors that are absorbing a greater component of the labour force are the trade, financial and household sectors. This is evident from the shrinking manufacturing sector that has resulted from the closure of industries at Fort Jackson. In Buffalo City, the number of people employed in the manufacturing sector has remained fairly stable at about 20%. This means that the problems relating to the shrinkage in the manufacturing sector are only being experienced in Mdantsane.
Economically active BC Unemployed BC Employed BC
Economically active Mda Unemployed Mda Employed Mda

Mdantsane | Page 20 Table 5: The percentage of people employed per economic sector for Buffalo City and Mdantsane – 1996 and 2013
Economic Sector
Buffalo City Mdantsane
1996 2013 1996 2013
Agriculture 4.83 3.06 2.88 2.35
Mining 0.03 0.09 0.03 0.00
Manufacturing 19.75 19.97 33.47 26.55
Electricity 0.70 0.94 0.44 0.43
Construction 7.58 5.78 4.77 4.52
Trade 15.09 19.81 14.82 16.24
Transport 3.68 3.22 4.51 3.94
Finance 17.56 16.29 8.25 12.70
Community services
17.71 19.68 28.71 28.16
Households 13.07 11.17 2.12 5.12
Total 100 100 100 100
Source: Global Insight, 2014
4.4 Development Indicators
In order to arrive at an understanding of the poverty situation in Mdantsane, a selected set of poverty indicators are used and these are compared with those of the black population in Buffalo City over the period from 1996 to 2013 (see Table 7). Overall, it can be seen that since 1996, Mdantsane has been lagging behind in terms of quality of life. The poverty situation is also measured against the national situation during the same period. In Mdantsane, the proportion of the population living in poverty was at its highest point in 2001 (53%), and at its lowest in 1996 (39%). Comparatively, Buffalo City recorded its highest (42%) and lowest (30%) number of people in poverty in 2001 and 1996, respectively. During the same period of reference, Mdantsane attained its highest Human Development Index (HDI) of 0.59 in 2013 – a figure way below the national average of 0.64 in the same year. Conversely, Buffalo City’s HDI of 0.66 in 2013 was higher than the national average. Clearly, this points to a sharp contrast in poverty levels between the two settlements. Table 6: Poverty situation in Mdantsane and Buffalo City (black population)
Year Mdantsane Buffalo City
Population in poverty
% of total
HDI Gini co-efficient
Population in poverty
% of total
HDI Gini coefficient
1996 90,598 39 0.55 0.49 87,884 30 0.62 0.59
2001 119,119 53 0.52 0.57 136,992 42 0.60 0.67
2007 103,258 50 0.52 0.57 138,797 40 0.61 0.67
2011 94,869 47 0.57 0.54 136,647 37 0.65 0.64
2013 91,729 46 0.59 0.53 142,795 38 0.66 0.63
Source: Global Insight, 2014
Another key variable with a view to understanding the poverty dimension of the population relates to the poverty levels and their distribution among the population. Income distribution in a population can be measured in terms of the Gini co-efficient. The World Bank (2014) defines this as: the extent to

Mdantsane | Page 21 which the distribution of income or consumption expenditure among individuals or households within an economy deviates from a perfectly equal distribution. As can be seen in Table 7, there is less variation in the income distribution of the Mdantsane population compared to that of Buffalo City. A study of the 2013 household income data also shows that more people with low annual household incomes reside in Mdantsane than in Buffalo City. The 2011 census data also reveal that the largest component of the population had no income at all (74,636), followed by 71,507 people with monthly incomes ranging between R1 and R6,400 and 7,374 economically active people earning more than R6,400 monthly. This development is not surprising, given the closure and downscaling of industrial operations and the limited investments in Mdantsane, amongst other factors. The monthly income of 8,935 people was not specified, while 2,224 people were not economically active. However, Statistics South Africa (StatsSA) prefers to measure poverty on the basis of household expenditure on key items. This criterion is used to determine the component of the population living below the poverty line. In terms of this approach, households or individuals whose incomes fall below a given level of the poverty line, or whose consumption level is valued at less than the value of the poverty line, are classified as poor. Clearly, it can be concluded that poverty is rampant in Mdantsane. It is also important to note that the poverty situation is not uniform among the population groups. Compared with other racial groups, black Africans are the hardest hit. This observation is consistent with the 2006-2011 Poverty Assessment Report by Statistics South Africa, which reveals that 94,2% of the poor people in the country during that period were predominantly black Africans (StatsSA, 2014). In view of the high unemployment rate and limited economic opportunities discussed earlier on in Section 4.3, the people rely heavily on social grants to make ends meet. A detailed discussion of this situation is provided in the next section.
4.5 Allocation of Government Grants
A significant proportion of Mdantsane residents are the beneficiaries of government grants (see Figure 6). The child support beneficiaries increased in number between 2010 and 2013, while the number of beneficiaries of the old age, disability, foster care and care dependence grants displayed a steady growth in the same period. What also came to light during the interview with the Mdantsane Councillor is the fact that the foster care grant beneficiaries are also increasing in number, owing to the increase in the number of orphans whose parents have succumbed to HIV/AIDS, in particular (Councillor One, 2014). However, what is disturbing is the notable growth in the number of beneficiaries of social grants and allocations, despite the declining population. The implication in this regard is that if social grants are the main source of income in many families/households, poverty in the area is likely to worsen. What also transpired during this interview is that there has been a substantial increase in the amount of money spent on government grants annually; for example, during the consecutive years of 2010, 2011, 2012 and 2013, the amounts of money injected into government social grants for Mdantsane were as follows: approximately R258 million, R298 million, R350 million and R408 million respectively.
Mdantsane | Page 22 Figure 6: The growth in the number of government social grant beneficiaries in Mdantsane,
2010 to 2013
Source: SASSA, 2014 While it must be acknowledged that the issue of child support has been approached with good intentions, field interviews with some local residents indicated that in many instances, the child support grant often results in family violence or conflict, since the parents and other family members tend to argue about the question of who should receive the grant on behalf of the child. Elderly people also end up losing their grants as a result of theft by younger family members (Community Respondents One & Five, 2014). A serious matter that came to light through insights provided by key informants is the dishonesty of so-called “mothers” who allegedly claim grants for non-existent children. Although the government is earnestly endeavouring to reduce the corruption by means of intensive monitoring, it would seem that there are still some loopholes in the grant allocation system. On a positive note, it was mentioned that social grants help to alleviate poverty in Mdantsane, since a large amount of money is circulating in the area. An interview held with one of the local residents revealed that one of the spin-offs of social grants, and more particularly the grants for the children, is that these grants encourage school attendance, thereby indirectly improving the future prospects of children in poor families. On the negative side, the respondents stated that the government’s provision of social grants has increased the dependency syndrome, since many young girls regard the social grant as an easy way of obtaining money from the government (Community Respondent Five & Councillor One, 2014).
4.6 Synthesis
It is clear from the preceding analysis that there has been a significant decline in the population growth in Mdantsane, which suggests that there is very little economic development in Mdantsane. In terms of migration, there is confirmation, on the one hand, that people are migrating out of Mdantsane, especially the youth; while on the other hand, immigration trends indicate that a fair percentage of people from the Eastern Cape arrived in the area between 1996 and 2001. In 2011, however, a large number of the incoming people were immigrants from outside South Africa. With
Year
2010 2011 2012 2013
No. of B
eneficia
ries
0
5000
10000
15000
20000
25000 Care dependence + grant aid
Old age
Disability (P+T)
Child Support (under 18)
Foster Care
Mdantsane | Page 23 regard to poverty, it has been clearly demonstrated that this problem is acute in Mdantsane. In addition, there is a surprisingly high level of dependency on government grants by Mdantsane residents.
5. HOUSING AND SERVICES This section begins by assessing the changes in formal and informal housing trends between 1996 and 2011. Thereafter, interventions made in the upgrading of informal settlements are considered. The focus subsequently falls on projects for improving public health, water and sanitation. Security and the eradication of crime are major issues of concern, both to the residents and government officials. These are considered separately. The provision of transport infrastructure and services is also discussed, after which the focus falls on interventions made by the responsible authorities with regard to electricity provision.
5.1 Changes in the Housing Landscape
As can be seen in Figure 7, the provision of formal dwelling units rose by 3% between 1996 and 2011. This figure is likely to have maintained a steady rise since then, given the ongoing efforts by the BCMM to formalise illegal and informal settlements, interventions which are discussed in the next section. The proportion of informal houses recorded in 2001 (27%) fell to 22% in 2011, which might indicate a positive response to the interventions made in the eradication of illegal settlements in the area. By the year 2012, there were 82 informal areas of different cluster groups defined by land tenure disputes, infrastructural problems, vulnerability and marginal areas, and the rural-urban fringe (BCMM Official Three, 2014). These settlements collectively contain approximately 7,886 households (Mdantsane Local Spatial Development Framework, 2013). While most of the informal settlements are concentrated on the outskirts (mainly new residential areas) of Mdantsane, scattered informal in-fills are identifiable across the landscape. This implies that the new houses are being developed among the old houses. Figure 7: The changing housing landscape (formal vs informal dwelling units) in
Mdantsane – 1996, 2001 and 2011
Source: StatsSA, 2014
formal, 1996, 74%
formal, 2001, 71%
formal, 2011, 77%
informal, 1996, 23%
informal, 2001, 27%
informal, 2011, 22%
informal
formal

Mdantsane | Page 24
5.2 Upgrading of Informal Settlements
As indicated earlier, informal settlements have developed in Mdantsane in response to the housing shortage. The study has revealed that some strategies are in place to formalise and upgrade these settlements. From the perspective of the BCMM official, there are three categories of informal settlements requiring municipal attention in Mdantsane. The first category is that of informal settlements that can be easily formalised. Under this category, 16 settlements were identified, consisting of approximately 1,730 households that could be formalised on their existing plots (Mdantsane Local Spatial Planning, 2013). The second category refers to those informal settlements that cannot be formalised. Such settlements are often located at the wrong places. These include informal settlements that are encumbered by problems relating to tenure, such as being located on private land; the presence of squatters on steep terrain; inaccessible road networks; problems regarding connection to the sewage system; and proximity to power stations. The third category consists of densely crowded informal settlements, as well as those that are located at the periphery of Mdantsane on municipal land. The BCMM has accorded priority to settlements located at the wrong places, with tenure issues and high-density housing. About 6,000 housing units have been identified in this category (BCMM Official Three, 2014).
5.3 Public Health, Water and Sanitation Services
It is an undisputable fact that the neglect that previously characterised hidden settlements like Mdantsane led to public health issues associated with poor water and hygiene services. Interviews with the residents revealed that the native housing units of the apartheid system did not have proper sewer reticulation systems. Instead, a practice commonly known as ‘the bucket system’ was adopted – where only the solid human waste, which should be separated from urine, is put in plastic buckets ready for scheduled collections by the waste collectors. One of the native residents, who was familiar with this service, reported: It was a very unhygienic situation. Imagine being asked to separate solid from liquid waste, say you have a running stomach. If they [found] that there [was] a mixture of solid and liquid waste in the bucket, they would simply flush it over your yard and go away laughing (Community Respondent One, 2014). In line with the current local spatial development framework for settlement upgrading in the area, water provision and sanitation services are now embedded as priorities. In terms of water supply, Mdantsane is serviced by water from the Lower Buffalo Regional Water Supply via the Nahoon and Bridledrift dams, with reservoirs at Outspan, Mount Ruth and passing through Damsport and Fort Jackson. The water supply is augmented from the Middle Regum Water Scheme, via Lan Dam.
The post-apartheid government has prioritised the improvement and upgrading of the sewerage reticulation infrastructure. Water is now connected to almost all the houses, with inbuilt toilets, instead of toilet and ablution facilities that are detached from the main housing units (Community Respondent One, 2014). On site, a project to upgrade the water and sewerage infrastructure is ongoing. Despite the fact that the Buffalo City Metropolitan Municipality had provided a sewage reticulation system, the local community staged protests, claiming that the pipes were of poor quality and that this was reflected by the continual bursting of pipes. The service-delivery protest ‘hotspots’ in Mdantsane were identified, including Mdantsane East and the Mdantsane Highway area. Indeed, service-delivery protests also often occur in Duncan Village (Former Councillor & Councillor One, 2014). Although some projects, such as the upgrading of the Cecilia Makiwane Hospital, were evident during fieldwork, the major challenge has been delays in the completion of projects, as a result of strikes and court cases challenging the tender awards (Daily Dispatch, 26 February 2014).
5.4 Security Services and the Eradication of Crime
According to the old residents of the township, there were very low crime rates in Mdantsane during the period before 1994. There were no shacks and business could be conducted until late at night (up to 12 o’ clock, midnight). The respondents were of the opinion that the relaxation of migration and

Mdantsane | Page 25 urban-planning laws, such as the R293 regulation, promoted unregulated movements of people who ended up in shacks and illegal settlements. In their view, these inhabitants are responsible for destroying the social fabric of Mdantsane. The residents are concerned about the complicity of responsible authorities in respect of crime – a problem that hampers crime eradication. Of particular concern is the safety of vulnerable groups such as women and girls, who often become victims of rape and murder by criminal gangs. With this in mind, the BCMM plans to address some of these safety issues by embarking on a project to establish safe houses to accommodate victims of domestic violence, especially young mothers and children (BCMM Official Two, 2014). It is envisaged that a non-governmental organisation (NGO) will be responsible for executing this plan. However, such a solution only addresses the symptoms of the problem. The major concern was expressed by one of the participants as follows: What is in store for the youth? Due to [being denied] economic and skills development opportunities, young girls, for example, mostly end up as liquor/drug addicts, hanging around shebeens. If kids are not in school, not economically engaged, or not involved in any sporting activity, where will they end up? This situation creates a grant dependent community leading to a vicious cycle of poverty (Former Principal, 2014). Concern has been expressed regarding the sustainability of youth empowerment programmes and crime eradication projects, given a history of failed projects. For example, it was reported that in 2008, a R65-million pledge extended by a German bank for the purposes of funding a violence-prevention project did not materialise, owing to uncertain circumstances relating to approval by the BCMM (Daily Dispatch, 08 April 2011). Evidence of poorly conceived projects that ultimately became white elephants is also provided in the Daily Dispatch of 09 October 2002, which reported that a R1-million art centre remained deserted at the highway taxi rank two years after its official opening. The municipality cited the high operational costs of running such a centre, whose funds had not been budgeted for (BCMM Official One, 2014).
5.5 Transport Services
Overall, the public transport system is mostly dominated by poorly-regulated taxis, which are often unsafe and not passenger-friendly. Numerous accidents and overloading remain a challenge to the South African transport sector. The situation in Mdantsane mirrors this chaotic state of affairs, which urgently calls for transformation. This study revealed that the transport services are dominated by minibus taxis servicing the Mdantsane-Buffalo City route. This operation is dogged by challenges relating to exorbitant fares, in addition to the challenges mentioned above. According to the local residents, the daily commuting costs are very high. One of the respondents complained: We are being robbed here. I pay R8.50 for a single trip from this place (NU15) to the Highway terminus (NU2) and from NU2 to the City (Buffalo City CBD) an additional R13.50, which adds up to R24. The total cost for a return trip will be R48/day. Thus, at the end of the month one can spend close to R1,000 on transport alone (Community Respondent Three, 2014). Given that the bus service, which is considered cheaper, is erratic and does not adequately cover all the areas of the township, the largely low-income commuters face a dilemma. The development of the transport sector has not been without its challenges. For example, the highly informalised local transport operations have serious safety implications for the public planners and the general public. From a BCMM transport official’s perspective, the transport challenge in Mdantsane is enormous, and is far from being resolved. The official remarked that in many instances, the tough competition between bus and taxi operators, if poorly managed, always degenerated into riots and numerous road accidents that claimed the lives of innocent passengers (BCMM Official Four, 2014). The latter situation is the result of reckless driving, as drivers try to meet their daily quotas. Such problems have also been adequately covered in the media. For example, the Daily Dispatch of 27 February, 2014 carried this story: As the taxi was rolling I thought I was going to die…The taxi came to a standstill and the children were screaming their lungs out in terror… We have recorded a number of deaths of schoolkids on that stretch. We even have a memorial stone there. It is evident that the taxi drivers in Buffalo City Municipality are ignoring our safety message …This is not the first time we [have] heard of the taxi drivers packing our kids like sardines. However, in an interview with one of the

Mdantsane | Page 26 taxi operators, who defended the exorbitant fares, the interviewee placed the blame on the government’s failure to subsidise the taxi industry (Taxi Operator, 2014).
Given the large volume of daily commuters, as reported by an official from the BCMM transport department, the situation requires urgent attention. It was stated that the South African government is planning the implementation of the Integrated Rapid Public Transport Networks (IRPTN), with the BRT as the nucleus of the IRPTN. According to the plan, it is envisaged that there will be a drastic reduction in the number of minibuses (taxis); and the articulated buses will transport passengers into and out of Mdantsane in an integrated manner (BCMM Official Four, 2014). It is also undeniable that the successful and speedy completion of these projects has been hampered by strike action and court cases among bidding companies. A case in point is the Bus Rapid Transport (BRT) project, which is currently under litigation, reportedly because the unsuccessful candidate decided to contest the award. So the money set aside for the project has been returned to the National Treasury (BCMM Official Four, 2014). Notwithstanding the challenges, some developments in the transport sector have been achieved through the upgrading of the previously poor road infrastructure over the past 20 years. Notable interventions also include the construction of speed bumps around schools and other public places, and the upgrading of the taxi rank.
5.6 Electricity Provision
With regard to the provision of electricity, notable progress has been made in the electrification of formal settlements, as well as in street lighting and the installation of metred electricity in houses. Also, some progress has been noted regarding the provision of electricity in informal houses. The residents also reported that these interventions have resulted in a decrease in power cuts, as well as clean and reliable energy provision, and have also contributed towards crime management. For the municipality, the challenge lies in combating theft and vandalism – a costly problem, as there is a need for 24-hour security services (Community Respondents One & Four 2014; BCMM Official Three, 2014). It was also revealed that most residents cannot afford to buy electricity; and the installation of solar geysers was proposed as a possible strategy to address the problem (Community Respondent one, 2014).
5.7 Other Services
Some community projects, such as the market gardening project, are progressing well, albeit on a small scale. It would be beneficial if such projects were to be up-scaled to incorporate the involvement of more people, especially the youth. The potential attendant benefits range from enhanced income generation, urban food security and skills development to the reduction of crime, as most of the youth would be economically engaged in productive work. Mdantsane Sun, a former hotel, has now been converted into a hall for local meetings. This locality was also used for gambling during the apartheid era. Alongside this building is the Mdantsane Hall, which is still used for some sporting activities, such as boxing. Another respondent observed: The municipalities are neglecting the sporting infrastructure and stadiums. The swimming pools, tennis courts, [and] boxing houses are now down and defunct (Community Respondent Two, 2014).
5.8 Synthesis
It is clear from the preceding analysis that housing delivery has made some strides, but there is still a need for improvement, as there are still many people who are leaving the informal settlement. Improving the quality of state-funded houses is another issue that needs to be addressed. The formalisation of informal settlements needs to be continued, and any further growth of informal settlements should be prevented. Service delivery is in a poor state in Mdantsane. Interventions by the BCMM to address the situation have failed to meet the residents’ expectations. Notable problems hampering the success of service delivery include budgetary constraints, administrative tensions and politics, limited stakeholder participation, reluctance to invest on the part of the private sector, land-

Mdantsane | Page 27 tenure issues and the overall policy framework that does not make provision for the unique challenges of displaced settlements in the country. According to van Rensburg et al. (2003), the provision of health services (clinics and hospitals) showed signs of deterioration in Mdantsane, in terms of poor facilities and the unavailability of medication.
6. THE ECONOMY Emerging from the earlier analysis of apartheid policy frameworks is the argument that Mdantsane reflected an apartheid ideology that entailed controlling and accommodating blacks in reservoirs of access to cheap labour. Owing to its nature – referring to the limited commercial activities taking place in it – the area was popularly known as a dormitory town, i.e., a town that merely provided workers with a place to sleep. The workers would daily commute to their respective workplaces. For Mdantsane, the economic heartland was East London, including the Fort Jackson industrial area on the fringes of Mdantsane. The apartheid regime did not have any intention of boosting the area economically. Instead, it wanted black people to come to the white commercial centres to spend their money. This section assesses the present economic situation of Mdantsane, as well as its future prospects as it struggles to recover from the economic neglect that was imposed on it under the apartheid regime.
6.1 Economic Growth
Table 8 indicates the gross domestic product (GDP) in East London and Mdantsane from 1996 to 2013. Clearly, the Mdantsane GDP did not match that of East London. In 1996, the GDP in Mdantsane stood at R1.2 million, whilst East London recorded a figure of R13.8 million. This disparity continued in 2001, 2007, 2011 and 2013. In 2001, a negative growth in GDP was even recorded for Mdantsane. These figures reflect a certain degree of inequality between the two areas. Thus, in view of the information reflected in Table 8, it can safely be assumed that Mdantsane’s economic growth is still lagging behind, compared with that of East London. This implies that the apartheid planning is still entrenched in the area. Table 7: GDP growth in East London & Mdantsane – 1996, 2001, 2011 and 2013
Year East London Mdantsane
GDP (Constant 2005 prices -R 1000)
GDP growth per annum
GDP (Constant 2005 prices -R 1000)
GDP growth per annum
1996 13 807 467 - 1 223 606 -
2001 13 847 455 0.002896 1 161 919 -1.05041
2011 21 362 272 0.542686 1 654 357 0.423814
2013 22 211 091 1 714 066
Source: Global Insight, 2014
6.2 Economic Structure and Change
Instead of looking at the rate at which the economies of Mdantsane and East London have grown over time, the analysis in this section focuses on the sectoral contributions to the economy (see Table 9).

Mdantsane | Page 28 Table 8: GVA per sector in East London and Mdantsane – 1996 and 2013
Economic Sector
East London 1996
Mdantsane 1996
East London 2013 Mdantsane 2013
R’000 % R’000 % R’000 % R’000 % Agriculture 43 066 0.6 344 0.1 120 898 0.37 909 0.0
Mining 5 312 0.1 4 157 0.9 86 569 0.27 23987 0.9
Manufacturing 1 298 675 19.5 49 796 10.2 4, 564381 14.2 157864 6.2
Electricity 155 174 2.3 2 555 0.5 629302 1.93 8312 0.3
Construction 183 020 2.7 6,086 1.3 862 472 2.65 27549 1.1
Trade 1 149 991 17.2 38 757 8.0 6,663172 20.47 214215 8.4
Transport 784 096 11.7 36 386 7.5 3,471804 10.62 166751 6.5
Finance 1 357 747
20.3 119 431
24.5 6,856982
21.07 677892
26.5
Community services 1 696 931
25.4 229 109
47.1 9,294022
28.55 1279498
50.0
Total Industries 6 674 013
100.0 486 621
100.0 32,549602
100.0 2556976
100.0
Source: Global insight, 2014 The Gross Value Added (GVA) statistic is used as an estimation of GDP. This approach is aimed at determining the contribution of each industry or sector to the economy. Table 9 shows that the total contribution to the GVA for all the industrial sectors in East London in 1996 amounted to R6,6 billion. This figure had increased to approximately R32,5 billion by 2013. The greatest contributors to the GVA in East London in both 1996 and 2013 were community services (25.4%) and the finance sector (20.3%), followed by the manufacturing sector (19.5%) and the trade sector (17.2%) respectively. The economic performance in Mdantsane also followed similar trends during the period under review. In 1996, the community services sector in Mdantsane contributed approximately 47% towards the GVA. This was followed by the finance sector (24.5%) and the manufacturing sector (10%). By 2013, a slight growth in community services (50%) was notable. This was followed by the finance sector (26.5%) and the manufacturing sector (6%). An interesting factor in this regard is that the manufacturing sector’s performance in Mdantsane was weaker (6.2%) in 2013 than in 1996.
A more detailed analysis of the Gross Domestic Product per sector was undertaken, while at same time comparing East London with Mdantsane. There is a strong indication that the contributions of retailing, trade, and repairs of goods to the GDP reflect a steady increase in both East London and Mdantsane. Surprisingly, the contribution of real estate activities to the GDP in Mdantsane was high from 1996 to 2013, but a significant drop (16.56%) occurred in 2001, probably due to the global recession. For East London, the contribution of real estate activities to the GDP was significant at 6.85% in 1996 and 5.16% in 2001; but declined in 2007, 2011 and 2013, probably owing to the steep rise of the housing prices in East London, which many people could not afford. Retailing, too, showed positive progress. In both cases, government and semi-government activities made a notable contribution to the GDP, probably owing to government support. In East London, the financial sector is prominent.
6.3 Economic and Industrial Development
This section provides an analysis of investments made in Mdantsane. It also assesses the Mdantsane Urban Renewal Programme (MURP) as an integral component of socio-economic transformation in the area.

Mdantsane | Page 29
6.3.1 Mdantsane’s Development Nodes There are two distinct development nodes in Mdantsane: the NU2 Mdantsane Central Business District (MCBD) and the NU6 Shopping Mall. The MCBD is a notable business area in the Mdantsane Township. Development at the NU2 (Highway) enhanced the business sector by increasing the retail space in Mdantsane over the past twenty years. This development is related to the original under-provision of formal retail space in Mdantsane (Business Officials One & Two, 2014). Formerly, the residents had to travel to East London to carry out their shopping activities on a daily basis. Now the area caters for formal and informal micro-manufacturing. There are also large numbers of unregistered, foreign-owned retail outlets and a few small locally-owned businesses occupying the formal business space in Mdantsane. As was the case during apartheid, informal trading has continued to take place. Attempts have been made by the government to enhance the vendor operations by providing trading stalls. However, as can be seen from Plate 1, such services have failed to accommodate the growing number of vendors at the MCBD.
Plate 1: Inadequate retailing facilities for vending at the Mdantsane Highway (NU2) The NU6 shopping complex is another notable core of business. This project, conceived by a private developer, reflects the role of private investment in the economic development of the area, albeit on a limited scale. This is in line with local economic development (LED), as championed by the government. The Mall was established in 2008 and accommodates 90 stores, comprising national retailers, the major banks, gymnasiums and some independent retailers, as well as government and semi-government offices such as those of SASSA, the South African Post Office and BCM offices (Business Official One, 2014). In an interview with a market employee, it was revealed that the project has created about 1,000 jobs for the Mdantsane residents, allowing business to flourish. An economic argument put forward by the interviewee is that the shopping mall allows Mdantsane residents to spend and retain their money in Mdantsane, preventing it from leaking out of the community, and thereby contributing to the local GDP (Business Official One, 2014). In addition, the improved accessibility of facilities such as banks, as well as government services, means that the locals will no longer need to travel to East London City for such services. In an interview with the BCMM official, it transpired that the mall also contributes over R13 million in utility expenses and R6 million in rates and taxes to the BCCM annually. Another positive comment about the mall was that it generates an annual income of R582 million (BCMM Official Five, 2014). From a contrasting viewpoint, a concern has been raised to the effect that such malls do not provide a platform for the integration of blacks into a formerly white-dominated business monopoly. For example, some local businesses have complained that the establishment of these township malls has handicapped the local businesses, as they have been unable to compete with the chain stores. This

Mdantsane | Page 30 has reportedly led to the closure of local businesses. One of the local business persons said: It is good to have a one-stop business service centre like the mall, but the problem is that local business people are booted out of the business opportunities created. What we have seen now is that the remnants of the small businesses are now [being] taken over by the foreigners like the Somalis, Indians and Pakistanis. The interviewee also indicated that there were plans to extend the mall in the near future, so that it would become a catalyst for other businesses to open in close proximity to the mall. This is envisioned with a view to creating a business precinct that would become the primary business hub in Mdantsane.
6.3.2 The Mdantsane Urban Renewal Programme (MURP) It was anticipated that the MURP strategy would act as a catalyst to fast-track service delivery and improve the quality of life of the people residing in Mdantsane (Peters, 2008). The MURP identified poverty, unemployment, poor infrastructure and the high crime rate as the major impediments to development in the township. Therefore, it is necessary to determine the extent to which the programme has succeeded in meeting its objectives regarding infrastructure provision, housing delivery, education, skills development and job creation, water and sanitation services, the eradication of crime and other services. Poor infrastructure was identified as one of the greatest challenges requiring urgent attention in Mdantsane. The programme responded appropriately by identifying specific areas requiring action, as well as the respective departments responsible for such action, as shown in Table 10. Of late, it has been noted that the physical environment itself imposes a mode of development that is expansive and sub-urban in nature (BCMM, 2013). This means that infrastructure development is always costly in Mdantsane. Table 9: The implementation of MURP
Department/Unit Infrastructure/services
Engineering Roads, water and sanitation, electricity
Human Settlement Housing delivery
Community Services Sports and recreational parks
Development Planning Local spatial development framework
Health and Protection Services Security and crime prevention
Executive Support Services Operational, e.g., youth development projects
Since 2001, the noted developments in infrastructure have included the upgrading or redevelopment of the electricity network, the upgrading of the Primary East-West Distributor, the installation of water-service networks and the upgrading the Qumza Highway (BCMM Official Six, 2014). The major challenge, however, is that the largely low-income and unemployed residents have no capacity to pay for these services, other than through the subsidies and interventions of the government. In an interview with one of the BCMM officials, it was revealed that about 60% of the budget is treasury-bound, while 31% is municipally funded through rates and tariffs (BCMM Official One, 2014). The problem relating to the inability of the largely unemployed population to pay for the services provided was reported as early as the inception of the MURP (Daily Dispatch, 21 May 2002). This problem is likely to be aggravated by poor revenue generation, owing to the large numbers of unemployed inhabitants who do not have the financial capacity to pay the rates. In another interview with one of the BCMM officials, it was disclosed that the 2009 MURP mid-term evaluation had unearthed some irregularities and accountability issues. This prompted the funders to set new conditions for further financial support, which included independence and accountability, on the basis of the Auditor’s Report. The major concern was: If municipalities were unable to manage their own finances, how could they be expected to have the capacity to manage the European Union grant? (BCMM Official Six, 2014). The recently reported financial mismanagement issues are a clear indication of the endemic problems relating to poor accountability. The impact of these problems probably also played a role in the limited progress made with the projects aimed at Mdantsane.

Mdantsane | Page 31 With reference to stakeholder engagement, it can be argued that there are several stakeholders – some with competing interests – in the development of infrastructure and service provision. For example, the success of the municipality’s plans to develop houses or enhance public safety on the roads is subject to the availability of land and the participation of SANRA in the intended off-ramp development on some sections of the roads, respectively. Another issue is related to sectoral interests in some projects. For example, the BCMM has identified the need to upgrade the railway stations in Mdantsane, which comprise assets that fall under the Passenger Rail Agency of South Africa (PRASA). Thus, the public safety issues associated with the dilapidated railway infrastructure may not be quickly addressed unless the approval and cooperation of the PRASA can be secured. In 2009, a stakeholder mobilisation initiative was launched with the aim of drawing various stakeholders into the implementation of the MURP. However, some officials still cite the flaws in this mobilisation drive as one of the main factors that hampered the smooth implementation of the project (BCMM Official Six, 2014). In view of the slow progress associated with MURP, a strategic planning session was held in November 2013 to reconsider the question of whether the programme was addressing people’s needs. One of the outcomes of the meeting was the subsequent holding of a benchmarking session, which entailed the exchange of knowledge during in-depth discussions with two of the municipalities that had conducted a similar programme successfully, namely, the City of Johannesburg (Alexandra and Soweto) and Cape Town. Among the lessons drawn from Alexandra was the fact that the Provincial Government was involved in the management and operation of the Urban Renewal Programme (URP) under the MEC, and the programme was adequately funded. The municipality was merely a ‘junior player’ involved mainly in the programme’s implementation. In contrast to the over-ambitious focus of the MURP, which had targeted numerous projects at a time, the Alexandra programme had identified one priority area, namely housing delivery to its citizens. Furthermore, the Johannesburg Development Agency (JDA) was the main technical partner involved; and the programme is currently being up-scaled to include Soweto as one of the nodes. Of late, other projects have also been initiated, namely land-use zoning and planning, parks, roads and shopping malls. The BCMM is aware that, in order to ensure that the MURP will be successful, it must be driven by the proposed Buffalo City Development Agency (BCDA). Apparently, the BCDA is still a dream awaiting fulfilment; and the reasons for the delays in its establishment are related to the politicking in municipality affairs (BCMM Official Six, 2014). Five years after its implementation, the impact of the MURP was assessed by Peter (2008), the former Mayor of Buffalo City Municipality, who suggested that the positive impact that had been achieved for the Mdantsane community was limited in extent. Mhlekude (2014) also conducted an intensive investigation on the impact of the development projects of the MURP. Her observations and conclusions in this regard did not differ very much from Peter’s (2008) earlier observations. She concurred that the MURP had only rendered limited positive socio-economic outcomes to the community of Mdantsane.
6.4 Informal Sector Trading Activities
As reported earlier, formal employment opportunities are very limited in Mdantsane. Thus, in order to make a living, many people resort to informal-sector activities, which are concentrated in the NU2 (Highway Rank) area. One of the vendors who was interviewed revealed that she and a group of ten other women had been selling goods at the Highway for more than thirty years and that informal trading has been a source of income for their families (Vendor, 2014). The increasing informal vending activities at public places such as the taxi rank are indicative of the scarcity of formal employment opportunities. The major challenge, however, is the associated hazard to public health. This is because the vending stalls and other infrastructure provided by the planning authorities are inadequate to meet the increased demand.

Mdantsane | Page 32 Clearly, there is no enabling environment supporting the sustainability of local small businesses. Unless the government creates a clear policy framework to support the small and medium enterprises, this problem relating to the unsustainability of the operation of local businesses is likely to exacerbate the unemployment situation in the area. One of the respondents even suggested that the government should establish a development bank providing loans for the purpose of establishing small-scale businesses (Former Councillor, 2014). Another concern is that, as long the inhabitants have meagre or no disposable incomes, the decay of large investments by the private sector cannot be ruled out. This problem is also cited in the BCMM’s (2013) report as contributing to the high business failure rate.
6.5 Synthesis
It is clear from the preceding discussion that the Urban Renewal Programme in Mdantsane faces implementation and management challenges. From the perspective of economic development, it is likely that the MURP’s cardinal role in facilitating such development will remain a smokescreen. The major challenges associated with the implementation of the MURP can be summarised as follows: improper planning, which has sidelined relevant stakeholders; lack of transparency and poor communication; ownership issues that have stifled the development of housing projects; conflicts between the municipality and the residents regarding the prioritisation of the projects; and challenges relating to the alignment of the IDP with the budget. The infighting within the BCMM has also contributed to the lack of success that has attended these projects. Indeed, it can be argued that the apartheid government had no intention of making Mdantsane economically viable. Surprisingly, the post-apartheid government has not done much to address this problem.
7. CONCLUSION: CHANGING FUNCTIONAL ROLES? Although it has been pointed out in this report that the functional role of Mdantsane has changed considerably over the past twenty-one years, its original central function as a dormitory town to which black urbanisation movements could be diverted and re-routed, is still evident. This means that Mdantsane has not lost its dominant apartheid structure. The following points are worth noting:
Statistical evidence has indicated that employment opportunities in Mdantsane are diminishing. In addition, declining occupancy levels in respect of industrial stands are evident. This loss of economic opportunities is probably the main reason behind the observed population decline in the area.
Statistical evidence indicates the occurrence of emigration. Other reasons for the exodus of inhabitants are largely related to poor education services, as well as the high crime rate associated with the loss of skills-development opportunities for the youth.
There is evidence of increasingly high levels of dependency on government grants amongst the Mdantsane population.
The perception that education and other services have deteriorated is widespread among the locals in Mdantsane. This is evidenced by a trend towards the closure of schools and facilities, coupled with a decline in student and teacher numbers in many learning institutions. The parents are responding by sending their children to former white model C schools, mainly in East London, where they perceive the quality of education to be better.
There are also indications that Mdantsane has acquired other functional roles during the post-apartheid era, since many Mdantsane residents regard the area as a home for their families.
Relevant policies, which have been facilitated by a variety of pieces of legislation and government programmes, have also come into play. Notable amongst these are: the Reconstruction and Development Programme of 1994; the Urban Renewal Programme of 2001; the Development Facilitation Act (Act 67 of 1995); the Urban Development Framework (1997); the National Development Plan (2012); the Spatial Planning and Land Use Management Act (Act 16 of 2013), and the Draft Integrated Urban Development Framework (2013). The impact of these measures can be summarised as follows:

Mdantsane | Page 33
The impact of the Reconstruction and Development Programme of 1994 on the spatial planning of Mdantsane is reflected by the increase in the number of RDP houses in the township. However, there are still backlogs.
The URP served as a stimulus to improve development in Mdantsane, as reflected in the infrastructure development. However, to date, the success of this programme largely falls short of the projected benefits.
There is evidence suggesting that some strides have been made with regard to investment in infrastructural development projects, as demonstrated by the Mdantsane Central Business District in NU2 and the NU6 shopping mall, as well as some on-going road construction and rehabilitation projects.
Contrary to expectations, the spatial integration of Mdantsane with Buffalo City did not materialise – instead, there has been a trend in the opposite direction, since Mdantsane has seemingly expanded northwards in the direction of King William’s Town. Problems relating to the topography of the area have probably made developments difficult.
It can be concluded that Mdantsane’s merger with East London has had an impact in terms of political, social and financial issues; but the positive spin-offs are marginal. Furthermore, although strides have been made in respect of transformation, the development of Mdantsane is still lagging behind in comparison with that of Buffalo City. The implication is that it is not easy to remove the scars of apartheid. Thus, there is a strong feeling among many residents that they are still trapped in the apartheid paradise. The key developmental issues of the apartheid and post-apartheid eras are summarised in Table 11. These trends are also illustrated in Figure 8 and Figure 9. Table 10: A comparison of apartheid and post-apartheid trends in respect of Mdantsane
Key issues Apartheid planning / trends Post-apartheid planning/trends
Significant policies Influx control
Forced removal
Border industries
Industrial decentralisation
Establishment of R293 towns
Bantustan policy
A range of policies with an emphasis on spatial integration – yet the implications for Mdantsane of being about 25 km away from the economic core still pose a problem
Mdantsane was declared an urban development node as early as 2001, when it was made one of the national urban renewal nodes
Limited integration between different spheres of government
Population characteristics and movement
Away from East London (Duncan Village and Ciskei and Transkei Bantustans to East London)
High population growth in Mdantsane
Increasing evidence of population decline in Mdantsane as many people have moved to settle in East London and Bisho - King William’s Town
Signs of rural-urban migration and high dependence on social grants
Commuting patterns High levels of daily commuting Lower levels of daily commuting

Mdantsane | Page 34
Higher levels of commuting on Mondays and Fridays
Increased settlement of Mdantsane residents in East London and King William’s Town
Settlement expansion for black households
Very limited expansion of public housing in East London and more particularly in Duncan Village
Large-scale development of low-density public housing in Mdantsane, resulting in horizontal urban sprawl
Investment in private housing in the mid-1980s
Growth of large-scale informal settlements in Mdantsane scattered through the township; but intensive strategies to eradicate them
Large scale development of low-density RDP housing in Mdantsane, causing further horizontal urban sprawl
Industrial development Significant scale, but labour- intensive
Limited scale
Infrastructure development
Insignificant development
Significant. as revealed by development of roads, malls, electrification, sewage pipes

Mdantsane | Page 35 Figure 8: Apartheid planning and Mdantsane
8.
9.
Influx of people from
surrounding rural areas
Duncan Village
BUFFALO CITY (East London)
Mdantsane (First residents in
1961)
- No investment in respect of Black households in Duncan Village.
- Influx control. - Forced removals. - Limited Black population growth.
- Black city with large-scale investment, but low infrastructure levels households.
- High population growth
Forced removals (1950s)
Re-direction of Black urbanisation (1982-1990)
Daily commuting to East London for services
Border industries
(Wilsonia) Ind. Development
point (Fort Jackson)
Influx of people from Western Cape

Mdantsane | Page 36 Figure 9: Post-apartheid trends in Mdantsane
10. (Source: GIS LAB. NMMU February, 2015)
- Increasing movement to East London to low/medium class suburbs.
- High occupancy of Blacks in the inner city.
- Large-scale population growth. - Steady daily flow of inner city for
high order services.
- Substantial improvement in infrastructure.
- Low population growth. - Rise of retailing. - MUR not matching expectations.
- Services not up to standard.
Daily commuting to East London slow down Mdantsane
Increase in migration to East London since 1994
BUFFALO CITY (East London)
Decline of border industries (Wilsonia)
Decline of occupancy in Ind.
Development point

Mdantsane | Page 37
References BCMM (2013). Mdantsane Local Spatial Development Framework. Report by the Directorate of
Economic Development and Planning, Buffalo City Metropolitan Municipality (BCMM), East London.
Bernstein, A., 1991. Challenge of the cities. In: M. Swilling, R. Humphries & K. Shubane, eds. Apartheid city in transition. Cape Town: Oxford University Press, p. 322−333.
Christopher, A.J., 1994. The atlas of Apartheid. London: Routlege. Christopher, A.J., 1995. Regionalisation and ethnicity of South Africa, Area, 1(27), 1-11. Davies, R., 1981. The spatial formation of the South African City, GeoJournal, 2 (59-72). Mhlekude, Z (2013). Assessment of the Impact of the Mdantsane Urban Renewal Programme on the
Lives and Livelihoods of Beneficiaries (2001-2011): The Case of the Eastern Cape Buffalo City Metropolitan Municipality. Unpublished Master’s Dissertation. University of Fort Hare, Alice.
StatsSA (2014) Poverty Trends in South Africa: An examination of absolute poverty between 2006 and 2011. Statistics South Africa (StatsSA), Pretoria.
World Bank (2014). Gini Index. World Bank, Development Research Group. Available at: http://data.worldbank.org/indicator/SI.POV.GINI (accessed 24/10/2014).
van Rensburg-Bonthuyzen, EJ; Heunis, C; Engelbrecht, M; Meyer K & Summerton, J (2003). PHC delivery in the Mdantsane Urban Renewal Site, Eastern Cape: Mapping gaps in the maternal health, IMCI, TB, STIs, HIV/AIDS and EDL programmes. Centre for Health Systems Research & Development, University of the Free State, Bloemfontein.
Buffalo City Municipality, 2006: Buffalo City Municipality Mdantsane Urban Renewal Programme: Public Transport Framework Plan, Buffalo City Municipality, East London.
Daily Dispatch , 27th February, 2014 Taxi loaded with pupils rolling in N2
Daily Dispatch of 8th November, 2014
Dauda, C., 1996. Background on Mdantsane, East London: East London: East London, Local Government Project and the University of Toronto Urban International.
Gordon, T. J., 1978. Mdantsane, City, Satellite or Suburb? Unpublished Masters Thesis, Grahamstown, Rhodes University.
Global Insight, 2014 Nel, E.L., 1990. Mdantsane, East London’s Homeland Township: Municipal Neglect and Apartheid
planning 1949-1988, GeoJournal, 22.3, 305-313. Pokwana, V., 2013.Mdantsane, Jubilee, Jazz and all that Jazz. Rauch, J. 2002.Thinking Big: The National Urban Renewal Programme and Crime Prevention in
South African’s Metropolitan Cities, Research Report written for the Centre for the Study of Violence and Reconciliation (CSVR), Cape Town.
Robins, 2002: At the limits of spatial governmentality: A message from the tip of Africa. Third World Quarterly, 23 (4), p. 665-689.
Siyongwana, PQ and Sihele, V., 2013. Housing Transformation in Port St Johns, South Africa since 1994, Journal Human Ecology, 44(1) 75-84.
Tonjeni, L., Informal Trading and Post-Apartheid Transformation in Njoli Market Square, Port Elizabeth, Unpublished Master’s Thesis, University of Port Elizabeth, Port Elizabeth.
Republic of South Africa, 1994: The Reconstruction and Development Programme (RDP) document, Government Printer, Pretoria.
Republic of South Africa, 1996: The Constitution of South Africa 1996 ( Act 108 of 1996), Government Printer, Pretoria.
Republic of South Africa, 1995. Urban development strategy, Pretoria: Government Printer. Republic of South Africa, 1996. The Constitution of South Africa (Act 108 of 1996), Pretoria:
Government Printer. Republic of South Africa, 1997. Housing Act, No.107 of 1997, Pretoria: Department of Housing. Republic of South Africa, 1996. South Africa Central Statistics, Pretoria: Government Printer. Republic of South Africa, 2001. South Africa Central Statistics, Pretoria: Government Printer. Community Respondent One, 2014. Community Interview, s.l.: s.n

Mdantsane | Page 38 Community Respondent Two, 2014. Community Interview, s.l.: s.n Community Respondent Three, 2014. Community Interview, s.l.: s.n Community Respondent Four, 2014. Community Interview, s.l.: s.n Community Respondent Five, 2014. Community Interview, s.l.: s.n Community Respondent Six, 2014. Community Interview, s.l.: s.n Teacher One, 2014. In-depthinterview with representative from the South African Democratic
Teachers Union, s.l.: s.n. Teacher Two, 2014. In-depthinterview with representative from the NAPTOSA, s.l.: s.n. Principal One, 2014. In-depthinterview with a principal of one of the local schools in Duncan Village,
s.l.: s.n. Former Principal, 2014. In-depthinterview with a former principal in Mdantsane local schools, s.l.: s.n. Former Councillor, 2014. In-depthinterview with a former Councillor of in Mdantsane, s.l.: s.n. Councillor, 2014.-depthinterview with a former Councillor of in Mdantsane, s.l.: s.n. BCMM Official One, 2014. In-depth interview with an official from BCMM Housing Department, s.l.:
s.n. BCMM Official Two, 2014. In-depth interview with an official from BCMM Central Planning
Department, s.l.: s.n. BCMM Official Three, 2014. In-depth interview with an official from BCMM Central Planning
Department, s.l.: s.n. BCMM Official Four, 2014. In-depth interview with an official from BCMM Transport Planning
Department, s.l.: s.n. BCMM Official Five, 2014. In-depth interview with an official from BCMM Treasury Department, s.l.:
s.n. BCMM Official Six, 2014. In-depth interview with an official from BCMM MURP, s.l.: s.n. Business Official One, 2014. In-depth interview with a business official working at NU6 Shopping Mall
office, s.l.: s.n. Business Official Two, 2014. In-depthinterview with a local business person, s.l.: s.n. Learner One, 2014. Interview with a learner, s.l.: s.n Vendor One, 2014. Interview with a vendor at Mdantsane CBD, s.l.s.n.