Post-Acute Care Collaborative - Home — Hancock...
28
Post-Acute Care Collaborative Building Strong Post-Acute Partnerships to Enhance Patient Management Jared Landis Practice Manager Post-Acute Care Collaborative 202-266-6925 [email protected] In Collaboration with Hancock, Daniel, Johnson & Nagle ©2014 The Advisory Board Company • advisory.com 2 Source: Rau J, “Medicare Fines 2,610 Hospitals in Third Round of Readmission Penalties,” October 2, 2014, Kaiser Health News, kaiserhealthnews.org; Post-Acute Care Collaborative interviews and analysis. 1) Value-Based Purchasing. 2) Bundled Payments for Care Improvement. 3) Accountable Care Organizations. PAC Partnerships Supports Major Hospital Goals Greater Patient Satisfaction Maximized Reimbursement Improved Clinical Quality High-quality PAC optimizes downstream outcomes, minimizes readmission risk Positive PAC experience raises patient satisfaction scores for the entire care episode Strong PAC outcomes, low costs improve hospital revenue under new payment programs 2M Medicare beneficiary 30-day all-cause readmissions, 2013 $26B Medicare costs resulting from readmissions, 2013 18% 30-day all-cause readmission rate for Medicare patients, 2013 Acute/post-acute collaboration creates a smoother care transition for patients Superior PAC treatment allows patients to return home more quickly Reduced readmissions help avoid hospital financial penalties under CMS readmissions penalties Reduced downstream costs help avoid hospital financial penalties under VBP 1 efficiency domain PAC performance impacts shared savings opportunity under BPCI 2 and in ACOs 3 Quality PAC providers offer a better in-setting patient experience
Transcript of Post-Acute Care Collaborative - Home — Hancock...

Post-Acute Care Collaborative
Building Strong Post-Acute Partnerships to
Enhance Patient Management
Jared Landis
Practice Manager
Post-Acute Care Collaborative
202-266-6925
In Collaboration with Hancock, Daniel,
Johnson & Nagle
©2014 The Advisory Board Company • advisory.com
2
Source: Rau J, “Medicare Fines 2,610 Hospitals in Third Round of Readmission Penalties,” October 2,
2014, Kaiser Health News, kaiserhealthnews.org; Post-Acute Care Collaborative interviews and analysis.
1) Value-Based Purchasing.
2) Bundled Payments for Care Improvement.
3) Accountable Care Organizations.
PAC Partnerships Supports Major Hospital Goals
Greater Patient Satisfaction Maximized Reimbursement Improved Clinical Quality
High-quality PAC optimizes
downstream outcomes,
minimizes readmission risk
Positive PAC experience raises
patient satisfaction scores for
the entire care episode
Strong PAC outcomes, low
costs improve hospital revenue
under new payment programs
2M Medicare beneficiary
30-day all-cause
readmissions, 2013
$26B Medicare costs
resulting from
readmissions, 2013
18% 30-day all-cause
readmission rate for
Medicare patients, 2013
Acute/post-acute
collaboration creates
a smoother care
transition for patients
Superior PAC treatment
allows patients to return
home more quickly
Reduced readmissions help
avoid hospital financial
penalties under CMS
readmissions penalties
Reduced downstream costs
help avoid hospital financial
penalties under VBP1
efficiency domain
PAC performance impacts
shared savings opportunity
under BPCI2 and in ACOs3
Quality PAC providers
offer a better in-setting
patient experience

©2014 The Advisory Board Company • advisory.com
3
Difficult to Maximize a Diverse Range of Services
Growing Competition Blurring Traditional Service Lines
Source: Redfoot, D. “Assisted Living: The Next Generation”, July 2006, AARP; Post-Acute Care Collaborative interviews and analysis.
“Distinctions such as “medical model” versus “social model” or “residential” versus “institutional”
no longer describe the emerging reality of a greater array of housing and service options to
meet the wide array of consumer needs and preferences.”
Donald Redfoot, Senior Policy Advisor, AARP
Public Policy Institute
”
An Intertwined Post-Acute Care Spectrum
Senior Living Community Services Skilled Nursing Hospitalization
Wellness
Programs
Geriatric
Assessment Case/Disease
Management
Independent
Living
Assisted
Living
Home Health
Care
Palliative
Care
Hospice
Inpatient
Rehab
Home Care
Subacute
Rehab
Outpatient
Therapies
Long-Term
Acute Care
Personal
Care
Adult Day
Care
©2014 The Advisory Board Company • advisory.com
4
Post-Acute Costs Attracting Significant Attention
Source: Newhouse, J. & Garber, A. “Geographic Variation in Medicare Services”, New England Journal of Medicine, available at www.nejm.org/doi/pdf/10.1056/NEJMp1302981;
Chandra, A., Dalton, M., Holmes, J., “Large Increases in Spending on Postacute Care In Medicare Point to the Potential for Cost Savings in these Settings”, Health Affairs, August
2013, available at: http://content.healthaffairs.org/content/32/5/864.full.pdf+html; “Geographic Variation in Spending, Utilization and Quality: Medicare and Medicaid Beneficiaries”,
Acumen LLC, May 2013, available at: www.iom.edu; “Chairman Brady Announces Hearing on the President’s and Other Bipartisan Proposals to Reform Medicare Post-Acute Care
Payments”, available at http://waysandmeans.house.gov; Post-Acute Care Collaborative interviews and analysis.
Comparative Growth in 365-Day Episode Spending
13.3% 21.9% 12.6%
250.4%
164.2%
99.9% 85.3%
43.3% 21.3% 16.0%
31.4% 18.1%
Heart Attack CHF Hip Fracture
Acute Post-Acute Outpatient Physician
Inflation Adjusted,1994 to 2009
MedPac, IOM Reports
Pinpoints post-acute as greatest
contributor to variability in
health care spending
House Ways and Means,
Senate Finance Committees
IMPACT Act of 2014 signed into law;
precursor to post-acute payment
reform

©2014 The Advisory Board Company • advisory.com
5
Efficient Placement a Persistent Challenge
Opportunity Exists to Re-Evaluate Discharge Destination Decisions
5% 3%
15%
9%
18%
31%
11%
HHA SNF IRF LTACH
Proportion of Medicare Patients
Placed in an Avoidably High-Cost Setting
Study Findings By Post-Acute Setting
OP Therapy HHA SNF IRF
42%
30%
20%
14%
Appropriate
Setting
Clinical Appropriateness
For each disease state,
determine with evidence-based
analysis the most appropriate
care setting for patient conditions
Care Setting Cost
For each disease state,
measure cost of caring for the
patient in each setting, incorporate
ALOS to understand total cost
Source: Dobson, DaVanzo and Associates, “Clinically Appropriate and Cost Effective Placement,” available at
www.healthreformgps.org/wp-content/uploads/cacep-report.pdf; Post-Acute Care Collaborative interviews and analysis.
©2014 The Advisory Board Company • advisory.com
6 Pay-for-Performance
Source: The Wall Street Journal, “Keeping Patients from Landing Back in the Hospital,” http://www.wsj.com/articles/SB119741713239122065;
CNN Money, “US to Hospitals: Clean Up Your Act,” http://money.cnn.com/2010/04/29/news/economy/healthreform_hospital_fines/; The
Washington Post, “Medicare rule would decrease payments to hospitals with high re-admission rates,” https://www.washingtonpost.com/
national/health-science/medicare-rule-would-decrease-payments-to-hospitals-with-high-re-admission-rates/2011/07/28/gIQAYwDpjI_story.html;
MedPage Today, “Hospitals Still Don’t Feel Readmission-Driven Pay Cuts,” http://www.medpagetoday.com/PublicHealthPolicy/Medicare/36659;
Reuters, “Q-Centrix Survey Reveals that Hospitals Underestimate Likelihood of Readmission Penalties,” www.reuters.com/article/2015/
06/29/idUSnMKWl3 4fPa+1c2+MKW20150629; Kaiser Family Foundation, “Aiming for Fewer Hospital U-Turns,” http://kff.org/medicare/issue-
brief/aiming-for-fewer-hospital-u-turns-the-medicare-hospital-readmission-reduction-program/; Post-Acute Care Collaborative interviews and analysis.
1) As an adjusted percentage of a hospital’s IPPS payment.
The Hospital Readmission Reduction Program
December 2007
“Keeping Patients from
Landing Back in the Hospital,”
The Wall Street Journal
July 2011
“Medicare Rule Would Decrease
Payments to Hospitals with High
Readmission Rates,” The
Washington Post
December 2012
“Hospitals Still Don’t Feel
Readmission-Driven Pay
Cuts,” MedPage Today
June 2015
“Q-Centrix Survey Reveals
that Hospitals Underestimate
Likelihood of Readmissions
Penalties,” Reuters
April 2010
“US to Hospitals: Clean Up
Your Act,” CNN Money
October 2012
CMS Readmission
Penalty Program begins
The Cost of Waiting to Act
CMS estimate of total
readmission
penalties, FY2015
$428M Average penalty for
readmissions among
hospitals penalized in FY20151
-0.63% Percent of hospitals
penalized during FY2015
for readmissions
78%
Select Hospital Readmissions Program Headlines
©2014 The Advisory Board Company • advisory.com
7
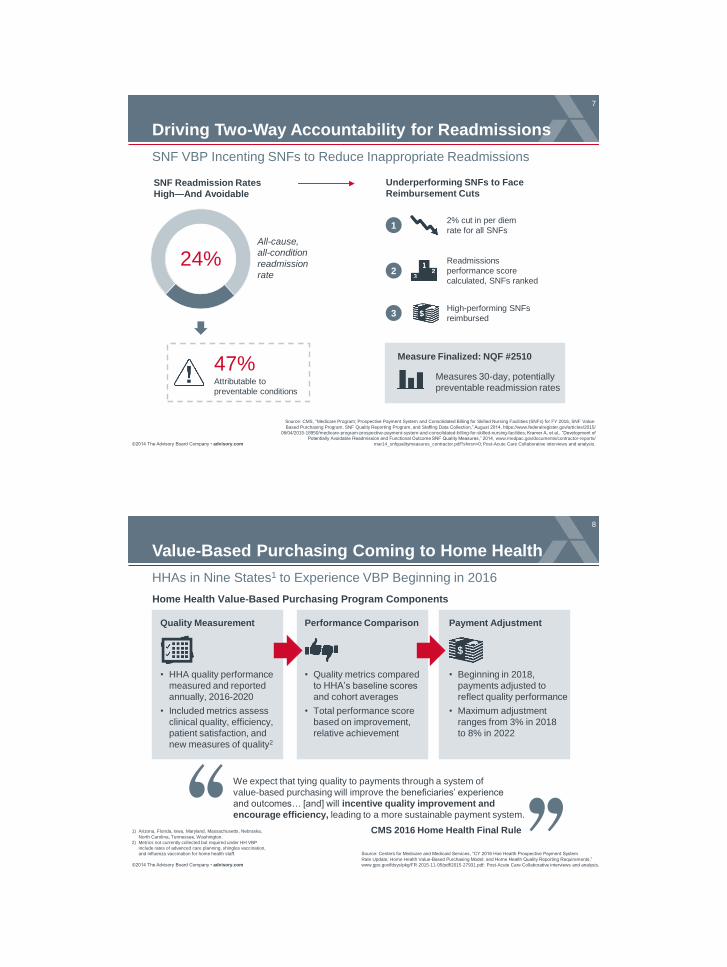
SNF VBP Incenting SNFs to Reduce Inappropriate Readmissions
Source: CMS, “Medicare Program; Prospective Payment System and Consolidated Billing for Skilled Nursing Facilities (SNFs) for FY 2016, SNF Value-
Based Purchasing Program, SNF Quality Reporting Program, and Staffing Data Collection,” August 2014, https://www.federalregister.gov/articles/2015/
08/04/2015-18950/medicare-program-prospective-payment-system-and-consolidated-billing-for-skilled-nursing-facilities; Kramer A, et al., “Development of
Potentially Avoidable Readmission and Functional Outcome SNF Quality Measures,” 2014, www.medpac.gov/documents/contractor-reports/
mar14_snfqualitymeasures_contractor.pdf?sfvrsn=0; Post-Acute Care Collaborative interviews and analysis.
Driving Two-Way Accountability for Readmissions
1
2
3
2% cut in per diem
rate for all SNFs
Readmissions
performance score
calculated, SNFs ranked
High-performing SNFs
reimbursed
Attributable to
preventable conditions
24%
SNF Readmission Rates
High—And Avoidable
Underperforming SNFs to Face
Reimbursement Cuts
47%
All-cause,
all-condition
readmission
rate
Measures 30-day, potentially
preventable readmission rates
Measure Finalized: NQF #2510
©2014 The Advisory Board Company • advisory.com
8
HHAs in Nine States1 to Experience VBP Beginning in 2016
Source: Centers for Medicare and Medicaid Services, “CY 2016 Hoe Health Prospective Payment System
Rate Update; Home Health Value-Based Purchasing Model; and Home Health Quality Reporting Requirements,”
www.gpo.gov/fdsys/pkg/FR-2015-11-05/pdf/2015-27931.pdf; Post-Acute Care Collaborative interviews and analysis.
1) Arizona, Florida, Iowa, Maryland, Massachusetts, Nebraska,
North Carolina, Tennessee, Washington.
2) Metrics not currently collected but required under HH VBP
include rates of advanced care planning, shingles vaccination,
and influenza vaccination for home health staff.
Value-Based Purchasing Coming to Home Health
Quality Measurement
• HHA quality performance
measured and reported
annually, 2016-2020
• Included metrics assess
clinical quality, efficiency,
patient satisfaction, and
new measures of quality2
Performance Comparison Payment Adjustment
• Quality metrics compared
to HHA’s baseline scores
and cohort averages
• Total performance score
based on improvement,
relative achievement
• Beginning in 2018,
payments adjusted to
reflect quality performance
• Maximum adjustment
ranges from 3% in 2018
to 8% in 2022
Home Health Value-Based Purchasing Program Components
We expect that tying quality to payments through a system of
value-based purchasing will improve the beneficiaries’ experience
and outcomes… [and] will incentive quality improvement and
encourage efficiency, leading to a more sustainable payment system.
CMS 2016 Home Health Final Rule

©2014 The Advisory Board Company • advisory.com
9
Introducing CMS’s First Mandatory Bundle
Episodic Payments
Source: “Medicare Program; Comprehensive Care for Joint Replacement Payment Model for Acute Care Hospitals
Furnishing Lower Extremity Joint Replacement Services,” Centers for Medicare and Medicaid Services,
s3.amazonaws.com/public-inspection.federalregister.gov/2015-29438.pdf; Post-Acute Care Collaborative analysis.
1) Not already counted in a BPCI model 1, 2, or 4.
The Future of Bundled Payments?
Comprehensive Care for Joint Replacement (CJR) Model in Brief
All traditional Medicare,
lower extremity joint
replacement patients1
in 67 selected markets
are included in the
bundle
Acute care hospitals will
bear financial risk;
hospitals participating in
BPCI Models 1, 2, or 4
are excluded
Providers’ episodic costs
will be compared to a
target price; providers
would gain added
reimbursement or owe
CMS based on cost,
quality performance
The CJR Model in Numbers
MS-DRGs subject to bundled
payment: 469 and 470 (lower
extremity joint replacement)
2 Number of markets in which
CMS plans to implement
mandatory bundling
67 Net savings expected by
CMS from the program
between 2016 and 2020
$343M
Program includes
provisions for
gainsharing with PAC
partners, waivers for
3-day stay rule, home
visit and telehealth
reimbursement
Eligibility Accountability Financial Risk Waivers
©2014 The Advisory Board Company • advisory.com
10 Accountable Care Organizations
ACO Model Proliferating Across Markets

©2014 The Advisory Board Company • advisory.com
11
2
3
4
1
Road Map
Aligning Post-Discharge Care Management Roles
Forging Productive Clinical Partnerships
Seeking a Post-Acute Strategy
Towards Holistic Infrastructure
©2014 The Advisory Board Company • advisory.com
12
Health System Post-Acute Strategy Still in Nascent Stages
Source: Post-Acute Care Collaborative interviews and analysis.
1) Value-Based Purchasing.
Shifting from Recognition to Execution
“Who should own PAC strategy
at our hospital?”
“What are best practices for
partnering with PAC providers?”
“How do we select the
best post-acute partners?”
Representative PAC Questions from
Advisory Board Hospital Members Paying Attention to
Post-Acute Care No
Longer Optional
Comprehensive Care
for Joint Replacement
(CCJR) Model
Medicare Spending Per
Beneficiary Penalties
2016: Mandatory bundles
create downstream
financial risk
2015: VBP1 Program
expands to include
episodic efficiency

©2014 The Advisory Board Company • advisory.com
13
Major Drivers of Post-Acute Cost Variability Understood
Source: Post-Acute Care Collaborative interviews and analysis.
Attempting to Inflect Post-Acute Cost
In-Setting Utilization
PAC provider delivers more or
higher-cost services than
clinically necessary
Readmissions
Patient accrues avoidable
costs associated with
additional hospitalization
Primary Opportunities to Influence Post-Acute Spending
Hospital Post-Acute Home End-of-Life
Patient Placement
Patient placed into higher-
acuity, higher-cost setting
than clinically necessary
End-of-Life Care
Patient does not
access cost-saving
hospice benefits
©2014 The Advisory Board Company • advisory.com
14
SNF, Hospitalizations Cloud Other Spend Categories
Source: Milliman; Post-Acute Care Collaborative interviews and analysis.
1) Well-managed benchmarks represent cost and utilization targets derived from claims data in a highly
effective managed care environment (e.g., staff model HMO or globally capitated provider group; targets
are developed from over two billion claims from Milliman clients, published HMO data, clinical chart
reviews, and actuarial judgment). Loosely managed benchmarks are derived from providers that have
some utilization review, pre-authorization, and case management but are generally not tightly managed.
Payer Benchmarks Show Clear Target Areas
Opportunity
Rank Spend Type
PMPM Savings
Opportunity
1 P81 - OTH Prescription Drugs $72.90
2 I11a - HIP Medical - General $63.30
3 I12 - HIP Surgical $59.66
4 I31 -HIP SNF $39.84
5 O12a-HOP Surgery - Hospital
Outpatient $22.52
Milliman Benchmarks of “Well-Managed”1 Settings

©2014 The Advisory Board Company • advisory.com
15
• Each team includes
one SNFist physician
and three APs1
• Teams serve at SNFs
with high volumes of
Advocate referrals
with aim of reducing
costs and controlling
quality
Tight Length of Stay Management Creates Downstream Readmissions
Source: Advocate Health System; Post-Acute Care Collaborative interviews and analysis.
1) Advanced practitioners.
2) Length of stay.
Be Careful What You Wish For
SN
F A
ve
rage L
en
gth
of S
tay
Today
Began effort to reduce SNF
LOS2 via SNFist program
Found that
reducing LOS too
far caused spike in
readmissions
Arrived at “sweet spot”
LOS by balancing LOS
reduction with quality
control requirements
Advocate SNFist
Program
Advocate’s Refocuses on Quality, Not LOS Cuts
©2014 The Advisory Board Company • advisory.com
16
Source: Kaiser Family Foundation, “Aiming for Fewer Hospital U-Turns,” 2015, www.kff.org/medicare/issue-brief/aiming-for-
fewer-hospital-u-turns-the-medicare-hospital-readmission-reduction-program/; Kramer A, et al., “Development of Potentially
Avoidable Readmission and Functional Outcome SNF Quality Measures,” 2014, www.medpac.gov/documents/contractor-
reports/mar14_snfqualitymeasures_contractor.pdf?sfvrsn=0; Post-Acute Care Collaborative interviews and analysis.
High-Cost Conditions and Diseases Clearly Visible
Prevalent Conditions Associated with
Potentially Avoidable Readmissions for
Medicare SNF Population, 2012
Current Medicare Incentives Aligned
with Diagnosis-Specific Approach
“Usual Suspects” Commonly
Associated with Hospitalizations
24.7
23
22.7
19.7
18.3 17.8
18.5
17.6 17.3
15
17
19
21
23
25
27
Medicare Readmission Rates, 2008-2013
July 2008-
June 2011
July 2009-
June 2012
July 2010-
June 2013
Heart Failure Heart Attack Pneumonia
31.3%
30%
23.9%
14.7%
All Other
CHF
Respiratory
Illnesses
Sepsis

©2014 The Advisory Board Company • advisory.com
17
Social barriers,
e.g. lack of transportation
to PCP appointment
Source: Mercy Medical Center; Post-Acute Care Collaborative interviews and analysis.
Separate Condition-Specific Programs Duplicative
Overlapping Interventions Needed
Across Conditions
Interventions Needed for
Successful Management
Individual Goal-Setting
Treatment Plan Adherence
Preventive Care Utilization
It didn’t make sense for us to have three separate
programs. Chronic disease is chronic disease.
Chief Accountable Care Officer,
Mercy Medical Center
CHF COPD Diabetes
Meet Your Typical CHF Patient
Polypharmacy
risking non-adherence,
adverse interactions
Multiple chronic
conditions in
addition to CHF
©2014 The Advisory Board Company • advisory.com
18
Source: Post-Acute Care Collaborative interviews and analysis.
Road Map for Flexible Acute/PAC Partnerships
Three Imperatives for Success
Mechanisms for
Cost-Effective Care
Tracking performance;
designing, deploying
high-yield incentives
Network Curation and
Management
Identifying the right
partners and creating
platforms for collaboration
Information
Exchange
Sharing patient information
and building care
coordination infrastructure

©2014 The Advisory Board Company • advisory.com
19
The Bedrock to Support Every Goal
Sample Requirements for Success Under Medicare Payment Programs
Network Curation
and Management
Information
Exchange
Mechanisms for
Cost-Effective Care
Selection of and
collaboration with high-
quality, low-cost partners
PAC partner alignment
to payment reform goals
AC
O3
BP
CI2
R
RP
1
Common Themes Across Every Health System Initiative
Source: Post-Acute Care Collaborative interviews and analysis.
1) Readmissions Reduction Program.
2) Bundled Payments for Care Improvement.
3) Accountable Care Organization.
De
gre
e o
f In
teg
ration
Ability to track and share
information about patients
PAC partner alignment
to payment reform goals
PAC partner alignment
to payment reform goals
Selection of and
collaboration with high-
quality, low-cost partners
Selection of and
collaboration with high-
quality, low-cost partners
Ability to track and share
information about patients
Ability to track and share
information about patients
©2014 The Advisory Board Company • advisory.com
20
2
3
4
1
Road Map
Aligning Post-Discharge Care Management Roles
Forging Productive Clinical Partnerships
Seeking a Post-Acute Strategy
Towards Holistic Infrastructure
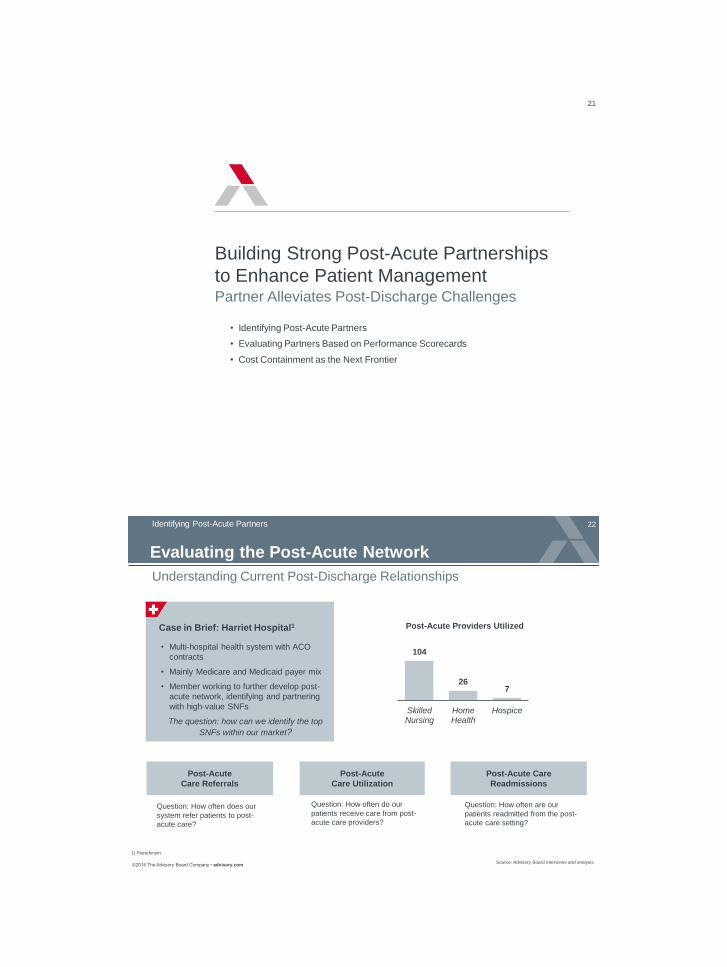
21
Building Strong Post-Acute Partnerships
to Enhance Patient Management Partner Alleviates Post-Discharge Challenges
• Identifying Post-Acute Partners
• Evaluating Partners Based on Performance Scorecards
• Cost Containment as the Next Frontier
©2014 The Advisory Board Company • advisory.com
22
Case in Brief: Harriet Hospital1
• Multi-hospital health system with ACO
contracts
• Mainly Medicare and Medicaid payer mix
• Member working to further develop post-
acute network, identifying and partnering
with high-value SNFs
The question: how can we identify the top
SNFs within our market?
Evaluating the Post-Acute Network
104
26 7
SkilledNursing
HomeHealth
Hospice
Post-Acute Providers Utilized
Identifying Post-Acute Partners
Understanding Current Post-Discharge Relationships
Question: How often does our
system refer patients to post-
acute care?
Question: How often do our
patients receive care from post-
acute care providers?
Question: How often are our
patients readmitted from the post-
acute care setting?
Post-Acute
Care Referrals
Post-Acute
Care Utilization
Post-Acute Care
Readmissions
1) Pseudonym.
Source: Advisory Board interviews and analysis.

©2014 The Advisory Board Company • advisory.com
23
Seeking Service-Line Specific Partners
Rigorous Selection Process Beyond the Norm of Quality Assessments
1) Electronic Medical Record.
Num
ber
of S
NF
s in E
valu
ation P
ool
• Identify SNF providers
most frequently utilized
• Data source: Epic EMR1
look-back over one year • Analyze providers’
performance on key
quality criteria, review
staffing models, etc.
• Data Source:
Medicare.gov
• Program Director of Orthopedics
leads internal team on tour
• Team conducts visual
assessment, discusses clinical
protocols, interviews SNF
leadership
TriHealth’s SNF Selection Process for Orthopedic Service Line
Assess Current
Discharge Patterns
Analyze Quality,
Performance Data
Conduct “Ortho” Tour
at Remaining SNFs
Time: 3-4 Months
Source: TriHealth; Post-Acute Care Collaborative interviews and analysis.
©2014 The Advisory Board Company • advisory.com
24
Case in Brief: TriHealth
• Not-for-profit, two-hospital health system located in Cincinnati, Ohio; offering the following
post-acute care services: home health and hospice
• Created initiative to rigorously select SNF partners and align with four main service lines:
orthopedic, pulmonary, advanced wounds and cardiac
• To select preferred SNF partners, TriHealth collects quality data on each SNF receiving
patient discharges within last year, analyzes performance, eliminates SNFs that do not
meet minimum quality standards
• Conducts tours of remaining SNF facilities with internal team including Program Director
of Orthopedics and heads of care management and social work, holds interviews with
SNF leadership and staff, completes overall evaluation form; finally votes to select partner
SNFs
• Performs ongoing outcomes tracking through a platform that aggregates standardized
SNF discharge reports for each patient, real time observation of red flag patterns, reports
data to physician partners every four to six months
• SNF selection pool for orthopedic discharges began at over 100 SNFs, process selected
only 13 partners; 88 percent of discharges now directed to one of the 13 selected SNFS
Source: TriHealth; Post-Acute Care Collaborative interviews and analysis.
Seeking Service-Line Specific Partners (cont.)

©2014 The Advisory Board Company • advisory.com
25
Individual PAC Provider Behavior Key to Episodic Performance
Evaluating Partners Based on Performance Scorecards
Source: Medicare Payment Advisory Commission, “Report to the Congress: Medicare Payment Policy,”
March 2015, available at: www.medpac.gov/documents/reports/march-2015-report-to-the-congress-
medicare-payment-policy.pdf?sfvrsn=0; Post-Acute Care Collaborative interviews and analysis.
1) Activities of daily living.
Significant Variation in Post-Acute Quality, Cost
Quality Measure (Risk-Adjusted) 75th
Percentile
25th
Percentile
Performance Decrease
from 75th to 25th
Percentile
Patients discharged to the community 46.6% 29.2% 37.3%
Potentially avoidable rehospitalizations
during SNF stay 13.9% 8.0% 42.4%
Potentially avoidable rehospitalizations
within 30 days from SNF 7.2% 3.4% 52.8%
Average mobility improvement across
three mobility ADLs1 52.5% 35.6% 32.2%
Quality Measure Variability Across Skilled Nursing Facility (SNF) Providers
Medicare Fee-for-Service, 2013
©2014 The Advisory Board Company • advisory.com
26
Scorecard Evaluation Identifies Potential Partners
Hospitals Solidifying PAC Performance Criteria
Performance Metrics Weights Score
30-Day All Cause
Readmissions
Average Length of Stay
All-Inclusive ED Transfers
Fall Rates, Infection Rates,
Wound Management
Case Mix Index
Patient Satisfaction
Staff and Patient Education
Sample PAC Scorecard Criteria Insights from Scorecard
Implementation
Source: Advisory Board interviews and analysis.
1. Proactively approach post-acute
care providers about partnerships –
Choose partnerships with post-acute
care providers who are willing to meet
partnership criteria and provide
performance data.
2. Drive the discussion around
meaningful performance metrics –
Select metrics that both meaningfully
reflect performance and are able to be
tracked.
3. Take a holistic approach to
standardizing metrics – Focus on
crafting a standard set of metrics that
evaluate PAC providers across clinical,
operational, and strategic criteria.

©2014 The Advisory Board Company • advisory.com
27
Understanding the Impact of Post-Acute Metrics on Cost
Cost Containment as the Next Frontier
Source: Post-Acute Care Collaborative interviews and analysis.
1) Average acute setting length of stay before post-acute
facility can safely admit the patient.
2) Length of stay.
The Total Cost of Care Picture
Overall Cost of Care
How Post-Acute
Specialties
Can Impact
Costs
Metrics to
Demonstrate
Impact
Acute Care
Costs
Post-Acute
Care Costs
Outpatient and
Home Care Costs
Reduce
readmissions
Admit
patients earlier
Readmission
rate
Average
onset days1
Shorten
LOS
Average
LOS2
Improve
patient function
Discharge
directly to home
Functional
status at
discharge
Percent
discharged
to home
©2014 The Advisory Board Company • advisory.com
28
Translating Quality to a Large Scale Financial Impact
Healthcare Cost and Utilization Project, “Statistical Brief #172: Conditions with the Largest Number of Adult Hospital Readmissions by Payer,” Agency
for Healthcare Research and Quality, 2014, http://www.hcup-us.ahrq.gov/reports/statbriefs/sb172-Conditions-Readmissions-Payer.pdf; Florida Office of
Program Policy Analysis and Government Accountability, “Profile of Florida’s Medicaid Home and Community-Based Services Waivers,” 2012,
http://elderaffairs.state.fl.us/doea/Evaluation/Profile%20of%20Florida's%20Medicaid%20Home%20and%20Community-
Based%20Services%20Waiver%20OPPAGA%2012-03.pdf; Vaidya A, “8 Statistics on the Average Cost Per ED Visit,” Becker’s Hospital CFO, May
31, 2013, http://www.beckershospitalreview.com/finance/8-statistics-on-the-average-cost-per-ed-visit.html; Post-Acute Care Collaborative interviews
and analysis.
1) Per month.
How Can We Reach $1 Million Impact?
Cost Savings
Opportunity
Single Occurrence
Cost Assumption Needed to Reach
$1 Million
Hospital
Readmissions $13,333 75
One-Day
Reduction in SNF
Length of Stay
$480 2,083
Readmissions
avoided
ED Diversion $1,062 942 ED visits
prevented
Days eliminated
©2014 The Advisory Board Company • advisory.com
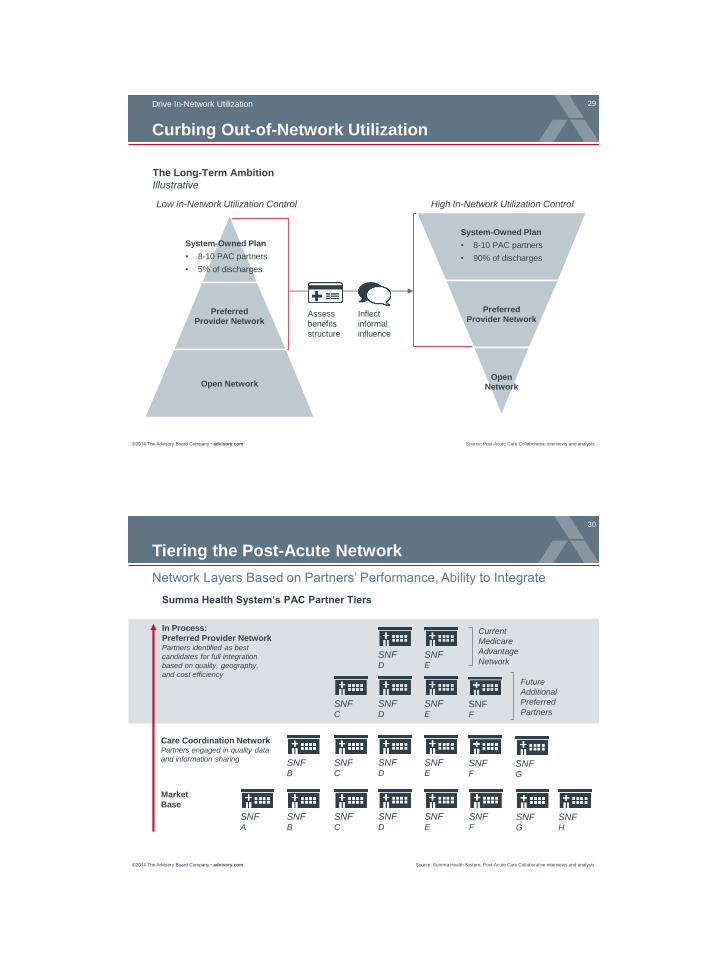
29 Drive In-Network Utilization
Curbing Out-of-Network Utilization
Preferred Provider Network
Open Network
The Long-Term Ambition
Illustrative
Assess
benefits
structure
Preferred Provider Network
Open Network
Inflect
informal
influence
Low In-Network Utilization Control High In-Network Utilization Control
System-Owned Plan
• 8-10 PAC partners
• 5% of discharges
System-Owned Plan
• 8-10 PAC partners
• 90% of discharges
Source: Post-Acute Care Collaborative interviews and analysis.
©2014 The Advisory Board Company • advisory.com
30
Network Layers Based on Partners’ Performance, Ability to Integrate
Source: Summa Health System; Post-Acute Care Collaborative interviews and analysis.
Tiering the Post-Acute Network
SNF A
SNF B
SNF C
SNF D
SNF E
SNF F
SNF B
SNF C
SNF D
SNF E
SNF G
SNF H
SNF F
SNF G
SNF C
SNF D
SNF E
SNF F
SNF D
SNF E
Summa Health System’s PAC Partner Tiers
Market
Base
Care Coordination Network Partners engaged in quality data
and information sharing
In Process:
Preferred Provider Network Partners identified as best
candidates for full integration
based on quality, geography,
and cost efficiency
Current
Medicare
Advantage
Network
Future
Additional
Preferred
Partners

©2014 The Advisory Board Company • advisory.com
31
Source Summa Health System; Post-Acute Care Collaborative interviews and analysis.
Tiering the Post-Acute Network (cont.)
Case in Brief: Summa Health System
• Not-for-profit health system including five hospitals and a Medicare Advantage plan
(SummaCare); headquartered in Akron, OH
• Began building a care coordination network of 25 preferred SNFs in 2002; gradually
tightened participation and quality requirements, added assisted living providers;
this broad network now includes 76 providers
• Readmission rates among participating providers decreased from 22% to 18.6%
across 18 months
• Plan to narrow even further to an additional, more tightly-knit preferred provider
network of 8-15 facilities, selected based on safety and quality outcomes and
metrics, geography and demographics, willingness to collaborate and integrate, and
cost efficiency
• Preferred provider network will be used for ACO and system-owned Medicare
Advantage plan
• Recognizing that broad network will be necessary given role of patient choice and
provider-specialties, maintain relationships with broader care coordination network
©2014 The Advisory Board Company • advisory.com
32
Baystate Promotes Top Providers But Preserves Choice
Sources: Baystate Medical Center, Springfield, MA;
Cardiovascular Roundtable interviews and analysis; Healthcare
Advisory Board interviews and analysis.
Steerage Not an Insurmountable Issue
Discharge coordinator
distributes list of
preferred SNFs to all
patients
Clearly states that
patient has freedom of
choice over where to be
discharged
Emphasizes preferred
providers’ high quality,
close relationship, and
continuity of care
BPCI CABG discharges
going to a preferred
SNF provider
60% Case in Brief: Baystate Medical Center
• 716-bed hospital based in Springfield, Massachusetts
• Participating in retrospective bundles via BPCI for CABG
• Achieved $1900 reduction in cost-per-episode for CABG,
largely attributed to more efficient SNF usage

©2014 The Advisory Board Company • advisory.com
33
Source: Post-Acute Care Collaborative interviews and analysis.
Characteristics of Optimal Network
Optimal network must be capable of caring
for every type of patient
Optimal network must be capable of
managing highest risk areas
Optimal network must be capable of
providing seamless support across the
full continuum
©2014 The Advisory Board Company • advisory.com
34
2
3
4
1
Road Map
Aligning Post-Discharge Care Management Roles
Forging Productive Clinical Partnerships
Seeking a Post-Acute Strategy
Towards Holistic Infrastructure

©2014 The Advisory Board Company • advisory.com
35
Four Key Post-Acute Actions Necessary for Success
Source: Post-Acute Care Collaborative interviews and analysis.
Market Demands Dictate Utilization Changes
4 Bolster Downstream
Support
1 Strengthen Complex
Patient Management
2 Elevate In-Setting
Care
3 Develop Cross-Continuum
Specialty Programs
Suite of Emerging Expectations for PAC Providers
• Additional regulatory
requirements
• Expanded public payer
coverage of select services
Legislative Forces
Factors Driving Additional Demands on Post-Acute Providers
• Opportunity for higher
reimbursement rates
• Emergence of
utilization managers
Commercial Forces
• Rising complexity,
acuity of patient profile
• Rapid growth in
elderly population
Demographic Forces
©2014 The Advisory Board Company • advisory.com
36 omplex Patient Management
Source: Administration on Aging, “Projected Future Growth of the Older Population,” www.aoa.gov/Aging_
Statistics/future_growth/future_growth.aspx#age; Gerace A, “Assisted Living Adapts to Changing Resident
Acuity”, August 12, 2013, www.seniorhousingnews.com; Post-Acute Care Collaborative interviews and analysis.
Service Demands Driven by Demographics
Key Reasons for Higher Patient Acuity and Complexity
in Post-Acute Care Settings
Population growing
older, with more
chronic conditions
Reimbursement changes
incent shorter LOS,
favor lower-cost settings
Aging Population New Payment Models
6%
18%
50%
26%
4-10
conditions
2-3
conditions
0 conditions
1 condition
Chronic Disease Prevalence Residential Care Facilities, 2010
Seniors as a Portion of the US Population
10%
0%
20%
30%
1990 2050 2010 2030
85+ 75-84 65-84
Actual Projected
Patients, Residents Older and Sicker
©2014 The Advisory Board Company • advisory.com
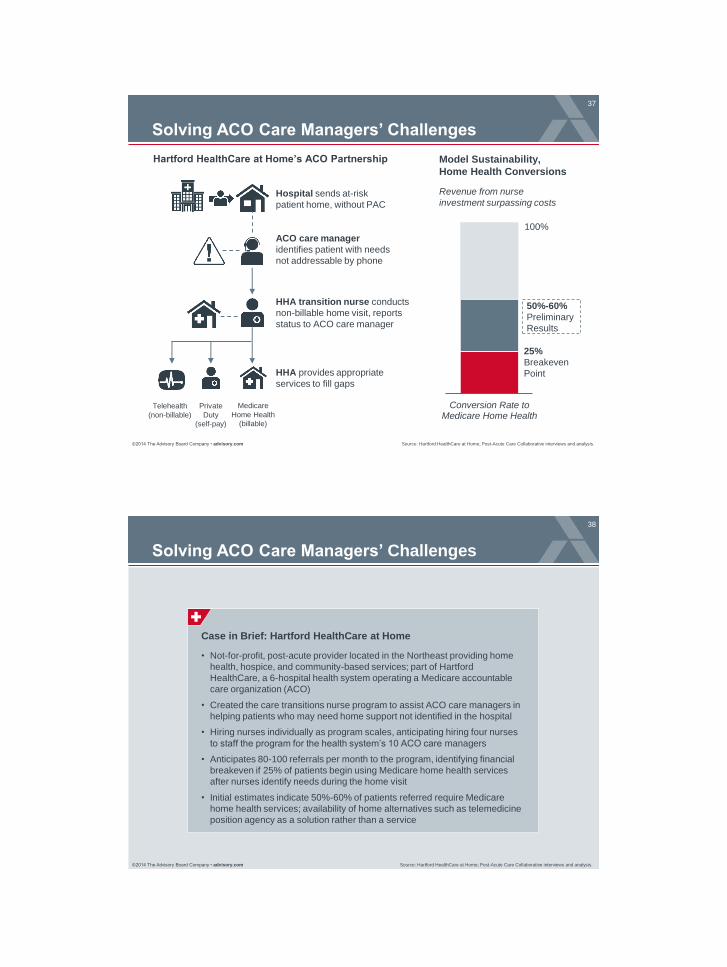
37
Source: Hartford HealthCare at Home; Post-Acute Care Collaborative interviews and analysis.
Solving ACO Care Managers’ Challenges
Conversion Rate toMedicare Home Health
25%
Breakeven
Point
50%-60%
Preliminary
Results
Model Sustainability,
Home Health Conversions
Revenue from nurse
investment surpassing costs
100%
Hospital sends at-risk
patient home, without PAC
ACO care manager
identifies patient with needs
not addressable by phone
HHA transition nurse conducts
non-billable home visit, reports
status to ACO care manager
HHA provides appropriate
services to fill gaps
Telehealth
(non-billable)
Private
Duty
(self-pay)
Medicare
Home Health
(billable)
Hartford HealthCare at Home’s ACO Partnership
©2014 The Advisory Board Company • advisory.com
38
Source: Hartford HealthCare at Home; Post-Acute Care Collaborative interviews and analysis.
Solving ACO Care Managers’ Challenges
Case in Brief: Hartford HealthCare at Home
• Not-for-profit, post-acute provider located in the Northeast providing home
health, hospice, and community-based services; part of Hartford
HealthCare, a 6-hospital health system operating a Medicare accountable
care organization (ACO)
• Created the care transitions nurse program to assist ACO care managers in
helping patients who may need home support not identified in the hospital
• Hiring nurses individually as program scales, anticipating hiring four nurses
to staff the program for the health system’s 10 ACO care managers
• Anticipates 80-100 referrals per month to the program, identifying financial
breakeven if 25% of patients begin using Medicare home health services
after nurses identify needs during the home visit
• Initial estimates indicate 50%-60% of patients referred require Medicare
home health services; availability of home alternatives such as telemedicine
position agency as a solution rather than a service

©2014 The Advisory Board Company • advisory.com
39
Embedding Hospital Clinicians in Local SNFs
Source: Joshi D K et al, “The Successful Development of a Subacute
Care Service Associated with a Large Academic Health System,”
Journal of the American Medical Directors Association, July 2012;
Advisory Board research and analysis.
Elevate In-Setting Care
UMHS Subacute Care Service Staffing Structure
Subacute Care Service
Medical Director
4 Physicians and
5 Nurse Practitioners
SNF Partners
7 days/week
staffing coverage
• Fellowship training in
geriatric medicine
• Board certifications in
internal and geriatric
medicine
• Interest in managing
medically complex
patients post-hospital
discharge
• SNF and med-surg
unit experience
• Highly skilled in
managing wounds,
surgical drains,
IV lines, complex
medical care,
polypharmacy, and
geriatric syndromes
• Serves as visible
clinical director at
hospital for entire
subacute service
• Assures referring
physicians they can
discharge to SACS
SNF with confidence
Physician
Background
Nurse Practitioner
Background
©2014 The Advisory Board Company • advisory.com
40
Case in Brief: University of Michigan Health System
• Not-for-profit, 914-bed academic medical center located in Ann Arbor, MI
• Launched subacute care service in 2006 to enhance overall quality of
post-discharge care, decrease inpatient LOS, and reduce readmissions
• Patient care is provided in four privately owned SNFs within 20 miles of
the hospital
• Team of physicians and nurse practitioners manages all UMHS patients
discharged to SACS-affiliated SNFs
Embedding Hospital Clinicians in Local SNFs (cont.)
Source: Joshi D K et al, “The Successful Development of a Subacute
Care Service Associated with a Large Academic Health System,”
Journal of the American Medical Directors Association, July 2012;
Advisory Board research and analysis.

©2014 The Advisory Board Company • advisory.com
41
Partnership Yielding Positive Results
Despite Higher Acuity, LOS and Readmissions Reduced
Source: Joshi D K et al, “The Successful Development of a Subacute Care Service
Associated with a Large Academic Health System,” Journal of the American Medical
Directors Association, July 2012; Advisory Board research and analysis.
Case Mix Index
In Days
10.6
8.0
2006 2011
Average Length of Stay
1.98
2.03
2006 2011 2006 2011
15-Day Readmissions Rate
53% Increase in discharges
from UMHS to Subacute
Care Service SNFs
20.0%
17.4%
©2014 The Advisory Board Company • advisory.com
42
Establish Infrastructure to Fill Niche Service Gaps
Training to Address Medically Complex Behavioral Health Patients
Source: Advisory Board interviews and analysis.
HealthEast – Cerenity Senior Care Partnership
Collaborative Hospital-SNF Training Real-Time Clinical Support
Outpatient Clinic
Patient seen at hospital
physician clinic to avoid
unnecessary readmission
Physician Support Line
Hospital team available
over the phone for
on-demand consults
Clinical Training for Medication Management
Solution: Hospital
provides input on
patient stimulation
and socialization
Problem: SNF inexperienced
assessing capacity for patient
decision-making and
determining decision-maker
Solution: Hospital
shares ethical principles
for substituted judgment
and beneficence
Problem: Mandated dose
reduction in SNF raises
concerns about return of
symptoms
Solution: Hospital and
SNF physicians discuss
procedures for safely
tapering medications
Problem: Younger
population requires
activities atypical of
average SNF patient
Guidance for Addressing Population Needs
Protocols Around Patient Mental Capacity
Develop Cross-Continuum Specialty Programs

©2014 The Advisory Board Company • advisory.com
43
Case in Brief: HealthEast Care System
• Not-for-profit, four-hospital health system located in St. Paul, MN
• Medically complex behavioral health patients lingering in acute care
hospitals as post-acute providers reluctant to admit
• Established collaborative partnership with Cerenity Senior Care comprised
of formal clinical training and ongoing support to manage specific patient
population
• Training addressed key SNF challenges for managing complex medical and
behavioral health needs
• Patients discharged from HealthEast to Cerenity Senior Care with robust
support system in place
Establish Infrastructure to Fill Niche Service Gaps
(cont.)
Source: Advisory Board interviews and analysis.
©2014 The Advisory Board Company • advisory.com
44
Partnership Boosting Referrals and Admissions
Source: Advisory Board interviews and analysis.
Behavioral Health
Admissions
141
215
Nov. '10 -Apr. '11
Nov. '11-Jan. '12
62 76
Nov. '10 -Apr. '11
Nov. '11-Jan. '12
Total
Referrals
Monthly Average of HealthEast – Cerenity Patient Transfers
A True Partnership
Medical Director,
Post-Acute and Community Health
HealthEast Care System
”
“In order to seamlessly serve our
complex patients across the entire
continuum, it is critical that the staff
working at the various sites of care
(hospital, post-acute etc.) act as a
cohesive team. This has been
transformational adaptive change for
us and the rewards for our patients
have been truly amazing.”
Before partnership
After partnership

©2014 The Advisory Board Company • advisory.com
45
Home Health, Hospice Spending Associated with Lower Total Costs
Bolstering Downstream Support
Source: De Jonge, Erik K, et al., “Effects of Home-Based Primary Care on Medicare Costs in High-Risk Elders,”
Journal of the American Geriatrics Society, 2014, http://onlinelibrary.wiley.com/doi/10.1111/jgs.12974/pdf; Post-
Acute Care Collaborative interviews and analysis.
1) Diagnostic testing, transportation, Medicare Part B drugs, nonphysician
practitioners, durable medical equipment, outpatient facility.
Enhancing Traditional Home Health Episodes
Service Category Intervention Control Change
Hospice $3,144 $1,505 109%
Home Health $6,579 $4,170 58%
Physician $4,143 $5,718 (28%)
Skilled nursing $4,821 $6,098 (20%)
Other1 $7,962 $11,392 (30%)
Hospitalization $17,805 $22,096 (19%)
Total Medicare $44,455 $50,978 (13%)
Financial Impact of Medstar’s Medicare Home-Based Primary Care Demonstration
Mean 2-year spending per patient
• Primary care team of
geriatricians, NPs,
social workers, LPNs,
office coordinators
• Physicians visit every
3-4 months and provide
24/7 call, NPs visit
regularly as needed
• Team conducts weekly
care conferences with
home health, mental
health, pharmacy
HBPC Model
©2014 The Advisory Board Company • advisory.com
46
Source: De Jonge, Erik K, et al., “Effects of Home-Based Primary Care on Medicare Costs in High-Risk Elders,”
Journal of the American Geriatrics Society, 2014, http://onlinelibrary.wiley.com/doi/10.1111/jgs.12974/pdf; Post-
Acute Care Collaborative interviews and analysis.
Enhancing Traditional Home Health Episodes
Case in Brief: Medstar Health
• Not-for-profit, 10-hospital health system located in the Mid-Atlantic region
• Piloted a home-based primary care demonstration for the fee-for-service Medicare
population based off of the Department of Veteran’s Affairs’ home-based primary care
model
• 2-year results yielded significant cost savings, primarily from reduced hospitalizations
• Despite initially segmenting their patient population to high-risk patients, upon
retrospectively segmenting their patient population by the most frail patients (JEN Frailty
Index score of 7 or more), researchers found that if the middle and low risk patients had
not received the intervention, savings would have been the same
• JEN Frailty Index measures the presence or absence of 13 characteristics with a point
on the 13-point scale given for the presence of each characteristic; characteristics
measured are minor or major ambulatory impairment, mental health diagnosis, mental
retardation, dementia, impairment in sensory function or self-care, presence of general
symptoms, diagnosis of cancer, presence of major chronic diseases, pneumonia, renal
disease, and other medical risks.
• Program highlights opportunity for providers to better segment patients for intensive
health interventions to maximize the financial impact of the program and potentially
improve pricing from managed care payers

©2014 The Advisory Board Company • advisory.com
47
Source: De Jonge, Erik K, et al., “Effects of Home-Based Primary Care on Medicare Costs in High-Risk Elders,” Journal of the American
Geriatrics Society, 2014, http://onlinelibrary.wiley.com/doi/10.1111/jgs.12974/pdf; Post-Acute Care Collaborative interviews and analysis.
Shrink Volumes to Maximize Per-Patient Impact
Frailty
Category
(JEN Index)
Proportion
of Sample Intervention Control Change
Statistically
Significant?
Low (0-3) 20% $22,611 $19,146 18% No
Medium (4-6) 43% $42,223 $43,383 -3% No
High (7+) 37% $58,689 $76,827 -24% Yes
(p < 0.001)
With Proper Risk Stratification, Less Can Be More
Patients included in the intervention cohort who could
have been served with routine care to achieve similar
spend reduction results at a lower program cost
63%
Medicare Spending for Home-Based Primary Care by Patient Frailty
Stratification by Patient Frailty Intensifies Program Results
©2014 The Advisory Board Company • advisory.com
48
2
3
4
1
Road Map
Aligning Post-Discharge Care Management Roles
Forging Productive Clinical Partnerships
Seeking a Post-Acute Strategy
Towards Holistic Infrastructure

©2014 The Advisory Board Company • advisory.com
49
Care Management
Care Management the Catch-All for Emerging Risk
Source: Post-Acute Care Collaborative Interviews and analysis.
Traditional Risk
• Site-specific clinical capability
• Delivery alignment with
prospective payment system
Emerging Risk
Self-management
capability
Primary care,
continuing care
access
Home safety Care delivery
efficiency
Medication profile
consistency
Cost-appropriate
system navigation
Information
exchange
Addressing the comprehensive
patient and caregiver needs that
influence functional outcomes,
satisfaction, and long-term cost
Common Goals:
• Reduce unnecessary resource
utilization (hospital, ED visits)
• Improve patient and caregiver
satisfaction
• Raise clinical quality indicator
performance
• Foster information exchange
• Facilitate care access
Risk Assumption with Health Care Evolution
Support Required Beyond Care Setting Walls
©2014 The Advisory Board Company • advisory.com
50
Scoping the Ambition
Source: Post-Acute Care Collaborative interviews and analysis.
Payer
Support
Availability
Episodic Care Management 1
Examples: Primary care integration, senior
wellness coaching, diabetes management,
behavioral health case management
Long-Term Care Management 2
Necessity
as a PAC
Responsibility
Value to
Referrers
Referrer Episodic Exposure Growing
All hospitals soon incented on PAC efficiency;
readmissions a national area of focus
Emerging as Primary Care Responsibility
Uncoordinated or overly ambitious approaches
may confuse patients, alienate PCPs;
however, post-acute expertise a highly
valuable input for primary care development
External PAC Management Risky
Poor hospital or third-party management of
PAC utilization can cause readmissions from
early discharge or cost overruns from
inappropriate setting placement
Slower Payment Alignment Progress
Commercial payers lacking contracting
sophistication for innovative long-term care
payment; however, private payment and
physician ACOs funding select innovations
Examples: 90-day longitudinal care pathing,
transitional care services, length of stay
management, PCP follow-up coordination
Medicare Incentives Most Aligned
Medicare FFS incentives, bundling, and
shared savings gains realized from short-
stay patients, quickest return on investment
potential for Medicare innovators
Limited value for non-integrated hospitals
However, highly relevant for integrated
systems, physician ACOs, payers

©2014 The Advisory Board Company • advisory.com
51
Information-Sharing Vital for Care Management
Source: Post-Acute Care Collaborative interviews and analysis.
Two Critical Cross-Continuum Care Management Challenges
Hospital Care
Manager
HHA PCP Care
Manager
“I’m calling for your
post-discharge check-up…”
Tracking Patient Location Tracking Needed Services
©2014 The Advisory Board Company • advisory.com
52
Leveraging Data to Assess, Monitor Provider Quality
Source: Post-Acute Care Collaborative interviews and analysis.
Harnessing Multiple Goals of Information-Sharing
Time, Amount of Collected Data
Deg
ree o
f S
yste
m
Inte
gra
tion
Health System Benefits of Information-Sharing
INDIVIDUAL PATIENT
INFORMATION TRANSFER
Share patient information
across providers to reduce
unnecessary utilization
EFFECTIVE CARE
MANAGEMENT
DEPLOYMENT
Ensure patients receive all
services needed without
unnecessary duplication
PROVIDER QUALITY
TRACKING
Review collected data
to target improvement
opportunities, inform
financial arrangements

©2014 The Advisory Board Company • advisory.com
53
Addressing Duplications, Gaps in Existing Roles
Commonalities in Hospital Roles Inform New Post-Acute Opportunities
Multidisciplinary Working Group Audits, Revises Care Management Functions
Care Management
Redesign Team
Care managers, social
workers, nurses
convened weekly over
period of nine months
Day-in-the-Life Summary
Overview of daily routine,
primary duties and activities
Job Descriptions
Outlined roles for inpatient
positions, transitions coaches
Staffing Resources Produced
• Job roles and
responsibilities
• Multidisciplinary rounding
process across system
• Use of technology,
resources
• IT-based peer-to-peer
communication
Functions Audited
Hospital Care Management Gap Audit Tool
• Catalogs job functions, common names, and duties for hospital care management staff
• Allows Post-Acute Care Collaborative Members to recognize service gaps, identify
common blind spots for hospital and physician group partners
• For complete opportunity audit tool, please see the appendix.
Source: Post-Acute Care Collaborative interviews and analysis.
©2014 The Advisory Board Company • advisory.com
54
Source: Post-Acute Care Collaborative interviews and analysis.
Addressing Duplications, Gaps in Existing Roles
(cont.)
Case in Brief: LifeBridge Health
• Health system including two acute care hospitals and a multi-service
post-acute care center located in Baltimore, Maryland
• System clarified, standardized care management functions to remove
duplication, gaps as part of Care Management Redesign Initiative
• Steering and Leadership Committees consisting of system senior
executives provided strategic direction, oversight to working groups

©2014 The Advisory Board Company • advisory.com
55
Case in Brief: Walgreen Co.
• Largest drug retail chain in the United
States, with 372 Take Care Clinics and
over 700 locations throughout the country
• In 2012, created WellTransitions™
program to help health systems reduce
readmissions by offering transitional
support for at-risk patients
• Strong initial results include 5 point lower
readmission rate over 6 months for
patients enrolled in the program versus
eligible patients who did not enroll
• Received American Hospital Association
endorsement for medication adherence
portion of WellTransitions™
WellTransitions™ Program Components
Medication
Reconciliation
Appointment
Reminders
Prescription
Delivery
Follow-Up
Phone Calls
“Solution” Sales on the Rise for Non-Providers
Source: “WellTransitions©,” Walgreen Co., http://healthcare.walgreens.com/healthcare/business/ProductOffering.jsp?id=wellTransitions’;
Post-Acute Care Collaborative interviews and analysis.
Recognizing the Potential of Targeted Services