Possibilities for C / GHG mitigation in agricultural lands Pete Smith Professor of Soils & Global...
26
Possibilities for C / GHG mitigation in agricultural lands Pete Smith fessor of Soils & Global Change ool of Biological Sciences, versity of Aberdeen, tland, UK ail: [email protected] CarboEurope-IP Annual Meeting, Poznan, Poland, Octob
-
Upload
felicity-jenkins -
Category
Documents
-
view
214 -
download
0
Transcript of Possibilities for C / GHG mitigation in agricultural lands Pete Smith Professor of Soils & Global...

Possibilities for C / GHG mitigation in agricultural lands
Pete Smith
Professor of Soils & Global ChangeSchool of Biological Sciences, University of Aberdeen, Scotland, UKE-mail: [email protected]
CarboEurope-IP Annual Meeting, Poznan, Poland, October 2007

Outline
• Agricultural GHG emissions• Global potential for agricultural GHG
mitigation• Agriculture in the big picture• Conclusions
Agricultural GHG emissions

Distribution of croplands globally

Agricultural GHG emissions
CH4 and N2O emissions by world region, 1990-2020

Global potential for agricultural GHG mitigation

Method
• Database of over 200 experiments to derive per-area / per-animal mitigation efficiencies for >60 agricultural mitigation options, for four climate zones – for CO2, CH4 and N2O
• Mean estimates and low and high 95% CI values derived from mixed effects modelling
• Applied to appropriate agricultural (crop, grass, livestock) areas / numbers in each climate zone in each region
Smith et al. (2007a)

CO2 (t CO2 ha-1 y-1) CH4 (t CO2-eq. ha-1 y-1) N2O (t CO2-eq. ha-1 y-1) All GHG (t CO2-eq. ha-1 y-1)
Climate zone Activity PracticeMean
estimateLow High Mean
estimateLow High Mean
estimateLow High Mean
estimateLow High
Cool-dry Croplands agronomy 0.29 0.07 0.51 0.00 0.00 0.00 0.10 0.00 0.20 0.39 0.07 0.71Croplands nutrient management 0.26 -0.22 0.73 0.00 0.00 0.00 0.07 0.01 0.32 0.33 -0.21 1.05Croplands tillage and residue management 0.15 -0.48 0.77 0.00 0.00 0.00 0.02 -0.04 0.09 0.17 -0.52 0.86Croplands water management 1.14 -0.55 2.82 0.00 0.00 0.00 0.00 0.00 0.00 1.14 -0.55 2.82Croplands set-aside and LUC 1.61 -0.07 3.30 0.02 0.00 0.00 2.30 0.00 4.60 3.93 -0.07 7.90Croplands agro-forestry 0.15 -0.48 0.77 0.00 0.00 0.00 0.02 -0.04 0.09 0.17 -0.52 0.86Grasslands grazing, fertilizaltion, fire 0.11 -0.55 0.77 0.02 0.01 0.02 0.00 0.00 0.00 0.13 -0.54 0.79Organic soils restoration 36.67 3.67 69.67 -3.32 -0.05 -15.30 0.16 0.05 0.28 33.51 3.67 54.65Degraded landsrestoration 3.45 -0.37 7.26 0.08 0.04 0.14 0.00 0.00 0.00 3.53 -0.33 7.40Manure / biosolidsapplication 1.54 -3.19 6.27 0.00 0.00 0.00 0.00 -0.17 1.30 1.54 -3.36 7.57Bioenergy soils only 0.15 -0.48 0.77 0.00 0.00 0.00 0.02 -0.04 0.09 0.17 -0.52 0.86
Cool-moist Croplands agronomy 0.88 0.51 1.25 0.00 0.00 0.00 0.10 0.00 0.20 0.98 0.51 1.45Croplands nutrient management 0.55 0.01 1.10 0.00 0.00 0.00 0.07 0.01 0.32 0.62 0.02 1.42Croplands tillage and residue management 0.51 0.00 1.03 0.00 0.00 0.00 0.02 -0.04 0.09 0.53 -0.04 1.12Croplands water management 1.14 -0.55 2.82 0.00 0.00 0.00 0.00 0.00 0.00 1.14 -0.55 2.82Croplands set-aside and LUC 3.04 1.17 4.91 0.02 0.00 0.00 2.30 0.00 4.60 5.36 1.17 9.51Croplands agro-forestry 0.51 0.00 1.03 0.00 0.00 0.00 0.02 -0.04 0.09 0.53 -0.04 1.12Grasslands grazing, fertilizaltion, fire 0.81 0.11 1.50 0.00 0.00 0.00 0.00 0.00 0.00 0.80 0.11 1.50Organic soils restoration 36.67 3.67 69.67 -3.32 -0.05 -15.30 0.16 0.05 0.28 33.51 3.67 54.65Degraded landsrestoration 3.45 -0.37 7.26 1.00 0.69 1.25 0.00 0.00 0.00 4.45 0.32 8.51Manure / biosolidsapplication 2.79 -0.62 6.20 0.00 0.00 0.00 0.00 -0.17 1.30 2.79 -0.79 7.50Bioenergy soils only 0.51 0.00 1.03 0.00 0.00 0.00 0.02 -0.04 0.09 0.53 -0.04 1.12
Warm-dry Croplands agronomy 0.29 0.07 0.51 0.00 0.00 0.00 0.10 0.00 0.20 0.39 0.07 0.71Croplands nutrient management 0.26 -0.22 0.73 0.00 0.00 0.00 0.07 0.01 0.32 0.33 -0.21 1.05Croplands tillage and residue management 0.33 -0.73 1.39 0.00 0.00 0.00 0.02 -0.04 0.09 0.35 -0.77 1.48Croplands water management 1.14 -0.55 2.82 0.00 0.00 0.00 0.00 0.00 0.00 1.14 -0.55 2.82Croplands set-aside and LUC 1.61 -0.07 3.30 0.02 0.00 0.00 2.30 0.00 4.60 3.93 -0.07 7.90Croplands agro-forestry 0.33 -0.73 1.39 0.00 0.00 0.00 0.02 -0.04 0.09 0.35 -0.77 1.48Grasslands grazing, fertilizaltion, fire 0.11 -0.55 0.77 0.00 0.00 0.00 0.00 0.00 0.00 0.11 -0.55 0.77Organic soils restoration 73.33 7.33 139.33 -3.32 -0.05 -15.30 0.16 0.05 0.28 70.18 7.33 124.31Degraded landsrestoration 3.45 -0.37 7.26 0.00 0.00 0.00 0.00 0.00 0.00 3.45 -0.37 7.26Manure / biosolidsapplication 1.54 -3.19 6.27 0.00 0.00 0.00 0.00 -0.17 1.30 1.54 -3.36 7.57Bioenergy soils only 0.33 -0.73 1.39 0.00 0.00 0.00 0.02 -0.04 0.09 0.35 -0.77 1.48
Warm-moist Croplands agronomy 0.88 0.51 1.25 0.00 0.00 0.00 0.10 0.00 0.20 0.98 0.51 1.45Croplands nutrient management 0.55 0.01 1.10 0.00 0.00 0.00 0.07 0.01 0.32 0.62 0.02 1.42Croplands tillage and residue management 0.70 -0.40 1.80 0.00 0.00 0.00 0.02 -0.04 0.09 0.72 -0.44 1.89Croplands water management 1.14 -0.55 2.82 0.00 0.00 0.00 0.00 0.00 0.00 1.14 -0.55 2.82Croplands set-aside and LUC 3.04 1.17 4.91 0.02 0.00 0.00 2.30 0.00 4.60 5.36 1.17 9.51Croplands agro-forestry 0.70 -0.40 1.80 0.00 0.00 0.00 0.02 -0.04 0.09 0.72 -0.44 1.89Grasslands grazing, fertilizaltion, fire 0.81 0.11 1.50 0.00 0.00 0.00 0.00 0.00 0.00 0.81 0.11 1.50Organic soils restoration 73.33 7.33 139.33 -3.32 -0.05 -15.30 0.16 0.05 0.28 70.18 7.33 124.31Degraded landsrestoration 3.45 -0.37 7.26 0.00 0.00 0.00 0.00 0.00 0.00 3.45 -0.37 7.26Manure / biosolidsapplication 2.79 -0.62 6.20 0.00 0.00 0.00 0.00 -0.17 1.30 2.79 -0.79 7.50Bioenergy soils only 0.70 -0.40 1.80 0.00 0.00 0.00 0.02 -0.04 0.09 0.72 -0.44 1.89
Per-area / per-animal mitigation potential
For 14 practices, for 4 climate zones, for CO2, N2O & CH4, estimates for mean and +/- 95%CI Smith et al. (2007a)

IPCC AR4 Agricultural GHG MitigationFAO AEZ Database (e.g. showing regions)
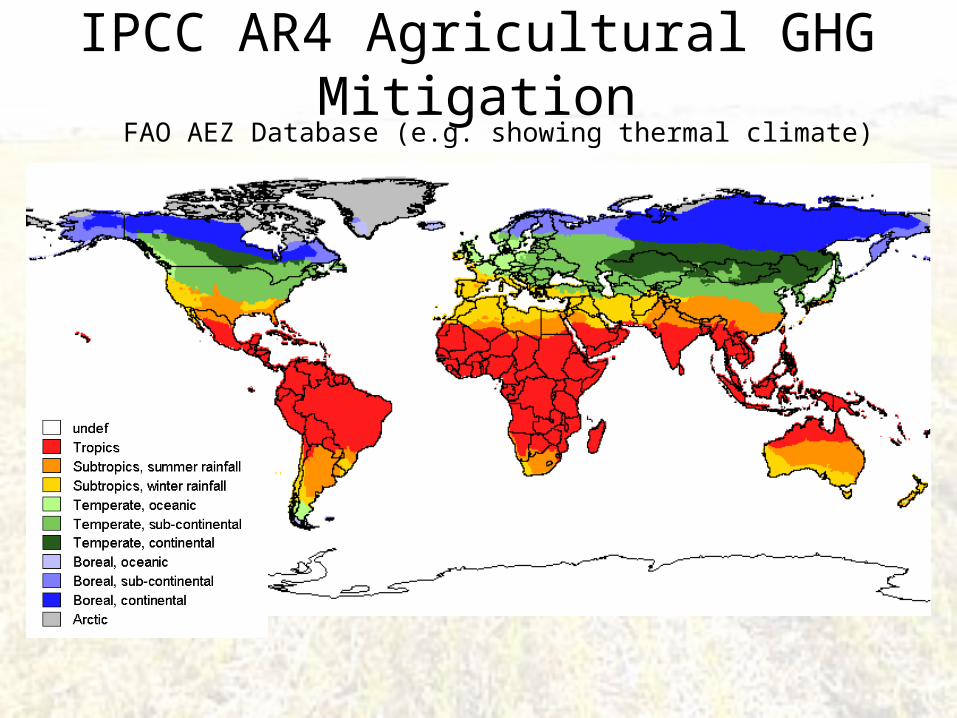
IPCC AR4 Agricultural GHG MitigationFAO AEZ Database (e.g. showing thermal climate)

IPCC AR4 Agricultural GHG MitigationFAO AEZ Database (e.g. showing production constraints)
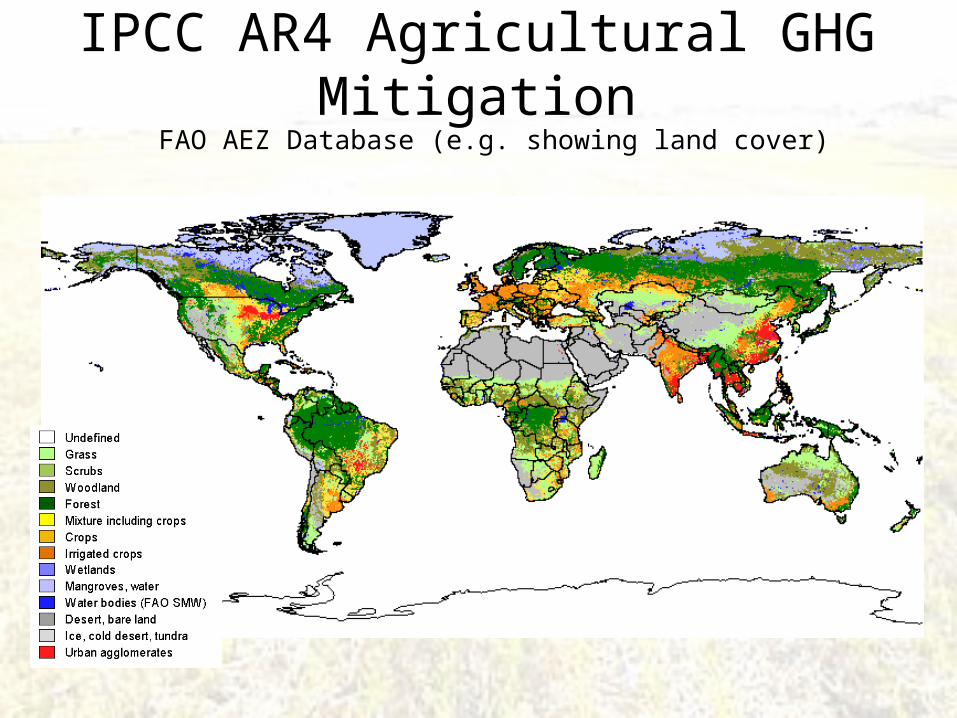
IPCC AR4 Agricultural GHG MitigationFAO AEZ Database (e.g. showing land cover)

Global mitigation potential in agriculture
-200
0
200
400
600
800
1000
1200
1400
1600
Cro
plan
d m
anag
emen
t
Wat
er m
anag
emen
t
Ric
e m
anag
emen
t
Set
asid
e, L
UC
&ag
rofo
rest
ry
Gra
zing
land
man
agem
ent
Res
tore
cul
tivat
edor
gani
c so
ils
Res
tore
deg
rade
dla
nds
Bio
ener
gy (
soils
com
pone
nt)
Liv
esto
ck
Man
ure
man
agem
ent
Mitigation measure
Glo
bal b
ioph
ysic
al m
itiga
tion
pote
ntia
l (M
t CO 2-
eq. y
r-1)
N2O
CH4
CO2
Smith et al. (2007a)

Regional breakdown of mitigation potential
Smith et al. (2007a)

-200
0
200
400
600
800
1000
1200
1400
1600
1800
Sou
thea
st A
sia
Sou
th A
mer
ica
Eas
t Asi
a
Sou
th A
sia
Eas
tern
Afr
ica
Rus
sian
Fed
erat
ion
Nor
th A
mer
ica
Wes
tern
Eur
ope
Wes
tern
Afr
ica
Cen
tral
Asi
a
Nor
ther
n E
urop
e
Mid
dle
Afr
ica
Eas
tern
Eur
ope
Oce
ania
Sou
ther
n E
urop
e
Cen
tral
Am
eric
a
Nor
ther
n A
fric
a
Wes
tern
Asi
a
Sou
ther
n A
fric
a
Car
ribe
an
Japa
n
Pol
ynes
ia
Region
Mt C
O2-
eq. y
r-1
Smith et al. (2007a)
High and low estimates of the mitigation potential in each region

Effect of C price on implementation
Smith et al. (2007a)
0
200
400
600
800
1000
1200
1400
Res
tore
cul
tivat
edor
gani
c so
ils
Cro
plan
dm
anag
emen
t
Gra
zing
land
man
agem
ent
Res
tore
deg
rade
dla
nds
Ric
e m
anag
emen
t
Liv
esto
ck
Set
asid
e, L
UC
&ag
rofo
rest
ry
Man
ure
man
agem
ent
Measure
Mt C
O2-
eq. y
r-1
up to 20 USD t CO2-eq.-1
up to 50 USD t CO2-eq.-1
up to 100 USD t CO2-eq.-1

Global mitigation potential in agriculture (Mt CO2-eq. yr-1)
Price range (USD t CO2-eq. -1)
Scenario 0-20 0-50 0-1000->>100 (technical
potential)
B1 1925 2384 3149 5480
A1b 1982 2439 3254 5670
B2 2047 2495 3330 5844
A2 2119 2549 3330 5957
Smith et al. (2007a)

Agriculture in the big picture

Energy supply
0
1
2
3
4
5
6
7GtCO2-eq
Transport Buildings Industry Agriculture Forestry Waste
Non-OECD/EI TEITOECDWorld total
US$/tCO2-eq
Global economic mitigation potential for different sectors at different carbon prices
IPCC WGIII (2007)

GHG emissions have increased by 70% since 1970
IPCC, AR4, WGIII (2007)
Emission trends

There is significant mitigation potential at a range of C prices
IPCC WGIII (2007)

The cost of stabilizing atmospheric GHG concentrations by 2100Increases with the stringency of the stabilization target
Stabilizing at 590-710 ppm CO2-eq. will cost -0.6 to1.23% of GDPStabilizing at 535-590 ppm CO2-eq. will cost 0.2 to 2.5% of GDPStabilizing at 445-535 ppm CO2-eq. will cost 3% of GDP
IPCC WGIII (2007)

Characteristics of stabilization scenarios – links between GHG concentrations, warming, emission peak year and reduction required
IPCC WGIII (2007)

Change in temperature associated with different GHG stabilization levels
IPCC WGIII (2007)

Conclusions• Agriculture offers a globally significant slice of climate
mitigation• Agricultural mitigation options are cost competitive with
climate mitigation measures in other sectors• Climate mitigation to stabilise atmospheric CO2
concentrations at between 500 and 700 ppm will cost 0-3% of global GDP (a lot of money!)
• The cost of not mitigation climate change are estimated to cost at least 5% of global GDP each year, now and forever. If a wider range of risks and impacts is taken into account, the estimates of damage could rise to 20% of GDP or more (Stern, 2006; that is even more money!!)
• To mitigate or not to mitigate – it really is a no brainer

Thank you for your attention