POS+NEF OF PFI
24
Perceptions of positive and negative factors influencing the attractiveness of PPP/PFI procurement for construction projects in the UK Findings from a questionnaire survey Bing Li and A. Akintoye School of the Built and Natural Environment, Glasgow Caledonian University, Glasg ow, UK P.J. Edwards School of Property, Construction and Project Management, RMIT University, Melbourne, Australia, and C. Hardcastle School of the Built and Natural Environment, Glasgow Caledonian University, Glasg ow, UK Abstract Purpose – The paper aims to report the findings of research into perceptions of what makes the Private Finance Initiat ive (PFI) attractive or unattra ctive as a procur ement system for projects in the UK. Design/methodology/approach – The research uses a postal survey questionnaire technique for pri mary data col lec tion . Lit era tur e rev iew is use d to ide nti fy rel evant fac tors, whi ch are the n incorporated into the design of the survey instrument. Survey response data is subjected to descriptive statis tical analysis and subseq uently to rotated factor analysis. Findings – Public /pr ivate part ner shi ps (PPP)/ PFI pro jec t pro cur eme nt is per cei ved as most attractive in terms of positive factors relating to better project technology and economy, greater public benefit, public sector avoidance of regulatory and financial constraints, and public sector saving in transaction costs. Negative aspects, relating to factors such as the inexperience of the participants, the over-c ommerc ialisat ion of projects, and high participat ion cost and time, make PPP/PFI procurement less attractive. Originality/value – The procurement of public facilities and services under arrangements involving partnerships between the public and private sectors is claimed to provide a wide variety of net benefits to the public sector and to the private sector participants. In the project development process, the partie s have to make decisi ons based on suitab le evaluation criteri a. At the early stage of prepari ng a business case, a clear and common understanding of the positive and negative factors surrounding PPP/PFI procurement will provide a more informed basis for decision making. Keywords Private finance, Procurement, Construction industry, Factor a nalysis, United Kingdom Paper type Research paper The Eme ral d Rese arc h Regi ste r fo r th is j our nal is availabl e at The cur rent is sue and ful l te xt arc hive of thi s jo urn al i s a vai lable a t www.emeraldinsight.com/researchregister www.emeraldinsight.com/0969-9988.htm P.J. Edwards is currently Leverhulme Trust Visiting Fellow in the School of the Built and Natural Environment, Glasgow Caledonian University, Glasgow, UK. PPP/PFI procurement 125 Engineering, Construction and Architectural Management Vol. 12 No. 2, 2005 pp. 125-148 q Emerald Group Publishing Limited 0969-9988 DOI 10.1108/09699980510584485
Transcript of POS+NEF OF PFI
8/7/2019 POS+NEF OF PFI
http://slidepdf.com/reader/full/posnef-of-pfi 1/24
Perceptions of positive andnegative factors influencing the
attractiveness of PPP/PFIprocurement for construction
projects in the UKFindings from a questionnaire survey
Bing Li and A. AkintoyeSchool of the Built and Natural Environment, Glasgow Caledonian University,
Glasgow, UK
P.J. EdwardsSchool of Property, Construction and Project Management, RMIT University,
Melbourne, Australia, and
C. HardcastleSchool of the Built and Natural Environment, Glasgow Caledonian University,
Glasgow, UK
Abstract
Purpose – The paper aims to report the findings of research into perceptions of what makes thePrivate Finance Initiative (PFI) attractive or unattractive as a procurement system for projects in theUK.
Design/methodology/approach – The research uses a postal survey questionnaire technique forprimary data collection. Literature review is used to identify relevant factors, which are thenincorporated into the design of the survey instrument. Survey response data is subjected to descriptivestatistical analysis and subsequently to rotated factor analysis.
Findings – Public/private partnerships (PPP)/PFI project procurement is perceived as mostattractive in terms of positive factors relating to better project technology and economy, greater publicbenefit, public sector avoidance of regulatory and financial constraints, and public sector saving intransaction costs. Negative aspects, relating to factors such as the inexperience of the participants, theover-commercialisation of projects, and high participation cost and time, make PPP/PFI procurementless attractive.
Originality/value – The procurement of public facilities and services under arrangements involvingpartnerships between the public and private sectors is claimed to provide a wide variety of net benefitsto the public sector and to the private sector participants. In the project development process, the
parties have to make decisions based on suitable evaluation criteria. At the early stage of preparing abusiness case, a clear and common understanding of the positive and negative factors surroundingPPP/PFI procurement will provide a more informed basis for decision making.
Keywords Private finance, Procurement, Construction industry, Factor analysis, United Kingdom
Paper type Research paper
The Emerald Research Register for this journal is available at The current issue and full text archive of this journal is available at
www.emeraldinsight.com/researchregister www.emeraldinsight.com/0969-9988.htm
P.J. Edwards is currently Leverhulme Trust Visiting Fellow in the School of the Built andNatural Environment, Glasgow Caledonian University, Glasgow, UK.
PPP/PFIprocurement
125
Engineering, Construction and
Architectural Management
Vol. 12 No. 2, 2005
pp. 125-148
q Emerald Group Publishing Limited
0969-9988
DOI 10.1108/09699980510584485
8/7/2019 POS+NEF OF PFI
http://slidepdf.com/reader/full/posnef-of-pfi 2/24
IntroductionIn the UK, public/private partnerships (PPP), in the guise of the Private FinanceInitiative (PFI), have become an integral part of national government policy in thedelivery of public facilities and services (HM Treasury, 2000).
Despite the increasing use of PFI and other PPP schemes in the UK, there are stillaspects of PPP/PFI which are not clear to all of the participants. The Institute of PublicPolicy Research (IPPR) collected “evidence calling for Public Private Partnerships”across the UK in 2000 (Institute for Public Policy Research, 2000a). The aim of the IPPRsurvey was to produce a set of authoritative guidelines which would inform the use of such partnership arrangements in future public policy. A similar understanding isrequired for PPP/PFI construction projects. To this end, survey research has beencarried out which focuses particularly on the positive and negative factors that makethe adoption of PPP/PFI procurement more, or less, attractive to the public and privatesector parties involved in construction projects. The purpose of this paper is to reporton the findings of this survey.
General perceptions of PPP/PFIPublic and private sector response to PPP/PFI has so far been mixed in the UK andoverseas. Some participants actively welcome the policy (Allen, 1999; Middleton, 2000).Other reactions have been largely negative (Owen and Merna, 1997). Complimentaryreviews about PPP/PFI note the benefits it brings about in terms of its effect oneconomic development strategy. PPP/PFI procurement allows government and theprivate sector to learn from each other and create synergistic effects for both parties. Itis even claimed that PPP/PFIs will become a cornerstone of the current UK LabourGovernment’s modernisation programme, through the delivery of better quality publicservices, by bringing in new investment and improved management; and will provide amajor boost to the construction industry (HM Treasury, 2000).
Critics, on the other hand, suggest that PPP/PFI/PFI is a controversial andproblematic approach to capital development in the public sector (Ruane, 2000). In theUK, the trade unions, especially UNISON, have been trenchant critics of PPP/PFI andcall for re-nationalisation, particularly for UK rail transport systems.
These contrasting perceptions of the attractiveness of PPP/PFI (as a means of delivering public facilities and services) complicate the task of decision makersinvolved in preparing the business case for a PPP/PFI project. They can also influencepolicy development for public sector project procurement generally. While someaspects of PPP/PFI projects will clearly make them more attractive to one stakeholderthan to another, it should be possible to explore the concept of attractiveness at greaterdepth. This is done by first expounding the factors that may positively and negativelyinfluence the attractiveness of PPP/PFI projects, and then testing these against the
perceptions of project participants.
Positive PPP/PFI attractiveness factorsThe transfer of risk is a primary objective in PPP/PFI project procurement. The publicsector partner seeks to divest itself of the risks associated with the delivery andoperation of desired public facilities and services. Many of these risks relate to the time,cost and quality objectives of projects. Will the project be completed on time? Will it becompleted according to budget? Will it be fit for its intended purpose? While risk
ECAM12,2
126

8/7/2019 POS+NEF OF PFI
http://slidepdf.com/reader/full/posnef-of-pfi 3/24
transfer may be an obvious positive feature of PPP/PFI for the public sector, it is lessclear how private sector parties might also share this view. However, under currentguidelines in the UK, the public client provides explicit information about riskallocation to confirmed private sector bidders during the contract procurement process
for a project (national audit Office, 1999; National Health Service, 1999). Since this mustyield greater clarity about project risk, it is likely that the private sector would agreethat risk transfer is also a positive factor in its participation in PPP/PFI. The fact thatrisk and reward go hand in hand also suggests that private sector participants may beenthusiastic about securing opportunities to profit from the risk transfer that occurs.
Traditional public provision sector responsibility for the delivery of public facilitiesand services inevitably carries with it the image of a bottomless purse in action.Regardless of unforeseen increases in the capital costs of projects, or higher thanexpected ongoing service delivery and maintenance costs, it is expected that moneywill be available to resolve matters. PPP/PFI corrects this image, since it subjectscapital expenditure decisions to the ruthless scrutiny of private sector commercialpractice. Furthermore, the public sector partner is able to cap its final service costs atpre-determined levels through the concessional agreement made with its private sectorcounterpart (Tiong and Anderson, 2003).
In addition to gaining the capacity to cap final service costs, the public sector inPPP/PFI should be able to substantially reduce administration costs, since it will nolonger have day-to-day responsibility for service delivery. Instead, the public clienttakes on a less intensive role of monitoring the performance of the privateconcessionaire and receiving periodic reports (Bennett, 1998).
PPP/PFI reduces the amount of public money tied up in capital investment since itrelieves government of a substantial proportion of public debt. It also slowsunsustainable growth in the acquisition and maintenance of public assets that wouldotherwise occur at the expense of compromising the delivery of essential services
(Jones et al., 1996).Private sector involvement in public service provision means that the private
investment tackles the problem of bottlenecks in infrastructure demand and supply.Even in some wealthy European Union countries, for the purpose of ensuring that thegeneral government deficit is not more than 3 per cent of Gross Domestic Product(GDP) and gross public sector debt not more than 60 per cent of GDP, governments areforced to consider other sources of investment. The public liabilities involved in PFIprojects do not appear as public sector borrowing in annual financial reporting, in thesense that the loans are taken out by private sector companies. By contrast, whenpublic sector bodies borrow for investment purposes, the full value of the capital raisedcounts towards the public sector borrowing and other measures of government deficit.The “off balance sheet” accounting possibilities offered by PPP/PFI are therefore
attractive to financial administrators in the public sector. The exemption of PFItransactions from the public sector borrowing requirements isolates such schemesfrom centrally controlled budgetary allocations and the usual cash limits thataccompany public sector expenditure (Akintoye et al., 2001).
PPP/PFI procurement is seen as attractive to public and private sector participantsbecause it forces a project to service any financial debt from the revenue streamsderived from the project itself. There is no recourse to public funding, nor can the debtbe secured by the underlying asset value since for most projects ownership reverts to
PPP/PFIprocurement
127
8/7/2019 POS+NEF OF PFI
http://slidepdf.com/reader/full/posnef-of-pfi 4/24
the public client after a pre-determined period. The revenue streams may comprise feespaid directly to the concessionaire by users (e.g. toll road fees), or fees paid bygovernment on behalf of all potential users (e.g. fees per hospital patient serviced, orper school pupil accommodated). This non-recourse or limited recourse public funding
is an important ingredient of PPP/PFI procurement (Carrick, 2000; Akintoye et al.,2001).
It is thought that, since PPP/PFI approaches encourage private sector commercialefficiency to replace public sector bureaucratic inefficiency, it is reasonable to expectthat total project cost can be reduced (Hambros, 1999).
An attractive feature of PPP/PFI procurement method is that it offers both thepublic client and the private contractor more freedom to select innovative methods inthe provision of assets and services. This should lead to time saving by acceleratingproject development and by avoiding delays in project delivery (Downer and Porter,1992; Hall, 1998; Utt, 1999).
By taking over the responsibility for design, construction, operation andmaintenance, private contractors have to consider design suitability andconvenience for future construction and operation practice, by placing emphasis onimproving the buildability and maintainability of projects (Hambros, 1999).
With PPP/PFI procurement, the project scope is capable of expansion to reflect abroader context. This might permit the development of an integrated solution, such asbinding several small projects formerly dealt with under different departments (forexample: a school, library, and recreation centre) into a single project, thus achievingeconomies of scale (Utt, 1999; Government of Nova Scotia, 2000).
PPP/PFI is seen as attractive in terms of the potential benefits it may bring to localeconomic development in the region(s) where the facility is built or the services aredelivered. Local employment opportunities are enhanced, not only for the directconstruction and operational activities associated with the project, but also for
ancillary services and businesses established by entrepreneurs eager to exploit theopportunities created by its location (National Audit Office, 2001).Internationally, and particularly in developing countries, PPP/PFI is seen as
attractive in terms of its capacity to achieve the transfer of technological knowledge tolocal enterprises. Project procurement is arranged so that private sector partners withthe desired technological expertise from more developed nations are enticed into jointventure type agreements with local companies (Nielsen, 1997; Trim, 2001).
Negative PPP/PFI attractiveness factorsA lack of PPP/PFI experience and appropriate skills exists not only in the public sectorbut also in the private sector. Public project developments under the concept of PPP/PFI are quite new, especially in core public services areas such as schools and
hospitals. The concept of PPP is comparatively less well understood in countries with astrong public welfare policy; and even more so in terms of operational service delivery.Regulatory policy in this area may be very strict concerning public finance andexpenditure. In such countries, governments have less experience in alternative waysto finance their projects. The lack of understanding and the need for better training bypublic officials involved in PPP/PFI projects is a major issue identified by Morledgeand Owen (1998). The private sector also lacks appropriate skills in PPP/PFI projects(Ezulike et al., 1997). Financing, operating, maintaining and investing in a long-term
ECAM12,2
128
8/7/2019 POS+NEF OF PFI
http://slidepdf.com/reader/full/posnef-of-pfi 5/24
asset are not familiar activities to construction contractors. For example, a short whileafter the facility opened, the concessionnaire for a toll road project in Australiaexperienced a breach of security in its electronic tolling system for the credit cardaccount details of several thousand customers. The ensuing publicity reflected
adversely on the competence of the concessionnaire and its state government partner inthe BOOT project.
In the toll road project example noted above, the concession deed allows the privateoperator to increase tolls every six months by an amount based upon a capped limit tothe prevailing inflation rate. This substantially protects the operator’s real income, andfurther protection (by way of minimising any fall-off in traffic volumes for the toll road)was entrenched in the deed by removing clear-way restrictions on local roads in thevicinity. The removal of clearway restrictions on local roads increased the amount of parking on them, consequently slowing traffic and thus discouraging “rat-run”behaviour by motorists trying to find alternative routes to the toll-way. Additionally,adjoining local authorities were barred (by the state) from undertaking roadimprovements that could directly impact adversely on the toll road traffic volumes.Effectively, therefore, the revenue streams of the private concessionaire have beenprotected at the cost of greater traffic inefficiencies in adjoining areas. In this situation,the “user pays” principle has been partly subverted by a “non-user also pays” effect,although neighbouring localities have anecdotally reported lower overall trafficvolumes on local roads. Under a traditional wholly public sector procurementapproach, the project would probably have been undertaken on a toll-free basis with acombination of federal and state funding, and public borrowing, with loan repaymentsmade from general tax revenues. Even if tolls had been imposed in a public scheme, itis doubtful that they would have been allowed to escalate every six months.Effectively, therefore, the PPP arrangement in this case has resulted in higher directcharges to the users. However, this is clearly not a simple conclusion to be drawn in
every instance.At the present time there is no standard contract in the UK for PPP/PFI projects.
Procurement relies on HM Treasury’s Project Review Group criteria or National AuditOffice best practice guidance (National Audit Office, 1999), which require a great dealof work for an individual project operation. Most PPP/PFI projects cover not only thedesign and construction of the project, but also operation and concessionary ownershipover a long-term period. The complexity of project requirements results in highparticipation costs to interested private sector parties. Birnie (1999) discovered that thecost of tendering for PFI projects in the UK is considerably higher than for otherprocurement systems. Furthermore, there is no apparent reduction in participationcosts for a commensurate increase in the scale of the works. Other costs associatedwith PPP/PFI bids include the cost of assembling and setting up a consortium, and the
cost of investing equity in the corresponding business entity that is created (Ezulikeet al., 1997). Under current UK government guidelines, it is considered that the cost of developing a PPP/PFI project can be higher than that of an equivalent publicly fundedapproach (Saunders, 1998).
The above factors themselves give rise to others that negatively affect theattractiveness of PPP/PFI projects. Lack of critical experience, coupled with highparticipation costs, mean that participation to date in such schemes has been restrictedto relatively few private sector partners. Grimsey and Graham (1997) have noted
PPP/PFIprocurement
129

8/7/2019 POS+NEF OF PFI
http://slidepdf.com/reader/full/posnef-of-pfi 6/24
problems with complexity and affordability. Currently, it is likely that too manyscheme proposals are chasing too few private players (Public Services PrivatizationResearch Unit, 2000). The nature of PPP/PFI, with its emphasis on complex, large scalelong term projects and substantial elements of risk transfer, means that a mature and
sufficient private sector market has not yet been established, at least in the UK. Despitethe capacity to form project consortia, there are comparatively few private sectororganisations, with sufficient confidence in their own ability to make them successful,capable of taking on such projects. In turn, this restricted participation has resulted infewer schemes reaching the contract stage (Public Services Privatization ResearchUnit, 2000).
As yet there is little reliable evidence that a situation over-reliance on the privatesector is beginning to occur in the provision of public facilities and services. However,there must be a chance that the private sector partner in a project will fail, leaving thepublic client to pick up the pieces and maintain essential service delivery. In 2003, aninternational transport conglomerate, a concessionaire for privatised delivery of publicrail services in Victoria, Australia, walked away from its obligations at very shortnotice, leaving the state government to resume the public responsibility that, throughprivatisation policies, it had managed to divest itself from some six years previously.Despite substantial experience with PPP, it took over a year for the Government toform a new partnership with another private sector company that was alreadyoperating another section of the same rail system. The vaunted competitiveness of privatisation was thereby weakened.
A PPP/PFI project is normally proposed in order to achieve several objectives. Inthe UK, the Government uses the PFI and other types of PPP to complement additionalpublic sector investment and to ensure that genuine economic benefits are sharedbetween the public and private sectors. It is possible for conflicting objectives to ariseand cause confusion in terms of their assessment criteria for both private contractor
and public participants. Many advisors (specialists, lawyers, and financiers) areinvolved in the evaluation of PPP/PFI projects. The evaluation criteria are often verydiverse. Any confusion will affect the ability of all the parties to operate efficiently.
Although the contrary was suggested earlier as a positive factor, it has been arguedthat some PPP/PFI projects have had a higher project cost than comparable projectsdelivered under traditional procurement. The cost of a PFI/PPP/PFI project itself isclaimed to be generally higher than the comparable public sector facility provisionthrough traditional procurement (Ezulike et al., 1997; Birnie, 1999). High project costmight have been caused by the private sector adding a larger profit margin to coverunfamiliar risks, and such premiums may subside as experience is gained. PublicServices Privatization Research Unit (2000) claims that PFI costs more thanconventional procurement, since the private sector could not borrow capital to finance
projects as cheaply as the public sector. This suggests that private financeorganisations have taken a more pessimistic risk view. The Public ServicesPrivatization Research Unit (2000) also notes that escalating costs are common in PFIschemes, due to open-ended contracts. For example, the first large-scale hospitalcontract in Norfolk is said to be currently worth £193 million, compared to £90 millionat its start-up time.
Some PPP/PFI projects are the subject of lengthy political debate before they go totender, causing further delay in their execution. The London Underground PPP/PFI
ECAM12,2
130

8/7/2019 POS+NEF OF PFI
http://slidepdf.com/reader/full/posnef-of-pfi 7/24
project, where conflict arose between the London Lord Mayor and the centralgovernment, is an example (Infrastructure Journal, 2001a). UK Members of Parliament
joined forces to demand that the National Audit Office (NAO) took a fresh look at thePPP/PFI arrangement before contracts with private companies were signed. The
Liberal Democrat party urged the Parliamentary Public Accounts Committee to orderan NAO investigation. The NAO was mandated to decide whether PPP/PFI meets thekey value-for-money criteria over other means of funding, such as the public bondsscheme favoured by London Lord Mayor, Ken Livingstone, and Bob Kiley(Infrastructure Journal, 2001b). Political debate may also extend beyond the projecttender. In New South Wales, Australia, planning and decision making for a motorwayproject dragged on for nearly one and a half decades. When construction on the PPPproject finally commenced, the State Government was forced to deal with theenvironmental concerns of community groups that were being led and co-ordinated bya group whose advocacy for public transport alternatives continued to show up inanti-motorway messages and lobbies.
PPP/PFI imposes a new and more complex procurement process on the publicsector. It is part tendering and part contract negotiation among public bodies, privatesector consortia and their advisers. Ezulike et al. (1997) found that there is an extensiveamount of time used in contract transactions such as bidding for PPP/PFI projects,coupled with much negotiation time between the public sector client, its projectadvisers, and the private sector consortia and their advisors, over the terms andconditions of the contract.
Critics of PPP/PFI believe that it reduces project accountability (Infrastructure Journal, 2001b; Pollock and Vickers, 2001). In contrast with the transparentaccountability of virtually all public sector projects procured under traditionalprocurement arrangements in westernised democracies, information disclosure andreporting requirements for many PPP/PFI projects must at best be regarded as patchy.
As part of the contract agreements, a great deal of information is treated as“commercial-in-confidence”. Not only does this remove it from public scrutiny, it alsoprotects it from the exercise of disclosure powers under freedom of informationlegislation. Although the public and private partners in some projects proclaim their“openness” with extensive web-publication of information, in reality this more oftenthan not comprises truncated extracts of documents, with much of the sensitive detailexcised. Project accountability under traditional forms of public sector procurement isusually a straightforward application of public audit procedures carried out underadministrative terms of reference that have been established through democraticprocesses of legislation. It is possible for PPP/PFI procurement to avoid suchprocedures. Performance reporting for most PPP/PFI projects is limited to what hasbeen agreed beforehand between the parties. If reporting on particular matters (e.g.
evolving environmental issues, or emerging trends in use patterns) is not required bythe contract, it is difficult, if not impossible, for the public sector partner tosubsequently demand such information. In traditional public procurement no suchdifficulty arises.
Another contradiction with a positive factor proposed earlier is that PPP/PFI mayresult in fewer employment opportunities in the local area (Public servicesPrivatization Research Unit, 2000). The shift in responsibility for provision anddelivery of public facilities and services, from the public sector to the private sector,
PPP/PFIprocurement
131
8/7/2019 POS+NEF OF PFI
http://slidepdf.com/reader/full/posnef-of-pfi 8/24
does not automatically mean that all public sector staff previously employed dealingwith them will then take up opportunities to continue their work with the new privatesector partners. Economics does not work this way in practice. Any shrinkage in thesize of public bureaucracies is unlikely to be matched by parallel growth in private
sector employment opportunities. The former will occur far too slowly, while the latterwill be subject to the cost saving, efficiency and productivity expectations of theprivate sector.
SummaryThe positive and negative features that influence the attractiveness of PPP/PFI in thedelivery of public facilities and services are summarised below.
Positive factors include:
. Transfers risk to the private partner.
. Caps the final service costs.
.
Reduces public sector administration costs.. Reduces public money tied up in capital investment.
. Solves the problem of public sector budget restraint (Akintoye et al., 2001).
. Non-recourse or limited recourse public funding.
. Reduces the total project cost.
. Improves buildability.
. Accelerates project development.
. Saves time in delivering the project.
. Improves maintainability.
. Benefits local economic development (HM Treasury, 2000).
. Transfers technology to local enterprises.
. Facilitates creative and innovative approaches (Birnie, 1999; Government of Nova Scotia, 2000).
. Enhances government integrated solution capacity (Sohail, 2000).
Negative factors include:
. Few schemes reach the contract stage.
. Threatened by lack of experience and appropriate skills (Morledge and Owen,1998; Ezulike et al., 1997).
. Leads to higher direct charges to users.
. Imposes excessive restriction on participation.
. High participation costs are incurred (Ezulike et al., 1997; Saunders, 1998; Birnie,1999).
. High risk relying on private sector.
. Confusion can arise over government objectives and evaluation criteria.
. May lead to high project costs (Ezulike et al., 1997; Birnie, 1999; Public ServicesPrivatization Research Unit, 2000).
ECAM12,2
132
8/7/2019 POS+NEF OF PFI
http://slidepdf.com/reader/full/posnef-of-pfi 9/24
. Lengthy delays caused by political debate ( Infrastructure Journal , 2001a, b).
. Much management time is spent in contract transaction (Ezulike et al., 1997).
. Lengthy delays can arise in negotiation.
.
Reduces project accountability.. Offers fewer employment opportunities.
The issue to be explored is the relative importance of each of these factors in terms of the perceptions of participants in PPP/PFI construction projects. This issue wasinvestigated through opinion survey research carried out in the UK.
Research survey design and administrationA questionnaire survey was conducted in 2001. Survey targets were limited to theavailable information listing those with PFI experiences or expressed interests inPPP/PFI. The sampling technique used for data collection for this survey was aconvenience sample, rather than random sampling, because there is no comprehensive,
nor any standard, database of UK organisations involved in PPP/PFI projects. Inaddition, PPP/PFI procurement is evolving and, as a result of this, the number of organisations involved is growing, but not in a form whereby their population canreadily be determined. Random sampling demands that the organisations involved aresufficiently well distributed and the population is known (Diekhoff, 1992, Fellows andLiu, 1997). Neither of these conditions can be met in current PPP/PFI research.
The questionnaire was pilot tested to ensure that it was practical. The initial draftwas presented to the PFI research group at Glasgow Caledonian University. A furtherpilot study was administered to Carillion Services Ltd, which is active in PFI projects.
The final questionnaire comprises three parts. The first part seeks backgroundinformation about the respondents and their organisations. The second part deals withgeneral issues about PPP/PFI projects. The third part investigates risk and risk
management within PPP/PFI projects. This paper reports one of the special issues of Part Two – positive and negative factors influencing the attractiveness of PPP/PFI asa preferred procurement approach (see lists above for the variables included in thequestionnaire). Likert style rating questions, using a five-point scale, were used to elicitrespondents’ opinions of the importance of each nominated variable. The scaleintervals are interpreted as follows:
(1) Not important.
(2) Fairly important.
(3) Important.
(4) Very important.
(5) Extremely important.A zero option was also offered to filter any variable that respondents thought was notrelevant to the attractiveness of PPP/PFI, and zero scores were discarded in the dataanalysis.
A total of 500 questionnaires were sent out to establishments known to have hadinvolvement in PPP/PFI projects. A total of 61 completely filled questionnaires werereturned, comprising 16 public sector and 45 private sector respondents. The effectivereturn rate (12 per cent) was higher than that of earlier PPP survey research which
PPP/PFIprocurement
133

8/7/2019 POS+NEF OF PFI
http://slidepdf.com/reader/full/posnef-of-pfi 10/24
achieved a response rate of 9.6 per cent (Institute for Public Policy Research, 2000b),and is comparable with other survey research in construction and project management.The response was therefore deemed adequate for the purposes of data analysis.
Of note in the survey response demographics was the relatively high proportion of
central government involvement in PPP/PFI, compared with regional and lower levelpublic sector entities. This suggests that useful PPP/PFI learning/skills transfer couldbe offered by central government. The survey responses also revealed a substantialmulti-role involvement on the part of private sector organisations, with a commoncontractor role evident in all combinations. This suggests that a strong culture of rolediversity is now developing in the UK construction industry. All the respondents wereeither directors or managers in their respective organisations. Table I indicates theroles undertaken by the survey respondents in PPP projects. Table II shows thePFI/PPP project types reflected in respondents’ experience.
Project type Public sector ( n ) Per cent Private sector ( n ) Per cent
Hospital 1 4.3 29 18.2
Transportation 6 26.1 21 13.2Water and sanitary 1 4.3 9 5.7Power and energy 2 8.7 6 3.8IT and communication 4 17.4 2 1.3Housing and office 5 21.7 15 9.4Defence and military 0 0.0 18 11.3Police and prison 2 8.7 19 11.9School and education 1 4.3 34 21.4Others 1 4.3 6 3.8
Table II.PPP/PFI project typesreflected in surveyrespondents’ experience
Sector Role Frequency Percent
Public Central government 9 56.25Local government 4 25Government agency 2 12.5Public enterprise 1 6.25Subtotal 16 100
Private Financier 2 4.44Main contractor and designer 5 11.11Designer 3 6.67Constructor 2 4.44Consultant/advisor 16 35.55Operator 1 2.22Supplier 1 2.22Financier and main contractor and designer 3 6.67Financier, main contractor and operator 5 11.11Financier, main/subcontractor and operator 1 2.22Financier, constructor, consultant and operator 1 2.22Main contractor, consultant 1 2.22Main contractor and operator 3 6.67No indication 1 2.22Subtotal 45 100
Table I.Survey respondents’ rolesin PFI/ PPP Projects
ECAM12,2
134
8/7/2019 POS+NEF OF PFI
http://slidepdf.com/reader/full/posnef-of-pfi 11/24
Survey results Data consistencyReliability analysis was conducted to test the internal consistency of the surveyvariable data. Cronbach’s Alphas are 0.821 ( F -statistic ¼ 9.757, Sig: ¼ 0:000) for
“positive” factors, and 0.888 ( F -statistic ¼ 26.602) for “negative” factors. Both of themare much higher than the 0.70 of Nunnally’s (1978) guideline which suggests that, inthe early stages of research on predict tests or hypothesised measures of a construct,reliability of 0.70 or higher should suffice.
It should be noted that the data recorded respondents’ opinions about theimportance of each factor variable. The statistics thus reflect pooled subjective views.Although these are not objective measures, internal data validity is enhanced by thedemographics of the response sample, which show that the average constructionproject experience of the respondents is just over 21 years, and that more than 50 percent of them recorded over 20 years of experience.
For the most part, reporting of the data analysis, for both the descriptive statisticsand the rotated factor analysis, is based upon the total sample response. This is basedupon the view that the analysis could not be certain that respondents were consistentlyrecording opinions that represented only their side of the PPP/PFI picture; for example,that central government respondents were only reflecting the perceived attractivenessof PPP/PFI arrangements to the government. Where statistically significantdifferences were found between the public and private sector responses, theseresults are discussed separately.
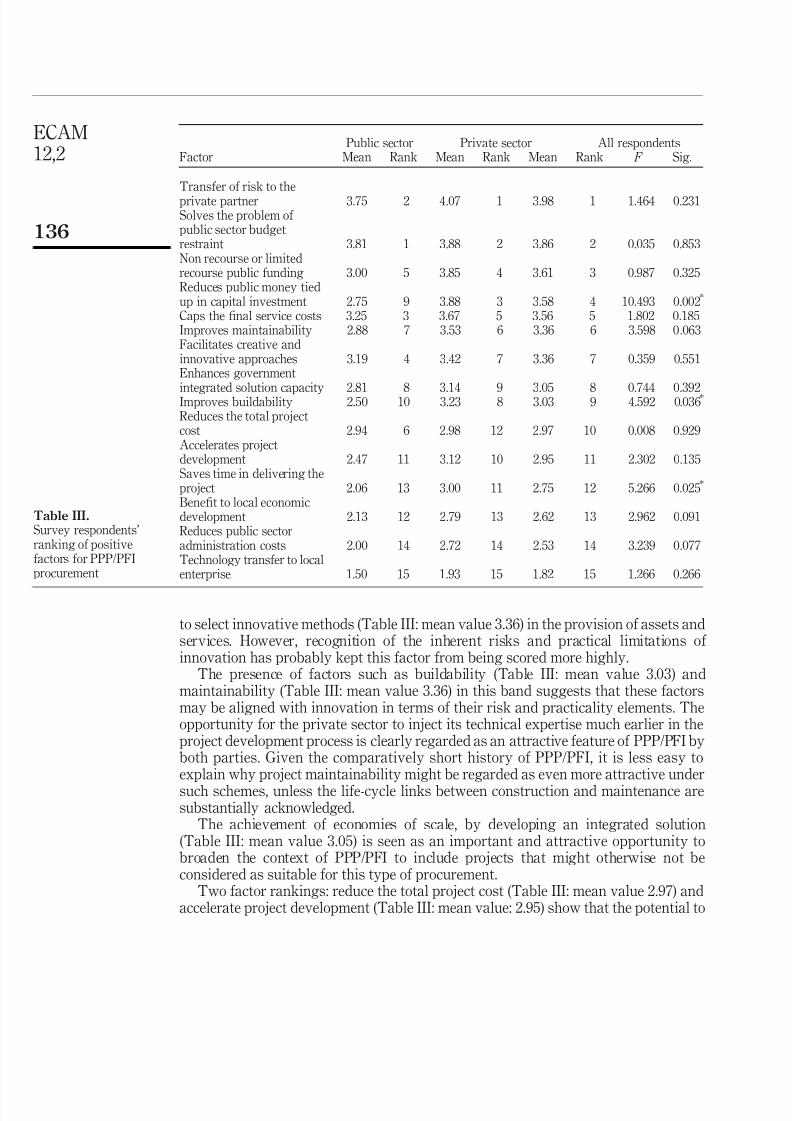
Ranking of positive attractiveness factors for adopting PPP/PFI project procurement The survey rankings of respondents’ opinions of the attractiveness factors of PPP/PFIare listed in Table III. For the 15 factors offered to respondents, the mean responserating values (for all respondents) range from 3.98 (risk transfer) down to 1.82
(technology transfer). No factor mean value scores fell into the “extremely important”( .4.50) and “not important” ( ,1.5) categories. This may be due more to naturalinclination on the part of respondents to avoid extremes of subjective opinion, than tothe categorical absence of any extremely important or unimportant factors. Theirscoring absence simply suggests that the five-point Likert scale was probablyattempting to measure differences in opinion that were too subtle at the extremes, anddose not invalidate the distinctions that were found.
Very important (mean score: 3.51-4.50). The transfer of risk to private sector(Table III: mean value 3.98) is the primary objective of the public sector in theintroduction of PPP/PFI for public project development. This result could thereforehave been anticipated from public sector survey respondents. The similar result fromprivate sector respondents is more difficult to explain, but may be due to the greater
clarity of risk allocation offered by PPP/PFI procurement.The problem of public sector budget restraint (Table III: mean value 3.86) besets
many municipal and other public sector authorities, especially in terms of improvingpublic infrastructure and delivering essential services. Clearly, the attractiveness of PPP/PFI in addressing this problem is fully recognised by both public and privatesector stakeholders.
Important (mean score: 2.51-3.50). An attractive feature of PPP/PFI procurementmethod is that it offers both the public client and the private contractor more freedom
PPP/PFIprocurement
135
8/7/2019 POS+NEF OF PFI
http://slidepdf.com/reader/full/posnef-of-pfi 12/24
to select innovative methods (Table III: mean value 3.36) in the provision of assets andservices. However, recognition of the inherent risks and practical limitations of innovation has probably kept this factor from being scored more highly.
The presence of factors such as buildability (Table III: mean value 3.03) andmaintainability (Table III: mean value 3.36) in this band suggests that these factorsmay be aligned with innovation in terms of their risk and practicality elements. Theopportunity for the private sector to inject its technical expertise much earlier in theproject development process is clearly regarded as an attractive feature of PPP/PFI byboth parties. Given the comparatively short history of PPP/PFI, it is less easy toexplain why project maintainability might be regarded as even more attractive under
such schemes, unless the life-cycle links between construction and maintenance aresubstantially acknowledged.
The achievement of economies of scale, by developing an integrated solution(Table III: mean value 3.05) is seen as an important and attractive opportunity tobroaden the context of PPP/PFI to include projects that might otherwise not beconsidered as suitable for this type of procurement.
Two factor rankings: reduce the total project cost (Table III: mean value 2.97) andaccelerate project development (Table III: mean value: 2.95) show that the potential to
Public sector Private sector All respondentsFactor Mean Rank Mean Rank Mean Rank F Sig.
Transfer of risk to the
private partner 3.75 2 4.07 1 3.98 1 1.464 0.231Solves the problem of public sector budgetrestraint 3.81 1 3.88 2 3.86 2 0.035 0.853Non recourse or limitedrecourse public funding 3.00 5 3.85 4 3.61 3 0.987 0.325Reduces public money tiedup in capital investment 2.75 9 3.88 3 3.58 4 10.493 0.002
*
Caps the final service costs 3.25 3 3.67 5 3.56 5 1.802 0.185Improves maintainability 2.88 7 3.53 6 3.36 6 3.598 0.063Facilitates creative andinnovative approaches 3.19 4 3.42 7 3.36 7 0.359 0.551Enhances government
integrated solution capacity 2.81 8 3.14 9 3.05 8 0.744 0.392Improves buildability 2.50 10 3.23 8 3.03 9 4.592 0.036*
Reduces the total projectcost 2.94 6 2.98 12 2.97 10 0.008 0.929Accelerates projectdevelopment 2.47 11 3.12 10 2.95 11 2.302 0.135Saves time in delivering theproject 2.06 13 3.00 11 2.75 12 5.266 0.025
*
Benefit to local economicdevelopment 2.13 12 2.79 13 2.62 13 2.962 0.091Reduces public sectoradministration costs 2.00 14 2.72 14 2.53 14 3.239 0.077Technology transfer to localenterprise 1.50 15 1.93 15 1.82 15 1.266 0.266
Table III.Survey respondents’ranking of positivefactors for PPP/PFIprocurement
ECAM12,2
136

8/7/2019 POS+NEF OF PFI
http://slidepdf.com/reader/full/posnef-of-pfi 13/24
deliver cheaper projects in shorter time is still regarded as an attractive possibility inPPP/PFI procurement, by both public and private sectors. This is despite the contraryresearch evidence noted earlier in this paper, and thus suggests that further researchinto the pre-operational performance of PPP/PFI schemes is essential.
The factor, benefit to local economic development (Table III: mean value 2.62), isdetermined by government policy and is rarely correlative to an individual project.Furthermore, accurate measurement of benefits achieved is difficult over most of thecriteria used to define economic development. Nevertheless, it appears that bothpartners in PPP/PFI are aware of the need for their projects to demonstrate tangibleeconomic benefits to the areas in which they are located.
Fairly important (mean score: 1.51-2.50). Only one factor, transfer of technology tolocal enterprises (Table III: mean value 1.82), appeared in this band. In a developedeconomy such as the UK, it might have been anticipated that this factor would havescored even less. However, the capacity of some types of projects to lift or change thelevels of technological expertise in local areas should not be overlooked, particularly inregions where high unemployment has resulted from the decline and obsolescence of older technologies.
Ranking of negative factors associated with PPP/PFI project procurement Rankings of the negative aspects associated with the attractiveness of PPP/PFIarrangements were produced from the survey data, with mean rating values (for allrespondents) ranging from 3.86 down to 1.71 (Table IV). Discussion on some of thesefollows here. No factor mean value scores fell into the “extremely important” ( .4.50)and “not important” ( ,1.50) bands.
Very important (mean score: 3.51-4.50). The time taken up with contracttransactions (Table IV: mean value 3.86) and negotiation time (Table IV: mean value
Public sector Private sector All respondentsFactor Mean Rank Mean Rank Mean Rank F Sig.
Much management time incontract transaction 3.94 1 3.83 1 3.86 1 0.133 0.716Lengthy delays in negotiation 3.38 2 3.79 2 3.68 2 1.534 0.221High participation costs 3.31 3 3.60 3 3.53 3 0.558 0.458Confusion over governmentobjectives and evaluation criteria 2.40 7 2.95 4 2.81 4 1.473 0.230Lack of experience and appropriateskills 2.69 4 2.81 5 2.78 5 0.082 0.776Lengthy delays caused by politicaldebate 2.20 9 2.58 6 2.48 6 0.737 0.394
High project costs 2.47 6 2.42 8 2.43 7 0.015 0.902Higher direct charges to users 2.53 5 2.26 9 2.33 8 0.414 0.523Excessive restriction onparticipation 1.80 12 2.50 7 2.32 9 2.241 0.140High risk relying on private sector 2.25 8 2.21 10 2.22 10 0.010 0.921Reduces project accountability 2.06 10 1.83 11 1.90 11 0.402 0.529Fewer employment positions 1.87 11 1.79 12 1.81 12 0.044 0.834Few schemes reach the contractstage 1.67 13 1.72 13 1.71 13 0.018 0.893
Table IV.Survey respondents’ranking of negative
factors associated withPPP/PFI procurement
PPP/PFIprocurement
137

8/7/2019 POS+NEF OF PFI
http://slidepdf.com/reader/full/posnef-of-pfi 14/24
3.68) was seen by respondents as very important in determining how attractive aPPP/PFI scheme might be to the parties.
The high participation cost factor (Table IV: mean value 3.53) was also consideredto be an unattractive feature of PPP/PFI schemes. These costs are not just incurred by
the private sector, since the complexity and size of most schemes, together with theprocedural requirements imposed by central government, mean that the public sectorpartner has to seek independent professional advice in the early stages.
Important (mean score: 2.51-3.50). The possibility that objectives are in conflict andcause confusion (Table IV: mean value 2.81) is recognised as real by PPP/PFIparticipants. The mean score for this factor, however, suggests that respondents do notthink it constitutes an insurmountable barrier to overcome in deciding whether or notto engage in a PPP/PFI project.
Survey respondents confirmed that a lack of PPP/PFI experience and appropriateskills (Table IV: mean value 2.78) would be an important factor in assessing theattractiveness of a PPP/PFI scheme. The comparatively short history of this form of
procurement in the UK probably contributes to this view, but it should be noted thatTable I suggests that maturity in multiple role responsibility is beginning to occur inthe private sector.
Fairly important (mean score: 1.51-2.50). The likelihood that a PPP/PFI project willbe the subject of lengthy political debate (Table IV: mean value 2.48) is clearlyunderstood by survey respondents. However, the mean score suggests that projectparticipants do not regard this as an unmanageable process.
Given the contradictory view that the possibility of reducing project costs is animportant factor in determining the attractiveness of PPP/PFI schemes (Table III:mean value 2.97), the weaker score attributed to a higher project cost (Table IV: meanvalue 2.43) suggests that respondents hold more optimistic views in this regard.
Disparity of opinions between the public and private sector Some difference of opinion could be expected between the public sector and the privatesector about the relative importance of factors that influence the attractiveness of PPP/PFI projects. However, of the 15 positive attractiveness factors, only three showedsignificantly different (at the 0.05 significance level) rankings by the public and privatesector survey respondents: reduce public money tied up in capital investment; improvebuildability; and save time in delivering the project. The mean rating values for privatesector survey respondents for these three factors are all higher than those of publicsector respondents. These factors are therefore considered more important PPP/PFIproject attractions by the private sector than by the public sector. Since design and
construction are bound together and are the responsibility of the private contractor, itis important for that party to actively seek ways of increasing productivity and savingconstruction time. Why the private sector should find the reduction in publicinvestment a more attractive feature than the public sector is not clear.
For the negative factors associated with the attractiveness of PPP/PFI, ANOVAanalysis of the survey results shows that none of the associated significance values islower than 0.05. This suggests that there is no statistical difference of opinion on thesefactors between the public and the private sector.
ECAM12,2
138

8/7/2019 POS+NEF OF PFI
http://slidepdf.com/reader/full/posnef-of-pfi 15/24
Factor analysis of attractiveness and negative factors for PPP/PFI projectprocurementFactor analysis is used to extract a smaller number of factor groupings to meaningfullyrepresent the relationships among a much larger set of variables (Norusis, 1992). The
survey response data was subjected to this technique to determine whether or notgroupings of the positive and negative factors in the perceptions of the attractivenessof PPP/PFI procurement could be established. If such groupings can be identified, theycould provide valuable guidance to the public sector in pursuing development of PPP/PFI policy, and to the private sector in the preparation of the business case forparticular projects. The findings of this analysis are presented here.
Positive attractiveness variablesA correlation matrix of the 15 positive attractiveness variables indicated that reducespublic money tied up in capital investment has least correlation with other variables,since its partial correlations are all less than 0.30. This variable should be removedbefore factor extraction (Norusis, 1992). The anti-image correlation matrix confirmedthis.
After eliminating the rogue variable, the correlation matrix was recalculated. Thevalue of the test statistic for sphericity is large (Bartlett test of sphericity ¼ 305:9318)and the associated significance level is small (Sig: ¼ 0:0000), suggesting that the otherfourteen variables are satisfied in terms of the principal component analysis. The KMOstatistic is 0.7875, which according to Kaiser (quoted in Norusis (1992)) is satisfactoryfor factor analysis. The next steps are factor extraction and rotation, which can obtainsmaller numbers of factors to represent the 14 variables.
Initial matrix and rotated matrix results are shown in Table V. The second, third andfourth columns comprise the initial matrix, and the three remaining columns (5, 6 and 7)are the rotated matrix, only presenting an Eigenvalue greater than 1.0. The total variance
explained by each factor is listed in the second column of Table V. The third column
Initial eigenvalues Rotation sums of squared loadings
Component TotalPer cent
of varianceCumulative
per cent TotalPer cent
of varianceCumulative
per cent
1 5.3511 38.2222 38.2222 3.4219 24.4419 24.44192 1.3687 9.7764 47.9985 2.5336 18.0973 42.53913 1.1383 8.1309 56.1294 1.4788 10.5626 53.10174 1.0518 7.5132 63.6426 1.4757 10.5408 63.64265 0.9625 6.8751 70.51776 0.8228 5.8771 76.39487 0.7876 5.6256 82.02048 0.6984 4.9887 87.00919 0.5229 3.7349 90.7440
10 0.4284 3.0601 93.804211 0.3121 2.2295 96.033712 0.2448 1.7487 97.782413 0.2087 1.4906 99.273014 0.1018 0.7270 100.0000
Note: Extraction method: principal component analysis
Table V.Initial and rotated factor
matrix of PPP/PFIattractiveness variables
PPP/PFIprocurement
139
8/7/2019 POS+NEF OF PFI
http://slidepdf.com/reader/full/posnef-of-pfi 16/24
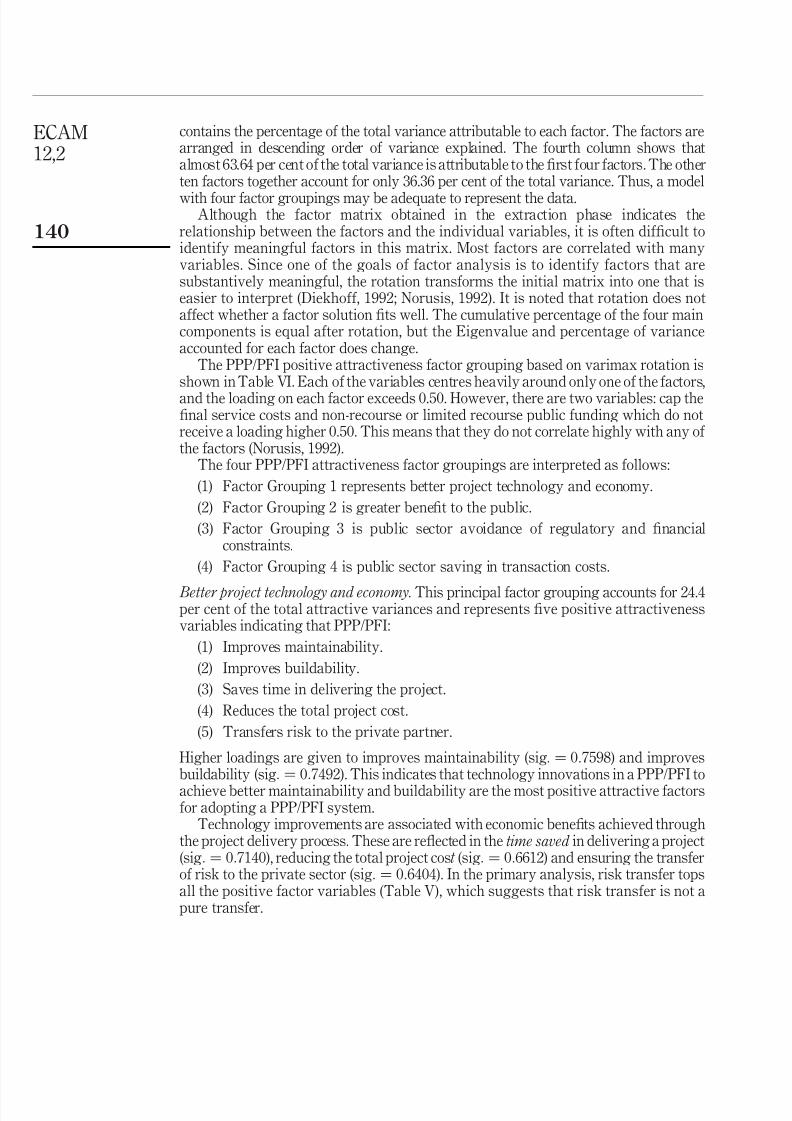
contains the percentage of the total variance attributable to each factor. The factors arearranged in descending order of variance explained. The fourth column shows thatalmost 63.64 per cent of the total variance is attributable to the first four factors. The otherten factors together account for only 36.36 per cent of the total variance. Thus, a model
with four factor groupings may be adequate to represent the data.Although the factor matrix obtained in the extraction phase indicates the
relationship between the factors and the individual variables, it is often difficult toidentify meaningful factors in this matrix. Most factors are correlated with manyvariables. Since one of the goals of factor analysis is to identify factors that aresubstantively meaningful, the rotation transforms the initial matrix into one that iseasier to interpret (Diekhoff, 1992; Norusis, 1992). It is noted that rotation does notaffect whether a factor solution fits well. The cumulative percentage of the four maincomponents is equal after rotation, but the Eigenvalue and percentage of varianceaccounted for each factor does change.
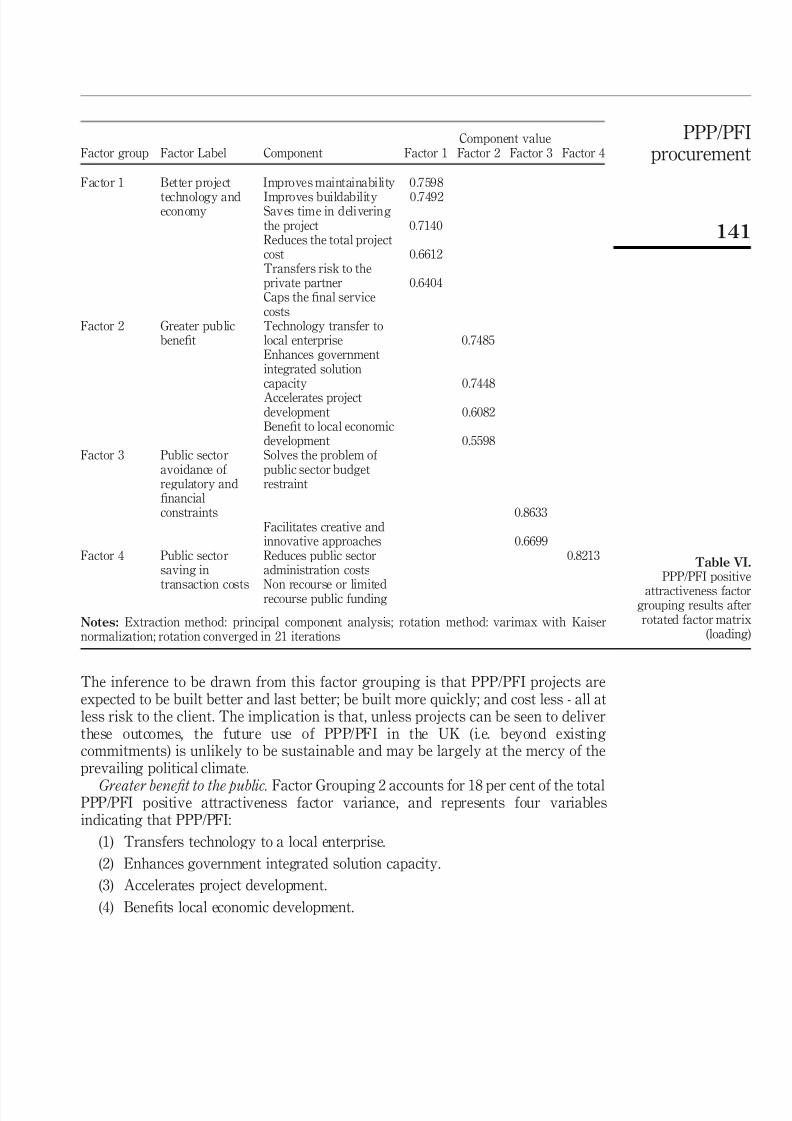
The PPP/PFI positive attractiveness factor grouping based on varimax rotation isshown in Table VI. Each of the variables centres heavily around only one of the factors,
and the loading on each factor exceeds 0.50. However, there are two variables: cap thefinal service costs and non-recourse or limited recourse public funding which do notreceive a loading higher 0.50. This means that they do not correlate highly with any of the factors (Norusis, 1992).
The four PPP/PFI attractiveness factor groupings are interpreted as follows:
(1) Factor Grouping 1 represents better project technology and economy.
(2) Factor Grouping 2 is greater benefit to the public.
(3) Factor Grouping 3 is public sector avoidance of regulatory and financialconstraints.
(4) Factor Grouping 4 is public sector saving in transaction costs.
Better project technology and economy. This principal factor grouping accounts for 24.4per cent of the total attractive variances and represents five positive attractivenessvariables indicating that PPP/PFI:
(1) Improves maintainability.
(2) Improves buildability.
(3) Saves time in delivering the project.
(4) Reduces the total project cost.
(5) Transfers risk to the private partner.
Higher loadings are given to improves maintainability (sig: ¼ 0:7598) and improvesbuildability (sig: ¼ 0:7492). This indicates that technology innovations in a PPP/PFI to
achieve better maintainability and buildability are the most positive attractive factorsfor adopting a PPP/PFI system.
Technology improvements are associated with economic benefits achieved throughthe project delivery process. These are reflected in the time saved in delivering a project(sig: ¼ 0:7140), reducing the total project cost (sig: ¼ 0:6612) and ensuring the transferof risk to the private sector (sig: ¼ 0:6404). In the primary analysis, risk transfer topsall the positive factor variables (Table V), which suggests that risk transfer is not apure transfer.
ECAM12,2
140
8/7/2019 POS+NEF OF PFI
http://slidepdf.com/reader/full/posnef-of-pfi 17/24
The inference to be drawn from this factor grouping is that PPP/PFI projects areexpected to be built better and last better; be built more quickly; and cost less - all atless risk to the client. The implication is that, unless projects can be seen to deliverthese outcomes, the future use of PPP/PFI in the UK (i.e. beyond existingcommitments) is unlikely to be sustainable and may be largely at the mercy of theprevailing political climate.
Greater benefit to the public. Factor Grouping 2 accounts for 18 per cent of the totalPPP/PFI positive attractiveness factor variance, and represents four variablesindicating that PPP/PFI:
(1) Transfers technology to a local enterprise.
(2) Enhances government integrated solution capacity.
(3) Accelerates project development.
(4) Benefits local economic development.
Component valueFactor group Factor Label Component Factor 1 Factor 2 Factor 3 Factor 4
Factor 1 Better project Improves maintainability 0.7598
technology and Improves buildability 0.7492economy Saves time in delivering
the project 0.7140Reduces the total projectcost 0.6612Transfers risk to theprivate partner 0.6404Caps the final servicecosts
Factor 2 Greater publicbenefit
Technology transfer tolocal enterprise 0.7485Enhances governmentintegrated solutioncapacity 0.7448Accelerates projectdevelopment 0.6082Benefit to local economicdevelopment 0.5598
Factor 3 Public sectoravoidance of regulatory andfinancialconstraints
Solves the problem of public sector budgetrestraint
0.8633Facilitates creative andinnovative approaches 0.6699
Factor 4 Public sectorsaving in
Reduces public sectoradministration costs
0.8213
transaction costs Non recourse or limitedrecourse public funding
Notes: Extraction method: principal component analysis; rotation method: varimax with Kaisernormalization; rotation converged in 21 iterations
Table VI.PPP/PFI positive
attractiveness factorgrouping results afterrotated factor matrix
(loading)
PPP/PFIprocurement
141
8/7/2019 POS+NEF OF PFI
http://slidepdf.com/reader/full/posnef-of-pfi 18/24
These components are all associated with the provision of benefit to the local society.Higher loadings are given to: transfers technology to a local enterprise (sig : ¼ 0:7485)and enhances government integrated solution capacity (sig: ¼ 0:7448). Technologytransfer is regarded as one of most important factors for adopting PPP/PFI methods in
developing countries, but is of less significance in developed countries such as the UK.However, it may be important in some industries, such as defence and IT (Trim, 2001)and, for some projects, local enterprises may be established to provide technicalmaintenance and technology development services.
Lower loadings are given to: accelerates project development (sig: ¼ 0:6082) andbenefits local economic development (sig: ¼ 0:5598).
The inference from this factor grouping is that visible technology development andtransfer is an important expectation of PPP/PFI. People want to see new technology atwork (but not failing!) and benefiting local economies. While economies of scale areseen as important in providing value for money, people do not want to see thisachieved through huge schemes whose development and completion time drags onsimply because of their size.
Public sector avoidance of regulatory and financial constraints. Factor Grouping 3accounts for 10.6 per cent of the total variance of positive attractiveness factorvariance, and represents two variables indicating that PPP/PFI:
(1) Solves the problem of public sector budget restraint.
(2) Facilitates creative and innovative approaches.
A higher loading is given to: solves the problem of public sector budget restraint(sig: ¼ 0:8633).
Another attractive aspect of PPP/PFI procurement is that it gives the public clientand private contractor opportunities for creative and innovative approaches to developthe project; this has a loading of 0.6699. A PPP/PFI arrangement could facilitate
creative and innovative approaches in the delivery of public services in two ways.First, a PPP/PFI procurement approach specifies desired outcomes rather than detaileddefinitions of inputs. This allows bidders to compete on the basis of their ability todevelop unique and creative approaches to the delivery of the required project (Birnie,1999; Government of Nova Scotia, 2000). Second, PPP/PFI procurement can join anon-profitable project and a profitable project as a single contract. For example, toattract private sector investment in sanitation, Sohail (2000) suggested that onefavoured solution was to combine sanitation and water supply together as a packagefor contractors.
One implication of this factor grouping is that “creative accounting” in thepublic sector may emerge as the most innovative element of PPP/PFI procurementin practice. After all, there is little incentive for the private sector to innovate,
given the associated risks that would be over and above those already transferredto this sector.
Public sector saving in transaction costs. There is only one positive attractivenessvariable in Factor Grouping 4: reduces public sector administration costs, with 10.6 percent of the total factor variance. It can be argued that the government could makesavings in project transaction costs by reducing public sector administration costs inthe processes of project tendering, preparation, and monitoring during implementation.However, there are contrary arguments which claim that the public sector thereby ends
ECAM12,2
142
8/7/2019 POS+NEF OF PFI
http://slidepdf.com/reader/full/posnef-of-pfi 19/24
up paying heavy fees to advisers and consultants in PPP/PFI (Public ServicesPrivatization Research Unit, 2000; Centre for Public Services, 2001). The inference hereis that benefits perceived in theory may not be deliverable in practice.
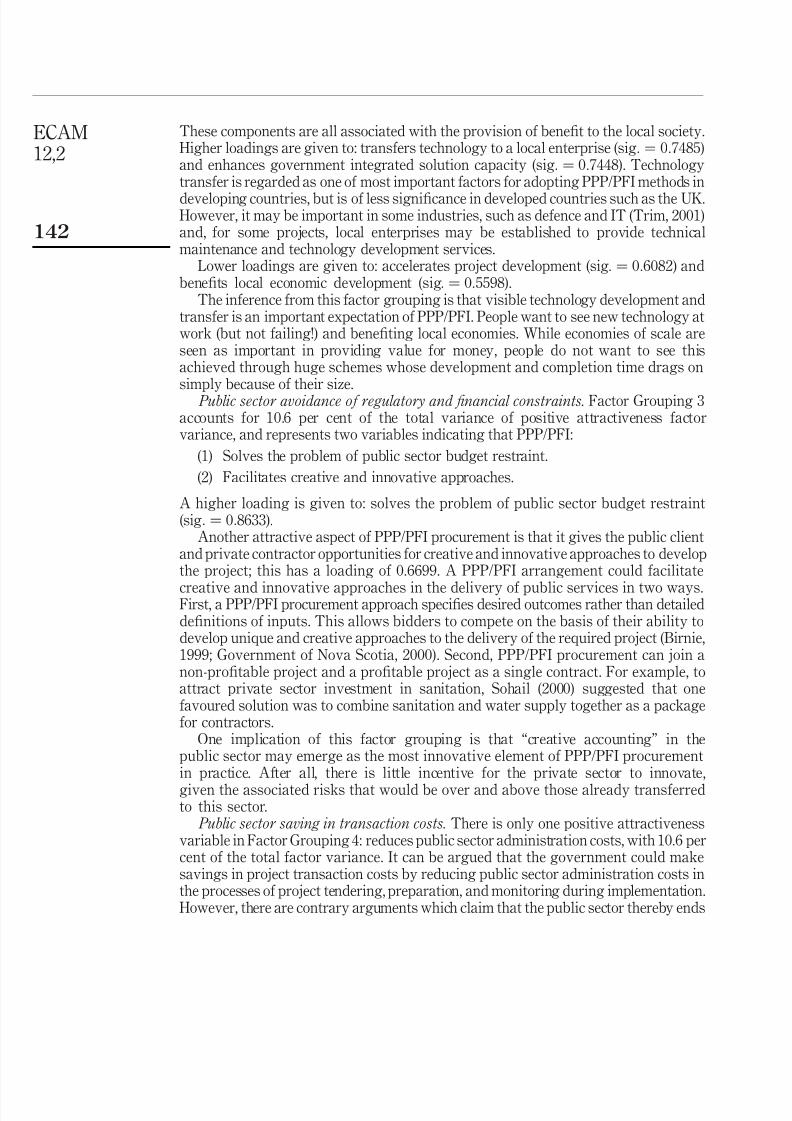
Negative attractiveness variablesFactor analysis has also been applied to the 13 negative factors that influence theattractiveness of PPP/PFI.
The correlation matrix for the 13 community variables indicated all variableshave a large correlation with at least one of the other variables in the set.
The value of the test statistics for sphericity is large (Barlett test of sphericity ¼
354.885) and the associated significance level is small ( p ¼ 0:000), suggesting that thepopulation correlation matrix is not an identity matrix. Observation of the correlationmatrix of the negative factors shows that they all have significant correlation at the 5per cent level, suggesting that there is no need to eliminate any of the variables for theprincipal component analysis. The KMO statistic is 0.835, which is satisfactory for
factor analysis. These tests show that factor analysis is appropriate for the factorextraction.
Table VII presents the results after extraction and rotation. Only three negativefactor groupings are obtained from the principal component analysis, with anEigenvalue greater than 1 and explaining 64.44 per cent of the total variance. Thefactor grouping based on varimax rotation is also shown in Table VII. Each of thevariables weighs heavily on only one of the factors, and the loading on each factorexceeds 0.50.
The three negative factor groupings can be interpreted as follows:
(1) Factor Grouping 1 represents the lack of experience with PPP/PFI.
(2) Factor Grouping 2 is the over-commercialisation of projects.
(3) Factor Grouping 3 represents high participation cost and time.
Thus, a model with three factor groupings may be adequate to represent the negativefactors for adopting PPP/PFI project procurement.
Lack of experience with PPP/PFI. This principal factor accounts for 22.1 per cent of the total variance negatively associated with the development of PPP/PFI projects. Itconsists of four components:
(1) Lack of experience and appropriate skills.
(2) Confusion over government objectives and evaluation criteria.
(3) Excessive restriction on participation.
(4) Higher charges to the direct users.
Higher loading is given to: lack of experience and appropriate skills (sig:
¼ 0:
8080).The importance of inexperience in a PPP/PFI approach is reflected in the fairly highloadings given to two other variables related to inexperience: confusion overgovernment objectives and evaluation criteria and excessive restriction onparticipation (loadings of 0.7915 and 0.7874 respectively). The inference here is thatthe public client needs to make requirements and specifications more precise and easierto master in future PPP/PFI projects. As greater experience with PPP/PFI procurementis achieved, the changing climate of PPP/PFI should result in more competition by
PPP/PFIprocurement
143

8/7/2019 POS+NEF OF PFI
http://slidepdf.com/reader/full/posnef-of-pfi 20/24
attracting more entrants to the market. The remaining component in this principalfactor is higher charges to the direct user, with a loading of 0.5319. This suggests thatthe public client must consider the project affordability more seriously.
Over-commercialisation of projects. This principal factor absorbs 21.7 per cent of thetotal loading variances, and includes six components:
(1) A reduced public sector employment position.
(2) A reduction in project accountability.
(3) The high risk of relying on the private contractor.
(4) Higher project costs.
(5) Lengthy delays caused by political debate.
(6) Few schemes reaching the contract implementation.For the purpose of generating profit from the PPP/PFI arrangement, the project isdeveloped under a commercialisation concept. This brings negative factors to theimplementation of PPP/PFI by the private sector. Higher loading is given to a reducedpublic sector employment position (sig: ¼ 0:7301). This indicates that employment isstill a major concern in UK society. Only by creating more jobs and reducing theunemployment rate would the development of a PPP/PFI approach gain better publicsupport.
Component valueFactorgrouping Factor Label Component
Factor1
Factor2
Factor3
Factor 1 Lack of experience Lack of experience and appropriateskills 0.8080Confusion over governmentobjectives and evaluation criteria 0.7915Excessive restriction onparticipation 0.7874Higher charges to the direct users 0.5319
Factor 2 Over-commercialisation Fewer employment positions 0.7301of projects Reduces project accountability 0.7289
High risk relying on private sector 0.6030Higher project values 0.5911Very few schemes have actuallyreached the contract stage 0.5700Lengthy delays caused by politicaldebate 0.5689
Factor 3 High participation cost High participation costs 0.9030and time Much management time in contract
transaction 0.8523Lengthy delays in negotiation 0.8029
Eigenvalue 2.879 2.825 2.674Cumulative percentage 22.15 43.88 64.44
Notes: Extraction method: principal component analysis; rotation method: varimax with Kaisernormalization; rotation converged in six iterations
Table VII.PPP/PFI negativeattractiveness factorsafter rotated factormatrix (loading)
ECAM12,2
144

8/7/2019 POS+NEF OF PFI
http://slidepdf.com/reader/full/posnef-of-pfi 21/24
The component reduction of project accountability has the next highest loading of 0.7289. This suggests that PPP/PFIs must avoid the situation where private profitmotives are seen as paramount, and accountability and responsibility for the publicend-users are neglected. The other four components under this principal factor
grouping are related to excessive commercialisation of public projects, and have amoderate impact on the adoption of PPP/PFI procurement.
High participation cost and time. The third principal factor grouping is responsiblefor 20.6 per cent of the total variance of PPP/PFI negative factors. It consists of threecomponents:
(1) High participation costs.
(2) A lot of management time spent in contract management.
(3) Lengthy delays in negotiation.
All three components are considered as having a significant negative impact onPPP/PFI arrangements, with significant loadings of 0.930, 0.8523 and 0.8029,
respectively.The component high participation costs refers to high tendering costs andadministration costs by the private contractors, and a high consultant fees spent by thepublic sector clients. The other two components reflect the fact that a PPP/PFI projectis associated with both the public client and the private contractor contributing moretime to monitoring project performance and extensive pre-contract negotiation.
ConclusionsThe relative importance of 15 PPP/PFI positive attractiveness factors was investigatedthrough an opinion survey conducted within the UK. The results, in descending orderof importance (for the top nine factors only), show that projects procured under
PPP/PFI arrangements exhibit positive attractiveness because of their ability to:. Transfer risk to the private sector.
. Solve the problem of public sector budget restraint.
. Non-recourse or limited recourse public funding.
. Reduce public money tied up in capital investment.
. Cap the final service costs.
. Improve maintainability.
. Facilitate creative and innovative approaches.
. Enhance government integrated solution capacity.
.
Improve buildability.
However, PPP/PFIs are not a panacea for all public projects. Among the 13 potentiallynegative factors, which might cause potential participants to reconsider theirinvolvement, the top three were:
(1) A great deal of management time in contract transaction.
(2) Lengthy delays in negotiation.
(3) High participation costs.
PPP/PFIprocurement
145
8/7/2019 POS+NEF OF PFI
http://slidepdf.com/reader/full/posnef-of-pfi 22/24
Factor analysis of the same survey data showed the 15 positive and 13 negativeattractiveness variables considered in the study can be grouped into four and threefactor groupings respectively.
The four most important positive attractiveness factor groupings are associated
with better project technology and economy, greater benefit to the public, public sectoravoidance of regulatory and financial constraints, and public saving in transactioncosts.
The three most important negative factor groupings are related to the inexperienceof the public and private sectors, the over-commercialisation of projects, and highparticipation cost and time for participants.
These factor groupings, representing the positive and negative characteristicsexhibited in PPP/PFI procurement, should be considered by public sector clients, andby potential private sector business case developers, in the process of selectingPPP/PFI options for construction projects.
References
Akintoye, A., Beck, M., Cliff, H., Chinyio, E. and Asenova, D. (2001), “The financial structure of private finance initiative projects”, Proceedings: 17th ARCOM Annual Conference,Salford , Vol. 1, pp. 361-369.
Allen, J. (1999), “Securing the future for Bovis”, Construction Management., Vol. 5 No. 4, pp. 22-5.
Bennett, E. (1998), “Public-private cooperation in the delivery of urban infrastructure services(water and waste)”, PPPUE Background Paper, UNDP/Yale Collaborative Programme,available at; www.undp.org/pppue/
Birnie, J. (1999), “Private Finance Initiative (PFI) – UK construction industry response”, Journal of Construction Procurement , Vol. 5 No. 1, pp. 5-14.
Carrick, M. (2000), Commercial Debt Raising for PFI Projects, Ernst & Young UK, CorporateFinance, London, available at: www.budget.news.co.uk/Template1.nsf/Homepages(accessed June).
Centre for Public Services (2001), Private Finance Initiative and Public Private Partnerships: What Future for Public Services? , Centre for Public Services, Sheffield, available at:www.centre.public.org.uk/briefings/pfi_and_ppp.html (accessed February 2002).
Diekhoff, G. (1992), Statistics for Social and Behavioural Sciences: Univariate, Bivariate, Multivariate, Wm.C.Brown Publishers, Dubuque, IA.
Downer, J.W. and Porter, J. (1992), “Tate’s Cairn Tunnel, Hong Kong: South East Asia’s LongestRoad Tunnel”, Proceedings: 16th Australian Road Research Board Conference, Part 7 ,Perth, pp. 153-165.
Ezulike, E.I., Perry, J.G. and Hawash, K. (1997), “The barriers to entry into the PFI market”,
Egineering, Construction and Architectural Management , Vol. 4 No. 3, pp. 179-93.Fellows, R. and Liu, A. (1997), Research Methods for Construction, Blackwell, Oxford.
Government of Nova Scotia (2000), Review of Public Private Partnership Processes, Governmentof Nova Scotia, Halifax, available at: www.gov.ns.ca/finance/index.htm (accessed August2001).
Grimsey, D. and Graham, R. (1997), “PFI in NHS”, Engineering, Construction and Architectural Management , Vol. 4 No. 3, pp. 215-31.
Hall, J. (1998), “Private opportunity, public benefit?”, Fiscal Studies, Vol. 19 No. 2, pp. 121-40.
ECAM12,2
146

8/7/2019 POS+NEF OF PFI
http://slidepdf.com/reader/full/posnef-of-pfi 23/24
Hambros, S.G. (1999), Public-Private Partnerships for Highways: Experience, Structure, Financing, Applicability and Comparative Assessment , Council of Deputy MinistersResponsible for Transportation and Highway Safety, Ottawa.
Treasury, H.M. (2000), Public Private Partnerships – The Government’s Approach, The Stationery
Office, London, available at: www.hm-treasury.gov.uk/docs/2000/ppp.html Infrastructure Journal (2001a), 4 May, available at: www.infrastructurejournal.com
Infrastructure Journal (2001b), 18 October, available at: www.infrastructurejournal.com
Institute for Public Policy Research (2000a), Summary of Responses to Call for Evidence – Consultation on Public Private Partnerships, Institute for Public Policy Research, London,available at: www.ippr.org.uk (accessed in December 2000).
Institute for Public Policy Research (2000b), Summary of Responses to Call for Evidence – Consultation on Public Private Partnerships, Institute for Public Policy Research, London,available at: www.ippr.org.uk (accessed in May 2001).
Jones, I., Zamani, H. and Reehal, R. (1996), Financing Models for New Transport Infrastructure,OPEC, Luxembourg.
Middleton, N. (2000), Public Private Partnerships – A Natural Successor to Privatisations? ,available at: www.pwcglobal.com/uk/eng/about/svcs/pfp/ppp.html (accessed October2000).
Morledge, R. and Owen, K. (1998), “Critical success factors in PFI projects”, Proceedings: 14th ARCOM Annual Conference, University of Reading, Reading , pp. 565-574.
National Audit Office (1999), Examining the Value for Money of Deals under the Private Finance Initiative, National Audit Office, London.
National Audit Office (2001), The Re-negotiation of the PFI-Type Deal for the Royal Armouries Museum in Leeds, National Audit Office, London.
National Health Service (1999), Public Private Partnerships in National Health Service: The Private Financial Service – Good Practice, The Stationery Office, London.
Nielsen, K.R. (1997), “Trends and evolving risks in design-build BOT and BOOT projects”, The International Construction Law Review, Vol. 14 No. 2, pp. 188-97.
Norusis, M.J. (1992), SPSS for Windows, Profession Statistics, Release, Vol. 5, SPSS Inc., Chicago,IL.
Nunnally, J.C. (1978), Psychometric Theory, 2nd ed., McGraw-Hill, New York, NY.
Owen, G. and Merna, A. (1997), “The Private Finance Initiative”, Engineering, Construction and Architectural Management , Vol. 4 No. 3, pp. 163-77.
Pollock, A. and Vickers, N. (2001), Private Pie in the Sky, Public Finance, available at:www.cipfa.org.uk/publicfinance (accessed December 2001).
Public Services Privatization Research Unit (2000), Private Finance Initiative: Dangers Realities Alternatives, UNISON, London.
Ruane, S. (2000), “Acquiescence and opposition: the private finance initiative in the NationalHealth Service”, Policy & Politics., Vol. 28 No. 3, pp. 411-24.
Saunders, A. (1998), “Aspects of funding for BOO projects”, Engineering, Construction and Architectural Management , Vol. 5 No. 1, pp. 22-30.
Sohail, M. (2000), PPP and the Poor in Water and Sanitation – Interim Finds , Engineering, andDevelopment Centre, Loughborough University, Loughborough.
Tiong, R. and Anderson, J.A. (2003), “Public-private partnership risk assessment andmanagement process: the Asian dimension”, in Akintoye, A., Beck, M. and Hardcastle, C.
PPP/PFIprocurement
147

8/7/2019 POS+NEF OF PFI
http://slidepdf.com/reader/full/posnef-of-pfi 24/24
(Eds), Public Private Partnerships: Managing Risk and Opportunities, Blackwell, Oxford,pp. 225-43.
Trim, P.R.J. (2001), “Public-Private partnerships and the defence industry”, European Business Review., Vol. 13 No. 4, pp. 227-33.
Utt, R.D. (1999), How Public-Private Partnerships Can Facilitate Public School Construction,available at: www.heritage.org/library/backgrounder/bg1257.htm (accessed August 2000).
Further reading
Akintoye, A., Beck, M., Hardcastle, C., Chinyio, E. and Asenova, D. (2001), Framework for Risk Assessment and Management of Private Finance Initiative Projects, available at:www.fst.gcal.ac.uk/bne (accessed October 2002).
Arthur Andersen and Enterprise LSE (2000), Value for Money Drivers in the Private Finance Initiative, Treasure Taskforce, London.
Merna, T. (1996), “Concession contracts, projects procured by privately financed concessioncontracts”, in Merna, A. and Smith, N.J. (Eds), Asia Law & Practice, Vol. Vol. 1, pp. 1-22.
O’Looney, J. (1992), “Public-private partnerships in economic development: negotiating thetrade-off between flexibility and accountability”, Economic Development Review., Vol. 10No. 4, pp. 14-22.
Private Finance Panel (1996), Private Finance Panel Risk and Award in PFI Contracts – Practical Guidance on the Sharing of Risk and Structuring of PFI Contracts, Private Finance Panel,London.
Reijniers, J.J.A.M. (1994), “Organisation of public-private partnership projects: the timelyprevention of pitfalls”, International Journal of Project Management , Vol. 12 No. 3,pp. 137-42.
Smith, D.J. (1997), “Strategic alliances in the aerospace industry: a case of Europe emerging orconverging?”, European Business Review, Vol. 9 No. 4, pp. 171-8.
United Nations (1995), “Comparative experiences with privatisation: policy insights and lessons
learned”, paper presented at the United Nations Conference on Trade and Development,United Nation, New York, NY.
ECAM12,2
148