
Position Report - FY17 Proposed Budget (Final W bus ent ...
178
Budget Document FY 2016 – 2017 (Includes Supplemental Schedules)
Transcript of Position Report - FY17 Proposed Budget (Final W bus ent ...

Budget
Document FY 2016 – 2017
(Includes Supplemental Schedules)

THE UNIVERSITY of TENNESSEE
University of Tennessee at Chattanooga
University of Tennessee, Knoxville University of Tennessee Space Institute
University of Tennessee at Martin
University of Tennessee Health Science Center
University of Tennessee Institute of Agriculture Agricultural Experiment Station
Extension College of Veterinary Medicine
University of Tennessee Institute for Public Service Institute for Public Service
Municipal Technical Advisory Service County Technical Assistance Service
University of Tennessee System Administration

THE UNIVERSITY OF TENNESSEE
Contents
MESSAGE FROM THE CFO A-2
OVERVIEW A-3
UNRESTRICTED E&G REVENUES A-4
UNRESTRICTED E&G EXPENDITURES A-8
AUXILIARY ENTERPRISES A-11
FY 2017 SALARY PLAN A-12
UNRESTRICTED NET ASSETS A-13
BOARD RESOLUTION A-14
SUPPORTING BUDGET SCHEDULES B-1
TUITION AND FEE SCHEDULES C-1
SUPPORTING SCHEDULES D-1

Message from the CFO
The FY 2017 proposed operating budget allocates available funding to the University’s current operations for the fiscal year beginning July 1, 2016 and ending June 30, 2017. It is the result of input from hundreds of dedicated faculty, staff, students and citizens involved in setting priorities for the University’s campuses, colleges, and institutes across the state of Tennessee. This will b e the second year of Dr. DiPietro’s program to achieve long-term financial sustainability. Each campus and institute is reallocating resources to reduce a future funding gap which was originally projected to exceed $377 million by FY 2024-25. Efforts include voluntary retirement incentives, eliminating low priority programs, administrative efficiencies, alternative revenue sources, and innovative student recruitment programs. As a res ult, tuition increases have been held to the rate of inflation for the second year in a row. The maintenance fee for in-state undergraduates will go up by only 2.2%, the lowest increase since 1984. We are grateful for the support of the Governor and General Assembly during this year’s appropriations process. The state’s budget includes funding t o recognize the strong productivity gains made by UT’s three “formula units” (Chattanooga, Knoxville, and Martin), evidence that UT’s strategies to improve student success and completion are making a difference. UT’s non-formula units received funds to help offset inflation, provide salary increas es, and expand programs. Newly funded programs include a UT Martin highe r education center in Somerville, property assessment consulting for counties by the Institute for Public Service, and a dairy specialist position in Extension.
UT will receive state funding for capital projects and capital maintenance. This includes $63.1 million for the UTC Academi c Classroom Building renovation and the Health Science Center Dentistry Faculty Practice/Research Building. The state will provide over $29.3 million for six capital maintenance projects. The legislative session was not without its challenges. The state moved away from its long-standing practice of providin g salary pool funding for higher education sim ilar to that budgeted for other state em ployees. Some UT units did not receive adeq uate funding for their proposed FY 2017 salary plans and will make budget reductions to offs et the shortfall. The Knoxville campus was forced to elim inate all funding for its Office of Diversity & Inclusion during FY 2017. This damages a vital component in an area of growing importance and represents an unprecedented intrusion into operational decisions normally entrusted to the administration and Board of Trustees. Continued advocacy efforts are planned to develop understanding and support around these issues. While state appropriations did not include full funding for salary increases, UT will use a combination of state funds, budget reallocations, and fee rev enues to fund a 3% salary increase pool. Each campus and institute has developed plans consistent with its long-term compensation strategy. Revenue and expenditure data for each operating unit are provided in this budget document. Also included are detailed schedules on tui tion and fees. A separate publication containing detailed supporting schedules is available in printed or electronic format. Respectfully,
James R. Maples Interim Treasurer & Chief Financial Officer
A-2
FY2017 PROPOSED BUDGET
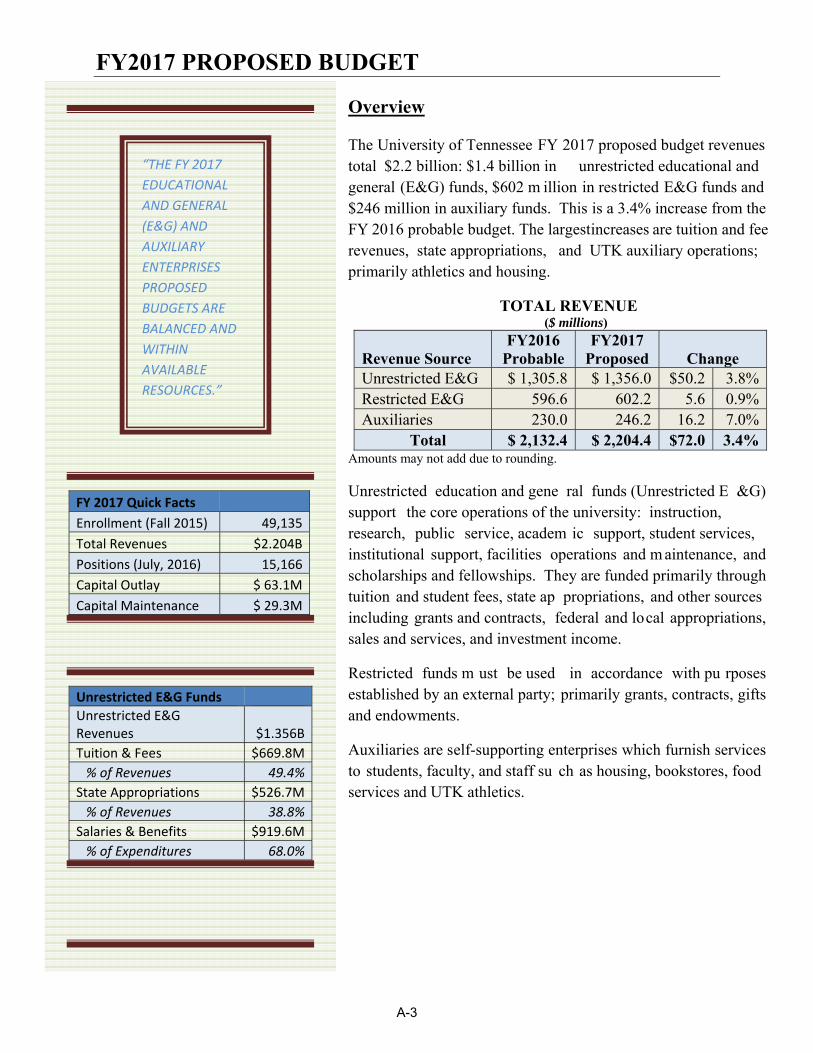
Overview The University of Tennessee FY 2017 proposed budget revenues total $2.2 billion: $1.4 billion in unrestricted educational and general (E&G) funds, $602 m illion in restricted E&G funds and $246 million in auxiliary funds. This is a 3.4% increase from the FY 2016 probable budget. The largest increases are tuition and fee revenues, state appropriations, and UTK auxiliary operations; primarily athletics and housing.
TOTAL REVENUE ($ millions)
Amounts may not add due to rounding.
Unrestricted education and gene ral funds (Unrestricted E &G) support the core operations of the university: instruction, research, public service, academ ic support, student services, institutional support, facilities operations and m aintenance, and scholarships and fellowships. They are funded primarily through tuition and student fees, state ap propriations, and other sources including grants and contracts, federal and local appropriations, sales and services, and investment income.
Restricted funds m ust be used in accordance with pu rposes established by an external party; primarily grants, contracts, gifts and endowments.
Auxiliaries are self-supporting enterprises which furnish services to students, faculty, and staff su ch as housing, bookstores, food services and UTK athletics.
Revenue Source FY2016
Probable FY2017
Proposed Change Unrestricted E&G $ 1,305.8 $ 1,356.0 $50.2 3.8%Restricted E&G 596.6 602.2 5.6 0.9%Auxiliaries 230.0 246.2 16.2 7.0%
Total $ 2,132.4 $ 2,204.4 $72.0 3.4%
FY 2017 Quick Facts
Enrollment (Fall 2015) 49,135
Total Revenues $2.204B
Positions (July, 2016) 15,166
Capital Outlay $ 63.1M
Capital Maintenance $ 29.3M
Unrestricted E&G Funds
Unrestricted E&G Revenues $1.356B
Tuition & Fees $669.8M
% of Revenues 49.4% State Appropriations $526.7M
% of Revenues 38.8% Salaries & Benefits $919.6M
% of Expenditures 68.0%
“THE FY 2017 EDUCATIONAL AND GENERAL (E&G) AND AUXILIARY ENTERPRISES PROPOSED BUDGETS ARE BALANCED AND WITHIN AVAILABLE RESOURCES.”
A-3

FY2017 PROPOSED BUDGET
Unrestricted E&G Revenues
Unrestricted E&G Revenue Summary
Revenue Source FY2016
Probable FY 2017 Proposed Change
Tuition & Fees $ 648,037,768 $ 669,787,108 $ 21,749,340 3.4%State Appropriations 498,639,749 526,665,549 28,025,800 5.6%Other Revenues 159,112,591 159,541,083 428,492 0.3% Total E&G Revenues $ 1,305,790,108 $ 1,355,993,740 $ 50,203,632 3.8%
Unrestricted E&G revenues are up $50.2 m illion with the largest increase com ing from state appropriations ($28.0 million) followed closely by tuition and fees ($21.7 million). This reverses a long-term trend of flat or declining state funding offset by large increases in tuition and fees. The small increase in other revenues is immaterial.
Unrestricted E&G Revenue History ($ millions)
Trends in state appropri ations and tuition and fees are critical to the core op erations of the university. Their percentage share of total unrestricted E&G revenues has increased slightly over recent years from a typical range of 85% to 86% over the past decade to 88.0% in FY 2017. Tuition and fee revenue increased its share of total funding dramatically from FY 2008 to FY 2012 as state appropriations dropped more than $125 m illion. An i mproving economy and commit ment to funding higher education on the part of state leaders halted this trend (state funding increased slightly from 38% in FY 2012 to 39% in FY 2017).
$504$534
$573$616
$648$670
$413$432
$467 $474$499
$527
$159$177
$162 $169 $159 $159
$0
$100
$200
$300
$400
$500
$600
$700
$800
2012 2013 2014 2015 2016 Probable 2017 Proposed
Tuition & Fees State Appropriations Other Revenue
A-4

FY2017 PROPOSED BUDGET
Tuition and Fee Revenues
Fee Type FY16
Probable FY17
Proposed Change Maintenance Fees $ 455,841,981 $ 476,738,769 $ 20,896,788 4.6 %Non-Resident Tuition 74,656,736 71,889,065 (2,767,671) (3.7) %Program and Service Fees 65,022,878 67,742,905 2,720,027 4.2 %Other Student Fees 44,979,773 45,776,587 796,814 1.8 %Extension Enrollment Fees 7,536,400 7,639,782 103,382 1.4 % Total Tuition and Fees $ 648,037,768 $ 669,787,108 $ 21,749,340 3.4 %
Tuition and fee budgets increase $21.7 million. These revenues will be used to fund $7.8 million in student financial aid ; $5.9 million to enhance student support services designed to improve retention and graduation rates; $4.8 million for new faculty lines, s tartups, and promotions; $1.8 million for staff salary adjustments; and the remainder to f acilities, equipment, and cam pus infrastructure. Nearly 48% ($10.5 million) of the new revenues are expected from increased enrollments, shifting enrollment patterns into programs with higher fee structures, and the final year of phasing in the Knoxville “15 for 4” program. The rest of the revenue growth will result from the proposed tuition and fee rate adjustm ents described in detail late r in this docum ent. The large decrease in non-resident tuition is a budget adjustm ent. It does not reflect expected d eclines in out-of-state enrollments. Actual non-resident revenues will increase in both FY 2016 and FY 2017, but not to the degree anticipated in the FY 2016 budget. Tuition and fees at UT campuses remain competitively priced relative to peer institutions. During the last year UT campuses were recognized as offering affordable access to quality education by publications such as Kiplinger’s Personal Fina nce, the Princeton Review, U.S. Ne ws & World Report, CampusDecision.com, and BestColleges.com. The primary source of tuition and fee revenues are maintenance fees, commonly referred to as in-state tuition. This can c ause some confusion since the maintenance fee is paid by all students, including out-of-state students. Non-resident tuition is a di fferential paid on ly by out-of-state students. The term “out-of-state tuition” is actually the maintenance fee plus non-resident tuition. Program and serv ice fees are m andatory fees paid by all students and in clude fees for student activities, health services, debt service, capital im provements, student counseling, and other programs. Extension enrollm ent fees are for non-credit personal and professional developm ent courses. E xamples of other st udent fees include t echnology fees, fac ilities fees, library fees, differential fees, lab fees, and course fees.
A-5

FY2017 PROPOSED BUDGET
Unrestricted State Appropriations
Adjustments Recurring Non-
Recurring Total FY 2016 Probable Budget $ 496,679,111 $ 1,960,638 $ 498,639,749 Funding Formula Productivity 14,920,300 14,920,300Non-Formula Unit 3.25% Increase 7,620,900 7,620,900Health Insurance Premium Increases 4,056,600 4,056,600UT Martin Somerville Center 250,000 875,000 1,125,000IPS County Property Assessor Services 300,000 300,000Extension Dairy Specialist Position 175,000 175,000Reclassify 401k Match Funding 743,938 (743,938) -Adjust Global Claims Premium Funding (172,000) (172,000) Total Change 28,066,738 (40,938) 28,025,800FY 2017 Proposed Budget $ 524,745,849 $ 1,919,700 $ 526,665,549
Unrestricted state appropriations increase $28 million. Most of the increase comes from outcome productivity improvements at UT’s three formula units (Chattanooga, Knoxville, and Martin) and a 3.25% increase for UT’s non-formula units (Health Science Center, Agriculture, Public Service, Space Institute, and System Administration). While this is a welcome increase, it represents a move away from the state’s long-standing practice of providing a separate salary pool for higher education. Some units will supplement their state funds with fee revenues and budget reductions to provide 3% salary pools in FY 2017. The state is providing funds for new programs in three units. Martin will receive $875,000 in one-time funds and $250,000 recurring to open and operate a new higher education center in Somerville. The center will complement Martin’s existing extended campus locations in Jackson, Parsons, Ripley, and Selmer. The Institute for Public Service has $300,000 to add two property assessor consultants to assist counties statewide. New funding of $175,000 will enable Extension to add a dairy specialist. The remaining changes include $4.1 million to offset the employer share of premium increases in the state’s health insurance program and two minor adjustments. UT will also receive appropriations of $18.7 million that are restricted to specific programs and not included above. These are down slightly from FY 2016 ($143,807). These include funding for UT’s Centers of Excellence, Governor’s Chairs, the Health Science Center Mouse Genome Project, and the third year matching funds for the Health Science Center’s pediatric physicians partnership with St. Jude’s (year four of a five year program).
A-6
FY2017 PROPOSED BUDGET
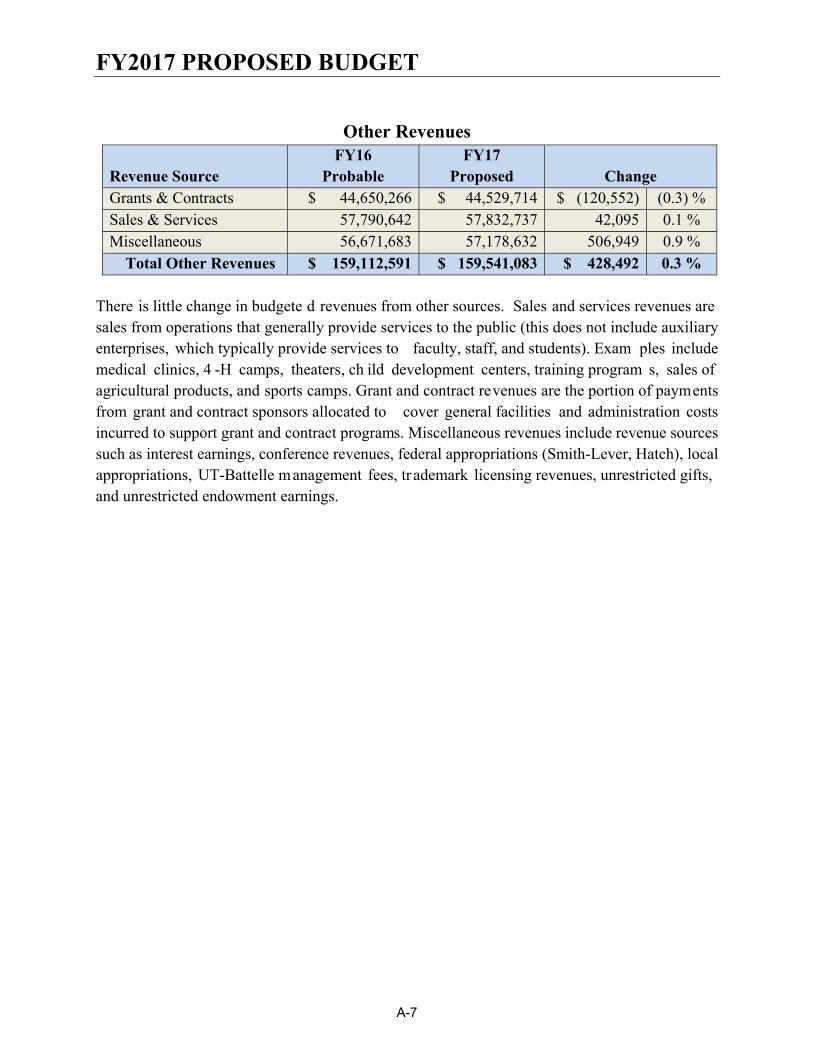
Other Revenues
Revenue Source FY16
Probable FY17
Proposed Change Grants & Contracts $ 44,650,266 $ 44,529,714 $ (120,552) (0.3) % Sales & Services 57,790,642 57,832,737 42,095 0.1 % Miscellaneous 56,671,683 57,178,632 506,949 0.9 % Total Other Revenues $ 159,112,591 $ 159,541,083 $ 428,492 0.3 %
There is little change in budgete d revenues from other sources. Sales and services revenues are sales from operations that generally provide services to the public (this does not include auxiliary enterprises, which typically provide services to faculty, staff, and students). Exam ples include medical clinics, 4 -H camps, theaters, ch ild development centers, training program s, sales of agricultural products, and sports camps. Grant and contract revenues are the portion of payments from grant and contract sponsors allocated to cover general facilities and administration costs incurred to support grant and contract programs. Miscellaneous revenues include revenue sources such as interest earnings, conference revenues, federal appropriations (Smith-Lever, Hatch), local appropriations, UT-Battelle management fees, tr ademark licensing revenues, unrestricted gifts, and unrestricted endowment earnings.
A-7

FY2017 PROPOSED BUDGET
Unrestricted E&G Expenditures
Unrestricted E&G Expenditures by Function ($ millions)
Unrestricted E&G expenditures are budgeted at $1.35 million among the eight functional areas shown in the chart above. Instruction accounts for the lion’s share. Unrestricted E&G budgets for research do not include funds from restricted grants, contracts, gifts, and endowments. Institutional Support and Operation & Maintenance of Physi cal Plant support all operations, including those funded through restricted and auxiliary funds.
Unrestricted E&G Expenditures by Natural Classification
($ millions)
Over five years, each major expense category has grown gradually. Faculty and staff salaries and benefits typically account for around 70% of all expenditures.
$0
$200
$400
$600
$800
2013 2014 2015 2016 Probable 2017 ProposedSalaries Benefits Operating & Equip.
53%
18% 29%
54%
18% 28%
53%
18% 29%
48%
16%
36%
51%
17%
32%
Inst
ruct
ion
Res
earc
h
Publ
ic S
ervi
ce
Aca
dem
ic S
uppo
rt
Stud
ent S
ervi
ces
Inst
itutio
nal S
uppo
rt
Ope
r./M
aint
enan
ce
Scho
lars
hips
/Fel
low
.
$0
$100
$200
$300
$400
$500
$600
5% 6%11%
7% 11% 10% 8%
42%
A-8

FY2017 PROPOSED BUDGET
Unrestricted E&G Expenditures by Functional Category
The declines in budgeted expenditures are m isleading. The FY 2016 Probable Budget includes non-recurring funds that were a dded to the budget m id-year after actual enrollm ents and the amount of funds carried over from FY 2015 were known. The current year non-recurring budgets were allocated to one-time projects such as facility maintenance, equipment replacements, faculty start-up packages, bridge funding for research operations, lab upgrades, faculty incentives, campus improvements, energy conservation projects, and information technology infrastructure. Unused non-recurring funds will be carried forward to FY 2017 for use on similar non-recurring projects and reflected in the FY 2017 Revised Budget that will be presented to the Board at its spring 2017 meeting. An analysis of recurring expenditure budgets follows. It is a better reflection of plans and priorities for core operations in FY 2017.
Functional Category FY 2016 Probable
FY 2017 Proposed Change
Instruction $ 577,040,051 $ 570,871,393 $ (6,168,658) (1.1) %Research 110,072,752 75,583,021 (36,489,731) (33.2) %Public Service 87,106,681 80,557,849 (6,548,832) (7.5) %Academic Support 158,704,326 146,819,933 (11,884,393) (7.5) %Student Services 88,425,977 88,080,549 (345,428) (0.4) %Institutional Support 150,393,384 147,368,765 (3,024,619) (2.0) %Operation & Maint.of Plant 135,781,740 139,190,009 3,408,269 2.5 %Scholarships and Fellowships 95,154,298 106,011,157 10,856,859 11.4 % Total E&G Expenditures $ 1,402,679,209 $1,352,482,676 $ (50,196,533) (3.6) %Transfers $ (54,413,232) $ 4,284,278 $ 58,697,510 107.9% Expenditures & Transfers $ 1,348,265,977 $1,356,766,954 $ 8,500,977 0.6 %
A-9

FY2017 PROPOSED BUDGET
Recurring Unrestricted E&G Expenditures The tables below show only funds for recurring operations and exclude non-recurring budgets allocated to one-time projects in FY 2016. Recurring expenditure budgets are up $56.7 million (4.4%). Around 43% of this is f or the FY 20 17 salary plan des cribed on page A-12. The largest dollar increases are in Instruction, Scholarships & Fellowships, and Institutional Support. The second table below shows salaries and benefits up 3.7% compared to 5.9% for operating and equipment.
Recurring Expenditures by Functional Category
Recurring Expenditures by Natural Classification
Functional Area FY 2016 Probable
FY 2017 Proposed Change
Instruction $ 546,460,554 $ 569,841,853 $ 23,381,299 4.3 %Research 72,397,862 76,291,414 3,893,552 5.4 %Public Service 75,356,624 78,571,479 3,214,855 4.3 %Academic Support 142,166,916 146,813,333 4,646,417 3.3 %Student Services 85,408,534 88,080,549 2,672,015 3.1 %Institutional Support 140,730,944 147,793,865 7,062,921 5.0 %Operation & Maint.of Plant 134,407,136 139,190,009 4,782,873 3.6 %Scholarships and Fellowships 97,936,473 104,974,557 7,038,084 7.2 %Total E&G Expenditures $ 1,294,865,043 $ 1,351,557,059 $ 56,692,016 4.4 %Transfers 3,091,473 1,220,085 (1,871,388) (60.5) %Expenditures & Transfers $ 1,297,956,516 $ 1,352,777,144 $ 54,820,628 4.2 %
Natural Classification FY 2016 Probable
FY 2017 Proposed Change
Academic Salaries $ 342,512,326 $ 350,829,201 $ 8,316,875 2.4 %Non-Academic Salaries 315,701,877 330,642,529 14,940,652 4.7 %Student Employees 8,564,749 8,646,387 81,638 1.0 %Total Salaries $ 666,778,952 $ 690,118,117 $ 23,339,165 3.5 %Staff Benefits 219,788,911 229,220,605 9,431,694 4.3 %Total Salaries & Benefits $ 886,567,863 $ 919,338,722 $ 32,770,859 3.7 %Operating & Equipment 408,297,180 432,218,337 23,921,157 5.9 %Total Expenditures $ 1,294,865,043 $1,351,557,059 $ 56,692,016 4.4 %
A-10

FY2017 PROPOSED BUDGET
Auxiliary Enterprises Auxiliary enterprises furnish services to students, faculty, and staff. Each auxiliary enterprise is self-funded through sales, fees, and private gifts. Th ese stand-alone operations include housing, food services, bookstores, parking, and other m iscellaneous operations. It also includes UTK athletics since it is a self-supporting operation. (The athletic programs at Chattanooga and Martin are included in unrestricted E&G funds.)
Auxiliary Revenues by Enterprise ($ millions)
Revenues are up $16.2 m illion (7.0%) due to s ignificant increases in Knoxville: athletics $9.7 million (8.2%); housing $4.2 million (9.6%); food service $1.6 million (30.9%); and the VolShop $1.0 million (4.3%). Growth in athletics is driven by success in football and will fund debt service, game guarantee payouts, and replenish reserves. New housing revenue from the availability and mix of rooms and rate increases will offset growing occupancy costs and debt service. Food service commissions will fund new dining locations, including the new Student Union. VolShop revenues are up due to having full year of Nike inventory. In addition to the uses discussed above, these revenues will fund a 3% salary pool for auxiliary employees and cover operating inflation.
Auxiliary Fund Summary
Revenues, Expenditures, and Transfers
FY 2016 Probable
FY 2017 Proposed Change
Revenues $ 229,780,481 $ 245,962,927 $ 16,182,446 7.0 %
Expenditures 178,595,830 184,698,151 6,102,321 3.4 %
Transfers 51,184,651 61,264,776 10,080,125 19.7%
Total Expenditures and Transfers $ 229,780,481 $ 245,962,927 $ 16,182,446 7.0 %
$128.8
$65.6
$25.1 $13.7$8.7 $4.1
$0$20$40$60$80
$100$120$140
Athletics Housing Bookstores Parking Food Services Other
A-11

FY2017 PROPOSED BUDGET
FY 2017 Salary Plan
The university proposes a 3% pool for general salary increases in FY 2017. State appropriations did not include a separate pool for salary increases, but will be used to provide partial funding. These appropriations plus funds from other sources will enable UT to reward exceptional performance and move overall compensation closer t o market levels. Eac h campus and institute has developed salary plans consistent with its long-term compensation strategy. These strategies continue to evolve as UT’s Compensation Advisory Board works to guide UT’s compensation philosophy, structure, and programs.
FY 2017 Campus/Institute Salary Plans
Campus/Institute
Salary Plan
UT Chattanooga 3.0% across-the-board
UT Knoxville/UTSI 3.0% market/merit
UT Martin 2.0% across-the-board; 1.0% market & 1.0% non-recurring bonus contingent on achieving enrollment targets
UT Health Science Center 3.0% across-the-board
UT Institute of Agriculture 1.5% across-the-board; 1.5% market/merit
UT Institute for Public Service
2.0% across-the-board; 1.0% market/merit
UT System Administration 1.0% across-the-board; 2.0% market/merit
The total cost of the salary plan is $32.1 million. It adds $24.2 million to unrestricted E&G salary and benefits expenses. Restricted E&G salary and benefits increases paid through grants, contracts, gifts and endowments will be $6.0 million. Auxiliary enterprises will spend $1.9 million and recover the expense through their self-funded business models. Around 45% of the funding will come from appropriations. The remainder will be funded by student fees, auxiliary revenues, grants and contracts, gifts and endowments, and budget reallocations.
A-12

FY2017 PROPOSED BUDGET
Unrestricted Net Assets The University’s practice is to m aintain 2-5 percen t of unrestricted educational and general (E&G) e xpenditures and 3-5 percent of unrestricted auxiliary enterprise funds in its unallocated fund balance as a “rainy day” fund. It is needed in case of a downturn in enrollment, sharp decline in appropriations, or other situations that cause expenditures to exceed available revenues to pr ovide short-term funding while adjustments are made to bring the budget back into balance. Encumbrances are funds car ried over from the previous fiscal year for
purchases and commitments that were not received before the close of the fiscal year. These funds are budgeted in the appr opriate expenditure accounts as the item s or services are received. Reappropriations are funds reserved fro m FY 2016 for a llocation to specific program s and initiatives in FY 2017 or in subsequent fiscal years. The FY 2017 proposed budget projects a June 30, 2017 unrestricted E&G unallocated fund balance of $44.2 million, or 3.25% of expenditures and transfers. The unrestricted auxiliary enterprises unallocated balance is $11.4 m illion, 4.63% of expenditures and transfers. The total unallocated balance projected for June 30, 2017 is $55.6 million, which is 3.47% of expenditures and transfers.
$0.0
$10.0
$20.0
$30.0
$40.0
$50.0
$60.0
E&G Auxiliaries Total
$44.2
$11.4
$55.6
$22.9
$13.8
$36.7
$17.9
$1.9
$19.8$15.8
$0
$15.8
$3.0 $3.0
Unallocated
Working Capital
Revolving Funds
Reappropriations
Encumbrances
FY 2017 Proposed Budget Unrestricted Net Assets ($ millions)
$46.4 million 3.25%
$11.4 million 4.63%
$55.6 million 3.47%
Unallocated Balance % of Expenditures & Transfers
A-13

FY2017 PROPOSED BUDGET
RESOLUTION OF THE UNIVERSITY OF TENNESSEE
BOARD OF TRUSTEES June 23, 2016
Proposed 2017 Operating Budget, Student Tuition and Fees, and Compensation
Guidelines for Additional Salary Increases During the Fiscal Year
WHEREAS, the Bylaws require the Board of Trustees to approve an annual operating budget for the University; and
WHEREAS, the proposed FY 2017 Educational and General (E&G) budget is balanced and within available resources, as is the budget for Auxiliary Enterprises; and
WHEREAS, the proposed budget complies with all applicable policies and guidelines; and
WHEREAS, the administration needs to be able to respond quickly and effectively to a significant budget shortfall due to a state impoundment of funds or appropriation rescission; and
WHEREAS, mandatory furloughs without pay, reduction of time worked, across-the- board salary reductions, and similar salary-related measures may be required to address budget reductions or a budgetary shortfall; and
WHEREAS, the Bylaws further require the Board of Trustees to approve student tuition and fees;
NOW THEREFORE BE IT RESOLVED that:
1. The FY 2017 proposed operating budget is approved with the understanding that
if the General Assembly or the Department of Finance and Administration further alters the FY 2017 appropriations or if changes in estimated resources require, the budget shall be modified accordingly so expenditures will not exceed available resources.
A-14

FY2017 PROPOSED BUDGET
2. The Board of Trustees expressly authorizes the campus, institute and unit
administrations, in response to budget reductions or a budgetary shortfall, to implement mandatory furloughs without pay, reduction of time worked, across- the-board salary reductions, and similar salary-related measures during FY 2017, subject to approval by the Executive and Compensation Committee, the President, and the Treasurer and Chief Financial Officer in consultation with the General Counsel and Human Resources.
3. The proposed tuition and fee schedules are adopted for FY 2016-17.
4. The proposed FY 2017 salary and wage compensation plan and the FY 2017
Compensation Guidelines for Additional Salary Increases During the Fiscal Year are approved.
5. Any additional general salary increases that exceed the FY 2017 salary and wage
plan may only be granted upon approval by the Board of Trustees.
6. Any remaining Unrestricted Current Fund balances may be considered as a reserve for contingencies to be used for:
a. Employing additional staff where enrollments and
reorganization requirements warrant;
b. Modifying departmental operating budgets where changing conditions during the year require funding adjustments;
c. Funding to make salary adjustments for personnel as may be necessary
during the year in keeping with state and university salary guidelines;
d. Improving physical facilities for academic and research departments as opportunities arise;
e. Mandated cost increases; and
f. State impoundment of funds or appropriations rescission during the
budget year. All such changes shall be reported to the Board in a Revised Budget for the Board’s approval. Adopted by the Board of Trustees, this 23th day of June, 2016.
A-15

FY2017 PROPOSED BUDGET
Schedule FY 2017 Proposed Budget Schedule Description Page
Chart 1 Unrestricted and Restricted Current Funds – Graphical Presentation B-2
Chart 2 Unrestricted E&G Current Funds – Graphical Presentation B-3
1 State Appropriations Summary B-4
2 State Appropriations Five-Year History B-5
3 State Appropriations – Access & Diversity B-6
4 E&G Unrestricted Net Assets B-7
5 Auxiliary Unrestricted Net Assets B-8
6 Proposed Budget – Unrestricted Current Funds B-9
7 Proposed Budget – Unrestricted and Restricted Current Funds B-10
8 Five-Year Summary Comparison – Unrestricted Current Funds B-11
9 Five-Year Summary Comparison – Unrestricted and Restricted Current Funds B-12
10 Proposed Budget Summary – Unrestricted and Restricted Current Funds B-13
11 Natural Classifications – Unrestricted Current Funds B-14
12 Natural Classifications – Unrestricted Current Funds – Summary B-15
13 Auxiliaries – Proposed Budget Summary B-16
14 Athletics – Proposed Budget Summary B-17
15 Proposed Budget Summaries – Unrestricted Current Funds Total University of Tennessee System B-18 Chattanooga B-19 Knoxville B-20 Martin B-21 Space Institute B-22 Health Science Center B-23 Institute of Agriculture B-24 Institute for Public Service B-28 System Administration B-32
B-1

The University of TennesseeFY 2017 Proposed BudgetUnrestricted & Restricted Funds
State Appropriations
$545.325%
Grants & Contracts$555.825%Other
$129.46%
Auxiliaries$246.211%
Sales & Services$57.83%
Tuition & Fees$669.830%
Revenues$2.2 bi l l ion
Instruction$720.234%
Research$247.912%
Public Service$140.87%
Institutional Support$149.17%
Scholarships$286.713%
Student Services$90.04%
Academic Support$179.58%
Oper./Maint.$139.66%
Auxiliaries$185.09%
Expenditures$2.1 bi l l ion
Faculty 4,262
Administrative 918
Professional 4,055
Cler/Tech/Maint 5,931
TOTAL 15,166
FTE Positions (Unrestricted & Restricted)
July 1, 2016
Knoxville 27,384
Chattanooga 11,387
Martin 6,827
Health Science Center 3,076
Vet Med 349
Space Institute 112
TOTAL 49,135
Fall 2015 Headcount Enrollment
Unrestricted & Restricted Revenues
($millions)
Chattanooga $225.4
Knoxville 1,112.5
Martin 144.8
Space Institute 12.3
Health Science Center 479.5
Institute of Agriculture 181.6
Inst. for Public Service 23.5
System Administration 24.8
TOTAL $2,204.4
B-2

The University of TennesseeFY 2017 Proposed Budget
Unrestricted E&G Funds
State Appropriations
$526.739%
Grants & Contracts$44.53%
Other$57.24%
Sales & Services$57.84%
Tuition & Fees$670.050%
Revenues$1.4 bi l l ion
Instruction$570.942%
Research$73.65%
Public Service$80.66%
Academic Support$146.811%
Student Services$88.17%
Institutional Support$147.411%
Oper./Maint.$139.210%
Scholarships/Fellowships
$106.08%
Expenditures$1.4 bi l l ion
Faculty 3,333
Administrative 767
Professional 2,119
Cler/Tech/Maint 3,841
TOTAL 10,060
FTE Positions (Unrestricted E&G)
July 1, 2016
Knoxville 27,384
Chattanooga 11,387
Martin 6,827
Health Science Center 3,076
Vet Med 349
Space Institute 112
TOTAL 49,135
Fall 2015 Headcount Enrollment
Current FundRevenues($millions)
Chattanooga $155.4
Knoxville 649.7
Martin 96.9
Space Institute 10.2
Health Science Center 265.7
Institute of Agriculture 136.3
Inst. for Public Service 18.8
System Administration 22.9
TOTAL $1,356.0
B-3

University of Tennessee SystemFY 2017 Proposed State Appropriations Summary
Unrestricted Educational and General FundsCHANGE
PROBABLE TO PROPOSEDFY 2015 FY 2016 FY 2017ACTUAL PROBABLE PROPOSED Amount %
STATE APPROPRIATIONSChattanooga 38,442,081$ 42,640,805$ 46,639,305$ 3,998,500$ 9.4 %Knoxville 182,310,443 191,207,355 202,644,855 11,437,500 6.0 %Martin 27,025,867 28,686,097 31,478,597 2,792,500 9.7 %Space Institute 8,012,212 8,286,603 8,578,403 291,800 3.5 %Health Science Center 129,958,440 135,671,921 140,995,421 5,323,500 3.9 %Agricultural Units
Agricultural Experiment Station 25,698,486$ 26,669,788$ 27,697,588$ 1,027,800$ 3.9 %
Extension 31,195,267 32,406,617 33,903,617 1,497,000 4.6 %
College of Veterinary Medicine 16,874,254 17,733,159 18,430,859 697,700 3.9 %
Subtotal Agricultural Units 73,768,007$ 76,809,564$ 80,032,064$ 3,222,500$ 4.2 %Public Service Units
Institute for Public Service 5,265,298$ 5,439,285$ 5,639,985$ 200,700$ 3.7 %
Municipal Technical Advisory Service 2,903,313 3,039,651 3,156,651 117,000 3.8 %
County Technical Assistance Service 1,767,913 1,863,251 2,237,051 373,800 20.1 %
Subtotal Public Service Units 9,936,524$ 10,342,187$ 11,033,687$ 691,500$ 6.7 %
System Administration 4,794,038 4,995,217 5,263,217 268,000 5.4 %State Appropriations 474,247,612$ 498,639,749$ 526,665,549$ 28,025,800$ 5.6 %
State appropriations budgeted to restricted funds are not included in this schedule.
Schedule 1 B-4

University of Tennessee SystemState Appropriations Five Year History
Unrestricted Educational and General Funds
CHANGE
FY 2013 TO FY 2017
FY 2013 ACTUAL
FY 2014 ACTUAL
FY 2015 ACTUAL
FY 2016 PROBABLE
FY 2017 PROPOSED AMOUNT %
STATE APPROPRIATIONS
Chattanooga 35,523,864$ 37,467,181$ 38,442,081$ 42,640,805$ 46,639,305$ 11,115,441$ 31.3 %
Knoxville 156,439,550 177,568,343 182,310,443 191,207,355 202,644,855 46,205,305 29.5 %
Martin 26,186,217 26,359,667 27,025,867 28,686,097 31,478,597 5,292,380 20.2 %
Space Institute 7,700,101 7,995,412 8,012,212 8,286,603 8,578,403 878,302 11.4 %
Health Science Center 122,200,499 129,470,351 129,958,440 135,671,921 140,995,421 18,794,922 15.4 %
Agricultural Units
Agricultural Experiment Station 24,480,573$ 25,579,486$ 25,698,486$ 26,669,788$ 27,697,588$ 3,217,015$ 13.1 %
Extension 29,580,016 30,987,767 31,195,267 32,406,617 33,903,617 4,323,601 14.6 %
Veterinary Medicine 15,720,772 16,796,354 16,874,254 17,733,159 18,430,859 2,710,087 17.2 %
Subtotal Agricultural Units 69,781,361$ 73,363,607$ 73,768,007$ 76,809,564$ 80,032,064$ 10,250,703$ 14.7 %
Public Service Units
Institute for Public Service 5,058,459$ 5,249,898$ 5,265,298$ 5,439,285$ 5,639,985$ 581,526$ 11.5 %
Municipal Technical Advisory Service 2,737,969 2,892,013 2,903,313 3,039,651 3,156,651 418,682 15.3 %
County Technical Assistance Service 1,650,969 1,758,013 1,767,913 1,863,251 2,237,051 586,082 35.5 %
Subtotal Public Service Units 9,447,397$ 9,899,924$ 9,936,524$ 10,342,187$ 11,033,687$ 1,586,290$ 16.8 %
System Administration 4,571,278 4,721,538 4,794,038 4,995,217 5,263,217 691,939 15.1 %Total State Appropriations 431,850,267$ 466,846,023$ 474,247,612$ 498,639,749$ 526,665,549$ 94,815,282$ 22.0 %
State appropriations allocated to restricted funds are not included in this schedule.
Schedule 2
B-5

University of Tennessee SystemFY 2017 Proposed State Appropriations Summary
Access & DiversityCHANGE
FY 2015 FY 2016 FY 2017 PROBABLE TO PROPOSEDACTUAL PROBABLE PROPOSED AMOUNT %
STATE APPROPRIATIONS (Access & Diversity)Chattanooga 648,281$ 661,705$ 661,705$ Knoxville 2,270,343 2,317,355 2,317,355 Martin 547,167 558,497 558,497 Space Institute 86,512 88,303 88,303 Health Science Center 1,504,028 1,535,172 1,535,172 Agricultural Units
Agricultural Experiment Station 111,186$ 113,488$ 113,488$
Extension 108,667 110,917 110,917
College of Veterinary Medicine 318,954 325,559 325,559
Subtotal Agricultural Units 538,807$ 549,964$ 549,964$ Public Service Units
Institute for Public Service 13,898$ 14,185$ 14,185$
Municipal Technical Advisory Service 1,813 1,851 1,851
County Technical Assistance Service 1,813 1,851 1,851
Subtotal Public Service Units 17,524$ 17,887$ 17,887$ System Administration 76,238 77,817 77,817
Total State Appropriations - Access & Diversity 5,688,900$ 5,806,700$ 5,806,700$
Schedule 3
B-6

University of Tennessee SystemEducational and General Unrestricted Net Assets
Total System Chattanooga Knoxville Martin Space InstituteHealth Science
CenterInstitute of Agriculture
Institute for Public Service
System Administration
FY 2014-15 ACTUALEstimated Net Assets at Beginning of Year 145,397,509$ 9,038,783$ 27,182,091$ 8,056,694$ 227,787$ 62,063,973$ 17,350,613$ 1,173,432$ 20,304,136$ Operating Funds
Revenue 1,258,836,389$ 146,992,547$ 591,617,424$ 90,592,200$ 9,666,119$ 245,890,897$ 132,942,902$ 17,358,752$ 23,775,548$ Less: Expenditures and Transfers (1,257,300,941) (146,628,315) (591,465,589) (89,376,659) (9,635,906) (250,989,234) (131,119,543) (17,306,632) (20,779,063)
Carryover Funds To/(From) Net Assets 1,535,448$ 364,232$ 151,835$ 1,215,541$ 30,213$ (5,098,337)$ 1,823,359$ 52,120$ 2,996,485$
Net Assets Detail:ALLOCATED
Working Capital 23,487,672$ 3,203,015$ 5,171,208$ 2,069,875$ 63,433$ 6,666,973$ 1,061,204$ 67,103$ 5,184,861$ Revolving Funds 17,921,836 703,491 1,198,865 16,019,480 Encumbrances 5,662,778 1,548,334 90,582 3,135,887 887,975 Unexpended Gifts 284,867 284,867 Reserve for Reappropriations 54,206,225 3,000,000 37,715,000 12,248,843 450,000$ 792,382
Total Allocated Net Assets 101,563,378$ 3,203,015$ 7,423,033$ 5,160,457$ 63,433$ 48,716,725$ 14,198,022$ 517,103$ 22,281,590$ UNALLOCATED 45,369,579$ 6,200,000$ 19,910,893$ 4,111,778$ 194,567$ 8,248,911$ 4,975,950$ 708,449$ 1,019,031$
Total Net Assets 146,932,957$ 9,403,015$ 27,333,926$ 9,272,235$ 258,000$ 56,965,636$ 19,173,972$ 1,225,552$ 23,300,621$
Percent Unallocated of Expend. & Transfers * 3.61% 4.23% 3.37% 4.60% 2.02% 3.29% 3.79% 4.09% 2.99%
FY 2015-16 PROBABLE BUDGETEstimated Net Assets at Beginning of Year 146,932,957$ 9,403,015$ 27,333,926$ 9,272,235$ 258,000$ 56,965,636$ 19,173,972$ 1,225,552$ 23,300,621$ Operating Funds
Revenue 1,305,790,108$ 151,260,079$ 622,884,176$ 92,364,033$ 9,854,148$ 257,320,054$ 131,654,329$ 17,791,437$ 22,661,852$ Less: Expenditures and Transfers (1,348,265,977) (151,193,499) (622,884,176) (92,364,033) (9,854,148) (289,762,974) (141,299,577) (17,880,858) (23,026,712)
Carryover Funds To/(From) Net Assets (42,475,869)$ 66,580$ -$ -$ -$ (32,442,920)$ (9,645,248)$ (89,421)$ (364,860)$
Net Assets Detail:ALLOCATED
Working Capital 23,399,695$ 3,203,017$ 5,171,208$ 2,069,875$ 42,557$ 6,666,973$ 1,061,204$ 5,184,861$ Revolving Funds 17,921,836 703,491 1,198,865 16,019,480 Encumbrances 2,955,688 1,548,334 90,582 428,797 887,975 Unexpended Gifts 284,887 284,887 Reserve for Reappropriations 15,758,843 3,000,000 9,810,000 2,498,843 450,000$
Total Allocated Net Assets 60,320,949$ 3,203,017$ 7,423,033$ 5,160,457$ 42,557$ 18,104,635$ 4,448,022$ 450,000$ 21,489,228$ UNALLOCATED 44,136,139$ 6,266,578$ 19,910,893$ 4,111,778$ 215,443$ 6,418,081$ 5,080,702$ 686,131$ 1,446,533$
Total Net Assets 104,457,088$ 9,469,595$ 27,333,926$ 9,272,235$ 258,000$ 24,522,716$ 9,528,724$ 1,136,131$ 22,935,761$
Percent Unallocated of Expend. & Transfers * 3.27% 4.14% 3.20% 4.45% 2.19% 2.21% 3.60% 3.84% 3.82%
FY 2016-17 PROPOSED BUDGETEstimated Net Assets at Beginning of Year 104,457,088$ 9,469,595$ 27,333,926$ 9,272,235$ 258,000$ 24,522,716$ 9,528,724$ 1,136,131$ 22,935,761$
Operating FundsRevenue 1,355,993,740$ 155,402,724$ 649,730,025$ 96,880,611$ 10,191,403$ 265,703,998$ 136,338,482$ 18,816,645$ 22,929,852$ Less: Expenditures and Transfers (1,356,766,954) (155,336,144) (649,730,025) (96,880,611) (10,191,403) (265,703,998) (136,969,091) (19,025,830) (22,929,852)
Carryover Funds To/(From) Net Assets (773,214)$ 66,580$ -$ -$ -$ -$ (630,609)$ (209,185)$ -$
Net Assets Detail:ALLOCATED
Working Capital 22,899,695$ 3,203,017$ 5,171,208$ 2,069,875$ 42,557$ 6,666,973$ 1,061,204$ 4,684,861$ Revolving Funds 17,921,836 703,491 1,198,865 16,019,480 Encumbrances 2,955,688 1,548,334 90,582 428,797 887,975 Unexpended Gifts 284,887 284,887 Reserve for Reappropriations 15,470,832 3,000,000 9,810,000 1,713,526 300,000 647,306
Total Allocated Net Assets 59,532,938$ 3,203,017$ 7,423,033$ 5,160,457$ 42,557$ 18,104,635$ 3,662,705$ 300,000$ 21,636,534$ UNALLOCATED 44,150,936$ 6,333,158$ 19,910,893$ 4,111,778$ 215,443$ 6,418,081$ 5,235,410$ 626,946$ 1,299,227$
Total Net Assets 103,683,874$ 9,536,175$ 27,333,926$ 9,272,235$ 258,000$ 24,522,716$ 8,898,115$ 926,946$ 22,935,761$
Percent Unallocated of Expend. & Transfers * 3.25% 4.08% 3.06% 4.24% 2.11% 2.42% 3.82% 3.30% 3.26%
* Recommended percent unallocated of expenditures and transfers is 2% to 5%. For UWA, transfers-in for system charge is excluded from the calculation.
Schedule 4
B-7

University of Tennessee SystemAuxiliary Unrestricted Current Fund Balances
Total System Chattanooga Knoxville Martin Space InstituteHealth Science
Center
FY 2014-15 ACTUALEstimated Net Assets at Beginning of Year 17,283,287$ 1,390,166$ 15,072,933$ 700,160$ 31,732$ 88,297$ Operating Funds
Revenue 229,998,451 15,146,190$ 203,163,591$ 10,111,015$ 175,895$ 1,401,760$ Less: Expenditures and Transfers (220,138,447) (15,020,633) (193,692,346) (9,838,574) (168,500) (1,418,394)
Carryover Funds To/(From) Net Assets 9,860,004$ 125,557$ 9,471,245$ 272,441$ 7,395$ (16,634)$
ALLOCATEDWorking Capital 13,843,057$ 940,722$ 12,202,688$ 655,032$ 33,762$ 10,853$ Revolving Funds 1,917,693 1,917,693 Encumbrances 205 205
Total Allocated Net Assets 15,760,955$ 940,722$ 14,120,381$ 655,032$ 33,762$ 11,058$ UNALLOCATED 11,382,336$ 575,001$ 10,423,797$ 317,569$ 5,365$ 60,605$
Total Net Assets 27,143,291$ 1,515,723$ 24,544,178$ 972,601$ 39,127$ 71,663$ Percent Unallocated of Expend. & Transfers * 5.17% 3.83% 5.38% 3.23% 3.18% 4.27%
FY 2015-16 PROBABLE BUDGETEstimated Net Assets at Beginning of Year 27,143,291$ 1,515,723$ 24,544,178$ 972,601$ 39,127$ 71,663$ Operating Funds
Revenue 229,780,481$ 14,318,863$ 202,976,598$ 10,594,992$ 178,850$ 1,711,178$ Less: Expenditures and Transfers (229,780,481) (14,318,863) (202,976,598) (10,594,992) (178,850) (1,711,178)
Carryover Funds To/(From) Net Assets -$ -$ -$ -$ -$ -$
ALLOCATEDWorking Capital 13,840,057$ 940,722$ 12,202,688$ 655,032$ 30,762$ 10,853$ Revolving Funds 1,917,693 1,917,693 Encumbrances 205 205
Total Allocated Net Assets 15,757,955$ 940,722$ 14,120,381$ 655,032$ 30,762$ 11,058$ UNALLOCATED 11,385,336 575,001$ 10,423,797$ 317,569$ 8,365$ 60,605$
Total Net Assets 27,143,291$ 1,515,723$ 24,544,178$ 972,601$ 39,127$ 71,663$ Percent Unallocated of Expend. & Transfers * 4.95% 4.02% 5.14% 3.00% 4.68% 3.54%
FY 2016-17 PROPOSED BUDGETEstimated Net Assets at Beginning of Year 27,143,291$ 1,515,723$ 24,544,178$ 972,601$ 39,127$ 71,663$ Operating Funds
Revenue 245,962,927$ 14,184,296$ 219,639,669$ 10,192,740$ 215,000$ 1,731,222$ Less: Expenditures and Transfers (245,962,927) (14,184,296) (219,639,669) (10,192,740) (215,000) (1,731,222)
Carryover Funds To/(From) Net Assets -$ -$ -$ -$ -$ -$ Net Assets at End of Year 27,143,291 1,515,723$ 24,544,178$ 972,601$ 39,127$ 71,663$
Net Assets Detail:ALLOCATED
Working Capital 13,840,057$ 940,722$ 12,202,688$ 655,032$ 30,762$ 10,853$ Revolving Funds 1,917,693 1,917,693 Encumbrances 205 205
Total Allocated Net Assets 15,757,955$ 940,722$ 14,120,381$ 655,032$ 30,762$ 11,058$ UNALLOCATED 11,385,336 575,001$ 10,423,797$ 317,569$ 8,365$ 60,605$
Total Net Assets 27,143,291$ 1,515,723$ 24,544,178$ 972,601$ 39,127$ 71,663$ Percent Unallocated of Expend. & Transfers * 4.63% 4.05% 4.75% 3.12% 3.89% 3.50%
* Recommended percent unallocated of expenditures and transfers is 3% to 5%.
Schedule 5B-8

University of Tennessee SystemFY 2017 Proposed Budget Summary
Current Funds Revenues, Expenditures, and Transfers - UNRESTRICTED
Total System Chattanooga Knoxville Martin Space InstituteHealth Science
CenterInstitute of Agriculture
Institute for Public Service
System Administration
EDUCATIONAL AND GENERALRevenues
Tuition & Fees 669,787,108$ 102,981,384$ 407,278,045$ 61,178,912$ 1,323,000$ 84,640,459$ 12,385,308$ State Appropriations 526,665,549 46,639,305 202,644,855 31,478,597 8,578,403 140,995,421 80,032,064 11,033,687$ 5,263,217$ Grants & Contracts 44,529,714 453,856 22,560,000 158,000 290,000 16,865,745 4,018,071 184,042 Sales & Service 57,832,737 5,088,679 5,538,268 3,427,102 20,204,135 23,574,553 Other Sources 57,178,632 239,500 11,708,857 638,000 2,998,238 16,328,486 7,598,916 17,666,635
Total Revenues 1,355,993,740$ 155,402,724$ 649,730,025$ 96,880,611$ 10,191,403$ 265,703,998$ 136,338,482$ 18,816,645$ 22,929,852$
Expenditures and TransfersInstruction 570,871,393$ 66,516,644$ 282,648,112$ 43,155,226$ 5,014,243$ 138,570,757$ 34,966,411$ Research 73,583,021 2,129,881 23,457,198 311,385 609,360 7,653,398 39,171,799 250,000$ Public Service 80,557,849 2,626,075 12,650,139 575,828 70,276 47,393,012 17,242,519$ Academic Support 146,819,933 12,412,821 71,624,930 11,416,305 527,194 42,655,010 7,916,520 267,153 Student Services 88,080,549 24,191,095 45,150,420 12,418,501 76,048 6,244,485 Institutional Support 147,368,765 12,025,960 49,882,809 6,630,482 1,509,508 23,817,362 2,599,599 935,651 49,967,394$ Op/Maint Physical Plant 139,190,009 20,422,813 74,657,889 11,794,323 2,024,659 27,052,230 3,238,095 Scholarships & Fellowships 106,011,157 12,646,432 74,811,428 9,301,864 288,891 8,923,087 39,455
Subtotal Expenditures 1,352,482,676$ 152,971,721$ 634,882,925$ 95,603,914$ 10,049,903$ 254,986,605$ 135,324,891$ 18,445,323$ 50,217,394$ Mandatory Transfers 8,589,891 874,165 747,685 626,148 6,206,893 135,000 Non Mandatory Transfers (4,305,613) 1,490,258 14,099,415 650,549 141,500 4,510,500 1,644,200 580,507 (27,422,542)
Total Expenditures & Transfers 1,356,766,954$ 155,336,144$ 649,730,025$ 96,880,611$ 10,191,403$ 265,703,998$ 136,969,091$ 19,025,830$ 22,929,852$
Fund Balance Addition/(Reduction) (773,214)$ 66,580$ -$ -$ -$ -$ (630,609)$ (209,185)$ -$
AUXILIARIESRevenues 245,962,927$ 14,184,296$ 219,639,669$ 10,192,740$ 215,000$ 1,731,222$ Expenditures and Transfers
Expenditures 184,698,151$ 10,360,738$ 165,632,322$ 7,129,369$ 215,000$ 1,360,722$ Mandatory Transfers 40,667,626 1,803,780 36,451,629 2,041,717 370,500 Non-Mandatory Transfers 20,597,150 2,019,778 17,555,718 1,021,654 -
Total Expenditures & Transfers 245,962,927$ 14,184,296$ 219,639,669$ 10,192,740$ 215,000$ 1,731,222$
Fund Balance Addition/(Reduction)
TOTALSRevenues 1,601,956,667$ 169,587,020$ 869,369,694$ 107,073,351$ 10,406,403$ 267,435,220$ 136,338,482$ 18,816,645$ 22,929,852$ Expenditures and Transfers
Expenditures 1,537,180,827$ 163,332,459$ 800,515,247$ 102,733,283$ 10,264,903$ 256,347,327$ 135,324,891$ 18,445,323$ 50,217,394$ Mandatory Transfers 49,257,517 2,677,945 37,199,314 2,667,865 6,577,393 135,000Non-Mandatory Transfers 16,291,537 3,510,036 31,655,133 1,672,203 141,500 4,510,500 1,644,200 580,507 (27,422,542)
Total Expenditures & Transfers 1,602,729,881$ 169,520,440$ 869,369,694$ 107,073,351$ 10,406,403$ 267,435,220$ 136,969,091$ 19,025,830$ 22,929,852$
Fund Balance Addition/(Reduction) (773,214)$ 66,580$ (630,609)$ (209,185)$
Schedule 6B-9

University of Tennessee SystemFY 2017 Proposed Budget Summary
Current Funds Revenues, Expenditures and Transfers - UNRESTRICTED AND RESTRICTED
Total System Chattanooga Knoxville Martin Space InstituteHealth Science
CenterInstitute of Agriculture
Institute for Public Service
System Administration
EDUCATIONAL AND GENERALRevenues
Tuition & Fees 669,787,108$ 102,981,384$ 407,278,045$ 61,178,912$ 1,323,000$ 84,640,459$ 12,385,308$ State Appropriations 545,338,973 47,384,304 213,011,187 31,765,003 9,381,757 146,975,526 80,524,292 11,033,687$ 5,263,217$ Grants & Contracts 555,800,581 45,180,775 221,193,668 34,042,600 1,190,000 204,794,745 43,784,751 4,364,042 1,250,000 Sales & Service 57,832,737 5,088,679 5,538,268 3,427,102 20,204,135 23,574,553 Other Sources 129,393,063 10,573,289 45,608,857 4,162,580 220,000 21,147,966 21,331,440 8,082,296 18,266,635
Total Revenues 1,958,152,462$ 211,208,431$ 892,630,025$ 134,576,197$ 12,114,757$ 477,762,831$ 181,600,344$ 23,480,025$ 24,779,852$
Expenditures and TransfersInstruction 720,216,687$ 71,399,949$ 292,748,112$ 45,213,626$ 5,194,243$ 269,110,757$ 36,542,000$ 8,000$ Research 247,866,206 4,241,567 124,457,198 401,185 2,320,714 53,263,101 62,250,441 932,000 Public Service 140,757,594 3,819,212 33,350,139 1,828,028 11,876,576 67,377,740 21,905,899$ 600,000 Academic Support 179,540,261 14,860,694 82,874,930 11,725,505 535,194 61,256,110 8,020,675 267,153 Student Services 90,036,182 25,171,328 45,460,420 13,085,901 76,048 6,242,485 Institutional Support 149,064,989 12,214,886 50,022,809 6,647,882 1,518,508 24,533,962 2,703,897 935,651 50,487,394 Op/Maint Physical Plant 139,605,009 20,423,813 75,057,889 11,794,323 2,024,659 27,052,230 3,252,095 Scholarships/Fellowships 286,730,858 55,909,497 173,811,428 42,603,050 303,891 13,623,087 439,905 40,000
Subtotal Expenditures 1,953,817,786$ 208,040,946$ 877,782,925$ 133,299,500$ 11,973,257$ 466,958,308$ 180,586,753$ 23,108,703$ 52,067,394$
Mandatory Transfers 8,589,891 874,165 747,685 626,148 6,206,893 135,000 Non Mandatory Transfers (4,305,613) 1,490,258 14,099,415 650,549 141,500 4,510,500 1,644,200 580,507 (27,422,542)
Total Expenditures & Transfers 1,958,102,064$ 210,405,369$ 892,630,025$ 134,576,197$ 12,114,757$ 477,675,701$ 182,230,953$ 23,689,210$ 24,779,852$
Fund Balance Addition/(Reduction) 50,398$ 803,062$ 87,130$ (630,609)$ (209,185)$
AUXILIARIESRevenues 246,222,927$ 14,184,296$ 219,899,669$ 10,192,740$ 215,000$ 1,731,222$
Expenditures & TransfersExpenditures 184,958,151$ 10,360,738$ 165,892,322$ 7,129,369$ 215,000$ 1,360,722$
Mandatory Transfers 40,667,626 1,803,780 36,451,629 2,041,717 370,500 Non Mandatory Transfers 20,597,150 2,019,778 17,555,718 1,021,654
Total Expenditures & Transfers 246,222,927$ 14,184,296$ 219,899,669$ 10,192,740$ 215,000$ 1,731,222$
Fund Balance Addition/(Reduction)
TOTALSRevenues 2,204,375,389$ 225,392,727$ 1,112,529,694$ 144,768,937$ 12,329,757$ 479,494,053$ 181,600,344$ 23,480,025$ 24,779,852$
Expenditures & TransfersExpenditures 2,138,775,937$ 218,401,684$ 1,043,675,247$ 140,428,869$ 12,188,257$ 468,319,030$ 180,586,753$ 23,108,703$ 52,067,394$
Mandatory Transfers 49,257,517 2,677,945 37,199,314 2,667,865 6,577,393 135,000 Non Mandatory Transfers 16,291,537 3,510,036 31,655,133 1,672,203 141,500 4,510,500 1,644,200 580,507 (27,422,542)
Total Expenditures & Transfers 2,204,324,991$ 224,589,665$ 1,112,529,694$ 144,768,937$ 12,329,757$ 479,406,923$ 182,230,953$ 23,689,210$ 24,779,852$
Fund Balance Addition/(Reduction) 50,398$ 803,062$ 87,130$ (630,609)$ (209,185)$
Schedule 7B-10
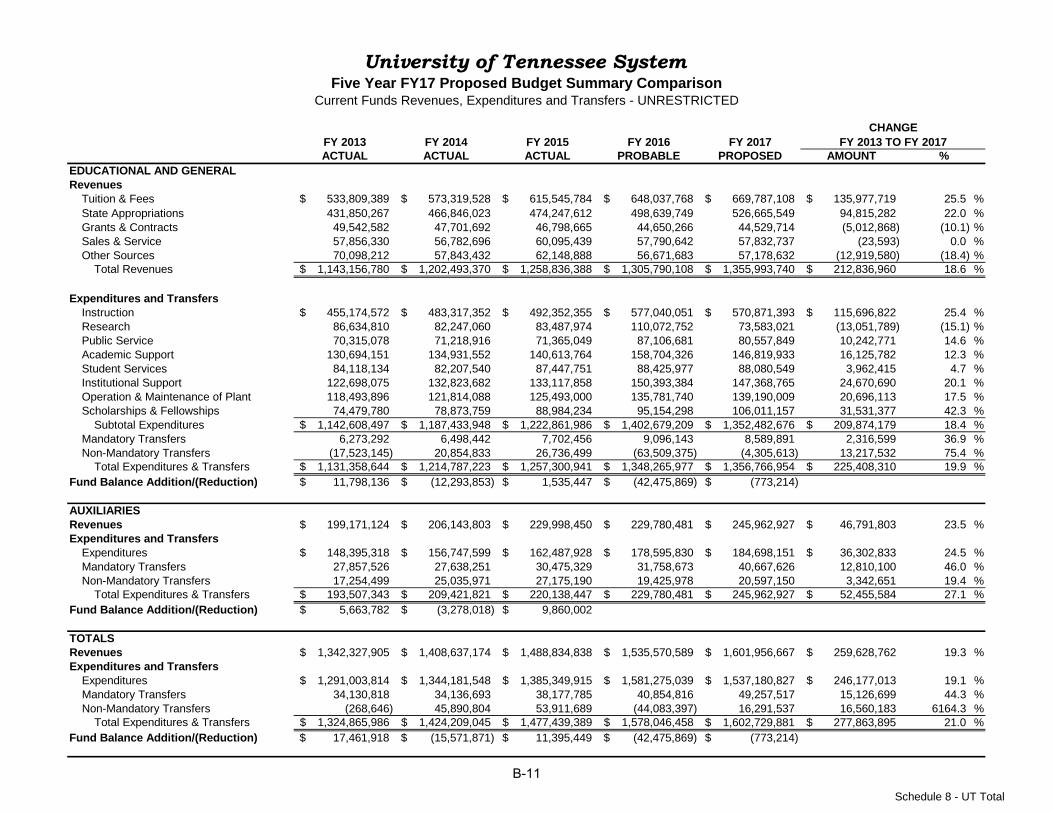
FY 2013 FY 2014 FY 2015 FY 2016 FY 2017ACTUAL ACTUAL ACTUAL PROBABLE PROPOSED AMOUNT
EDUCATIONAL AND GENERALRevenues
Tuition & Fees 533,809,389$ 573,319,528$ 615,545,784$ 648,037,768$ 669,787,108$ 135,977,719$ 25.5 %State Appropriations 431,850,267 466,846,023 474,247,612 498,639,749 526,665,549 94,815,282 22.0 %Grants & Contracts 49,542,582 47,701,692 46,798,665 44,650,266 44,529,714 (5,012,868) (10.1) %Sales & Service 57,856,330 56,782,696 60,095,439 57,790,642 57,832,737 (23,593) 0.0 %Other Sources 70,098,212 57,843,432 62,148,888 56,671,683 57,178,632 (12,919,580) (18.4) %
Total Revenues 1,143,156,780$ 1,202,493,370$ 1,258,836,388$ 1,305,790,108$ 1,355,993,740$ 212,836,960$ 18.6 %
Expenditures and TransfersInstruction 455,174,572$ 483,317,352$ 492,352,355$ 577,040,051$ 570,871,393$ 115,696,822$ 25.4 %Research 86,634,810 82,247,060 83,487,974 110,072,752 73,583,021 (13,051,789) (15.1) %Public Service 70,315,078 71,218,916 71,365,049 87,106,681 80,557,849 10,242,771 14.6 %Academic Support 130,694,151 134,931,552 140,613,764 158,704,326 146,819,933 16,125,782 12.3 %Student Services 84,118,134 82,207,540 87,447,751 88,425,977 88,080,549 3,962,415 4.7 %Institutional Support 122,698,075 132,823,682 133,117,858 150,393,384 147,368,765 24,670,690 20.1 %Operation & Maintenance of Plant 118,493,896 121,814,088 125,493,000 135,781,740 139,190,009 20,696,113 17.5 %Scholarships & Fellowships 74,479,780 78,873,759 88,984,234 95,154,298 106,011,157 31,531,377 42.3 %
Subtotal Expenditures 1,142,608,497$ 1,187,433,948$ 1,222,861,986$ 1,402,679,209$ 1,352,482,676$ 209,874,179$ 18.4 %Mandatory Transfers 6,273,292 6,498,442 7,702,456 9,096,143 8,589,891 2,316,599 36.9 %Non-Mandatory Transfers (17,523,145) 20,854,833 26,736,499 (63,509,375) (4,305,613) 13,217,532 75.4 %
Total Expenditures & Transfers 1,131,358,644$ 1,214,787,223$ 1,257,300,941$ 1,348,265,977$ 1,356,766,954$ 225,408,310$ 19.9 %Fund Balance Addition/(Reduction) 11,798,136$ (12,293,853)$ 1,535,447$ (42,475,869)$ (773,214)$
AUXILIARIESRevenues 199,171,124$ 206,143,803$ 229,998,450$ 229,780,481$ 245,962,927$ 46,791,803$ 23.5 %Expenditures and Transfers
Expenditures 148,395,318$ 156,747,599$ 162,487,928$ 178,595,830$ 184,698,151$ 36,302,833$ 24.5 %Mandatory Transfers 27,857,526 27,638,251 30,475,329 31,758,673 40,667,626 12,810,100 46.0 %Non-Mandatory Transfers 17,254,499 25,035,971 27,175,190 19,425,978 20,597,150 3,342,651 19.4 %
Total Expenditures & Transfers 193,507,343$ 209,421,821$ 220,138,447$ 229,780,481$ 245,962,927$ 52,455,584$ 27.1 %Fund Balance Addition/(Reduction) 5,663,782$ (3,278,018)$ 9,860,002$
TOTALSRevenues 1,342,327,905$ 1,408,637,174$ 1,488,834,838$ 1,535,570,589$ 1,601,956,667$ 259,628,762$ 19.3 %Expenditures and Transfers
Expenditures 1,291,003,814$ 1,344,181,548$ 1,385,349,915$ 1,581,275,039$ 1,537,180,827$ 246,177,013$ 19.1 %Mandatory Transfers 34,130,818 34,136,693 38,177,785 40,854,816 49,257,517 15,126,699 44.3 %Non-Mandatory Transfers (268,646) 45,890,804 53,911,689 (44,083,397) 16,291,537 16,560,183 6164.3 %
Total Expenditures & Transfers 1,324,865,986$ 1,424,209,045$ 1,477,439,389$ 1,578,046,458$ 1,602,729,881$ 277,863,895$ 21.0 %Fund Balance Addition/(Reduction) 17,461,918$ (15,571,871)$ 11,395,449$ (42,475,869)$ (773,214)$
%
University of Tennessee SystemFive Year FY17 Proposed Budget Summary Comparison
Current Funds Revenues, Expenditures and Transfers - UNRESTRICTED
FY 2013 TO FY 2017CHANGE
Schedule 8 - UT Total
B-11

FY 2013 FY 2014 FY 2015 FY 2016 FY 2017ACTUAL ACTUAL ACTUAL PROBABLE PROPOSED AMOUNT
EDUCATIONAL AND GENERALRevenues
Tuition & Fees 533,809,389$ 573,319,528$ 615,545,784$ 648,037,768$ 669,787,108$ 135,977,719$ 25.5 %State Appropriations 447,473,296 486,122,116 498,835,055 517,456,979 545,338,973 97,865,677 21.9 %Grants & Contracts 574,519,330 560,197,430 579,397,127 550,661,427 555,800,581 (18,718,749) (3.3) %Sales & Service 57,856,330 56,782,696 60,095,439 57,790,642 57,832,737 (23,593) 0.0 %Other Sources 152,144,385 121,741,019 135,054,622 128,456,114 129,393,063 (22,751,322) (15.0) %
Total Revenues 1,765,802,731$ 1,798,162,787$ 1,888,928,027$ 1,902,402,930$ 1,958,152,462$ 192,349,731$ 10.9 %
Expenditures and TransfersInstruction 611,569,394$ 636,019,932$ 661,961,368$ 726,113,945$ 720,216,687$ 108,647,293$ 17.8 %Research 277,762,160 260,705,414 256,779,818 284,024,740 247,866,206 (29,895,954) (10.8) %Public Service 133,120,201 127,928,093 130,087,649 144,781,226 140,757,594 7,637,393 5.7 %Academic Support 158,683,987 167,965,217 179,840,336 190,270,454 179,540,261 20,856,274 13.1 %Student Services 86,057,765 84,674,075 89,692,660 90,368,210 90,036,182 3,978,417 4.6 %Institutional Support 125,048,887 134,563,916 135,132,492 152,089,208 149,064,989 24,016,102 19.2 %Operation & Maintenance of Plant 119,145,974 122,246,472 125,906,243 136,196,740 139,605,009 20,459,035 17.2 %Scholarships & Fellowships 250,331,559 254,606,577 263,845,171 274,588,208 286,730,858 36,399,299 14.5 %
Subtotal Expenditures 1,761,719,928$ 1,788,709,696$ 1,843,245,736$ 1,998,432,731$ 1,953,817,786$ 192,097,858$ 10.9 %Mandatory Transfers 6,273,292 6,498,442 7,702,456 9,096,143 8,589,891 2,316,599 36.9 %Non-Mandatory Transfers (17,523,145) 20,854,833 26,736,499 (63,509,375) (4,305,613) 13,217,532 75.4 %
Total Expenditures & Transfers 1,750,470,075$ 1,816,062,971$ 1,877,684,691$ 1,944,019,499$ 1,958,102,064$ 207,631,989$ 11.9 %Fund Balance Addition/(Reduction) 15,332,656$ (17,900,184)$ 11,243,336$ (41,616,569)$ 50,398$
AUXILIARIESRevenues 199,645,425$ 207,264,677$ 230,256,055$ 230,040,481$ 246,222,927$ 46,577,502$ 23.3 %Expenditures and Transfers
Expenditures 149,454,826$ 156,840,867$ 162,769,238$ 178,855,830$ 184,958,151$ 35,503,325$ 23.8 %Mandatory Transfers 27,857,526 27,638,251 30,475,329 31,758,673 40,667,626 12,810,100 46.0 %Non-Mandatory Transfers 17,254,499 25,035,971 27,175,190 19,425,978 20,597,150 3,342,651 19.4 %
Total Expenditures & Transfers 194,566,851$ 209,515,089$ 220,419,757$ 230,040,481$ 246,222,927$ 51,656,076$ 26.5 %Fund Balance Addition/(Reduction) 5,078,574$ (2,250,412)$ 9,836,298$
TOTALSRevenues 1,965,448,156$ 2,005,427,465$ 2,119,184,082$ 2,132,443,411$ 2,204,375,389$ 238,927,233$ 12.2 %Expenditures and Transfers
Expenditures 1,911,174,754$ 1,945,550,563$ 2,006,014,974$ 2,177,288,561$ 2,138,775,937$ 227,601,183$ 11.9 %Mandatory Transfers 34,130,818 34,136,693 38,177,785 40,854,816 49,257,517 15,126,699 44.3 %Non-Mandatory Transfers (268,646) 45,890,804 53,911,689 (44,083,397) 16,291,537 16,560,183 6164.3 %
Total Expenditures & Transfers 1,945,036,926$ 2,025,578,060$ 2,098,104,448$ 2,174,059,980$ 2,204,324,991$ 259,288,065$ 13.3 %Fund Balance Addition/(Reduction) 20,411,230$ (20,150,595)$ 21,079,634$ (41,616,569)$ 50,398$
%
University of Tennessee SystemFive Year FY17 Proposed Budget Summary Comparison
Current Funds Revenues, Expenditures and Transfers - UNRESTRICTED AND RESTRICTED
FY 2013 TO FY 2017CHANGE
Schedule 9 - UT Total
B-12

Unrestricted Restricted Total Unrestricted Restricted Total Unrestricted Restricted Total Amount
EDUCATION AND GENERAL
Revenues
Tuition & Fees 615,545,784$ 615,545,784$ 648,037,768$ 648,037,768$ 669,787,108$ 669,787,108$ 21,749,340$ 3.4 %
State Appropriations 474,247,612 24,587,443$ 498,835,055 498,639,749 18,817,230$ 517,456,979 526,665,549 18,673,424$ 545,338,973 27,881,994 5.4 %
Grants & Contracts 46,798,665 532,598,462 579,397,127 44,650,266 506,011,161 550,661,427 44,529,714 511,270,867 555,800,581 5,139,154 0.9 %
Sales & Service 60,095,439 60,095,439 57,790,642 57,790,642 57,832,737 57,832,737 42,095 0.1 %
Other Sources 62,148,888 72,905,734 135,054,622 56,671,683 71,784,431 128,456,114 57,178,632 72,214,431 129,393,063 936,949 0.7 %Total Revenues 1,258,836,388$ 630,091,639$ 1,888,928,027$ 1,305,790,108$ 596,612,822$ 1,902,402,930$ 1,355,993,740$ 602,158,722$ 1,958,152,462$ 55,749,532$ 2.9 %
Expenditures and TransfersInstruction 492,352,355$ 169,609,012$ 661,961,368$ 577,040,051 149,073,894$ 726,113,945$ 570,871,393$ 149,345,294$ 720,216,687$ (5,897,258)$ (0.8) %
Research 83,487,974 173,291,843 256,779,818 110,072,752 173,951,988 284,024,740 73,583,021 174,283,185 247,866,206 (36,158,534) (12.7) %
Public Service 71,365,049 58,722,600 130,087,649 87,106,681 57,674,545 144,781,226 80,557,849 60,199,745 140,757,594 (4,023,632) (2.8) %
Academic Support 140,613,764 39,226,572 179,840,336 158,704,326 31,566,128 190,270,454 146,819,933 32,720,328 179,540,261 (10,730,193) (5.6) %
Student Services 87,447,751 2,244,909 89,692,660 88,425,977 1,942,233 90,368,210 88,080,549 1,955,633 90,036,182 (332,028) (0.4) %
Institutional Support 133,117,858 2,014,635 135,132,492 150,393,384 1,695,824 152,089,208 147,368,765 1,696,224 149,064,989 (3,024,219) (2.0) %
Operations & Maintenance of Plant 125,493,000 413,242 125,906,243 135,781,740 415,000 136,196,740 139,190,009 415,000 139,605,009 3,408,269 2.5 %
Scholarships & Fellowships 88,984,234 174,860,937 263,845,171 95,154,298 179,433,910 274,588,208 106,011,157 180,719,701 286,730,858 12,142,650 4.4 %
Subtotal Expenditures 1,222,861,986$ 620,383,750$ 1,843,245,736$ 1,402,679,209$ 595,753,522$ 1,998,432,731$ 1,352,482,676$ 601,335,110$ 1,953,817,786$ (44,614,945)$ (2.2) %
Mandatory Transfers 7,702,456 7,702,456 9,096,143 9,096,143 8,589,891 8,589,891 (506,252) (5.6) %
Non-Mandatory Transfers 26,736,499 26,736,499 (63,509,375) (63,509,375) (4,305,613) (4,305,613) 59,203,762 93.2 %Total Expenditures & Transfers 1,257,300,941$ 620,383,750$ 1,877,684,691$ 1,348,265,977$ 595,753,522$ 1,944,019,499$ 1,356,766,954$ 601,335,110$ 1,958,102,064$ 14,082,565$ 0.7 %
Fund Balance Addition / (Reduction) 1,535,447$ 9,707,889$ 11,243,336$ (42,475,869)$ 859,300$ (41,616,569)$ (773,214)$ 823,612$ 50,398$
AUXILIARIES
Revenues 229,998,450$ 257,605$ 230,256,055$ 229,780,481$ 260,000$ 230,040,481$ 245,962,927$ 260,000$ 246,222,927$ 16,182,446$ 7.0 %
Expenditures and Transfers
Expenditures 162,487,928$ 281,309$ 162,769,238$ 178,595,830$ 260,000$ 178,855,830$ 184,698,151$ 260,000$ 184,958,151$ 6,102,321$ 3.4 %
Mandatory Transfers 30,475,329 30,475,329 31,758,673 31,758,673 40,667,626 40,667,626 8,908,953 28.1 %
Non-Mandatory Transfers 27,175,190 27,175,190 19,425,978 19,425,978 20,597,150 20,597,150 1,171,172 6.0 %Total Expenditures & Transfers 220,138,447$ 281,309$ 220,419,757$ 229,780,481$ 260,000$ 230,040,481$ 245,962,927$ 260,000$ 246,222,927$ 16,182,446$ 7.0 %
Fund Balance Addition / (Reduction) 9,860,002$ (23,704)$ 9,836,298$
TOTALS
Revenues 1,488,834,838$ 630,349,244$ 2,119,184,082$ 1,535,570,589$ 596,872,822$ 2,132,443,411$ 1,601,956,667$ 602,418,722$ 2,204,375,389$ 71,931,978$ 3.4 %
Expenditures and Transfers
Expenditures 1,385,349,915$ 620,665,059$ 2,006,014,974$ 1,581,275,039$ 596,013,522$ 2,177,288,561$ 1,537,180,827$ 601,595,110$ 2,138,775,937$ (38,512,624)$ (1.8) %
Mandatory Transfers 38,177,785 38,177,785 40,854,816 40,854,816 49,257,517 49,257,517 8,402,701 20.6 %
Non-Mandatory Transfers 53,911,689 53,911,689 (44,083,397) (44,083,397) 16,291,537 16,291,537 60,374,934 137.0 %Total Expenditures & Transfers 1,477,439,389$ 620,665,059$ 2,098,104,448$ 1,578,046,458$ 596,013,522$ 2,174,059,980$ 1,602,729,881$ 601,595,110$ 2,204,324,991$ 30,265,011$ 1.4 %
Fund Balance Addition / (Reduction) 11,395,449$ 9,684,184$ 21,079,634$ (42,475,869)$ 859,300$ (41,616,569)$ (773,214)$ 823,612$ 50,398$
%Probable to Proposed
Change
University of Tennessee SystemFY 2017 Proposed Budget Summary
Unrestricted and Restricted Current Funds Revenues, Expenditures and Transfers
FY 2015 Actual FY 2016 Probable FY 2017 Proposed
Schedule 10 - UT TotalB-13

University of Tennessee SystemFY 2017 Proposed Budget - Natural Classifications
Unrestricted Current Funds Expenditures
Total System Chattanooga Knoxville Martin Space InstituteHealth Science
CenterInstitute of Agriculture
Institute for Public Service
System Administration
EDUCATIONAL AND GENERALSalaries and Benefits
SalariesAcademic 351,019,946$ 41,939,776$ 165,074,437$ 23,939,727$ 3,171,097$ 86,450,638$ 30,035,975$ 267,396$ 140,900$ Non-Academic 330,734,930 35,251,249 129,783,433 20,989,989 3,216,510 63,838,396 44,202,348 9,645,658 23,807,347Students 8,658,387 1,099,979 4,819,975 1,441,987 674,481 465,989 25,290 130,686
Total Salaries 690,413,263$ 78,291,004$ 299,677,845$ 46,371,703$ 6,387,607$ 150,963,515$ 74,704,312$ 9,938,344$ 24,078,933$ Staff Benefits 229,220,605 28,065,562 95,950,594 18,297,150 1,770,753 45,928,704 27,901,923 3,372,971 7,932,948
Total Salaries and Benefits 919,633,868$ 106,356,566$ 395,628,439$ 64,668,853$ 8,158,360$ 196,892,219$ 102,606,235$ 13,311,315$ 32,011,881$ Operating 413,161,934 44,925,250 227,035,090 29,531,181 1,851,543 54,186,622 32,361,877 5,064,858 18,205,513Equipment and Capital Outlay 19,686,874 1,689,905 12,219,396 1,403,880 40,000 3,907,764 356,779 69,150
Total Expenditures 1,352,482,676$ 152,971,721$ 634,882,925$ 95,603,914$ 10,049,903$ 254,986,605$ 135,324,891$ 18,445,323$ 50,217,394$
AUXILIARIESSalaries and Benefits
SalariesAcademic 639,676$ 7,000$ 629,613$ 3,063$ Non-Academic 49,112,309 1,398,515 46,006,372 1,405,420 96,422$ 205,580$ Students 4,664,158 104,139 3,997,675 562,344
Total Salaries 54,416,143$ 1,509,654$ 50,633,660$ 1,970,827$ 96,422$ 205,580$ Staff Benefits 13,955,872 589,913 12,494,977 680,960 30,094 159,928
Total Salaries and Benefits 68,372,015$ 2,099,567$ 63,128,637$ 2,651,787$ 126,516$ 365,508$ Operating 115,555,366 8,253,701 101,761,885 4,460,882 83,684 995,214Equipment and Capital Outlay 770,770 7,470 741,800 16,700 4,800
Total Expenditures 184,698,151$ 10,360,738$ 165,632,322$ 7,129,369$ 215,000$ 1,360,722$
TOTALSSalaries and Benefits
SalariesAcademic 351,659,622$ 41,946,776$ 165,704,050$ 23,942,790$ 3,171,097$ 86,450,638$ 30,035,975$ 267,396$ 140,900$ Non-Academic 379,847,239 36,649,764 175,789,805 22,395,409 3,312,932 64,043,976 44,202,348 9,645,658 23,807,347Students 13,322,545 1,204,118 8,817,650 2,004,331 674,481 465,989 25,290 130,686
Total Salaries 744,829,406$ 79,800,658$ 350,311,505$ 48,342,530$ 6,484,029$ 151,169,095$ 74,704,312$ 9,938,344$ 24,078,933$ Staff Benefits 243,176,477 28,655,475 108,445,571 18,978,110 1,800,847 46,088,632 27,901,923 3,372,971 7,932,948
Total Salaries and Benefits 988,005,883$ 108,456,133$ 458,757,076$ 67,320,640$ 8,284,876$ 197,257,727$ 102,606,235$ 13,311,315$ 32,011,881$ Operating 528,717,300 53,178,951 328,796,975 33,992,063 1,935,227 55,181,836 32,361,877 5,064,858 18,205,513Equipment and Capital Outlay 20,457,644 1,697,375 12,961,196 1,420,580 44,800 3,907,764 356,779 69,150
Total Expenditures 1,537,180,827$ 163,332,459$ 800,515,247$ 102,733,283$ 10,264,903$ 256,347,327$ 135,324,891$ 18,445,323$ 50,217,394$
Schedule 11B-14

FY 2015 FY 2016 FY 2017ACTUAL PROBABLE PROPOSED AMOUNT
EDUCATIONAL AND GENERAL
Salaries and Benefits
Salaries
Academic 333,879,883$ 348,592,960$ 351,019,946$ 2,426,986$ 0.7 %
Non-Academic 306,368,688 320,893,919 330,734,930 9,841,011 3.1 %
Students 10,573,136 9,168,782 8,658,387 (510,395) (5.6) %
Total Salaries 650,821,706$ 678,655,661$ 690,413,263$ 11,757,602$ 1.7 %
Staff Benefits 220,776,097 222,646,654 229,220,605 6,573,951 3.0 %
Total Salaries and Benefits 871,597,804$ 901,302,315$ 919,633,868$ 18,331,553$ 2.0 %
Operating 324,616,480 478,016,579 413,161,934 (64,854,645) (13.6) %
Equipment and Capital Outlay 26,647,702 23,360,315 19,686,874 (3,673,441) (15.7) %
Total Expenditures 1,222,861,986$ 1,402,679,209$ 1,352,482,676$ (50,196,533)$ (3.6) %
AUXILIARIES
Salaries and Benefits
Salaries
Academic 460,433$ 509,704$ 639,676$ 129,972$ 25.5 %
Non-Academic 46,283,764 46,661,988 49,112,309 2,450,321$ 5.3 %
Students 4,263,562 4,537,496 4,664,158 126,662 2.8 %
Total Salaries 51,007,760$ 51,709,188$ 54,416,143$ 2,706,955$ 5.2 %
Staff Benefits 13,962,973 13,676,343 13,955,872 279,529 2.0 %
Total Salaries and Benefits 64,970,733$ 65,385,531$ 68,372,015$ 2,986,484$ 4.6 %
Operating 97,395,934 112,482,829 115,555,366 3,072,537 2.7 %
Equipment and Capital Outlay 121,262 727,470 770,770 43,300 6.0 %
Total Expenditures 162,487,928$ 178,595,830$ 184,698,151$ 6,102,321$ 3.4 %
TOTALS
Salaries and Benefits
Salaries
Academic 334,340,316$ 349,102,664$ 351,659,622$ 2,556,958$ 0.7 %
Non-Academic 352,652,452 367,555,907 379,847,239 12,291,332 3.3 %
Students 14,836,698 13,706,278 13,322,545 (383,733) (2.8) %
Total Salaries 701,829,466$ 730,364,849$ 744,829,406$ 14,464,557$ 2.0 %
Staff Benefits 234,739,071 236,322,997 243,176,477 6,853,480 2.9 %
Total Salaries and Benefits 936,568,536$ 966,687,846$ 988,005,883$ 21,318,037$ 2.2 %
Operating 422,012,414 590,499,408 528,717,300 (61,782,108) (10.5) %
Equipment and Capital Outlay 26,768,964 24,087,785 20,457,644 (3,630,141) (15.1) %
Total Expenditures 1,385,349,915$ 1,581,275,039$ 1,537,180,827$ (44,094,212)$ (2.8) %
%
CHANGE
FY 2017 Proposed Budget Summary - Natural ClassificationsUnrestricted Current Funds Expenditures
University of Tennessee System
PROBABLE TO PROPOSED
Schedule 12B-15

University of Tennessee SystemFY 2017 Proposed Budget Summary
Auxiliary Enterprises Funds Revenues, Expenditures and Transfers
CHANGEFY 2015 FY 2016 FY 2017 PROBABLE TO PROPOSEDACTUAL PROBABLE PROPOSED AMOUNT %
HOUSINGRevenues 64,353,411$ 61,757,670$ 65,564,675$ 3,807,005$ 6.16 %
Expenditures and TransfersExpenditures 38,459,292$ 41,870,392$ 42,009,840$ 139,448$ 0.3 %
Mandatory Transfers 10,027,001 12,168,671 18,797,266 6,628,595 54.5 %
Non-Mandatory Transfers 13,289,816 7,718,607 4,757,569 (2,961,038) (38.4) %
Total Expenditures and Transfers 61,776,109$ 61,757,670$ 65,564,675$ 3,807,005$ 6.2 %
Fund Balance Addition/(Reduction) 2,577,302$ -$
FOOD SERVICERevenues 6,925,581$ 7,015,110$ 8,681,912$ 1,666,802$ 23.8 %
Expenditures and TransfersExpenditures 2,563,395$ 3,234,415$ 3,327,342$ 92,927$ 2.9 %
Mandatory Transfers 2,703,864 Non-Mandatory Transfers 1,969,906 3,774,379 5,347,370 1,572,991 41.7 %
Total Expenditures and Transfers 7,237,165$ 7,008,794$ 8,674,712$ 1,665,918$ 23.8 %
Fund Balance Addition/(Reduction) (311,584)$ 6,316$ 7,200$
BOOKSTORESRevenues 23,331,077$ 24,041,110$ 25,140,352$ 1,099,242$ 4.6 %
Expenditures and TransfersExpenditures 17,678,024$ 21,718,606$ 22,780,059$ 1,061,453$ 4.9 %
Mandatory Transfers 109,418 109,418 - 0.0 %
Non-Mandatory Transfers 2,977,726 2,214,086 2,251,875 37,789 1.7 %
Total Expenditures and Transfers 20,655,750$ 24,042,110$ 25,141,352$ Fund Balance Addition/(Reduction) 2,675,327$ (1,000)$ (1,000)$
PARKINGRevenues 11,920,037$ 13,415,322$ 13,674,259$ 258,937$ 1.9 %
Expenditures and TransfersExpenditures 6,674,207$ 8,869,585$ 8,234,739$ (634,846)$ (7.2) %
Mandatory Transfers 2,868,245 3,129,222 4,314,704 Non-Mandatory Transfers 1,649,369 1,416,515 1,124,816 (291,699) (20.6) %
Total Expenditures and Transfers 11,191,821$ 13,415,322$ 13,674,259$ 258,937$ 1.9 %
Fund Balance Addition/(Reduction) 728,217$ -$ -$
ATHLETICSRevenues 119,478,992$ 119,077,900$ 128,819,870$ 9,741,970 8.2 %
Expenditures and TransfersExpenditures 93,620,169$ 98,382,653$ 104,216,618$ 5,833,965 5.9 %
Mandatory Transfers 14,876,219 16,351,362 17,446,238 1,094,876 6.7 %
Non-Mandatory Transfers 7,157,162 4,343,885 7,157,014 2,813,129 64.8 %
Total Expenditures and Transfers 115,653,549$ 119,077,900$ 128,819,870$ 9,741,970$ 8.2 %
Fund Balance Addition/(Reduction) 3,825,442$
OTHERRevenues 3,989,351$ 4,473,369$ 4,081,859$ (391,510)$ (8.8) %
Expenditures and TransfersExpenditures 3,492,841$ 4,520,179$ 4,129,553$ (390,626)$ (8.6) %
Mandatory TransfersNon-Mandatory Transfers 131,213 (41,494) (41,494) Total Expenditures and Transfers 3,624,054$ 4,478,685$ 4,088,059$ (390,626)$ (8.7) %
Fund Balance Addition/(Reduction) 365,297$ (5,316)$ (6,200)$
TOTALRevenues 229,998,450$ 229,780,481$ 245,962,927$ 16,182,446$ 7.0 %
Expenditures and TransfersExpenditures 162,487,928$ 178,595,830$ 184,698,151$ 6,102,321$ 3.4 %
Mandatory Transfers 30,475,329 31,758,673 40,667,626 8,908,953 28.1 %
Non-Mandatory Transfers 27,175,191 19,425,978 20,597,150 1,171,172 6.0 %
Total Expenditures and Transfers 220,138,448$ 229,780,481$ 245,962,927$ 16,182,446$ 7.0 %
Fund Balance Addition/(Reduction) 9,860,002$
Schedule 13 - Auxiliaries
B-16

University of Tennessee System
E&G and Auxiliary Funds for Men's and Women's Athletics
CHANGEFY 2015 FY 2016 FY 2017 PROBABLE TO PROPOSED
ACTUAL PROBABLE PROPOSED AMOUNT %
KNOXVILLERevenues
General FundsStudent Fees for Athletics 1,000,000$ 1,000,000$ 1,000,000$ Ticket Sales 33,261,928 36,134,400 36,305,870 171,470$ 47.5% %Gifts 26,999,091 26,600,000 28,270,000 1,670,000 6.3 %Other 58,904,265 56,581,000 64,241,500 7,660,500 13.5 %
Total Revenues 120,165,284$ 120,315,400$ 129,817,370$ 9,501,970$ 7.9 %
Expenditures and Transfers Salaries and Benefits 36,643,532$ 38,162,300$ 40,930,535$ 2,768,235$ 7.3 %Travel 8,398,169 9,984,850 9,412,900 (571,950) (5.7) %Student Aid 12,073,467 14,933,293 15,201,137 267,844 1.8 %Other Operating 36,214,178 35,539,710 38,669,506 3,129,796 8.8 %
Subtotal Expenditures 93,329,346$ 98,620,153$ 104,214,078$ 5,593,925$ 5.7 %Debt Service Transfers 14,876,218 16,351,362 17,446,238 1,094,876 6.7 %Other Transfers 8,157,161 5,343,885 8,157,054 2,813,169 52.6 %
Total Expenditures and Transfers 116,362,725$ 120,315,400$ 129,817,370$ 9,501,970$ 7.9 %
Fund Balance Addition / (Reduction) 3,802,559$
CHATTANOOGARevenues
General Funds 6,983,916$ 6,539,990$ 6,582,279$ 42,289$ 0.6 %Student Fees for Athletics 4,739,714 4,991,503 4,991,503Ticket Sales 1,247,879 936,046 936,046Gifts 1,762,641 1,430,000 1,430,000Other 2,699,344 1,996,891 1,996,891
Total Revenues 17,433,494$ 15,894,430$ 15,936,719$ 42,289$ 0.3 %
Expenditures and Transfers Salaries and Benefits 6,492,471$ 6,447,161$ 6,457,161$ 10,000$ 0.2 %Travel 1,158,652 1,727,205 1,777,205 50,000 2.9 %Student Aid 4,963,231 5,036,936 5,144,225 107,289 2.1 %Other Operating 3,978,166 2,513,128 2,388,128 (125,000) (5.0) %
Subtotal Expenditures 16,592,520$ 15,724,430$ 15,766,719$ 42,289$ 0.3 %Debt Service Transfers 165,331 170,000 170,000Other Transfers
Total Expenditures and Transfers 16,757,851$ 15,894,430$ 15,936,719$ 42,289$ 0.3 %
Fund Balance Addition / (Reduction) 675,643$
MARTINRevenues
General Funds 6,001,947$ 5,756,707$ 6,058,494$ 301,787$ 5.2 %Student Fees for Athletics 1,792,141 2,244,000 2,244,000Ticket Sales 100,030 100,030 80,000 (20,030) (20.0) %Gifts 861,410 700,000 700,000Other 1,978,856 2,266,143 1,715,140 (551,003) (24.3) %
Total Revenues 10,734,384$ 11,066,880$ 10,797,634$ (269,246)$ (2.4) %
Expenditures and Transfers Salaries and Benefits 3,828,939$ 4,293,274$ 4,238,376$ (54,898)$ (1.3) %Travel 917,094 993,428 842,661 (150,767) (15.2) %Student Aid 4,282,212 4,134,658 4,164,658 30,000 0.7 %Other Operating 1,539,881 1,493,120 1,399,539 (93,581) (6.3) %
Subtotal Expenditures 10,568,126$ 10,914,480$ 10,645,234$ (269,246)$ (2.5) %Debt Service Transfers 193,071 152,400 152,400Other Transfers
Total Expenditures and Transfers 10,761,197$ 11,066,880$ 10,797,634$ (269,246)$ (2.4) %
Fund Balance Addition / (Reduction) (26,813)$
TOTAL ATHLETICSRevenues
General Funds 12,985,863$ 12,296,697$ 12,640,773$ 344,076$ 2.8 %Student Fees for Athletics 7,531,855 8,235,503 8,235,503Ticket Sales 34,609,837 37,170,476 37,321,916 151,440 0.4 %Gifts 29,623,142 28,730,000 30,400,000 1,670,000 5.8 %Other 63,582,465 60,844,034 67,953,531 7,109,497 11.7 %
Total Revenues 148,333,162$ 147,276,710$ 156,551,723$ 9,275,013$ 6.3 %
Expenditures and Transfers Salaries and Benefits 46,964,942$ 48,902,735$ 51,626,072$ 2,723,337$ 5.6 %Travel 10,473,915 12,705,483 12,032,766 (672,717) (5.3) %Student Aid 21,318,910 24,104,887 24,510,020 405,133 1.7 %Other Operating 41,732,225 39,545,958 42,457,173 2,911,215 7.4 %
Subtotal Expenditures 120,489,992$ 125,259,063$ 130,626,031$ 5,366,968$ 4.3 %Debt Service Transfers 15,234,620 16,673,762 17,768,638 1,094,876 6.6 %Other Transfers 8,157,161 5,343,885 8,157,054 2,813,169 52.6 %
Total Expenditures and Transfers 143,881,773$ 147,276,710$ 156,551,723$ 9,275,013$ 6.3 %
Fund Balance Addition / (Reduction) 4,451,389$
NOTES: Data includes unrestricted and restricted funds. Other revenue sources include NCAA conference income, tournament income, program salesconcessions, parkin, broadcasting, television,radio, internet, endowments, investments, royalties, advertisements, sponsorships, game guarantees,
Athletics FY 2017 Proposed Budget Summary
Schedule 14B-17

University of Tennessee SystemFY 2017 Proposed Budget Summary
Unrestricted Current Funds Revenues, Expenditures, and Transfers
CHANGEFY 2015 FY 2016 FY 2017 PROBABLE TO PROPOSED
ACTUALS PROBABLE PROPOSED AMOUNT %EDUCATIONAL AND GENERALRevenues
Tuition & Fees 615,545,784$ 648,037,768$ 669,787,108$ 21,749,340$ 3.4 %State Appropriations 474,247,612 498,639,749 526,665,549 28,025,800 5.6 %Grants & Contracts 46,798,665 44,650,266 44,529,714 (120,552) (0.3) %Sales & Service 60,095,439 57,790,642 57,832,737 42,095 0.1 %Other Sources 62,148,888 56,671,683 57,178,632 506,949 0.9 %
Total Revenues 1,258,836,388$ 1,305,790,108$ 1,355,993,740$ 50,203,632$ 3.8 %
Expenditures and TransfersInstruction 492,352,355$ 577,040,051$ 570,871,393$ (6,168,658)$ (1.1) %Research 83,487,974 110,072,752 73,583,021 (36,489,731) (33.2) %Public Service 71,365,049 87,106,681 80,557,849 (6,548,832) (7.5) %Academic Support 140,613,764 158,704,326 146,819,933 (11,884,393) (7.5) %Student Services 87,447,751 88,425,977 88,080,549 (345,428) (0.4) %Institutional Support 133,117,858 150,393,384 147,368,765 (3,024,619) (2.0) %Operation & Maintenace of Plant 125,493,000 135,781,740 139,190,009 3,408,269 2.5 %Scholarships & Fellowships 88,984,234 95,154,298 106,011,157 10,856,859 11.4 %
Subtotal Expenditures 1,222,861,986$ 1,402,679,209$ 1,352,482,676$ (50,196,533)$ (3.6) %Mandatory Transfers 7,702,456 9,096,143 8,589,891 (506,252) (5.6) %Non-Mandatory Transfers 26,736,499 (63,509,375) (4,305,613) 59,203,762 93.2 %
Total Expenditures & Transfers 1,257,300,941$ 1,348,265,977$ 1,356,766,954$ 8,500,977$ 0.6 %
Fund Balance Addition/(Reduction) 1,535,447$ (42,475,869)$ (773,214)$
AUXILIARIESRevenues 229,998,450$ 229,780,481$ 245,962,927$ 16,182,446$ 7.0 %Expenditures and Transfers
Expenditures 162,487,928 178,595,830 184,698,151 6,102,321 3.4 %Mandatory Transfers 30,475,329 31,758,673 40,667,626 8,908,953 28.1 %Non-Mandatory Transfers 27,175,190 19,425,978 20,597,150 1,171,172 6.0 %
Total Expenditures & Transfers 220,138,447$ 229,780,481$ 245,962,927$ 16,182,446$ 7.0 %Fund Balance Addition/(Reduction) 9,860,002$ -$ -$
TOTALSRevenues 1,488,834,838$ 1,535,570,589$ 1,601,956,667$ 66,386,078$ 4.3 %Expenditures and Transfers
Expenditures 1,385,349,915$ 1,581,275,039$ 1,537,180,827$ (44,094,212)$ (2.8) %Mandatory Transfers 38,177,785 40,854,816 49,257,517 8,402,701 20.6 %Non-Mandatory Transfers 53,911,689 (44,083,397) 16,291,537 60,374,934 137.0 %
Total Expenditures & Transfers 1,477,439,389$ 1,578,046,458$ 1,602,729,881$ 24,683,423$ 1.6 %Fund Balance Addition/(Reduction) 11,395,449$ (42,475,869)$ (773,214)$
Schedule 15 - UT TotalB-18

ChattanoogaFY 2017 Proposed Budget Summary
Unrestricted Current Funds Revenues, Expenditures, and Transfers
CHANGEFY 2015 FY 2016 FY 2017 PROBABLE TO PROPOSED
ACTUALS PROBABLE PROPOSED AMOUNT %EDUCATIONAL AND GENERALRevenues
Tuition & Fees 101,724,207$ 102,628,250$ 102,981,384$ 353,134$ 0.3 %State Appropriations 38,442,081 42,640,805 46,639,305 3,998,500 9.4 %Grants & Contracts 802,628 662,845 453,856 (208,989) (31.5) %Sales & Service 5,757,143 5,088,679 5,088,679 Other Sources 266,489 239,500 239,500
Total Revenues 146,992,547$ 151,260,079$ 155,402,724$ 4,142,645$ 2.7 %
Expenditures and TransfersInstruction 58,758,457$ 65,562,795$ 66,516,644$ 953,849$ 1.5 %Research 2,789,532 3,221,033 2,129,881 (1,091,152) (33.9) %Public Service 2,353,088 2,731,245 2,626,075 (105,170) (3.9) %Academic Support 13,826,644 15,880,732 12,412,821 (3,467,911) (21.8) %Student Services 26,043,300 24,389,350 24,191,095 (198,255) (0.8) %Institutional Support 10,226,361 12,740,739 12,025,960 (714,779) (5.6) %Operation & Maintenance of Plant 14,811,159 19,775,690 20,422,813 647,123 3.3 %Scholarships & Fellowships 11,572,385 12,521,220 12,646,432 125,212 1.0 %
Subtotal Expenditures 140,380,925$ 156,822,804$ 152,971,721$ (3,851,083)$ (2.5) %Mandatory Transfers 688,528 667,115 874,165 207,050 31.0 %Non-Mandatory Transfers 5,558,862 (6,296,420) 1,490,258 7,786,678 123.7 %
Total Expenditures & Transfers 146,628,315$ 151,193,499$ 155,336,144$ 4,142,645$ 2.7 %Fund Balance Addition/(Reduction) 364,233$ 66,580$ 66,580$
AUXILIARIESRevenues 15,146,190$ 14,318,863$ 14,184,296$ (134,567)$ (0.9) %Expenditures and Transfers
Expenditures 9,768,772 10,495,305 10,360,738 (134,567) (1.3) %Mandatory Transfers 1,376,244 1,803,780 1,803,780 Non-Mandatory Transfers 3,875,617 2,019,778 2,019,778
Total Expenditures & Transfers 15,020,633$ 14,318,863$ 14,184,296$ (134,567)$ (0.9) %Fund Balance Addition/(Reduction) 125,557$
TOTALSRevenues 162,138,737$ 165,578,942$ 169,587,020$ 4,008,078$ 2.4 %Expenditures and Transfers
Expenditures 150,149,697$ 167,318,109$ 163,332,459$ (3,985,650)$ (2.4) %Mandatory Transfers 2,064,772 2,470,895 2,677,945 207,050 8.4 %Non-Mandatory Transfers 9,434,479 (4,276,642) 3,510,036 7,786,678 182.1 %
Total Expenditures & Transfers 161,648,948$ 165,512,362$ 169,520,440$ 4,008,078$ 2.4 %Fund Balance Addition/(Reduction) 489,789$ 66,580$ 66,580$
Schedule 15 - UTCB-19

KnoxvilleFY 2017 Proposed Budget Summary
Unrestricted Current Funds Revenues, Expenditures, and Transfers
CHANGEFY 2015 FY 2016 FY 2017 PROBABLE TO PROPOSED
ACTUALS PROBABLE PROPOSED AMOUNT %EDUCATIONAL AND GENERALRevenues
Tuition & Fees 363,293,977$ 391,725,353$ 407,278,045$ 15,552,692$ 4.0 %State Appropriations 182,310,443 191,207,355 202,644,855 11,437,500 6.0 %Grants & Contracts 25,913,526 22,560,000 22,560,000 Sales & Service 7,348,472 5,780,775 5,538,268 (242,507) (4.2) %Other Sources 12,751,006 11,610,693 11,708,857 98,164 0.8 %
Total Revenues 591,617,424$ 622,884,176$ 649,730,025$ 26,845,849$ 4.3 %
Expenditures and TransfersInstruction 234,529,087$ 283,165,480$ 282,648,112$ (517,368)$ (0.2) %Research 32,520,982 44,908,490 23,457,198 (21,451,292) (47.8) %Public Service 12,506,281 14,129,360 12,650,139 (1,479,221) (10.5) %Academic Support 65,409,954 71,324,950 71,624,930 299,980 0.4 %Student Services 43,849,688 44,908,408 45,150,420 242,012 0.5 %Institutional Support 44,966,990 49,904,670 49,882,809 (21,861) 0.0 %Operation & Maintenance of Plant 60,939,574 72,766,124 74,657,889 1,891,765 2.6 %Scholarships & Fellowships 59,826,184 64,228,188 74,811,428 10,583,240 16.5 %
Subtotal Expenditures 554,548,740$ 645,335,670$ 634,882,925$ (10,452,745)$ (1.6) %Mandatory Transfers 1,745,964 1,645,162 747,685 (897,477) (54.6) %Non-Mandatory Transfers 35,170,885 (24,096,656) 14,099,415 38,196,071 158.5 %
Total Expenditures & Transfers 591,465,589$ 622,884,176$ 649,730,025$ 26,845,849$ 4.3 %Fund Balance Addition/(Reduction) 151,835$
AUXILIARIESRevenues 203,163,591$ 202,976,598$ 219,639,669$ 16,663,071$ 8.2 %Expenditures and Transfers
Expenditures 145,086,602 158,643,562 165,632,322 6,988,760 4.4 %Mandatory Transfers 26,224,698 27,545,274 36,451,629 8,906,355 32.3 %Non-Mandatory Transfers 22,381,046 16,787,762 17,555,718 767,956 4.6 %
Total Expenditures & Transfers 193,692,346$ 202,976,598$ 219,639,669$ 16,663,071$ 8.2 %Fund Balance Addition/(Reduction) 9,471,244$
TOTALSRevenues 794,781,015$ 825,860,774$ 869,369,694$ 43,508,920$ 5.3 %Expenditures and Transfers
Expenditures 699,635,342$ 803,979,232$ 800,515,247$ (3,463,985)$ (0.4) %Mandatory Transfers 27,970,662 29,190,436 37,199,314 8,008,878 27.4 %Non-Mandatory Transfers 57,551,931 (7,308,894) 31,655,133 38,964,027 533.1 %
Total Expenditures & Transfers 785,157,935$ 825,860,774$ 869,369,694$ 43,508,920$ 5.3 %Fund Balance Addition/(Reduction) 9,623,079$
Schedule 15 - UTKB-20

MartinFY 2017 Proposed Budget Summary
Unrestricted Current Funds Revenues, Expenditures, and Transfers
CHANGEFY 2015 FY 2016 FY 2017 PROBABLE TO PROPOSED
ACTUALS PROBABLE PROPOSED AMOUNT %EDUCATIONAL AND GENERALRevenues
Tuition & Fees 58,905,450$ 58,973,560$ 61,178,912$ 2,205,352$ 3.7 %State Appropriations 27,025,867 28,686,097 31,478,597 2,792,500 9.7 %Grants & Contracts 146,425 158,000 158,000 Sales & Service 3,796,159 3,908,376 3,427,102 (481,274) (12.3) %Other Sources 718,300 638,000 638,000
Total Revenues 90,592,200$ 92,364,033$ 96,880,611$ 4,516,578$ 4.9 %
Expenditures and TransfersInstruction 40,166,959$ 43,981,961$ 43,155,226$ (826,735)$ (1.9) %Research 407,381 423,875 311,385 (112,490) (26.5) %Public Service 593,974 658,925 575,828 (83,097) (12.6) %Academic Support 10,036,931 11,275,488 11,416,305 140,817 1.2 %Student Services 11,145,821 12,479,185 12,418,501 (60,684) (0.5) %Institutional Support 5,250,056 6,481,262 6,630,482 149,220 2.3 %Operation & Maintenance of Plant 11,224,479 11,298,918 11,794,323 495,405 4.4 %Scholarships & Fellowships 8,305,036 9,148,234 9,301,864 153,630 1.7 %
Subtotal Expenditures 87,130,639$ 95,747,848$ 95,603,914$ (143,934)$ (0.2) %Mandatory Transfers 661,576 626,148 626,148 Non-Mandatory Transfers 1,584,444 (4,009,963) 650,549 4,660,512 116.2 %
Total Expenditures & Transfers 89,376,659$ 92,364,033$ 96,880,611$ 4,516,578$ 4.9 %Fund Balance Addition/(Reduction) 1,215,541$
AUXILIARIESRevenues 10,111,015$ 10,594,992$ 10,192,740$ (402,252)$ (3.8) %Expenditures and Transfers
Expenditures 6,264,028 7,678,421 7,129,369 (549,052) (7.2) %Mandatory Transfers 2,505,713 2,041,717 2,041,717 Non-Mandatory Transfers 1,068,833 874,854 1,021,654 146,800 16.8 %
Total Expenditures & Transfers 9,838,574$ 10,594,992$ 10,192,740$ (402,252)$ (3.8) %Fund Balance Addition/(Reduction) 272,440$
TOTALSRevenues 100,703,215$ 102,959,025$ 107,073,351$ 4,114,326$ 4.0 %Expenditures and Transfers
Expenditures 93,394,667$ 103,426,269$ 102,733,283$ (692,986)$ (0.7) %Mandatory Transfers 3,167,289 2,667,865 2,667,865 Non-Mandatory Transfers 2,653,277 (3,135,109) 1,672,203 4,807,312 153.3 %
Total Expenditures & Transfers 99,215,233$ 102,959,025$ 107,073,351$ 4,114,326$ 4.0 %Fund Balance Addition/(Reduction) 1,487,982$
Schedule 15 - UTMB-21

Space InstituteFY 2017 Proposed Budget Summary
Unrestricted Current Funds Revenues, Expenditures, and Transfers
CHANGEFY 2015 FY 2016 FY 2017 PROBABLE TO PROPOSED
ACTUALS PROBABLE PROPOSED AMOUNT %EDUCATIONAL AND GENERALRevenues
Tuition & Fees 1,365,881$ 1,293,235$ 1,323,000$ 29,765$ 2.3 %
State Appropriations 8,012,212 8,286,603 8,578,403 291,800$ 3.5 %
Grants & Contracts 251,580 254,926 290,000 35,074 13.8 %
Sales & ServiceOther Sources 36,446 19,384 (19,384) (100.0) %
Total Revenues 9,666,119$ 9,854,148$ 10,191,403$ 337,255$ 3.4 %
Expenditures and TransfersInstruction 4,175,856$ 4,704,362$ 5,014,243$ 309,881$ 6.6 %
Research 1,444,985 1,700,009 609,360 (1,090,649) (64.2) %Public ServiceAcademic Support 258,219 543,118 527,194 (15,924) (2.9) %Student Services 94,020 74,191 76,048 1,857 2.5 %
Institutional Support 1,476,377 1,376,288 1,509,508 133,220 9.7 %
Operation & Maintenance of Plant 2,214,874 1,977,013 2,024,659 47,646 2.4 %
Scholarships & Fellowships 235,139 290,564 288,891 (1,673) (0.6) %Subtotal Expenditures 9,899,470$ 10,665,545$ 10,049,903$ (615,642)$ (5.8) %
Mandatory TransfersNon-Mandatory Transfers (263,564) (811,397) 141,500 952,897 117.4 %
Total Expenditures & Transfers 9,635,906$ 9,854,148$ 10,191,403$ 337,255$ 3.4 %
Fund Balance Addition/(Reduction) 30,213$
AUXILIARIESRevenues 175,895$ 178,850$ 215,000$ 36,150$ 20.2 %
Expenditures and TransfersExpenditures 330,237 254,266 215,000 (39,266)$ (15.4) %Mandatory TransfersNon-Mandatory Transfers (161,737) (75,416) - 75,416 100.0 %
Total Expenditures & Transfers 168,500$ 178,850$ 215,000$ 36,150$ 20.2 %
Fund Balance Addition/(Reduction) 7,395$
TOTALSRevenues 9,842,014$ 10,032,998$ 10,406,403$ 373,405$ 3.7 %
Expenditures and TransfersExpenditures 10,229,707$ 10,919,811$ 10,264,903$ (654,908)$ (6.0) %Mandatory TransfersNon-Mandatory Transfers (425,301) (886,813) 141,500 1,028,313 116.0 %
Total Expenditures & Transfers 9,804,406$ 10,032,998$ 10,406,403$ 373,405$ 3.7 %
Fund Balance Addition/(Reduction) 37,608$
Schedule 15 - UTSIB-22

Health Science CenterFY 2017 Proposed Budget Summary
Unrestricted Current Funds Revenues, Expenditures, and Transfers
CHANGEFY 2015 FY 2016 FY 2017 PROBABLE TO PROPOSED
ACTUALS PROBABLE PROPOSED AMOUNT %EDUCATIONAL AND GENERALRevenues
Tuition & Fees 78,753,143$ 81,951,644$ 84,640,459$ 2,688,815$ 3.3 %
State Appropriations 129,958,440 135,671,921 140,995,421 5,323,500 3.9 %
Grants & Contracts 14,969,407 16,772,027 16,865,745 93,718 0.6 %
Sales & Service 19,678,231 20,007,554 20,204,135 196,581 1.0 %
Other Sources 2,531,675 2,916,908 2,998,238 81,330 2.8 %Total Revenues 245,890,897$ 257,320,054$ 265,703,998$ 8,383,944$ 3.3 %
Expenditures and TransfersInstruction 126,169,173$ 145,070,751$ 138,570,757$ (6,499,994)$ (4.5) %Research 7,185,683 12,851,852 7,653,398 (5,198,454) (40.4) %Public Service 25,577 71,100 70,276 (824) (1.2) %Academic Support 42,692,206 51,154,807 42,655,010 (8,499,797) (16.6) %Student Services 6,314,922 6,574,843 6,244,485 (330,358) (5.0) %Institutional Support 24,373,093 28,183,824 23,817,362 (4,366,462) (15.5) %Operation & Maintenance of Plant 32,872,246 26,774,642 27,052,230 277,588 1.0 %
Scholarships & Fellowships 9,032,008 8,906,637 8,923,087 16,450 0.2 %Subtotal Expenditures 248,664,908$ 279,588,456$ 254,986,605$ (24,601,851)$ (8.8) %
Mandatory Transfers 4,077,472 6,022,718 6,206,893 184,175 3.1 %
Non-Mandatory Transfers (1,753,146) 4,151,800 4,510,500 358,700 8.6 %Total Expenditures & Transfers 250,989,234$ 289,762,974$ 265,703,998$ (24,058,976)$ (8.3) %
Fund Balance Addition/(Reduction) (5,098,337)$ (32,442,920)$
AUXILIARIESRevenues 1,401,760$ 1,711,178$ 1,731,222$ 20,044$ 1.2 %
Expenditures and TransfersExpenditures 1,038,289 1,524,276 1,360,722 (163,554) (10.7) %Mandatory Transfers 368,674 367,902 370,500 2,598 0.7 %
Non-Mandatory Transfers 11,431 (181,000) 181,000 100.0 %Total Expenditures & Transfers 1,418,394$ 1,711,178$ 1,731,222$ 20,044$ 1.2 %
Fund Balance Addition/(Reduction) (16,634)$
TOTALSRevenues 247,292,657$ 259,031,232$ 267,435,220$ 8,403,988$ 3.2 %
Expenditures and TransfersExpenditures 249,703,197$ 281,112,732$ 256,347,327$ (24,765,405)$ (8.8) %Mandatory Transfers 4,446,146 6,390,620 6,577,393 186,773 2.9 %
Non-Mandatory Transfers (1,741,715) 3,970,800 4,510,500 539,700 13.6 %Total Expenditures & Transfers 252,407,628$ 291,474,152$ 267,435,220$ (24,038,932)$ (8.2) %
Fund Balance Addition/(Reduction) (5,114,971)$ (32,442,920)$
Schedule 15 - UTHSCB-23

Institute of Agriculture TotalFY 2017 Proposed Budget Summary
Unrestricted Current Funds Revenues, Expenditures, and Transfers
CHANGEFY 2015 FY 2016 FY 2017 PROBABLE TO PROPOSED
ACTUALS PROBABLE PROPOSED AMOUNT %EDUCATIONAL AND GENERALRevenues
Tuition & Fees 11,503,126$ 11,465,726$ 12,385,308$ 919,582$ 8.0 %State Appropriations 73,768,007 76,809,564 80,032,064 3,222,500 4.2 %Grants & Contracts 4,393,533 4,023,071 4,018,071 (5,000) (0.1) %Sales & Service 23,515,434 23,005,258 23,574,553 569,295 2.5 %Other Sources 19,762,802 16,350,710 16,328,486 (22,224) (0.1) %
Total Revenues 132,942,901$ 131,654,329$ 136,338,482$ 4,684,153$ 3.6 %
Expenditures and TransfersInstruction 28,552,824$ 34,554,702$ 34,966,411$ 411,709$ 1.2 %Research 38,899,428 46,717,493 39,171,799 (7,545,694) (16.2) %Public Service 40,853,462 54,093,834 47,393,012 (6,700,822) (12.4) %Academic Support 8,126,846 8,247,558 7,916,520 (331,038) (4.0) %Student ServicesInstitutional Support 2,330,160 2,664,536 2,599,599 (64,937) (2.4) %Operation & Maintenance of Plant 3,430,670 3,189,353 3,238,095 48,742 1.5 %Scholarships & Fellowships 13,481 59,455 39,455 (20,000) (33.6) %
Subtotal Expenditures 122,206,870$ 149,526,931$ 135,324,891$ (14,202,040)$ (9.5) %Mandatory Transfers 437,348 Non-Mandatory Transfers 8,475,325 (8,227,354) 1,644,200 9,871,554 120.0 %
Total Expenditures & Transfers 131,119,543$ 141,299,577$ 136,969,091$ (4,330,486)$ (3.1) %Fund Balance Addition/(Reduction) 1,823,359$ (9,645,248)$ (630,609)$
Schedule 15 - UT AG TOTALB-24

Agricultural Experiment StationFY 2017 Proposed Budget Summary
Unrestricted Current Funds Revenues, Expenditures, and Transfers
CHANGEFY 2015 FY 2016 FY 2017 PROBABLE TO PROPOSED
ACTUALS PROBABLE PROPOSED AMOUNT %EDUCATIONAL AND GENERALRevenues
Tuition & FeesState Appropriations 25,698,486$ 26,669,788$ 27,697,588$ 1,027,800$ 3.9 %
Grants & Contracts 2,699,009 2,343,384 2,343,384 Sales & Service 4,908,965 3,151,368 3,227,443 76,075 2.4 %
Other Sources 6,756,220 6,803,470 6,802,771 (699) 0.0 %Total Revenues 40,062,680$ 38,968,010$ 40,071,186$ 1,103,176$ 2.8 %
Expenditures and TransfersInstructionResearch 35,790,080 42,786,422$ 36,229,794$ (6,556,628)$ (15.3) %Public Service 58,453 Academic Support 1,677,959 1,696,410 1,701,637 5,227 0.3 %
Student ServicesInstitutional Support 920,143 1,149,904 1,119,012 (30,892) (2.7) %Operation & Maintenance of Plant 435,803 475,684 443,143 (32,541) (6.8) %Scholarships & Fellowships
Subtotal Expenditures 38,882,437$ 46,108,420$ 39,493,586$ (6,614,834)$ (14.3) %Mandatory TransfersNon-Mandatory Transfers 1,056,534 (7,157,888) 577,600 7,735,488 108.1 %
Total Expenditures & Transfers 39,938,971$ 38,950,532$ 40,071,186$ 1,120,654$ 2.9 %
Fund Balance Addition/(Reduction) 123,710$ 17,478$
Schedule 15 - AG EXPERB-25

UT ExtensionFY 2017 Proposed Budget Summary
Unrestricted Current Funds Revenues, Expenditures, and Transfers
CHANGEFY 2015 FY 2016 FY 2017 PROBABLE TO PROPOSED
ACTUALS PROBABLE PROPOSED AMOUNT %EDUCATIONAL AND GENERALRevenues
Tuition & FeesState Appropriations 31,195,267$ 32,406,617$ 33,903,617$ 1,497,000$ 4.6 %Grants & Contracts 756,352 705,000 700,000 (5,000) (0.7) %Sales & Service 4,402,890 5,379,927 5,362,638 (17,289) (0.3) %Other Sources 12,758,705 9,307,619 9,297,119 (10,500) (0.1) %
Total Revenues 49,113,214$ 47,799,163$ 49,263,374$ 1,464,211$ 3.1 %
Expenditures and TransfersInstruction 536,908$ 57,798$ (479,110)$ (89.2) %ResearchPublic Service 40,618,406$ 53,997,357 47,269,168 (6,728,189) (12.5) %Academic Support 822,411 902,131 907,131 5,000 0.6 %Student ServicesInstitutional Support 740,256 774,392 753,612 (20,780) (2.7) %Operation & Maintenance of PlantScholarships & Fellowships
Subtotal Expenditures 42,181,073$ 56,210,788$ 48,987,709$ (7,223,079)$ (12.8) %Mandatory TransfersNon-Mandatory Transfers 3,999,558 879,112 619,800 (259,312) (29.5) %
Total Expenditures & Transfers 46,180,631$ 57,089,900$ 49,607,509$ (7,482,391)$ (13.1) %Fund Balance Addition/(Reduction) 2,932,583$ (9,290,737)$ (344,135)$
Schedule 15 - UT EXTB-26

College of Veterinary MedicineFY 2017 Proposed Budget Summary
Unrestricted Current Funds Revenues, Expenditures, and Transfers
CHANGEFY 2015 FY 2016 FY 2017 PROBABLE TO PROPOSED
ACTUALS PROBABLE PROPOSED AMOUNT %EDUCATIONAL AND GENERALRevenues
Tuition & Fees 11,503,126$ 11,465,726$ 12,385,308$ 919,582$ 8.0 %State Appropriations 16,874,254 17,733,159 18,430,859 697,700 3.9 %Grants & Contracts 938,172 974,687 974,687 Sales & Service 14,203,579 14,473,963 14,984,472 510,509 3.5 %Other Sources 247,877 239,621 228,596 (11,025) (4.6) %
Total Revenues 43,767,008$ 44,887,156$ 47,003,922$ 2,116,766$ 4.7 %
Expenditures and TransfersInstruction 28,552,824$ 34,017,794$ 34,908,613$ 890,819$ 2.6 %Research 3,109,348 3,931,071 2,942,005 (989,066) (25.2) %Public Service 176,603 96,477 123,844 27,367 28.4 %Academic Support 5,626,476 5,649,017 5,307,752 (341,265) (6.0) %Student ServicesInstitutional Support 669,762 740,240 726,975 (13,265) (1.8) %Operation & Maintenance of Plant 2,994,867 2,713,669 2,794,952 81,283 3.0 %Scholarships & Fellowships 13,481 59,455 39,455 (20,000) (33.6) %
Subtotal Expenditures 41,143,360$ 47,207,723$ 46,843,596$ (364,127)$ (0.8) %Mandatory Transfers 437,348 Non-Mandatory Transfers 3,419,233 (1,948,578) 446,800 2,395,378 122.9 %
Total Expenditures & Transfers 44,999,941$ 45,259,145$ 47,290,396$ 2,031,251$ 4.5 %Fund Balance Addition/(Reduction) (1,232,934)$ (371,989)$ (286,474)$
Schedule 15 - VET MEDB-27

Institute for Public Service TotalFY 2017 Proposed Budget Summary
Unrestricted Current Funds Revenues, Expenditures, and Transfers
CHANGEFY 2015 FY 2016 FY 2017 PROBABLE TO PROPOSED
ACTUALS PROBABLE PROPOSED AMOUNT %EDUCATIONAL AND GENERALRevenues
Tuition & FeesState Appropriations 9,936,524$ 10,342,187$ 11,033,687$ 691,500$ 6.7 %Grants & Contracts 321,566 219,397 184,042 (35,355) (16.1) %Sales & ServiceOther Sources 7,100,662 7,229,853 7,598,916 369,063 5.1 %
Total Revenues 17,358,752$ 17,791,437$ 18,816,645$ 1,025,208$ 5.8 %
Expenditures and TransfersInstructionResearchPublic Service 15,032,667$ 15,422,217$ 17,242,519$ 1,820,302$ 11.8 %Academic Support 262,964 277,673 267,153 (10,520) (3.8) %Student ServicesInstitutional Support 934,964 772,442 935,651 163,209 21.1 %Operation & Maintenance of PlantScholarships & Fellowships
Subtotal Expenditures 16,230,595$ 16,472,332$ 18,445,323$ 1,972,991$ 12.0 %Mandatory TransfersNon-Mandatory Transfers 1,076,037 1,408,526 580,507 (828,019) (58.8) %
Total Expenditures & Transfers 17,306,632$ 17,880,858$ 19,025,830$ 1,144,972$ 6.4 %Fund Balance Addition/(Reduction) 52,120$ (89,421)$ (209,185)$
Schedule 15 - IPS TOTB-28

Institute for Public ServiceFY 2017 Proposed Budget Summary
Unrestricted Current Funds Revenues, Expenditures, and Transfers
CHANGEFY 2015 FY 2016 FY 2017 PROBABLE TO PROPOSED
ACTUALS PROBABLE PROPOSED AMOUNT %EDUCATIONAL AND GENERALRevenues
Tuition & FeesState Appropriations 5,265,298$ 5,439,285$ 5,639,985$ 200,700$ 3.7 %Grants & Contracts 301,450 191,622 156,267 (35,355) (18.5) %Sales & ServiceOther Sources 623,205 692,700 925,400 232,700 33.6 %
Total Revenues 6,189,953$ 6,323,607$ 6,721,652$ 398,045$ 6.3 %
Expenditures and TransfersInstructionResearchPublic Service 4,466,659$ 4,485,952$ 5,336,778$ 850,826$ 19.0 %Academic SupportStudent ServicesInstitutional Support 924,492 755,707 918,916 163,209 21.6 %Operation & Maintenance of PlantScholarships & Fellowships
Subtotal Expenditures 5,391,151$ 5,241,659$ 6,255,694$ 1,014,035$ 19.3 %Mandatory TransfersNon-Mandatory Transfers 803,828 1,188,533 465,958 (722,575) (60.8) %
Total Expenditures & Transfers 6,194,979$ 6,430,192$ 6,721,652$ 291,460$ 4.5 %Fund Balance Addition/(Reduction) (5,026)$ (106,585)$
Schedule 15 - IPSB-29

Municipal Technical Advisory ServiceFY 2017 Proposed Budget Summary
Unrestricted Current Funds Revenues, Expenditures, and Transfers
CHANGEFY 2015 FY 2016 FY 2017 PROBABLE TO PROPOSED
ACTUALS PROBABLE PROPOSED AMOUNT %EDUCATIONAL AND GENERALRevenues
Tuition & FeesState Appropriations 2,903,313$ 3,039,651$ 3,156,651$ 117,000$ 3.8 %Grants & Contracts 20,116 27,775 27,775 Sales & ServiceOther Sources 3,299,627 3,388,436 3,465,239 76,803 2.3 %
Total Revenues 6,223,056$ 6,455,862$ 6,649,665$ 193,803$ 3.0 %
Expenditures and TransfersInstructionResearchPublic Service 5,694,708$ 6,000,475$ 6,222,811$ 222,336$ 3.7 %Academic Support 262,964 277,673 267,153 (10,520) (3.8) %Student ServicesInstitutional Support 6,155 8,900 8,900 Operation & Maintenance of PlantScholarships & Fellowships
Subtotal Expenditures 5,963,827$ 6,287,048$ 6,498,864$ 211,816$ 3.4 %Mandatory TransfersNon-Mandatory Transfers 254,675 136,721 179,339 42,618 31.2 %
Total Expenditures & Transfers 6,218,502$ 6,423,769$ 6,678,203$ 254,434$ 4.0 %Fund Balance Addition/(Reduction) 4,554$ 32,093$ (28,538)$
Schedule 15 - MTASB-30

County Technical Assistance ServiceFY 2017 Proposed Budget Summary
Unrestricted Current Funds Revenues, Expenditures, and Transfers
CHANGEFY 2015 FY 2016 FY 2017 PROBABLE TO PROPOSED
ACTUALS PROBABLE PROPOSED AMOUNT %EDUCATIONAL AND GENERALRevenues
Tuition & FeesState Appropriations 1,767,913$ 1,863,251$ 2,237,051$ 373,800$ 20.1 %Grants & ContractsSales & ServiceOther Sources 3,177,830 3,148,717 3,208,277 59,560 1.9 %
Total Revenues 4,945,743$ 5,011,968$ 5,445,328$ 433,360$ 8.6 %
Expenditures and TransfersInstructionResearchPublic Service 4,871,300$ 4,935,790$ 5,682,930$ 747,140$ 15.1 %Academic SupportStudent ServicesInstitutional Support 4,317 7,835 7,835 Operation & Maintenance of PlantScholarships & Fellowships
Subtotal Expenditures 4,875,617$ 4,943,625$ 5,690,765$ 747,140$ 15.1 %Mandatory TransfersNon-Mandatory Transfers 17,534 83,272 (64,790) (148,062) (177.8)
Total Expenditures & Transfers 4,893,151$ 5,026,897$ 5,625,975$ 599,078$ 11.9 %Fund Balance Addition/(Reduction) 52,592$ (14,929)$ (180,647)$
Schedule 15 - CTASB-31

System AdministrationFY 2017 Proposed Budget Summary
Unrestricted Current Funds Revenues, Expenditures, and Transfers
CHANGEFY 2015 FY 2016 FY 2017 PROBABLE TO PROPOSED
ACTUALS PROBABLE PROPOSED AMOUNT %EDUCATIONAL AND GENERALRevenues
Tuition & FeesState Appropriations 4,794,038$ 4,995,217$ 5,263,217$ 268,000$ 5.4 %Grants & ContractsSales & ServiceOther Sources 18,981,510 17,666,635 17,666,635
Total Revenues 23,775,548$ 22,661,852$ 22,929,852$ 268,000$ 1.2 %
Expenditures and TransfersInstructionResearch 239,983$ 250,000$ 250,000$ Public ServiceAcademic SupportStudent ServicesInstitutional Support 43,559,856 48,269,623$ 49,967,394$ 1,697,771$ 3.5 %Operation & Maintenance of PlantScholarships & Fellowships
Subtotal Expenditures 43,799,839$ 48,519,623$ 50,217,394$ 1,697,771$ 3.5 %Mandatory Transfers 91,568 135,000 135,000 Non-Mandatory Transfers (23,112,344) (25,627,911) (27,422,542) (1,794,631) (7.0) %
Total Expenditures & Transfers 20,779,063$ 23,026,712$ 22,929,852$ (96,860)$ (0.4) %Fund Balance Addition/(Reduction) 2,996,484$ (364,860)$
Schedule 15 - UWAB-32
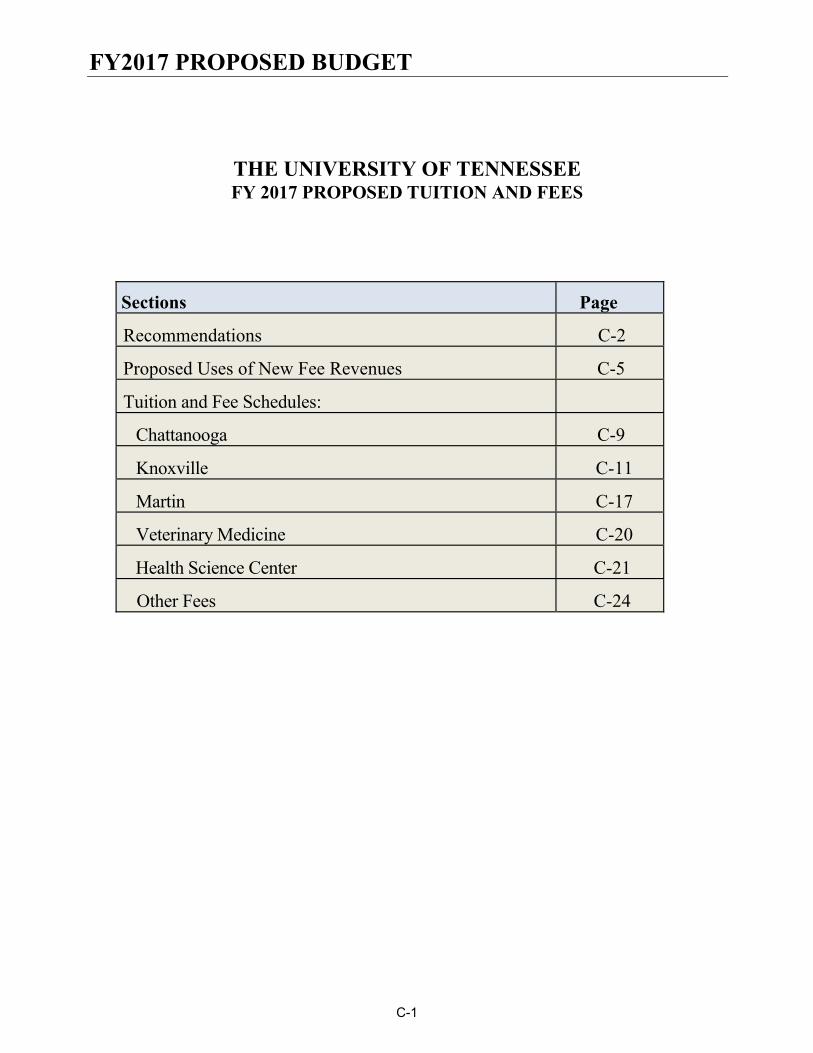
FY2017 PROPOSED BUDGET
THE UNIVERSITY OF TENNESSEE FY 2017 PROPOSED TUITION AND FEES
Sections Page
Recommendations C-2
Proposed Uses of New Fee Revenues C-5
Tuition and Fee Schedules:
Chattanooga C-9
Knoxville C-11
Martin C-17
Veterinary Medicine C-20
Health Science Center C-21
Other Fees C-24
C-1

FY2017 PROPOSED BUDGET
Recommendations
The FY 2017 recommended tuition1 and fee increases continue the effort to provide students a quality education while keeping the cost to students at a reasonable level. This section presents anticipated tuition and fee revenue growth that will result from the proposed fee adjustments recommended to the Board of Trustees for FY 2016-17. It is provided to inform Board members in their consideration of the university’s fee proposal. It includes revenue projections for specific fee changes at each campus and a discussion on how the additional revenues are planned to be used. This section does not address revenue changes related to enrollment changes and other factors that will occur if tuition and fee levels remain unchanged. More information can be found in the detailed fee proposal schedules presented to the Finance and Administration Committee at the Board’s annual meeting.
Revenues generated from the increases are used to fund:
Scholarships and tuition fee waivers
Enhancements to student services promoting student success and completion
UTK Top 25 reinvestments
New faculty lines, startups, and promotions
Facilities, equipment, and campus infrastructure
Salary adjustments
The recommended tuition and fee i ncreases are ba sed on considerable discussion with campus leadership. The administration recommends approval of the proposed tuition and fee increases and adjustments. All other required tuition and fees are recommended for continuation at their current amounts.
1 - For the purposes of this document, “tuition” refers to both maintenance fees and out-of-state tuition.
C-2

FY2017 PROPOSED BUDGET
MAINTENANCE FEES AND TUITION Recommended Percent Change
ACADEMIC UNITS
Maintenance Fee
Out-of-State Tuition
New Revenues
Chattanooga - Undergraduate and Graduate 2.2% 0.0% $ 1,587,720
Knoxville – Undergraduate 1 2.2% 0.0% 5,500,000 Knoxville – Graduate 4.0% 0.0%
Knoxville - College of Law 0.0% 0.0 % 0 Martin – Undergraduate (60 or More Credit) 2.2% (58.7%)
2,363,140 Martin – Undergraduate (Less than 60 Credit Hours – ‘Soar in Four’ Model) 2
NEW NEW
Martin – Graduate 3.0% (58.7%) Space Institute 4.0% 0.0% 36,000
Health Science Center 0.0% 0.0%
College of Medicine 0.0% 0.0% 0
College of Allied Health Sciences 0.0% 0.0% 0
College of Dentistry 0.0% 0.0% 0
College of Pharmacy 0.0% 0.0% 0 College of Nursing 0.0% 0.0% 0
Health Professions – Audiology and Pathology Program
2.2%
.7%
12,000
Graduate Health Sciences – Masters of Pharmacology Program
5.0%
3.3%
13,800
College of Veterinary Medicine 4.0% 0.2% 358,928 Total $ 9,871,588
In-state students pay only for the maintenance fee, which is commonly referred to as ‘in-state tuition’. Out-of-state students pay the maintenance fee plus out-of-state tuition. The combined amount of these two fees is commonly referred to as ‘out-of-state tuition’.
1 The maintenance fee for undergraduates in the 2013-14 cohort of the “15 for 4” program will increase by 3%. This follows the “15 for 4” phase-in model approved by the Board in June 2012. The resulting rate for this cohort is $228 lower than the students entering in or after fall 2014. FY2016-17 is the last year of that plan. 2 The “Soar in Four” program restructures the maintenance fee for undergraduates with less than 60 credit hours by using a full time class load of 15 hours per semester as its basis. This will allow the University of Tennessee at Martin to provide student-proposed services that significantly enhance the students’ abilities to graduate in four years or less.
C-3
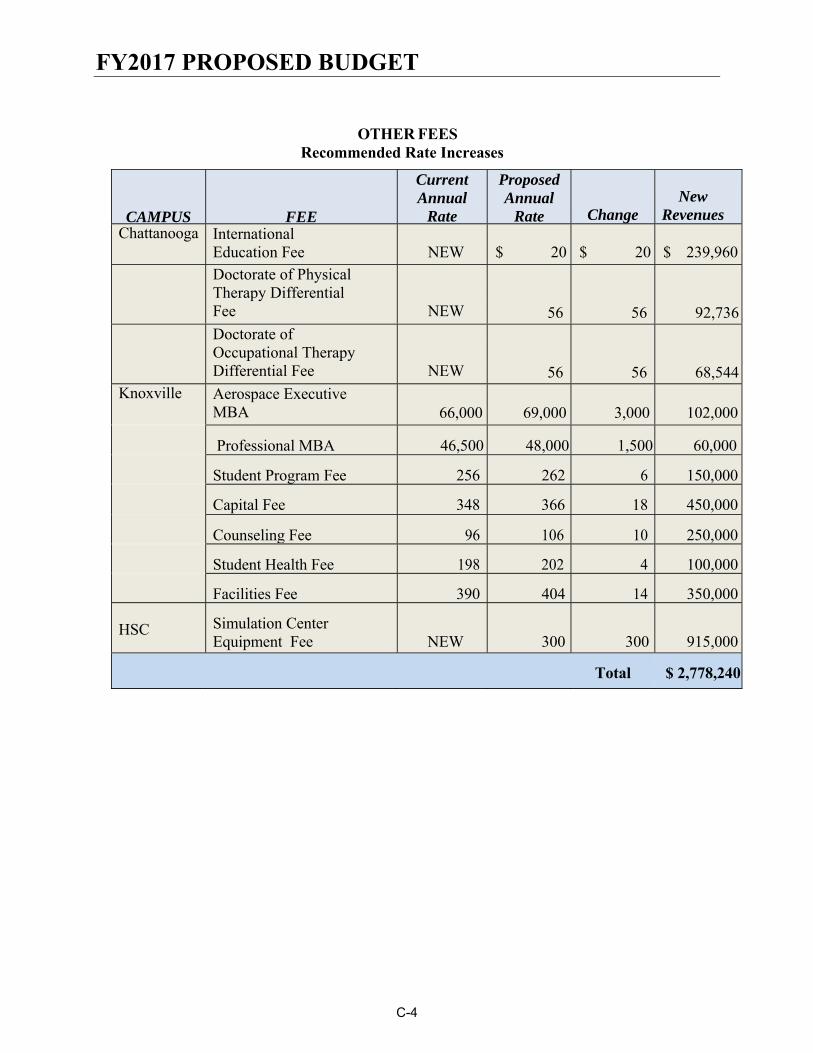
FY2017 PROPOSED BUDGET
OTHER FEES
Recommended Rate Increases
CAMPUS
FEE
Current Annual
Rate
Proposed Annual
Rate Change New
Revenues Chattanooga International
Education Fee
NEW $ 20
$ 20
$ 239,960
Doctorate of Physical Therapy Differential Fee
NEW
56
56
92,736
Doctorate of Occupational Therapy Differential Fee
NEW
56
56
68,544
Knoxville Aerospace Executive MBA
66,000
69,000
3,000
102,000
Professional MBA 46,500 48,000 1,500 60,000
Student Program Fee 256 262 6 150,000
Capital Fee 348 366 18 450,000
Counseling Fee 96 106 10 250,000
Student Health Fee 198 202 4 100,000
Facilities Fee 390 404 14 350,000
HSC
Simulation Center Equipment Fee
NEW
300
300
915,000
Total $ 2,778,240
C-4

FY2017 PROPOSED BUDGET
PROPOSED USES OF NEW REVENUES
UT CHATTANOOGA
Maintenance Fee – A 2.2 % increase generates $1.6 million in additional revenues. There is no increase for out-of-state tuition, but out-of-state students will pay their share of the maintenance fee increase. $745,000 of the increase is used to fund a portion of a 3% across the board salary and benefit increases. $200,000 is used to fund FLSA salary adjustments. $300,000 is used to fund scholarsh ips for the Gold Scholarship program. $200,000 is used for graduate assistantship stipends. $143,000 is used for phase 1 of the ‘Technology Refresh of Wireless Infrastructure’ program.
International Education Fee – This new fee generates $240,000 in support of the International Students office. In particular , the funds collected will be a resource for undergraduate and graduate st udents to fund a short-term , summer, semester-long, or year-long study abroad experience. This fee is modeled after sim ilar fees that are currently assessed at UT Knoxville and UT Martin.
Doctor of Physical Therapy Differential Fee – This new dif ferential fee will generate
$93,000 in FY 2016-17. These funds fully su pport current and fu ture enrollment increases, exceptional quality phy sical therapy education delivery, and elevated program costs. This increase is needed to be able to better sustain the program with equipment upgrades, quality instruction, and enhanced learni ng opportunities. B y approving the differential fee, the Physical Therapy lab fee and additional fees for CPR, liability insurance, exercise prescription software, and online clinical training will be terminated. The revenue reported is for the first year only. The revenue will increase in the out years as the program accepts new cohorts.
Doctorate of Occupational Therapy Differential Fee – This new dif ferential fee will
generate $69,000 in FY 2016-17. These funds will support all graduate courses and will supplement current and future enrollment increases and elevated program costs for this degree. Occupational Therapy program s regularly require prescriptive and sp ecific pedagogies that incur higher costs per credit hour than other disciplines offered at universities. By approving the differentia l fee, the Occupational Therap y lab fee and additional fees for CPR, liability insurance, HIPPA training, nam e badges and graduation banquets will be terminated. The revenue reported is for the first year only. The revenue will increase in the out years as the program accepts new cohorts.
Online Professional MBA Program – The Online Professional MBA Program will
increase 1.3% ($360) from $28,128 to $28,488.
C-5

FY2017 PROPOSED BUDGET
UT KNOXVILLE
Maintenance Fee – Knoxville proposes a 2.2% increase to the m aintenance fee for undergraduate students with the exception of students adm itted in fall 2013, spring 2014, and summer of 2014. The increase for these students is 3.0%, but the resulting maintenance fee is still lower than that for students admitted after the summer of 2014. The increase for graduate students (including UTSI) is 4.0%. There is no increase for out-of-state tuition, but out-of-state students will pay their share of the maintenance fee increase. The increase generates $5. 5 million in additional revenues. $2.3 m illion is used for institutionally funded scholarships to help keep the net cost of attendance as low as possible. $2.4 million will be used for campus support services tied to our Top 25 strategic reinvestm ent plans. $500,000 is allocated towards faculty start up commitments and academic hires and promotions; $100,000 will be used for operating expenses including contract escalations and new building costs; and $200,000 will be used for state mandated fee waivers.
Executive MBA Programs – The Executive MBA programs are self-funded and their fee revenues support faculty and staff time, technical support, program marketing costs, books, materials, and travel cost for international experiences. The increase in fees for the Executive MBA programs will generate $162,000 in additional revenue. These fees are often paid by the students’ employers.
Student Program and Service Fees (SPSF) – An increase in Student Program and Service
Fees will generate an increase of $950,000 in revenues. o Student Program Fee ($150,000) - This portion of the SPSF is charged per credit
hour and is used for annual salary increases and other operating expenses and equipment relating to student services, activities and programs, including student organized programming. These programs are organized and operated under the auspices of the Chief Student Affairs Officer.
o Capital Fee ($450,000) - This portion of the SPSF is charged per credit hour and is used for the acquisition, construction, installation, maintenance, or enhancement of any University property or facilities primarily used for non-instructional purposes, including the satisfaction of indebtedness. It is also used for the purchase of equipment to support student services, activities and programs organized or operated under the auspices of the Chief Student Affairs Officer.
o Counseling Fee ($250,000) - This portion of the SPSF is a per credit hour charge. $70,000 is used for annual salary increases; $180,000 for operating cost increases and new initiatives.
o Student Health Fee ($100,000) - This portion of the SPSF is a flat rate charge applied at the 9th credit hour. The $100,000 is used to fund annual salary increases.
o Other Dedicated Student F ees – An increase in the Facilities Fee will generate $350,000 for campus beautification, classroo m upgrades, and the cam pus contribution to new academic building projects. This increase applies to both in-state and out-of-state students.
C-6

FY2017 PROPOSED BUDGET
UT MARTIN
Maintenance Fee – The proposed increase in the maintenance fee results in net revenue gains of $2.3 m illion. This revenu e growth will be us ed for academ ic hires and promotions ($1.2 m illion); institutionally funded scholarships ($531,000); career development ($352,000); and tu toring, academic support, and operating exp ense increases ($241,000). The fee for full-time undergraduate students who have earned 60 or more credit hours will increase by 2.2%. The hourly rate for all part-tim e undergraduates regardless of credit hours earned will also in crease 2.2%. Graduate maintenance fees will increase 3.0%. Full-time students who have earned less than 60 credits hours will participate in the new ‘Soar in Four’ program. This proposed tuition restructuring will allow the university to provide student-proposed services that significantly enhance students’ abilities to graduate in f our years or less. The added cost of the program beyond the 2.2% inflationary modification is $610 per year (not including future adjustments) for full-time students and for that investment, for each year that students reduce their college enrollment, they avoid a cost of $22,058 (including average debt of $8,735) and gain a potential averag e salary of $37,140, a financial swing of $59,198. The plan, develo ped with students over f ive months of deliberation, invests directly in services the students decided were the highest priority for their progress to graduation and success as graduates.
Out-of-State Tuition – This fee will decrease 58.7% for dom estic undergraduate and graduate students. It will rem ain unchanged for international students. T he change to revenue is forecasted at $0, since the decrease in the rate will be offset by an increase in enrollment.
UT Online - Martin o Undergraduate – The course fee per credit hour (PCH) increases 2.1%, 2.2%, and
12.3%, respectively for In-State, Out-of-State domestic, and Out-of-state international students. (Out-of-state international is a new category of service with a rate set at 10% above Out-of-state domestic).
o Graduate – The course fee per credit hour (PCH) increases 3.0%, 3.1%, and 13.5%, respectively for In-State, Out-of-State domestic, and out-of-state international students. (Out-of-state international is a new category of service with a rate set at 10% above out-of-state domestic).
C-7
FY2017 PROPOSED BUDGET
UT HEALTH SCIENCE CENTER
Maintenance Fee – There is no general tuition increase proposed for this year. The only exceptions are a 5. 0% increase for the a College of Graduate Health Sciences (Masters of Pharm acology program) and 2.2% for Health Professions (Knoxville based Audiology & Speech Pathology program).
College of G raduate Health S ciences – A 5% increase for the MS Pharm acology program will generate $13,000. These funds will be used to supp ort research initiatives.
College of Health Professions – A 2.2% increase for the Knoxville based Audiology
& Speech Pathology program generate $12,000. These funds will be used to support research initiatives.
Student Program and Service Fees (SPSF) – A new Simulation Center Equipment Fee will be added to the SPSF, producing $915,000 is used for debt service on Simulation Center equipment. This fee will produce the bulk of HSC fee revenue growth in F Y 2017.
UT COLLEGE OF VETERINARY MEDICINE
Maintenance Fee and Out-of-state Tuition – There is a 4.0 % increase in the maintenance fee and a 0.2% increase in out-of-state tu ition which generates $360,000 in additional revenues. These new revenues will be used f or salary improvements, promotions, and tenure.
C-8

FY 2015-16 FY 2016-17 Amount Percent
IN-STATE
UndergraduateMaintenance Fee 6,624$ 6,768$ 144$ 2.2%Other Fees:
Student Programs and Services Fees * 660$ 660$ Athletics 480 480 Green 20 20Technology 250 250Library 50 50Transportation 72 96 24$ 33.3%Facilities 200 200International Education 20 20 NEW
Total Other Fees 1,732$ 1,776$ 44$ 2.5%Total Tuition and Fees 8,356$ 8,544$ 188$ 2.2%
GraduateMaintenance Fee 7,938$ 8,100$ 162$ 2.2%Other Fees: 1,732 1,776 44 2.5%Total Tuition and Fees 9,670$ 9,876$ 206$ 2.1%
UndergraduateMaintenance Fee 6,624$ 6,768$ 144$ 2.2%Out-of-State Tuition 16,118 16,118
Maintenance Fee & Out-of-State Tuition 22,742$ 22,886$ 144$ 0.6%Other Fees 1,732 1,776 44 2.5%
Total Tuition and Fees 24,474$ 24,662$ 188$ 0.8%
GraduateMaintenance Fee 7,938$ 8,100$ 162$ 2.2%Out-of-State Tuition 16,118 16,118
Maintenance Fee & Out-of-State Tuition 24,056$ 24,218$ 162$ 0.7%Other Fees 1,732$ 1,776$ 44$ 2.5%
Total Maintenance Fee & Out-of-State Tuition, and Other Fees 25,788$ 25,994$ 206$ 0.8%
* Student Programs and Services Fees detail are on page C-24.
The schedule above does not include differential fees assessed at $56 per credit hour for College of Business, School of Nursing, College of Engineering and Computer Science, and Doctorate programs for Physical Therapy and Occupational Therapy Courses. There is no cap on these fees.
University Fees are set by the Board of Trustees and are subject to change at any regular or called meeting of the Board.
ChattanoogaFY 2016-17 Annual Tuition and Fees
Maintenance Fee & TuitionCHANGE
OUT-OF-STATE
In-state students pay only for the maintenance fee, which is commonly referred to as 'in-state tuition'. Out-of-state studentspay the maintenance fee plus out-of-state tuition. The combined amount of these two fees is commonly referred to as 'out-of-state tuition'.
C-9

FY 2015-16 FY 2016-17 Amount Percent
2-YEAR PROGRAM - ChattanoogaExecutive MBA - In-State 44,000$ 44,000$ Executive MBA - Out-of-State 49,000 49,000
UT ONLINE - Chattanooga
UNDERGRADUATEIN-STATE
Course Fee 276$ 282$ 6$ 2.2%Online Support 56 56
Total 332$ 338$ 6$ 1.8%
OUT-OF-STATECourse Fee 302$ 308$ 6$ 2.0%Online Support 56 56
Total 358$ 364$ 6$ 1.7%
GRADUATEIN-STATE
Course Fee 441$ 450$ 9$ 2.2%Online Support 56 56
Total 497$ 506$ 9$ 1.8%
OUT-OF-STATECourse Fee 488$ 497$ 9$ 1.9%Online Support 56 56
Total 544$ 553$ 9$ 1.7%
ONLINE MBA PROGRAM *In-State 28,128$ 28,488$ 360$ 1.3%Out-of-State 28,128 28,488 360 1.3%
* Includes 2.2% increase for maintenance. No increase in out-of-state tuition. The online support fee has not changed. The School of Business differentail fee increased 2.2%.
University Fees are set by the Board of Trustees and are subject to change at any regular or called meeting of the Board.
ChattanoogaFY 2016-17 Annual Tuition and Fees
Executive MBA Programs and Online Fees
CHANGE
EXECUTIVE MBA PROGRAM
UT online course and support fees are charged per credit hour with no maximum credit hour cap on the distance campus. The online support fee also applies to each online credit hour taken by on-campus students.
C-10

FY 2015-16 FY 2016-17 Amount Percent
IN-STATEAdmitted before fall 2013
Maintenance Fee 9,028$ 9,228$ 200$ 2.2%Other Fees * 1,758 1,810 52 3.0%
Total Tuition and Fees 10,786$ 11,038$ 252$ 2.3%
Admitted fall 2013, spring 2014, or summer 2014Maintenance Fee 10,376$ 10,688$ 312$ 3.0%Other Fees * 1,758 1,810 52 3.0%
Total Tuition and Fees 12,134$ 12,498$ 364$ 3.0%
Admitted fall 2014 or laterMaintenance Fee 10,678$ 10,914$ 236$ 2.2%Other Fees * 1,758 1,810 52 3.0%
Total Tuition and Fees 12,436$ 12,724$ 288$ 2.3%
OUT-OF-STATE
Admitted before fall 2013Maintenance Fee 9,028$ 9,228$ 200$ 2.2%Out-of-State Tuition 18,190 18,190
Maintenance Fee & Out-of-State Tuition 27,218$ 27,418$ 200$ 0.7%Other Fees * 1,988 2,040 52 2.6%
Total Tuition and Fees 29,206$ 29,458$ 252$ 0.9%
Admitted fall 2013, spring 2014, or summer 2014Maintenance Fee 10,376$ 10,688$ 312$ 3.0%Out-of-State Tuition 18,190 18,190
Maintenance Fee & Out-of-State Tuition 28,566$ 28,878$ 312$ 1.1%Other Fees * 1,988 2,040 52 2.6%
Total Tuition and Fees 30,554$ 30,918$ 364$ 1.2%
Admitted fall 2014 or laterMaintenance Fee 10,678$ 10,914$ 236$ 2.2%Out-of-State Tuition 18,190 18,190
Maintenance Fee & Out-of-State Tuition 28,868$ 29,104$ 236$ 0.8%Other Fees * 1,988 2,040 52 2.6%
Total Tuition and Fees 30,856$ 31,144$ 288$ 0.9%
* Other fees details are on page C-12.
University Fees are set by the Board of Trustees and are subject to change at any regular or called meeting of the Board.
There is no summer school maximum for undergraduate students.
KnoxvilleFY 2016-17 Annual Tuition and Fees
Undergraduate Tuition and Fees
CHANGE
In-state students pay only for the maintenance fee, which is commonly referred to as ‘in-state tuition’. Out-of-state students pay the maintenance fee plus out-of-state tuition. The combined amount of these two fees is commonly referred to as ‘out-of-state tuition’.
The schedule above does not include differential fees assessed for certain courses: additional charge of $63 per credit hour for Engineering courses; additional charge of $130 per credit hour for 200, 300 and 400 level Nursing courses; additional charge of $97 per credit hour except for 100, 500, 600 level Business courses; and additional charge of $107 for the College of Architecture. There is no cap on these fees.
C-11

FY 2015-16 FY 2016-17 Amount Percent
Fall and Spring SemestersStudent Programs and Services Fees * 898$ 936$ 38$ 4.2%Technology 240 240Facilities 390 404 14 3.6%Transportation 150 150Library Fee 60 60International Education 20 20
Total Other Fees 1,758$ 1,810$ 52$ 3.0%
Summer Semester OnlyStudent Programs and Services Fees * 273$ 284$ 11$ 4.0%Technology 120 120 Facilities 195 202 7 3.6%Transportation 75 75Library Fee 30 30International Education 10 10
Total Other Fees 703$ 721$ 18$ 2.6%
Fall and Spring SemestersStudent Programs and Services Fees * 898$ 936$ 38$ 4.2%Technology 240 240 Facilities 620 634 14 2.3%Transportation 150 150Library Fee 60 60International Education 20 20
Total Other Fees 1,988$ 2,040$ 52$ 2.6%
Summer Semester OnlyStudent Programs and Services Fees * 273$ 284$ 11$ 4.0%Technology 120 120 Facilities 310 317 7 2.3%Transportation 75 75Library Fee 30 30International Education 10 10
Total Other Fees 818$ 836$ 18$ 2.2%
* Student programs and services fees detail are on page C-24.
University Fees are set by the Board of Trustees and are subject to change at any regular or called meeting of the Board.
Knoxville
Other Undergraduate Fee Details
CHANGE
IN-STATE
OUT-OF-STATE
FY 2016-17 Annual Tuition and Fees
C-12

FY 2015-16 FY 2016-17 Amount Percent
IN-STATEFall and Spring Semesters
Maintenance Fee 10,618$ 11,044$ 426$ 4.0%Other Fees:
Student Programs and Service Fees * 898$ 936$ 38$ 4.2%Technology 240 240Facilities 390 404 14$ 3.6%Transportation 150 150Library Fee 60 60
Total Other Fees 1,738$ 1,790$ 52$ 3.0%Total Tuition and Fees 12,356$ 12,834$ 478$ 3.9%
Summer Semester OnlyMaintenance Fee 5,309$ 5,522$ 213$ 4.0%
Other Fees:Student Programs and Service Fees 273 284 11 4.0%Technology 120 120Facilities 195 202 7 3.6%Transportation 75 75Library Fee 30 30
Total Other Fees 693$ 711$ 18$ 2.6%
Total Tuition and Fees 6,002$ 6,233$ 231$ 3.8%
OUT-OF-STATE Fall and Spring Semesters
Maintenance Fee 10,618$ 11,044$ 426$ 4.0%Out-of-State Tuition 18,188 18,188
Maintenance Fee & Out-of-State Tuition 28,806$ 29,232$ 426$ 1.5%Other Fees:
Student Programs and Service Fees * 898$ 936$ 38$ 4.2%Technology 240 240 Facilities 620 634 14 2.3%Transportation 150 150 Library Fee 60 60
Total Other Fees 1,968 2,020 52 2.6%Total Tuition and Fees 30,774$ 31,252$ 478$ 1.6%
Summer Semester OnlyMaintenance Fee 5,309$ 5,522$ 213$ 4.0%Out-of-State Tuition 9,094 9,094
Maintenance Fee & Out-of-State Tuition 14,403$ 14,616$ 213$ 1.5%Other Fees:Student Programs and Service Fees 273 284 11 4.0%Technology 120 120Facilities 310 317 7 2.3%Transportation 75 75Library Fee 30 30
Total Other Fees 808$ 826$ 18$ 2.2%
Total Tuition and Fees 15,211$ 15,442$ 231$ 1.5%
* Student programs and services fees detail are on page C-24.
In-state students pay only for the maintenance fee, which is commonly referred to as ‘in-state tuition’. Out-of-state students pay the maintenance fee plus out-of-state tuition. The combined amount of these two fees is commonly referred to as ‘out-of-state tuition’.
The schedule above does not include differential fees assessed for certain courses: additional charge of $63 per credit hour for Engineering courses; additional charge of $130 per credit hour for 200, 300 and 400 level Nursing courses; additional charge of $97 per credit hour except for 100, 500, 600 level Business courses; and additional charge of $107 for the College of Architecture. There is no cap on these fees.
University Fees are set by the Board of Trustees and are subject to change at any regular or called meeting of the Board.
FY 2016-17 Annual Tuition and Fees Knoxville
Graduate Student Tuition and Fees
CHANGE
C-13

CHANGE FY 2015-16 FY 2016-17 Amount
Master's Degree ProgramsMBA Programs
Full-Time MBA 15,400$ 15,400$ Senior Executive MBA 71,000 71,000 Aerospace Executive MBA ** 66,000 69,000 3,000$ Professional Executive MBA * 46,500 48,000 1,500 Physician Executive MBA 76,000 76,000 Global Supply Chain Executive MBA 85,000 85,000 Health Care Leadership MBA 65,000 65,000
Specialty Master's Degree ProgramsMasters of Science in Industrial Engineering 16,000$ 16,000$ Masters of Human Resource Management 3,000 3,000 Master of Business Analytics Program in Statistics, Operations, and Management Science 4,500 4,500 Master of Accountancy in Accounting and Information Management 4,500 4,500
* Effective August, 2017** Effective January, 2017
Distance Education - Knoxville(Distance Education Students Only)
Distance Education Support 46$ 46$
University Fees are set by the Board of Trustees and are subject to change at any regular or called meeting of the Board.
KnoxvilleFY 2016-17 Annual Tuition and Fees
Specialized Master's Programs and Distance Education
C-14

FY 2015-16 FY 2016-17 Amount Percent
IN-STATEMaintenance Fee 16,078$ 16,078$ Other Fees:
Student Programs and Services Fees * 898$ 936$ 38$ 4.2%Technology 240 240 Transportation 150 150Facilities 390 404 14 3.6%Law Library Fee 250 250Law Enhancement Fee 1,250 1,250
Total Other Fees 3,178$ 3,230$ 52$ 1.6%Total Tuition and Fees 19,256$ 19,308$ 52$ 0.3%
Summer Semester OnlyMaintenance Fee 5,364$ 5,364$ Other Fees:
Student Programs and Services Fees 273$ 284$ 11$ 4.0%Technology 120 120 Transportation 75 75 Facilities 195 202 7 3.6%
Total Other Fees 663$ 681$ 18$ 2.7%Total Tuition and Fees 6,027$ 6,045$ 18$ 0.3%
OUT-OF-STATEMaintenance Fee 16,078$ 16,078$ Out-of-State Tuition 18,444 18,444
Maintenance Fee & Out-of-State Tuition 34,522$ 34,522$ Other Fees:
Student Programs and Services Fees * 898$ 936$ 38$ 4.2%Technology 240 240 Transportation 150 150Facilities 620 634 14 2.3%Law Library 250 250Law Enhancement Fee 1,250 1,250
Total Other Fees 3,408$ 3,460$ 52$ 1.5%Total Tuition and Fees 37,930$ 37,982$ 52$ 0.1%
Summer Semester OnlyMaintenance Fee 5,364$ 5,364$ Out-of-State Tuition 6,145 6,145
Maintenance Fee & Out-of-State Tuition 11,509$ 11,509$ Other Fees:
Student Programs and Services Fees 273$ 284$ 11$ 4.0%Technology 120 120 Transportation 75 75 Facilities 310 317 7 2.3%
Total Other Fees 778$ 796$ 18$ 2.3%Total Tuition and Fees 12,287$ 12,305$ 18$ 0.1%
Students admitted prior to Fall 2013 are not assessed the $250 law enhancement fee.
* Student programs and services fees detail are on page C-24.
University Fees are set by the Board of Trustees and are subject to change at any regular or called meeting of the Board.
In-state students pay only for the maintenance fee, which is commonly referred to as ‘in-state tuition’. Out-of-state students pay the maintenance fee plus out-of-state tuition. The combined amount of these two fees is commonly referred to as ‘out-of-state tuition’.
KnoxvilleFY 2016-17 Annual Tuition and Fees
College of Law Tuition and Fees
CHANGE
C-15

FY 2015-16 FY 2016-17 Amount Percent
IN-STATEFall and Spring Semesters
Maintenance Fee 10,618$ 11,044$ 426$ 4.0%Other Fees:
Student Programs and Services Fees * 180$ 180$ Total Tuition and Fees 10,798$ 11,224$ 426$ 3.9%
Summer Semester OnlyMaintenance Fee 5,309$ 5,522$ 213$ 4.0%
Other Fees:Student Programs and Service Fees * 75 75
Total Tuition and Fees 5,384$ 5,597$ 213$ 4.0%
OUT-OF-STATE Fall and Spring Semesters
Maintenance Fee 10,618$ 11,044$ 426$ 4.0%Out-of-State Tuition 18,188 18,188
Maintenance Fee & Out-of-State Tuition 28,806$ 29,232$ 426$ 1.5%Other Fees:
Student Programs and Services Fees * 180$ 180$ Total Tuition and Fees 28,986$ 29,412$ 426$ 1.5%
Summer Semester OnlyMaintenance Fee 5,309$ 5,522$ 213$ 4.0%Out-of-State Tuition 9,094 9,094
Maintenance Fee & Out-of-State Tuition 14,403$ 14,616$ 213$ 1.5%Other Fees:Student Programs and Services Fees * 75 75
Total Tuition and Fees 14,478$ 14,691$ 213$ 1.5%
* Student Programs and Services Fees detail are on page C-24.
University Fees are set by the Board of Trustees and are subject to change at any regular or called meeting of the Board.
FY 2016-17 Annual Tuition and FeesKnoxville - Space Institute
Graduate Student Tuition and Fees
CHANGE
In-state students pay only for the maintenance fee, which is commonly referred to as ‘in-state tuition’. Out-of-state students pay the maintenance fee plus out-of-state tuition. The combined amount of these two fees is commonly referred to as ‘out-of-state tuition’.
The schedule above does not include differential fees assessed for certain courses: additional charge of $63 per credit hour for Engineering courses; additional charge of $130 per credit hour for 200, 300 and 400 level Nursing courses; additional charge of $97 per credit hour except for 100, 500, 600 level Business courses; and additional charge of $107 for the College of Architecture. There is no cap on these fees.
C-16
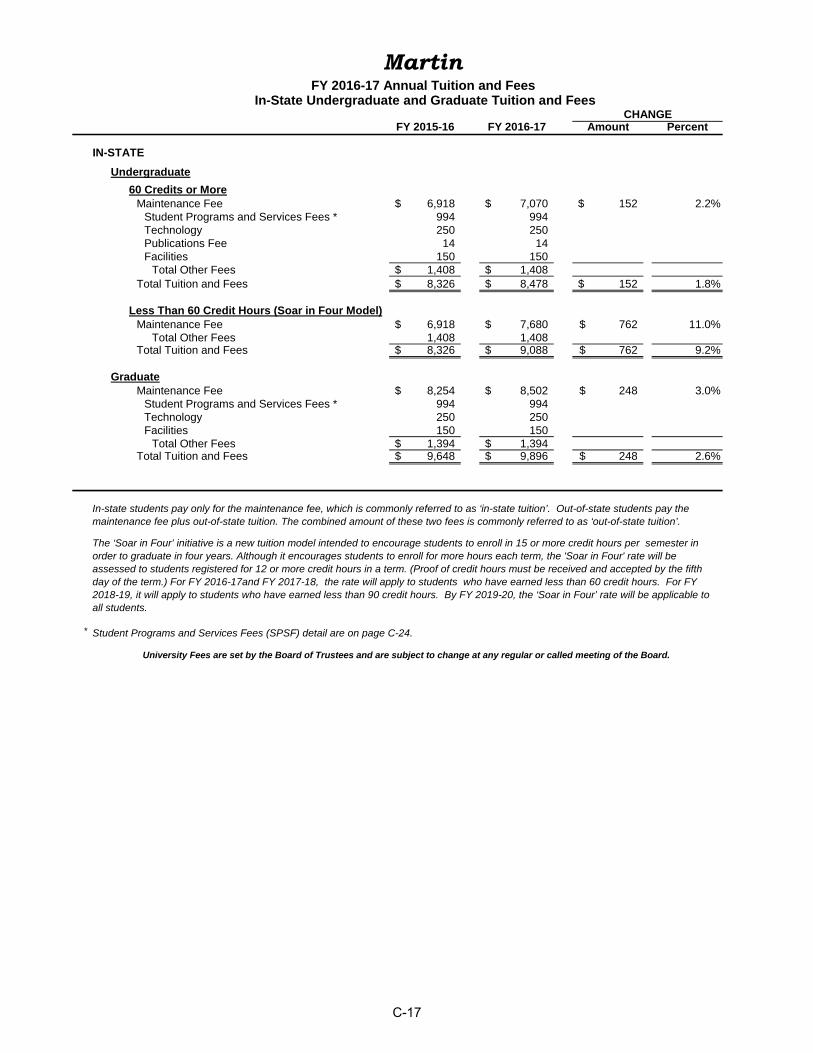
FY 2015-16 FY 2016-17 Amount Percent
IN-STATE
Undergraduate
60 Credits or MoreMaintenance Fee 6,918$ 7,070$ 152$ 2.2%
Student Programs and Services Fees * 994 994 Technology 250 250 Publications Fee 14 14Facilities 150 150
Total Other Fees 1,408$ 1,408$ Total Tuition and Fees 8,326$ 8,478$ 152$ 1.8%
Less Than 60 Credit Hours (Soar in Four Model)Maintenance Fee 6,918$ 7,680$ 762$ 11.0%
Total Other Fees 1,408 1,408 Total Tuition and Fees 8,326$ 9,088$ 762$ 9.2%
GraduateMaintenance Fee 8,254$ 8,502$ 248$ 3.0%
Student Programs and Services Fees * 994 994 Technology 250 250 Facilities 150 150
Total Other Fees 1,394$ 1,394$ Total Tuition and Fees 9,648$ 9,896$ 248$ 2.6%
* Student Programs and Services Fees (SPSF) detail are on page C-24.
University Fees are set by the Board of Trustees and are subject to change at any regular or called meeting of the Board.
MartinFY 2016-17 Annual Tuition and Fees
In-State Undergraduate and Graduate Tuition and FeesCHANGE
In-state students pay only for the maintenance fee, which is commonly referred to as ‘in-state tuition’. Out-of-state students pay the maintenance fee plus out-of-state tuition. The combined amount of these two fees is commonly referred to as ‘out-of-state tuition’.
The ‘Soar in Four’ initiative is a new tuition model intended to encourage students to enroll in 15 or more credit hours per semester in order to graduate in four years. Although it encourages students to enroll for more hours each term, the 'Soar in Four' rate will be assessed to students registered for 12 or more credit hours in a term. (Proof of credit hours must be received and accepted by the fifth day of the term.) For FY 2016-17and FY 2017-18, the rate will apply to students who have earned less than 60 credit hours. For FY 2018-19, it will apply to students who have earned less than 90 credit hours. By FY 2019-20, the ‘Soar in Four’ rate will be applicable to all students.
C-17

FY 2015-16 FY 2016-17 Amount Percent
Undergraduate60 Credit Hours or More
Maintenance Fee 6,918$ 7,070$ 152$ 2.2%Out-of-State Tuition 13,944 5,760 (8,184) -58.7%
Maintenance Fee & Out-of-State Tuition 20,862$ 12,830$ (8,032)$ -38.5%Other Fees * 1,408 1,408 Total Tuition and Fees 22,270$ 14,238$ (8,032)$ -36.1%
Less Than 60 Credit Hours (Soar in Four Model)Maintenance Fee 6,918$ 7,680$ 762$ 11.0%Out-of-State Tuition 13,944 5,760 (8,184) -58.7%
Maintenance Fee & Out-of-State Tuition 20,862$ 13,440$ (7,422)$ -35.6%Other Fees * 1,408 1,408 Total Tuition and Fees 22,270$ 14,848$ (7,422)$ -33.3%
Graduate
Maintenance Fee 8,254$ 8,502$ 248$ 3.0%Out-of-State Tuition 13,944 5,760 (8,184) -58.7%
Total Tuition and Fees 22,198$ 14,262$ (7,936)$ -35.8%
Other Fees * 1,394$ 1,394$ Total Tuition and Fees 23,592$ 15,656$ (7,936)$ -33.6%
Undergraduate60 Credit Hours or More
Maintenance Fee 6,918$ 7,070$ 152$ 2.2%Out-of-State Tuition 13,944 13,944
Maintenance Fee & Out-of-State Tuition 20,862$ 21,014$ 152$ 0.7%Other Fees * 1,408 1,408
Total Tuition and Fees 22,270$ 22,422$ 152$ 0.7%
Less Than 60 Credit Hours (Soar in Four Model)
Maintenance Fee 6,918$ 7,680$ 762$ 11.0%Out-of-State Tuition 13,944 13,944
Maintenance Fee & Out-of-State Tuition 20,862$ 21,624$ 762$ 3.7%Other Fees * 1,408 1,408
Total Tuition and Fees 22,270$ 23,032$ 762$ 3.4%
Graduate
Maintenance Fee 8,254$ 8,502$ 248$ 3.0%Out-of-State Tuition 13,944 13,944
Total Tuition and Fees 22,198$ 22,446$ 248$ 1.1%
Other Fees * 1,394$ 1,394$ Total Tuition and Fees 23,592$ 23,840$ 248$ 1.1%
Proof of credit hours must be received and accepted by the fifth day of the term.
* Other Fees details are on page C-17.
In-state students pay only for the maintenance fee, which is commonly referred to as ‘in-state tuition’. Out-of-state students pay the maintenance fee plus out-of-state tuition. The combined amount of these two fees is commonly referred to as ‘out-of-state tuition’.
The ‘Soar in Four’ initiative is a new tuition model intended to encourage students to enroll in 15 or more credit hours per semester in order to graduate in four years. Although it encourages students to enroll for more hours each term, the 'Soar in Four' rate will be assessed to students registered for 12 or more credit hours in a term. For FY 2016-17and FY 2017-18, the rate will apply to students who have earned less than 60 credit hours. For FY 2018-19, it will apply to students who have earned less than 90 credit hours. By FY 2019-20, the ‘Soar in Four’ rate will be applicable to all students.
University Fees are set by the Board of Trustees and are subject to change at any regular or called meeting of the Board.
MartinFY 2016-17 Annual Tuition and Fees
Out-Of-State Undergraduate and Graduate Tuition and FeesCHANGE
OUT-OF-STATE DOMESTIC
OUT-OF-STATE INTERNATIONAL
C-18

FY 2015-16 FY 2016-17 Amount Percent
UNDERGRADUATEIN-STATE
Course Fee 288$ 294$ 6$ 2.1%Online Support 56 56
Total 344$ 350$ 6$ 1.7%
OUT-OF-STATE DOMESTICCourse Fee 317$ 324$ 7$ 2.2%Online Support 56 56
Total 373$ 380$ 7$ 1.9%
OUT-OF-STATE INTERNATIONALCourse Fee 317$ 356$ 39$ 12.3%Online Support 56 56
Total $ 373 $ 412 $ 39 10.5%
GRADUATEIN-STATE
Course Fee 492$ 507$ 15$ 3.0%Online Support 56 56
Total 548$ 563$ 15$ 2.7%
OUT-OF-STATE DOMESTICCourse Fee 541$ 558$ 17$ 3.1%Online Support 56 56
Total 597$ 614$ 17$ 2.8%
OUT-OF-STATE INTERNATIONALCourse Fee 541$ 614$ 73$ 13.5%Online Support 56 56
Total 597$ 670$ 73$ 12.2%
University Fees are set by the Board of Trustees and are subject to change at any regular meeting of the Board.
MartinFY 2016-17 Annual Tuition and Fees
Online Fees
CHANGE
UT ONLINE - MartinUT online course fees are charged per credit hour with no maximum credit hour cap. This applies to all students, including on-campus students.
C-19

FY 2015-16 FY 2016-17 Amount Percent
IN-STATEMaintenance Fee 25,672$ 26,698$ 1,026$ 4.0%Other Fees:
Student Programs and Services Fees * 898$ 936$ 38$ 4.2%Technology 240 240Transportation 150 150Facilities 390 404 14 3.6%
Total Other Fees 1,678$ 1,730$ 52$ 3.1%Total Tuition and Fees 27,350$ 28,428$ 1,078$ 3.9%
Maintenance Fee 25,672$ 26,698$ 1,026$ 4.0%Out-of-State Tuition 27,800 27,842 42 0.2%
Maintenance Fee & Out-of-State Tuition 53,472$ 54,540$ 1,068$ 2.0%Other Fees
Student Programs and Services Fees * 898$ 936$ 38$ 4.2%Technology 240 240 Transportation 150 150 Facilities 620 634 14 2.3%
Total Other Fees 1,908$ 1,960$ 52$ 2.7%Total Tuition and Fees 55,380$ 56,500$ 1,120$ 2.0%
* Student program and services fees detail are on page C-24.
University Fees are set by the Board of Trustees and are subject to change at any regular or called meeting of the Board.
Veterinary MedicineFY 2016-17 Annual Tuition and Fees
Graduate Tuition and FeesCHANGE
OUT-OF-STATE
In-state students pay only for the maintenance fee, which is commonly referred to as ‘in-state tuition’. Out-of-state students paythe maintenance fee plus out-of-state tuition. The combined amount of these two fees is commonly referred to as ‘out-of-state tuition’.
C-20

FY 2015-16 FY 2016-17 Amount Percent
Graduate Health Sciences 10,484$ 10,484$ MS Pharmacology 15,000 15,750 750$ 5.0%
Medicine Class of 2017 - 2020 33,030$ 33,030$ Physician Assistant 14,560 14,560
Dentistry General DDS 29,016$ 29,016$ Transitional DDS 70,000 70,000 Dental Hygiene Bachelor of Science 7,848 7,848
Pharmacy 21,862$ 21,862$
Nursing Bachelors 8,320$ 8,320$ Graduate 12,210 12,210
Health Professions Entry Level Bachelor of Science
Medical Technology 7,848$ 7,848$ Audiology & Speech Pathology **** 9,028 9,228 200$ 2.2%
Entry Level Advanced Degrees * 13,084 13,084 Entry Lev Adv Degrees Audiology/Speech Path** 11,930 11,930 Post-Professional Degrees *** 9,484 9,484
Graduate Health Sciences 30,204$ 30,204$ MS Pharmacology 23,000 23,750 750$ 3.3%
Medicine Class of 2017 - 2020 65,460$ 65,460$ Physician Assistant 24,960 24,960
Dentistry General DDS 68,682$ 68,682$ Transitional DDS 70,000 70,000 Dental Hygiene Bachelor of Science 26,592 26,592
Pharmacy 42,214 42,214
Nursing Bachelors 24,960$ 24,960$ Graduate 29,432 29,432
Health Professions Entry Level Bachelor of Science
Medical Technology 26,592$ 26,592$ Audiology & Speech Pathology **** 27,218 27,418 200$ 0.7%
Entry Level Advanced Degrees * 31,514 31,514 Entry Lev Adv Degrees Audiology/Speech Path** 28,736 28,736 Post-Professional Degrees *** 27,944 27,944
* Entry Level Advanced Degrees ** Entry Level Advanced Degrees Audiology/Speech PathDoctor of Physical Therapy Doctor of AudiologyMaster of Cytopathology Master of Science in Speech-Language PathologyMaster of Occupational Therapy Transitional Doctor of Audiology
*** Post-Professional Degrees **** Bachelor of Audiology & Speech PathologyDoctor of Science in Physical Therapy This is a joint degree with UTK where UTHSC will teachMaster of Science in Physical Therapy the 4th year of the Bachelor's program but charge the UTKTransitional Doctor of Physical Therapy Tuition rate.Master of Science in Clinical Lab Sciences
University Fees are set by the Board of Trustees and are subject to change at any regular or called meeting of the Board.
NOTE: Programs & Services and other fees are listed on page C-22.
Health Science CenterFY 2016-17 Annual Tuition and Fees
Tuition and FeesCHANGE
IN-STATE
OUT-OF-STATE
C-21

CHANGEFY 2015-16 FY 2016-17 Amount
Student Programs & Services Fees * 600$ 900$ 300$ Technology Fee 240 240 Graduation/Yearbook 50 50
Total 890$ 1,190$ 300$
Other FeesHealth Insurance 2,420$ 2,536$ 116$ Disability Insurance 48 48 Malpractice Insurance
Medicine
Class of 2019 and 2020 24 24 Class of 2017 and 2018 72 72
Pharmacy 20 20 Nursing 20 20 Health Professions 20 20 Dentistry 18 18
Other Fees - Health Professions ** CHP OT Board Review Fee 150 150 CHP OT Media Fee 150 150
Other Fees - Nursing *** CON Pre-Licensure Digital Course Materials Fee-1st Term 2,136 2,200 64 CON Pre-Licensure Digital Course Materials Fee-2nd Term 876 865 (11) CON Pre-Licensure Digital Course Materials Fee-3rd Term 828 865 37 CON BSN Digital Course Materials Fee-1st Term 872 735 (137) CON BSN Digital Course Materials Fee-2nd Term 342 585 243 CON BSN Digital Course Materials Fee-3rd Term 302 (302) CON BSN Digital Course Materials Fee-4th Term 320 (320) CON CNL Digital Course Materials Fee 832 832 CON Nursing Kit 357 377 20 CON Digital Equipment Fee 394 328 (66) CON Board Review Fee 315 315
Other Fees - Medicine Laptop Computer Fee 1,312 1,312 COM PA Digital Course Materials Fee 865 865 COM PA Board Review Fee 175 175
Other Fees - Pharmacy Pre-Naplex Exam Fee-4th Year all in Fall Semester 80 80 MTM Certificate Fee-3rd Year all in Fall Semester 100 100 COP Board Review Fee 175 175
Other Fees - DentistryDentistry Student Government 60 60 COD Digital Course Materials Fee-Class of 2020 703 900 197 COD Digital Course Materials Fee-Class of 2019 703 772 69 COD Digital Course Materials Fee-Class of 2018 703 703 COD Dental Hygiene Digital Course Materials Fee-Class of 2018 703 662 (41) COD Dental Hygiene Digital Course Materials Fee-Class of 2017 703 757 54 Laboratory and Clinical Utilization Fee 2,200 2,200 Graduate Endodontics Clinical Utilization Fee 12,750 12,750 Graduate Orthodontics Clinical Utilization Fee 7,000 7,000
* Student Programs and Services Fees (SPSF) detail are on page C-24.
** The Physician Assistant (PA) Program is moving to the College of Medicine in Fall 2017
***
University Fees are set by the Board of Trustees and are subject to change at any regular or called meeting of the Board.
Health Science CenterFY 2016-17 Annual Tuition and Fees
Other Fee Details
Programs & Services and Required Fees
The College of Nursing has revised the curriculum for BSN & Pre-Licensure students and are revising the fees for Digital Course Materials.
C-22
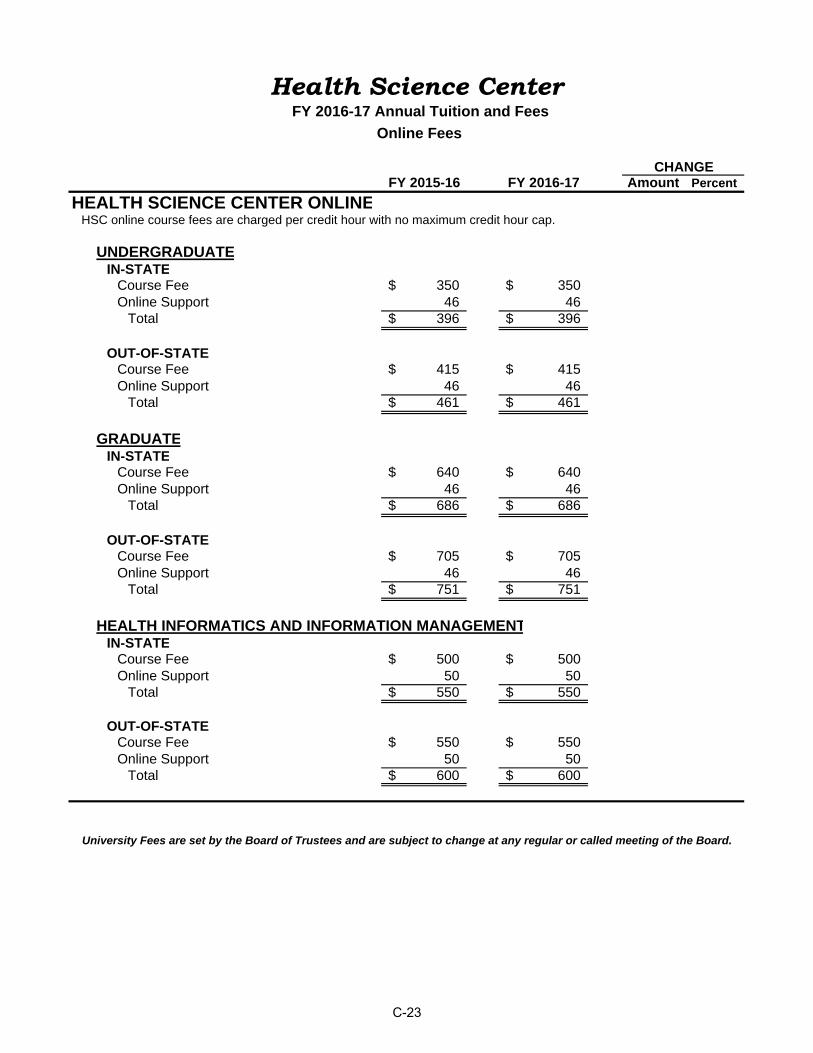
FY 2015-16 FY 2016-17 Amount Percent
HEALTH SCIENCE CENTER ONLINE
UNDERGRADUATEIN-STATE
Course Fee 350$ 350$ Online Support 46 46
Total 396$ 396$
OUT-OF-STATECourse Fee 415$ 415$ Online Support 46 46
Total 461$ 461$
GRADUATEIN-STATE
Course Fee 640$ 640$ Online Support 46 46
Total 686$ 686$
OUT-OF-STATECourse Fee 705$ 705$ Online Support 46 46
Total 751$ 751$
HEALTH INFORMATICS AND INFORMATION MANAGEMENTIN-STATE
Course Fee 500$ 500$ Online Support 50 50
Total 550$ 550$
OUT-OF-STATECourse Fee 550$ 550$ Online Support 50 50
Total 600$ 600$
University Fees are set by the Board of Trustees and are subject to change at any regular or called meeting of the Board.
Health Science CenterFY 2016-17 Annual Tuition and Fees
Online Fees
CHANGE
HSC online course fees are charged per credit hour with no maximum credit hour cap.
C-23

CHANGEFY 2015-16 FY 2016-17 Amount Percent
KNOXVILLE (Includes College of Law and Veterinary Medicine)
FALL AND SPRINGStudent Program 256$ 262$ 6$ 2.3%
Capital 348 366 18 5.2%
Health Services 198 202 4 2.0%
Student Counseling 96 106 10 10.4%Total 898$ 936$ 38$ 4.2%
Summer Semester OnlyStudent Program 78$ 80$ 2$ 2.6%
Capital 106 111 5 4.7%
Health Services 60 61 1 1.7%
Student Counseling 29 32 3 10.3%Total 273$ 284$ 11$ 4.0%
SPACE INSTITUTEFALL AND SPRING
Student Activity 180$ 180$ Summer Semester Only
Student Activity 75$ 75$
CHATTANOOGAStudent Activity 240$ 240$ Debt Service 300 300 Health Services 120 120
Total 660$ 660$
MARTINStudent Activity - Non Athletic 146$ 146$ Student Activity - Athletic 408 408 Student Health & Counseling 60 60 Debt Service 380 380
Total 994$ 994$
HEALTH SCIENCE CENTERStudent Activity 26$ 26$ Campus Recreation 40 40 Campus Improvement 50 50 Simulation Center Equipment Fee 300 300$ NEW
Debt Service 54 54 Computer Based Testing Fee 50 50 Health Services 200 200 Counseling 180 180
Total 600$ 900$ 300$ 50.0%
University Fees are set by the Board of Trustees and are subject to change at any regular or called meeting of the Board.
The purpose of the Student Programs and Services Fee (SPSF) is to advance the University’s educational mission by funding non-instructional services, activities, programs, and facilities that promote student satisfaction and retention or promote the intellectual, physical, emotional, social, cultural, or leadership development of students. The Board of Trustees retains ultimate control of the SPSF and sets the amount of the SPSF at each campus annually upon the recommendation of the Board’s Finance and Administration Committee.
Student Programs and Services FeesFY 2016 -17 Annual Fees
C-24

CHANGE
FY 2015-16 FY 2016-17 Amount
Disabled/Elderly PersonsCOURSES FOR CREDIT
Per Semester Hour 7$ 7$
Maximum Fee per Semester 70 70
AUDIT COURSES No Charge No Charge
University of Tennessee SystemFY 2016-17 Annual Tuition and Fees
Fees for Disabled and Elderly Persons
Fee levels mandated by Tennessee Code Annotated 49-7-113.
C-25

FY 2017 Proposed Budget Supplemental Schedules Page
State Appropriations D-2
UT System Total D-10
Chattanooga (UTC) D-18
Knoxville (UTK) D-26
Martin (UTM) D-34
UTK Space Institute (UTSI) D-42
Health Science Center (HSC) D-49
Institute of Agriculture Total D-56
Agricultural Experiment Station D-62
UT Extension D-67
College of Veterinary Medicine D-72
Institute for Public Service Total D-77
Institute for Public Service (IPS) D-83
Municipal Technical Advisory Service (MTAS) D-88
County Technical Assistance Service (CTAS) D-93
System Administration D-98
D-1

University of Tennessee SystemFY 2017 Proposed State Appropriations Summary
Unrestricted Educational and General FundsCHANGE
PROBABLE TO PROPOSEDFY 2015 FY 2016 FY 2017ACTUAL PROBABLE PROPOSED Amount %
STATE APPROPRIATIONSChattanooga 38,442,081$ 42,640,805$ 46,639,305$ 3,998,500$ 9.4 %Knoxville 182,310,443 191,207,355 202,644,855 11,437,500 6.0 %Martin 27,025,867 28,686,097 31,478,597 2,792,500 9.7 %Space Institute 8,012,212 8,286,603 8,578,403 291,800 3.5 %Health Science Center 129,958,440 135,671,921 140,995,421 5,323,500 3.9 %Agricultural Units
Agricultural Experiment Station 25,698,486$ 26,669,788$ 27,697,588$ 1,027,800$ 3.9 %
Extension 31,195,267 32,406,617 33,903,617 1,497,000 4.6 %
College of Veterinary Medicine 16,874,254 17,733,159 18,430,859 697,700 3.9 %
Subtotal Agricultural Units 73,768,007$ 76,809,564$ 80,032,064$ 3,222,500$ 4.2 %Public Service Units
Institute for Public Service 5,265,298$ 5,439,285$ 5,639,985$ 200,700$ 3.7 %
Municipal Technical Advisory Service 2,903,313 3,039,651 3,156,651 117,000 3.8 %
County Technical Assistance Service 1,767,913 1,863,251 2,237,051 373,800 20.1 %
Subtotal Public Service Units 9,936,524$ 10,342,187$ 11,033,687$ 691,500$ 6.7 %
System Administration 4,794,038 4,995,217 5,263,217 268,000 5.4 %State Appropriations 474,247,612$ 498,639,749$ 526,665,549$ 28,025,800$ 5.6 %
State appropriations budgeted to restricted funds are not included in this schedule.
Schedule 1 D-2

Base Recurring Appropriations
Non-Recurring Appropriations
Total State Appropriations
STATE APPROPRIATIONSChattanooga 46,431,405$ 207,900$ 46,639,305$ Knoxville 201,981,055 663,800 202,644,855 Martin 30,438,697 1,039,900 31,478,597 Space Institute 8,576,903 1,500 8,578,403 Health Science Center 140,988,821 6,600 140,995,421 Agricultural Units
Agricultural Experiment Station 27,697,588$ 27,697,588$
Extension 33,903,617 33,903,617
College of Veterinary Medicine 18,430,859 18,430,859
Subtotal Agricultural Units 80,032,064$ 80,032,064$ Public Service Units
Institute for Public Service 5,639,985$ 5,639,985$
Municipal Technical Advisory Service 3,156,651 3,156,651
County Technical Assistance Service 2,237,051 2,237,051
Subtotal Public Service Units 11,033,687$ 11,033,687$
System Administration 5,263,217$ 5,263,217$ Total State Appropriations
(UnrestrictedE&G) 524,745,849$ 1,919,700$ 526,665,549$
State appropriations allocated to restricted funds are not included in this schedule.
University of Tennessee SystemFY 2017 Proposed State Appropriations Summary
Summary by Budget TypeUnrestricted Educational and General Funds
D-3

University of Tennessee SystemState Appropriations - Unrestricted E&G
FY 2016-17 Proposed Budget Detail
Chattanooga Knoxville MartinSpace
InstituteHealth Science
Center Institute of Agriculture
Institute for Public Service
System Administration Total UT
FY2016 Probable State AppropriationsRecurring Base 41,674,700$ 187,890,300$ 27,892,100$ 8,187,700$ 133,911,111$ 76,144,600$ 10,312,000$ 4,859,900$ 490,872,411$ Access & Diversity 661,705 2,317,355 558,497 88,303 1,535,172 549,964 17,887 77,817 5,806,700
Total FY2016 Recurring Appropriations 42,336,405$ 190,207,655$ 28,450,597$ 8,276,003$ 135,446,283$ 76,694,564$ 10,329,887$ 4,937,717$ 496,679,111$ Global Claims Premium Adjustment 12,000 44,500 6,500 1,400 85,500 18,900 1,700 1,500 172,000 401K Match Increase 84,500 291,400 64,100 7,700 133,538 96,100 10,600 56,000 743,938 Estimated Fee Waivers 207,900 663,800 164,900 1,500 6,600 1,044,700
Total FY2016 Non-Recurring Appropriations 304,400$ 999,700$ 235,500$ 10,600$ 225,638$ 115,000$ 12,300$ 57,500$ 1,960,638$ FY2016 State Appropriations 42,640,805$ 191,207,355$ 28,686,097$ 8,286,603$ 135,671,921$ 76,809,564$ 10,342,187$ 4,995,217$ 498,639,749$
RECURRING ADJUSTMENTSFormula Adjustments to Beginning Base 1,155,100$ (454,700)$ (178,600)$ 521,800$ Outcome Productivity Improvements 2,420,500 10,423,100 1,554,900 14,398,500 Non-Formula Unit Operating Improvements 266,100$ 4,387,000$ 2,474,700$ 335,200$ 157,900$ 7,620,900 Health Insurance Premium Increase (1/1/16) (6 Mos.) 187,500 635,800 125,000 11,500 424,800 249,900 25,000 46,000 1,705,500 Health Insurance Premium Increase (1/1/17) (6 Mos.) 247,400 877,800 172,700 15,600 597,200 341,800 33,000 65,600 2,351,100 401K Match Increase 84,500 291,400 64,100 7,700 133,538 96,100 10,600 56,000 743,938 CTAS Property Assessor Services 300,000 300,000 New Higher Education Center - Sommerville 250,000 250,000 Dairy Specialist Position - UT Extension 175,000 175,000
Total Recurring Adjustments 4,095,000$ 11,773,400$ 1,988,100$ 300,900$ 5,542,538$ 3,337,500$ 703,800$ 325,500$ 28,066,738$ NON-RECURRING ADJUSTMENTS
Global Claims Premium Adjustment (12,000)$ (44,500)$ (6,500)$ (1,400)$ (85,500)$ (18,900)$ (1,700)$ (1,500)$ (172,000)$ 401K Match Increase (84,500) (291,400) (64,100) (7,700) (133,538) (96,100) (10,600) (56,000) (743,938) New Higher Education Center - Sommerville 875,000 875,000
Total Non-Recurring Adjustments (96,500)$ (335,900)$ 804,400$ (9,100)$ (219,038)$ (115,000)$ (12,300)$ (57,500)$ (40,938)$ TOTAL CHANGE IN APPROPRIATIONS 3,998,500$ 11,437,500$ 2,792,500$ 291,800$ 5,323,500$ 3,222,500$ 691,500$ 268,000$ 28,025,800$
FY2017 State AppropriationsRecurring Base 45,769,700$ 199,663,700$ 29,880,200$ 8,488,600$ 139,453,649$ 79,482,100$ 11,015,800$ 5,185,400$ 518,939,149$ Access & Diversity 661,705 2,317,355 558,497 88,303 1,535,172 549,964 17,887 77,817 5,806,700
Total FY2017 Recurring Appropriations 46,431,405$ 201,981,055$ 30,438,697$ 8,576,903$ 140,988,821$ 80,032,064$ 11,033,687$ 5,263,217$ 524,745,849$ Estimated Fee Waivers 207,900 663,800 164,900 1,500 6,600 1,044,700 Somerville Education Center 875,000 875,000
Total Non-Recurring Appropriations 207,900$ 663,800$ 1,039,900$ 1,500$ 6,600$ -$ -$ -$ 1,919,700$ FY2017 State Appropriations 46,639,305$ 202,644,855$ 31,478,597$ 8,578,403$ 140,995,421$ 80,032,064$ 11,033,687$ 5,263,217$ 526,665,549$
D-4

Institute of Agriculture
Experiment Station
UT Extension
College of Veterinary Medicine Total UTIA
FY2016 Probable State AppropriationsRecurring Base 26,520,800$ 32,244,000$ 17,379,800$ 76,144,600$ Access & Diversity 113,488 110,917 325,559 549,964
Total FY2016 Recurring Appropriations 26,634,288$ 32,354,917$ 17,705,359$ 76,694,564$Non-Recurring 35,500 51,700 27,800 115,000
FY2016 State Appropriations 26,669,788$ 32,406,617$ 17,733,159$ 76,809,564$
RECURRING ADJUSTMENTSNon-Formula Unit Operating Improvements 857,400$ 1,052,500$ 564,800$ 2,474,700$ Health Insurance Premium Increase (1/1/16) (6 Months) 74,700 117,000 58,200 249,900 Health Insurance Premium Increase (1/1/17) (6 Months) 101,700 162,000 78,100 341,800 401K Match Increase 29,500 42,200 24,400 96,100 Dairy Specialist Position - UT Extension 175,000 175,000
Total Recurring Adjustments 1,063,300$ 1,548,700$ 725,500$ 3,337,500$
NON-RECURRING ADJUSTMENTSGlobal Claims Premium Adjustment (6,000)$ (9,500)$ (3,400)$ (18,900)$ 401K Match Increase (29,500) (42,200)$ (24,400)$ (96,100)
Total Non-Recurring Adjustments (35,500)$ (51,700)$ (27,800)$ (115,000)$ TOTAL CHANGE IN APPROPRIATIONS 1,027,800$ 1,497,000$ 697,700$ 3,222,500$
FY2017 State AppropriationsRecurring Base 27,584,100$ 33,792,700$ 18,105,300$ 79,482,100$ Access & Diversity 113,488 110,917 325,559 549,964
Total FY2017 Recurring Appropriations 27,697,588$ 33,903,617$ 18,430,859$ 80,032,064$Non-Recurring
FY2017 State Appropriations 27,697,588$ 33,903,617$ 18,430,859$ 80,032,064$
State Appropriations - Unrestricted E&GFY 2016-17 Proposed Budget
D-5

Institute for Public Service
Institute for Public Service
Municipal Technical Advisory Service
County Technical
Assistance Service
Total Institute for Public Service
FY2016 Probable State AppropriationsRecurring Base 5,420,500$ 3,033,400$ 1,858,100$ 10,312,000$ Access & Diversity 14,185 1,851 1,851 17,887
Total FY2016 Recurring Appropriations 5,434,685$ 3,035,251$ 1,859,951$ 10,329,887$ Non-Recurring 4,600 4,400 3,300 12,300
FY2016 State Appropriations 5,439,285$ 3,039,651$ 1,863,251$ 10,342,187$
RECURRING ADJUSTMENTSNon-Formula Unit Operating Improvements 176,200$ 98,600$ 60,400$ 335,200$ Health Insurance Premium Increase (1/1/16) (6 Months) 10,900 7,900 6,200 25,000 Health Insurance Premium Increase (1/1/17) (6 Months) 14,600 10,900 7,500 33,000 401K Match Increase 3,600 4,000 3,000 10,600 CTAS Property Assessor Services 300,000 300,000
Total Recurring Adjustments 205,300$ 121,400$ 377,100$ 703,800$ NON-RECURRING ADJUSTMENTS
Global Claims Premium Adjustment (1,000)$ (400)$ (300)$ (1,700)$ 401K Match Increase (3,600) (4,000) (3,000) (10,600)
Total Non-Recurring Adjustments (4,600)$ (4,400)$ (3,300)$ (12,300)$ TOTAL CHANGE IN APPROPRIATIONS 200,700$ 117,000$ 373,800$ 691,500$
FY2017 State AppropriationsRecurring Base 5,625,800$ 3,154,800$ 2,235,200$ 11,015,800$ Access & Diversity 14,185 1,851 1,851 17,887
Total FY2017 Recurring Appropriations 5,639,985$ 3,156,651$ 2,237,051$ 11,033,687$ Non-Recurring
FY2017 State Appropriations 5,639,985$ 3,156,651$ 2,237,051$ 11,033,687$
State Appropriations - Unrestricted E&GFY 2016-17 Proposed Budget
D-6

University of Tennessee SystemState Appropriations
FY 2016-17 Proposed Budget
Chattanooga Knoxville MartinSpace
InstituteHealth Science
Center Institute of Agriculture
Institute for Public Service
System Administration Total UT
FY2016 Probable State Appropriations Recurring Base 42,431,949$ 198,338,738$ 28,183,215$ 9,004,264$ 136,913,592$ 76,644,921$ 10,312,000$ 4,859,900$ 506,688,579$ Access & Diversity 661,705 2,317,355 558,497 88,303 1,535,172 549,964 17,887 77,817 5,806,700
Total FY2016 Recurring Appropriations 43,093,654$ 200,656,093$ 28,741,712$ 9,092,567$ 138,448,764$ 77,194,885$ 10,329,887$ 4,937,717$ 512,495,279$ Global Claims Premium Adjustment 12,000 44,500 6,500 1,400 85,500 18,900 1,700 1,500 172,000 401K Match Increase 84,500 291,400 64,100 7,700 134,600 96,100 10,600 56,000 745,000 St. Judes's Physicians (Year 4 of 5) 3,000,000 3,000,000 Estimated Fee Waivers 207,900 663,800 164,900 1,500 6,600 1,044,700
Total FY2016 Non-Recurring Appropriations 304,400$ 999,700$ 235,500$ 10,600$ 3,226,700$ 115,000$ 12,300$ 57,500$ 4,961,700$ FY2016 State Appropriations * 43,398,054$ 201,655,793$ 28,977,212$ 9,103,167$ 141,675,464$ 77,309,885$ 10,342,187$ 4,995,217$ 517,456,979$
RECURRING ADJUSTMENTSFormula Adjustments to Beginning Base 1,155,100$ (454,700)$ (178,600)$ 521,800$ Outcome Productivity Improvements 2,420,500 10,423,100 1,554,900 14,398,500 Non-Formula Unit Operating Improvements 266,100$ 4,387,000$ 2,474,700$ 335,200$ 157,900$ 7,620,900 Health Insurance Premium Increase (1/1/16) (6 Mos.) 187,500 635,800 125,000 11,500 424,800 249,900 25,000 46,000 1,705,500 Health Insurance Premium Increase (1/1/17) (6 Mos.) 247,400 877,800 172,700 15,600 597,200 341,800 33,000 65,600 2,351,100 401K Match Increase 84,500 291,400 64,100 7,700 134,600 96,100 10,600 56,000 745,000 CTAS Property Assessor Services 300,000 300,000 New Higher Education Center - Sommerville 250,000 250,000 Dairy Specialist Position - UT Extension 175,000 175,000 401k Match (Mouse Genome Project ) - Centers of Excellence Base Operating Reduction (12,250) (82,106) (4,709) (13,210) (23,438) (8,093) (143,806)
Total Recurring Adjustments 4,082,750$ 11,691,294$ 1,983,391$ 287,690$ 5,520,162$ 3,329,407$ 703,800$ 325,500$ 27,923,994$ NON-RECURRING ADJUSTMENTS
Global Claims Premium Adjustment (12,000)$ (44,500)$ (6,500)$ (1,400)$ (85,500)$ (18,900)$ (1,700)$ (1,500)$ (172,000)$ 401K Match Increase (84,500) (291,400) (64,100) (7,700) (134,600) (96,100) (10,600) (56,000) (745,000) New Higher Education Center - Sommerville 875,000$ 875,000 401k Match (Mouse Genome Project ) -
Total Non-Recurring Adjustments (96,500)$ (335,900)$ 804,400$ (9,100)$ (220,100)$ (115,000)$ (12,300)$ (57,500)$ (42,000)$ TOTAL CHANGE IN APPROPRIATIONS 3,986,250$ 11,355,394$ 2,787,791$ 278,590$ 5,300,062$ 3,214,407$ 691,500$ 268,000$ 27,881,994$
FY2017 State Appropriations Recurring Base 46,514,699$ 210,030,032$ 30,166,606$ 9,291,954$ 142,433,754$ 79,974,328$ 11,015,800$ 5,185,400$ 534,612,573$ Access & Diversity 661,705 2,317,355 558,497 88,303 1,535,172 549,964 17,887 77,817 5,806,700
Total FY2017 Recurring Appropriations 47,176,404$ 212,347,387$ 30,725,103$ 9,380,257$ 143,968,926$ 80,524,292$ 11,033,687$ 5,263,217$ 540,419,273$ Non-Recurring 207,900 663,800 1,039,900 1,500 3,006,600 4,919,700
FY2017 State Appropriations * 47,384,304$ 213,011,187$ 31,765,003$ 9,381,757$ 146,975,526$ 80,524,292$ 11,033,687$ 5,263,217$ 545,338,973$
Notes:* This schedule includes appropriations budgeted to both unrestricted and restricted E&G.
D-7

Chattanooga Knoxville MartinSpace
Institute
Health Science Center
Institute of Agriculture
Total UT System
FY16 Probable State AppropriationsRecurring
Centers of Excellence 757,249$ 5,075,476$ 291,115$ 816,564$ 1,448,854$ 500,321$ 8,889,579$ Research Initiatives (Governor's Chairs)* 5,372,962 479,938 5,852,900 Mouse Genome Project 1,073,689 1,073,689
Total FY2016 Recurring Appropriations 757,249$ 10,448,438$ 291,115$ 816,564$ 3,002,481$ 500,321$ 15,816,168$ Non-Recurring
Mouse Genome Project 401k Match 1,062$ 1,062$ St. Judes Pediatric Physicians (Year 4 of 5) 3,000,000 3,000,000
Total FY2016 Non-Recurring Appropriations 3,001,062$ 3,001,062$ FY2016 State Appropriatins 757,249$ 10,448,438$ 291,115$ 816,564$ 6,003,543$ 500,321$ 18,817,230$
RECURRING ADJUSTMENTSCenters of Excellence Operating Reduction (12,250)$ (82,106)$ (4,709)$ (13,210)$ (23,438)$ (8,093)$ (143,806)$ Mouse Genome Project 401k Match 1,062 1,062
Total Recurring Adjustments (12,250)$ (82,106)$ (4,709)$ (13,210)$ (22,376)$ (8,093)$ (142,744)$ NON-RECURRING ADJUSTMENTS
401K Match Increase (Mouse Genome Project) (1,062)$ (1,062)$ Total Non-Recurring Adjustments (1,062)$ (1,062)$ TOTAL CHANGE IN APPROPRIATIONS (12,250)$ (82,106)$ (4,709)$ (13,210)$ (23,438)$ (8,093)$ (143,806)$
FY17 Proposed State AppropriationsRecurring Base
Centers of Excellence 744,999$ 4,993,370$ 286,406$ 803,354$ 1,425,416$ 492,228$ 8,745,773$ Research Initiatives (Governor's Chairs)* 5,372,962 479,938 5,852,900Mouse Genome Project 1,074,751 1,074,751
Total FY2017 Recurring Appropriations 744,999$ 10,366,332$ 286,406$ 803,354$ 2,980,105$ 492,228$ 15,673,424$ Non-Recurring
St. Judes Pediatric Physicians (Year 4 of 5) 3,000,000 3,000,000FY2017 State Appropriations 744,999$ 10,366,332$ 286,406$ 803,354$ 5,980,105$ 492,228$ 18,673,424$
Notes:* Research Initiatives allocation based on UWA Year end distribution of FY15 Actuals
University of Tennessee System State Appropriations - Budgeted to Restricted E&G
FY 2016-17 Proposed Budget
D-8
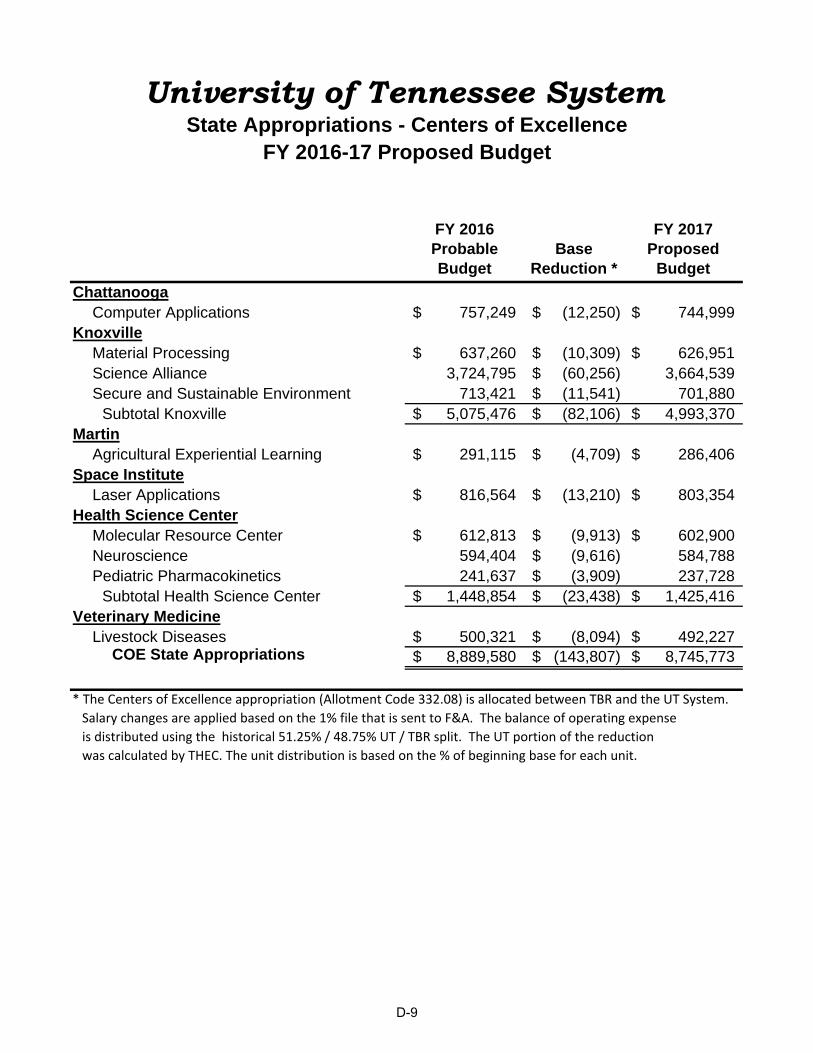
FY 2016 Probable Budget
Base Reduction *
FY 2017 Proposed
Budget
ChattanoogaComputer Applications 757,249$ (12,250)$ 744,999$
KnoxvilleMaterial Processing 637,260$ (10,309)$ 626,951$ Science Alliance 3,724,795 (60,256)$ 3,664,539 Secure and Sustainable Environment 713,421 (11,541)$ 701,880
Subtotal Knoxville 5,075,476$ (82,106)$ 4,993,370$ Martin
Agricultural Experiential Learning 291,115$ (4,709)$ 286,406$ Space Institute
Laser Applications 816,564$ (13,210)$ 803,354$ Health Science Center
Molecular Resource Center 612,813$ (9,913)$ 602,900$ Neuroscience 594,404 (9,616)$ 584,788 Pediatric Pharmacokinetics 241,637 (3,909)$ 237,728
Subtotal Health Science Center 1,448,854$ (23,438)$ 1,425,416$ Veterinary Medicine
Livestock Diseases 500,321$ (8,094)$ 492,227$ COE State Appropriations 8,889,580$ (143,807)$ 8,745,773$
* The Centers of Excellence appropriation (Allotment Code 332.08) is allocated between TBR and the UT System.
Salary changes are applied based on the 1% file that is sent to F&A. The balance of operating expense
is distributed using the historical 51.25% / 48.75% UT / TBR split. The UT portion of the reduction
was calculated by THEC. The unit distribution is based on the % of beginning base for each unit.
University of Tennessee SystemState Appropriations - Centers of Excellence
FY 2016-17 Proposed Budget
D-9

University of Tennessee SystemFY 2017 Proposed Budget Summary
Unrestricted Current Funds Revenues, Expenditures, and Transfers
CHANGEFY 2015 FY 2016 FY 2017 PROBABLE TO PROPOSED
ACTUALS PROBABLE PROPOSED AMOUNT %EDUCATIONAL AND GENERALRevenues
Tuition & Fees 615,545,784$ 648,037,768$ 669,787,108$ 21,749,340$ 3.4 %State Appropriations 474,247,612 498,639,749 526,665,549 28,025,800 5.6 %Grants & Contracts 46,798,665 44,650,266 44,529,714 (120,552) (0.3) %Sales & Service 60,095,439 57,790,642 57,832,737 42,095 0.1 %Other Sources 62,148,888 56,671,683 57,178,632 506,949 0.9 %
Total Revenues 1,258,836,388$ 1,305,790,108$ 1,355,993,740$ 50,203,632$ 3.8 %
Expenditures and TransfersInstruction 492,352,355$ 577,040,051$ 570,871,393$ (6,168,658)$ (1.1) %Research 83,487,974 110,072,752 73,583,021 (36,489,731) (33.2) %Public Service 71,365,049 87,106,681 80,557,849 (6,548,832) (7.5) %Academic Support 140,613,764 158,704,326 146,819,933 (11,884,393) (7.5) %Student Services 87,447,751 88,425,977 88,080,549 (345,428) (0.4) %Institutional Support 133,117,858 150,393,384 147,368,765 (3,024,619) (2.0) %Operation & Maintenace of Plant 125,493,000 135,781,740 139,190,009 3,408,269 2.5 %Scholarships & Fellowships 88,984,234 95,154,298 106,011,157 10,856,859 11.4 %
Subtotal Expenditures 1,222,861,986$ 1,402,679,209$ 1,352,482,676$ (50,196,533)$ (3.6) %Mandatory Transfers 7,702,456 9,096,143 8,589,891 (506,252) (5.6) %Non-Mandatory Transfers 26,736,499 (63,509,375) (4,305,613) 59,203,762 93.2 %
Total Expenditures & Transfers 1,257,300,941$ 1,348,265,977$ 1,356,766,954$ 8,500,977$ 0.6 %
Fund Balance Addition/(Reduction) 1,535,447$ (42,475,869)$ (773,214)$
AUXILIARIESRevenues 229,998,450$ 229,780,481$ 245,962,927$ 16,182,446$ 7.0 %Expenditures and Transfers
Expenditures 162,487,928 178,595,830 184,698,151 6,102,321 3.4 %Mandatory Transfers 30,475,329 31,758,673 40,667,626 8,908,953 28.1 %Non-Mandatory Transfers 27,175,190 19,425,978 20,597,150 1,171,172 6.0 %
Total Expenditures & Transfers 220,138,447$ 229,780,481$ 245,962,927$ 16,182,446$ 7.0 %Fund Balance Addition/(Reduction) 9,860,002$ -$ -$
TOTALSRevenues 1,488,834,838$ 1,535,570,589$ 1,601,956,667$ 66,386,078$ 4.3 %Expenditures and Transfers
Expenditures 1,385,349,915$ 1,581,275,039$ 1,537,180,827$ (44,094,212)$ (2.8) %Mandatory Transfers 38,177,785 40,854,816 49,257,517 8,402,701 20.6 %Non-Mandatory Transfers 53,911,689 (44,083,397) 16,291,537 60,374,934 137.0 %
Total Expenditures & Transfers 1,477,439,389$ 1,578,046,458$ 1,602,729,881$ 24,683,423$ 1.6 %Fund Balance Addition/(Reduction) 11,395,449$ (42,475,869)$ (773,214)$
Schedule 15 - UT TotalD-10

FY 2013 FY 2014 FY 2015 FY 2016 FY 2017ACTUAL ACTUAL ACTUAL PROBABLE PROPOSED AMOUNT
EDUCATIONAL AND GENERALRevenues
Tuition & Fees 533,809,389$ 573,319,528$ 615,545,784$ 648,037,768$ 669,787,108$ 135,977,719$ 25.5 %State Appropriations 431,850,267 466,846,023 474,247,612 498,639,749 526,665,549 94,815,282 22.0 %Grants & Contracts 49,542,582 47,701,692 46,798,665 44,650,266 44,529,714 (5,012,868) (10.1) %Sales & Service 57,856,330 56,782,696 60,095,439 57,790,642 57,832,737 (23,593) 0.0 %Other Sources 70,098,212 57,843,432 62,148,888 56,671,683 57,178,632 (12,919,580) (18.4) %
Total Revenues 1,143,156,780$ 1,202,493,370$ 1,258,836,388$ 1,305,790,108$ 1,355,993,740$ 212,836,960$ 18.6 %
Expenditures and TransfersInstruction 455,174,572$ 483,317,352$ 492,352,355$ 577,040,051$ 570,871,393$ 115,696,822$ 25.4 %Research 86,634,810 82,247,060 83,487,974 110,072,752 73,583,021 (13,051,789) (15.1) %Public Service 70,315,078 71,218,916 71,365,049 87,106,681 80,557,849 10,242,771 14.6 %Academic Support 130,694,151 134,931,552 140,613,764 158,704,326 146,819,933 16,125,782 12.3 %Student Services 84,118,134 82,207,540 87,447,751 88,425,977 88,080,549 3,962,415 4.7 %Institutional Support 122,698,075 132,823,682 133,117,858 150,393,384 147,368,765 24,670,690 20.1 %Operation & Maintenance of Plant 118,493,896 121,814,088 125,493,000 135,781,740 139,190,009 20,696,113 17.5 %Scholarships & Fellowships 74,479,780 78,873,759 88,984,234 95,154,298 106,011,157 31,531,377 42.3 %
Subtotal Expenditures 1,142,608,497$ 1,187,433,948$ 1,222,861,986$ 1,402,679,209$ 1,352,482,676$ 209,874,179$ 18.4 %Mandatory Transfers 6,273,292 6,498,442 7,702,456 9,096,143 8,589,891 2,316,599 36.9 %Non-Mandatory Transfers (17,523,145) 20,854,833 26,736,499 (63,509,375) (4,305,613) 13,217,532 75.4 %
Total Expenditures & Transfers 1,131,358,644$ 1,214,787,223$ 1,257,300,941$ 1,348,265,977$ 1,356,766,954$ 225,408,310$ 19.9 %Fund Balance Addition/(Reduction) 11,798,136$ (12,293,853)$ 1,535,447$ (42,475,869)$ (773,214)$
AUXILIARIESRevenues 199,171,124$ 206,143,803$ 229,998,450$ 229,780,481$ 245,962,927$ 46,791,803$ 23.5 %Expenditures and Transfers
Expenditures 148,395,318$ 156,747,599$ 162,487,928$ 178,595,830$ 184,698,151$ 36,302,833$ 24.5 %Mandatory Transfers 27,857,526 27,638,251 30,475,329 31,758,673 40,667,626 12,810,100 46.0 %Non-Mandatory Transfers 17,254,499 25,035,971 27,175,190 19,425,978 20,597,150 3,342,651 19.4 %
Total Expenditures & Transfers 193,507,343$ 209,421,821$ 220,138,447$ 229,780,481$ 245,962,927$ 52,455,584$ 27.1 %Fund Balance Addition/(Reduction) 5,663,782$ (3,278,018)$ 9,860,002$
TOTALSRevenues 1,342,327,905$ 1,408,637,174$ 1,488,834,838$ 1,535,570,589$ 1,601,956,667$ 259,628,762$ 19.3 %Expenditures and Transfers
Expenditures 1,291,003,814$ 1,344,181,548$ 1,385,349,915$ 1,581,275,039$ 1,537,180,827$ 246,177,013$ 19.1 %Mandatory Transfers 34,130,818 34,136,693 38,177,785 40,854,816 49,257,517 15,126,699 44.3 %Non-Mandatory Transfers (268,646) 45,890,804 53,911,689 (44,083,397) 16,291,537 16,560,183 6164.3 %
Total Expenditures & Transfers 1,324,865,986$ 1,424,209,045$ 1,477,439,389$ 1,578,046,458$ 1,602,729,881$ 277,863,895$ 21.0 %Fund Balance Addition/(Reduction) 17,461,918$ (15,571,871)$ 11,395,449$ (42,475,869)$ (773,214)$
%
University of Tennessee SystemFive Year FY17 Proposed Budget Summary Comparison
Current Funds Revenues, Expenditures and Transfers - UNRESTRICTED
FY 2013 TO FY 2017CHANGE
Schedule 8 - UT Total
D-11

University of Tennessee SystemUnrestricted Net Assets
E&G AUXILIARIES TOTALNet Assets - June 30, 2014 145,397,509$ 17,283,287$ 162,680,796$ Percent Unallocated of Expend. & Transfers * 3.65% 2.04% 3.50%
FY 2014-15 ACTUALRevenue 1,258,836,389$ 229,998,450$ 1,488,834,839$ Less:
Expenditures 1,222,861,986$ 162,487,928$ 1,385,349,914$ Mandatory Transfers 7,702,456 30,475,329 38,177,785 Non-Mandatory Transfers 26,736,499 27,175,190 53,911,689
Total Expenditures & Transfers 1,257,300,941$ 220,138,447$ 1,477,439,388$ Net Change 1,535,448$ 9,860,003$ 11,395,451$ Unrestricted Net Assets
Working Capital 23,487,672$ 13,843,057$ 37,330,729$ Revolving Funds 17,921,836 1,917,693 19,839,529 Encumbrances 5,662,778 205 5,662,983 Unexpended Gifts 284,867 284,867 Reappropriations 54,206,225 54,206,225 Unallocated 45,369,579 11,382,336 56,751,915
Actual Net Assets - June 30, 2015 146,932,957$ 27,143,290$ 174,076,247$ Percent Unallocated of Expend. & Transfers * 3.61% 5.17% 3.84%
FY 2015-16 PROBABLE BUDGETRevenue 1,305,790,108$ 229,780,481$ 1,535,570,589$ Less:
Expenditures 1,402,679,209$ 178,595,830$ 1,581,275,039$ Mandatory Transfers 9,096,143 31,758,673 40,854,816 Non-Mandatory Transfers (63,509,375) 19,425,978 (44,083,397)
Total Expenditures & Transfers 1,348,265,977$ 229,780,481$ 1,578,046,458$ Net Change (42,475,869)$ -$ (42,475,869)$ Unrestricted Net Assets
Working Capital 23,399,695$ 13,840,057$ 37,239,752$ Revolving Funds 17,921,836 1,917,693 19,839,529 Encumbrances 2,955,688 205 2,955,893 Unexpended Gifts 284,887 284,887 Reappropriations 15,758,843 15,758,843 Unallocated 44,136,139 11,385,335 55,521,474
Estimated Net Assets - June 30, 2016 104,457,088$ 27,143,290$ 131,600,378$ Percent Unallocated of Expend. & Transfers * 3.27% 4.95% 3.52%
FY 2016-17 PROPOSED BUDGETRevenue 1,355,993,740$ 245,962,927$ 1,601,956,667$ Less:
Expenditures 1,352,482,676$ 184,698,151$ 1,537,180,827$ Mandatory Transfers 8,589,891 40,667,626 49,257,517 Non-Mandatory Transfers (4,305,613) 20,597,150 16,291,537
Total Expenditures & Transfers 1,356,766,954$ 245,962,927$ 1,602,729,881$ Net Change (773,214)$ -$ (773,214)$ Unrestricted Net Assets
Working Capital 22,899,695$ 13,840,057$ 36,739,752$ Revolving Funds 17,921,836 1,917,693 19,839,529 Encumbrances 2,955,688 205 2,955,893 Unexpended Gifts 284,887 284,887 Reappropriations 15,470,832 15,470,832 Unallocated 44,150,936 11,385,336 55,536,272
Estimated Net Assets - June 30, 2017 103,683,874$ 27,143,291$ 130,827,165$ Percent Unallocated of Expend. & Transfers * 3.25% 4.63% 3.47%
* Recommended percent for unallocated expenditures is 2% to 5% for E&G and 3% to 5% for auxiliaries.UT TOTAL
D-12

FY 2015 FY 2016 FY 2017ACTUAL PROBABLE PROPOSED AMOUNT
EDUCATIONAL AND GENERAL
Salaries and Benefits
Salaries
Academic 333,879,883$ 348,592,960$ 351,019,946$ 2,426,986$ 0.7 %
Non-Academic 306,368,688 320,893,919 330,734,930 9,841,011 3.1 %
Students 10,573,136 9,168,782 8,658,387 (510,395) (5.6) %
Total Salaries 650,821,706$ 678,655,661$ 690,413,263$ 11,757,602$ 1.7 %
Staff Benefits 220,776,097 222,646,654 229,220,605 6,573,951 3.0 %
Total Salaries and Benefits 871,597,804$ 901,302,315$ 919,633,868$ 18,331,553$ 2.0 %
Operating 324,616,480 478,016,579 413,161,934 (64,854,645) (13.6) %
Equipment and Capital Outlay 26,647,702 23,360,315 19,686,874 (3,673,441) (15.7) %
Total Expenditures 1,222,861,986$ 1,402,679,209$ 1,352,482,676$ (50,196,533)$ (3.6) %
AUXILIARIES
Salaries and Benefits
Salaries
Academic 460,433$ 509,704$ 639,676$ 129,972$ 25.5 %
Non-Academic 46,283,764 46,661,988 49,112,309 2,450,321$ 5.3 %
Students 4,263,562 4,537,496 4,664,158 126,662 2.8 %
Total Salaries 51,007,760$ 51,709,188$ 54,416,143$ 2,706,955$ 5.2 %
Staff Benefits 13,962,973 13,676,343 13,955,872 279,529 2.0 %
Total Salaries and Benefits 64,970,733$ 65,385,531$ 68,372,015$ 2,986,484$ 4.6 %
Operating 97,395,934 112,482,829 115,555,366 3,072,537 2.7 %
Equipment and Capital Outlay 121,262 727,470 770,770 43,300 6.0 %
Total Expenditures 162,487,928$ 178,595,830$ 184,698,151$ 6,102,321$ 3.4 %
TOTALS
Salaries and Benefits
Salaries
Academic 334,340,316$ 349,102,664$ 351,659,622$ 2,556,958$ 0.7 %
Non-Academic 352,652,452 367,555,907 379,847,239 12,291,332 3.3 %
Students 14,836,698 13,706,278 13,322,545 (383,733) (2.8) %
Total Salaries 701,829,466$ 730,364,849$ 744,829,406$ 14,464,557$ 2.0 %
Staff Benefits 234,739,071 236,322,997 243,176,477 6,853,480 2.9 %
Total Salaries and Benefits 936,568,536$ 966,687,846$ 988,005,883$ 21,318,037$ 2.2 %
Operating 422,012,414 590,499,408 528,717,300 (61,782,108) (10.5) %
Equipment and Capital Outlay 26,768,964 24,087,785 20,457,644 (3,630,141) (15.1) %
Total Expenditures 1,385,349,915$ 1,581,275,039$ 1,537,180,827$ (44,094,212)$ (2.8) %
%
CHANGE
FY 2017 Proposed Budget Summary - Natural ClassificationsUnrestricted Current Funds Expenditures
University of Tennessee System
PROBABLE TO PROPOSED
Schedule 12D-13

University of Tennessee SystemFY 2017 Proposed Budget Summary
Auxiliary Enterprises Funds Revenues, Expenditures and Transfers
CHANGEFY 2015 FY 2016 FY 2017 PROBABLE TO PROPOSEDACTUAL PROBABLE PROPOSED AMOUNT %
HOUSINGRevenues 64,353,411$ 61,757,670$ 65,564,675$ 3,807,005$ 6.16 %
Expenditures and TransfersExpenditures 38,459,292$ 41,870,392$ 42,009,840$ 139,448$ 0.3 %
Mandatory Transfers 10,027,001 12,168,671 18,797,266 6,628,595 54.5 %
Non-Mandatory Transfers 13,289,816 7,718,607 4,757,569 (2,961,038) (38.4) %
Total Expenditures and Transfers 61,776,109$ 61,757,670$ 65,564,675$ 3,807,005$ 6.2 %
Fund Balance Addition/(Reduction) 2,577,302$ -$
FOOD SERVICERevenues 6,925,581$ 7,015,110$ 8,681,912$ 1,666,802$ 23.8 %
Expenditures and TransfersExpenditures 2,563,395$ 3,234,415$ 3,327,342$ 92,927$ 2.9 %
Mandatory Transfers 2,703,864 Non-Mandatory Transfers 1,969,906 3,774,379 5,347,370 1,572,991 41.7 %
Total Expenditures and Transfers 7,237,165$ 7,008,794$ 8,674,712$ 1,665,918$ 23.8 %
Fund Balance Addition/(Reduction) (311,584)$ 6,316$ 7,200$
BOOKSTORESRevenues 23,331,077$ 24,041,110$ 25,140,352$ 1,099,242$ 4.6 %
Expenditures and TransfersExpenditures 17,678,024$ 21,718,606$ 22,780,059$ 1,061,453$ 4.9 %
Mandatory Transfers 109,418 109,418 - 0.0 %
Non-Mandatory Transfers 2,977,726 2,214,086 2,251,875 37,789 1.7 %
Total Expenditures and Transfers 20,655,750$ 24,042,110$ 25,141,352$ Fund Balance Addition/(Reduction) 2,675,327$ (1,000)$ (1,000)$
PARKINGRevenues 11,920,037$ 13,415,322$ 13,674,259$ 258,937$ 1.9 %
Expenditures and TransfersExpenditures 6,674,207$ 8,869,585$ 8,234,739$ (634,846)$ (7.2) %
Mandatory Transfers 2,868,245 3,129,222 4,314,704 Non-Mandatory Transfers 1,649,369 1,416,515 1,124,816 (291,699) (20.6) %
Total Expenditures and Transfers 11,191,821$ 13,415,322$ 13,674,259$ 258,937$ 1.9 %
Fund Balance Addition/(Reduction) 728,217$ -$ -$
ATHLETICSRevenues 119,478,992$ 119,077,900$ 128,819,870$ 9,741,970 8.2 %
Expenditures and TransfersExpenditures 93,620,169$ 98,382,653$ 104,216,618$ 5,833,965 5.9 %
Mandatory Transfers 14,876,219 16,351,362 17,446,238 1,094,876 6.7 %
Non-Mandatory Transfers 7,157,162 4,343,885 7,157,014 2,813,129 64.8 %
Total Expenditures and Transfers 115,653,549$ 119,077,900$ 128,819,870$ 9,741,970$ 8.2 %
Fund Balance Addition/(Reduction) 3,825,442$
OTHERRevenues 3,989,351$ 4,473,369$ 4,081,859$ (391,510)$ (8.8) %
Expenditures and TransfersExpenditures 3,492,841$ 4,520,179$ 4,129,553$ (390,626)$ (8.6) %
Mandatory TransfersNon-Mandatory Transfers 131,213 (41,494) (41,494) Total Expenditures and Transfers 3,624,054$ 4,478,685$ 4,088,059$ (390,626)$ (8.7) %
Fund Balance Addition/(Reduction) 365,297$ (5,316)$ (6,200)$
TOTALRevenues 229,998,450$ 229,780,481$ 245,962,927$ 16,182,446$ 7.0 %
Expenditures and TransfersExpenditures 162,487,928$ 178,595,830$ 184,698,151$ 6,102,321$ 3.4 %
Mandatory Transfers 30,475,329 31,758,673 40,667,626 8,908,953 28.1 %
Non-Mandatory Transfers 27,175,191 19,425,978 20,597,150 1,171,172 6.0 %
Total Expenditures and Transfers 220,138,448$ 229,780,481$ 245,962,927$ 16,182,446$ 7.0 %
Fund Balance Addition/(Reduction) 9,860,002$
Schedule 13 - Auxiliaries
D-14

Unrestricted Restricted Total Unrestricted Restricted Total Unrestricted Restricted Total Amount
EDUCATION AND GENERAL
Revenues
Tuition & Fees 615,545,784$ 615,545,784$ 648,037,768$ 648,037,768$ 669,787,108$ 669,787,108$ 21,749,340$ 3.4 %
State Appropriations 474,247,612 24,587,443$ 498,835,055 498,639,749 18,817,230$ 517,456,979 526,665,549 18,673,424$ 545,338,973 27,881,994 5.4 %
Grants & Contracts 46,798,665 532,598,462 579,397,127 44,650,266 506,011,161 550,661,427 44,529,714 511,270,867 555,800,581 5,139,154 0.9 %
Sales & Service 60,095,439 60,095,439 57,790,642 57,790,642 57,832,737 57,832,737 42,095 0.1 %
Other Sources 62,148,888 72,905,734 135,054,622 56,671,683 71,784,431 128,456,114 57,178,632 72,214,431 129,393,063 936,949 0.7 %Total Revenues 1,258,836,388$ 630,091,639$ 1,888,928,027$ 1,305,790,108$ 596,612,822$ 1,902,402,930$ 1,355,993,740$ 602,158,722$ 1,958,152,462$ 55,749,532$ 2.9 %
Expenditures and TransfersInstruction 492,352,355$ 169,609,012$ 661,961,368$ 577,040,051 149,073,894$ 726,113,945$ 570,871,393$ 149,345,294$ 720,216,687$ (5,897,258)$ (0.8) %
Research 83,487,974 173,291,843 256,779,818 110,072,752 173,951,988 284,024,740 73,583,021 174,283,185 247,866,206 (36,158,534) (12.7) %
Public Service 71,365,049 58,722,600 130,087,649 87,106,681 57,674,545 144,781,226 80,557,849 60,199,745 140,757,594 (4,023,632) (2.8) %
Academic Support 140,613,764 39,226,572 179,840,336 158,704,326 31,566,128 190,270,454 146,819,933 32,720,328 179,540,261 (10,730,193) (5.6) %
Student Services 87,447,751 2,244,909 89,692,660 88,425,977 1,942,233 90,368,210 88,080,549 1,955,633 90,036,182 (332,028) (0.4) %
Institutional Support 133,117,858 2,014,635 135,132,492 150,393,384 1,695,824 152,089,208 147,368,765 1,696,224 149,064,989 (3,024,219) (2.0) %
Operations & Maintenance of Plant 125,493,000 413,242 125,906,243 135,781,740 415,000 136,196,740 139,190,009 415,000 139,605,009 3,408,269 2.5 %
Scholarships & Fellowships 88,984,234 174,860,937 263,845,171 95,154,298 179,433,910 274,588,208 106,011,157 180,719,701 286,730,858 12,142,650 4.4 %
Subtotal Expenditures 1,222,861,986$ 620,383,750$ 1,843,245,736$ 1,402,679,209$ 595,753,522$ 1,998,432,731$ 1,352,482,676$ 601,335,110$ 1,953,817,786$ (44,614,945)$ (2.2) %
Mandatory Transfers 7,702,456 7,702,456 9,096,143 9,096,143 8,589,891 8,589,891 (506,252) (5.6) %
Non-Mandatory Transfers 26,736,499 26,736,499 (63,509,375) (63,509,375) (4,305,613) (4,305,613) 59,203,762 93.2 %Total Expenditures & Transfers 1,257,300,941$ 620,383,750$ 1,877,684,691$ 1,348,265,977$ 595,753,522$ 1,944,019,499$ 1,356,766,954$ 601,335,110$ 1,958,102,064$ 14,082,565$ 0.7 %
Fund Balance Addition / (Reduction) 1,535,447$ 9,707,889$ 11,243,336$ (42,475,869)$ 859,300$ (41,616,569)$ (773,214)$ 823,612$ 50,398$
AUXILIARIES
Revenues 229,998,450$ 257,605$ 230,256,055$ 229,780,481$ 260,000$ 230,040,481$ 245,962,927$ 260,000$ 246,222,927$ 16,182,446$ 7.0 %
Expenditures and Transfers
Expenditures 162,487,928$ 281,309$ 162,769,238$ 178,595,830$ 260,000$ 178,855,830$ 184,698,151$ 260,000$ 184,958,151$ 6,102,321$ 3.4 %
Mandatory Transfers 30,475,329 30,475,329 31,758,673 31,758,673 40,667,626 40,667,626 8,908,953 28.1 %
Non-Mandatory Transfers 27,175,190 27,175,190 19,425,978 19,425,978 20,597,150 20,597,150 1,171,172 6.0 %Total Expenditures & Transfers 220,138,447$ 281,309$ 220,419,757$ 229,780,481$ 260,000$ 230,040,481$ 245,962,927$ 260,000$ 246,222,927$ 16,182,446$ 7.0 %
Fund Balance Addition / (Reduction) 9,860,002$ (23,704)$ 9,836,298$
TOTALS
Revenues 1,488,834,838$ 630,349,244$ 2,119,184,082$ 1,535,570,589$ 596,872,822$ 2,132,443,411$ 1,601,956,667$ 602,418,722$ 2,204,375,389$ 71,931,978$ 3.4 %
Expenditures and Transfers
Expenditures 1,385,349,915$ 620,665,059$ 2,006,014,974$ 1,581,275,039$ 596,013,522$ 2,177,288,561$ 1,537,180,827$ 601,595,110$ 2,138,775,937$ (38,512,624)$ (1.8) %
Mandatory Transfers 38,177,785 38,177,785 40,854,816 40,854,816 49,257,517 49,257,517 8,402,701 20.6 %
Non-Mandatory Transfers 53,911,689 53,911,689 (44,083,397) (44,083,397) 16,291,537 16,291,537 60,374,934 137.0 %Total Expenditures & Transfers 1,477,439,389$ 620,665,059$ 2,098,104,448$ 1,578,046,458$ 596,013,522$ 2,174,059,980$ 1,602,729,881$ 601,595,110$ 2,204,324,991$ 30,265,011$ 1.4 %
Fund Balance Addition / (Reduction) 11,395,449$ 9,684,184$ 21,079,634$ (42,475,869)$ 859,300$ (41,616,569)$ (773,214)$ 823,612$ 50,398$
%Probable to Proposed
Change
University of Tennessee SystemFY 2017 Proposed Budget Summary
Unrestricted and Restricted Current Funds Revenues, Expenditures and Transfers
FY 2015 Actual FY 2016 Probable FY 2017 Proposed
Schedule 10 - UT TotalD-15

FY 2013 FY 2014 FY 2015 FY 2016 FY 2017ACTUAL ACTUAL ACTUAL PROBABLE PROPOSED AMOUNT
EDUCATIONAL AND GENERALRevenues
Tuition & Fees 533,809,389$ 573,319,528$ 615,545,784$ 648,037,768$ 669,787,108$ 135,977,719$ 25.5 %State Appropriations 447,473,296 486,122,116 498,835,055 517,456,979 545,338,973 97,865,677 21.9 %Grants & Contracts 574,519,330 560,197,430 579,397,127 550,661,427 555,800,581 (18,718,749) (3.3) %Sales & Service 57,856,330 56,782,696 60,095,439 57,790,642 57,832,737 (23,593) 0.0 %Other Sources 152,144,385 121,741,019 135,054,622 128,456,114 129,393,063 (22,751,322) (15.0) %
Total Revenues 1,765,802,731$ 1,798,162,787$ 1,888,928,027$ 1,902,402,930$ 1,958,152,462$ 192,349,731$ 10.9 %
Expenditures and TransfersInstruction 611,569,394$ 636,019,932$ 661,961,368$ 726,113,945$ 720,216,687$ 108,647,293$ 17.8 %Research 277,762,160 260,705,414 256,779,818 284,024,740 247,866,206 (29,895,954) (10.8) %Public Service 133,120,201 127,928,093 130,087,649 144,781,226 140,757,594 7,637,393 5.7 %Academic Support 158,683,987 167,965,217 179,840,336 190,270,454 179,540,261 20,856,274 13.1 %Student Services 86,057,765 84,674,075 89,692,660 90,368,210 90,036,182 3,978,417 4.6 %Institutional Support 125,048,887 134,563,916 135,132,492 152,089,208 149,064,989 24,016,102 19.2 %Operation & Maintenance of Plant 119,145,974 122,246,472 125,906,243 136,196,740 139,605,009 20,459,035 17.2 %Scholarships & Fellowships 250,331,559 254,606,577 263,845,171 274,588,208 286,730,858 36,399,299 14.5 %
Subtotal Expenditures 1,761,719,928$ 1,788,709,696$ 1,843,245,736$ 1,998,432,731$ 1,953,817,786$ 192,097,858$ 10.9 %Mandatory Transfers 6,273,292 6,498,442 7,702,456 9,096,143 8,589,891 2,316,599 36.9 %Non-Mandatory Transfers (17,523,145) 20,854,833 26,736,499 (63,509,375) (4,305,613) 13,217,532 75.4 %
Total Expenditures & Transfers 1,750,470,075$ 1,816,062,971$ 1,877,684,691$ 1,944,019,499$ 1,958,102,064$ 207,631,989$ 11.9 %Fund Balance Addition/(Reduction) 15,332,656$ (17,900,184)$ 11,243,336$ (41,616,569)$ 50,398$
AUXILIARIESRevenues 199,645,425$ 207,264,677$ 230,256,055$ 230,040,481$ 246,222,927$ 46,577,502$ 23.3 %Expenditures and Transfers
Expenditures 149,454,826$ 156,840,867$ 162,769,238$ 178,855,830$ 184,958,151$ 35,503,325$ 23.8 %Mandatory Transfers 27,857,526 27,638,251 30,475,329 31,758,673 40,667,626 12,810,100 46.0 %Non-Mandatory Transfers 17,254,499 25,035,971 27,175,190 19,425,978 20,597,150 3,342,651 19.4 %
Total Expenditures & Transfers 194,566,851$ 209,515,089$ 220,419,757$ 230,040,481$ 246,222,927$ 51,656,076$ 26.5 %Fund Balance Addition/(Reduction) 5,078,574$ (2,250,412)$ 9,836,298$
TOTALSRevenues 1,965,448,156$ 2,005,427,465$ 2,119,184,082$ 2,132,443,411$ 2,204,375,389$ 238,927,233$ 12.2 %Expenditures and Transfers
Expenditures 1,911,174,754$ 1,945,550,563$ 2,006,014,974$ 2,177,288,561$ 2,138,775,937$ 227,601,183$ 11.9 %Mandatory Transfers 34,130,818 34,136,693 38,177,785 40,854,816 49,257,517 15,126,699 44.3 %Non-Mandatory Transfers (268,646) 45,890,804 53,911,689 (44,083,397) 16,291,537 16,560,183 6164.3 %
Total Expenditures & Transfers 1,945,036,926$ 2,025,578,060$ 2,098,104,448$ 2,174,059,980$ 2,204,324,991$ 259,288,065$ 13.3 %Fund Balance Addition/(Reduction) 20,411,230$ (20,150,595)$ 21,079,634$ (41,616,569)$ 50,398$
%
University of Tennessee SystemFive Year FY17 Proposed Budget Summary Comparison
Current Funds Revenues, Expenditures and Transfers - UNRESTRICTED AND RESTRICTED
FY 2013 TO FY 2017CHANGE
Schedule 9 - UT Total
D-16

Budget Unit Faculty Administrative Professional
Clerical, Technical,
Maintenance Total
Chattanooga 476 127 234 340 1,177 Knoxville 1,557 311 777 1,694 4,339 Martin 328 59 130 287 804 Space Institute 25 10 11 41 87 Health Science Center
Memphis 608 132 293 719 1,752 Memorial Research Center 4 2 4 3 13 Family Practice - Jackson 10 4 50 64 Family Practice - Knoxville 10 2 5 47 64 Family Practice - Memphis 18 20 38 Clinical Ed. Center - Chattanooga 4 2 4 2 12 Clinical Ed. Center - Knoxville 27 3 10 33 73
Sub-total Health Science Center 681 141 340 854 2,016 Institute of Agriculture
Agricultural Experiment Station 98 18 83 117 316 UT Extension 62 16 284 208 570 Veterinary Medicine 105 10 35 196 346
Sub-total Institute of Agriculture 265 44 402 521 1,232 Public Service Units
Institute for Public Service 4 14 10 28 MTAS 2 34 10 46 CTAS 1 24 8 33
Sub-total Public Service Units 7 72 28 107
System Administration 1 68 153 76 298 Total Unrestricted E&G 3,333 767 2,119 3,841 10,060
Chattanooga 5 5 25 35 Knoxville 56 186 456 698 Martin 3 10 40 53 Space Institute 5 5 Health Science Center 1 5 6
Total Auxiliaries 65 201 531 797
Chattanooga 26 10 25 28 89 Knoxville 166 37 714 377 1,294 Martin 5 2 49 18 74 Space Institute 2 3 2 7 Health Science Center
Memphis 387 26 667 718 1,798 Memorial Research Center 2 4 13 19 Clinical Ed. Center - Chattanooga 144 1 6 20 171 Clinical Ed. Center - Knoxville 178 7 21 47 253 FMU - Knoxville 5 2 7
Sub-total Health Science Center 716 34 700 798 2,248 Institute of Agriculture
Agricultural Experiment Station 6 1 26 28 61 UT Extension 8 2 181 303 494 Veterinary Medicine 3 4 7
Sub-total Institute of Agriculture 14 3 210 335 562 Public Service Units
Institute for Public Service 31 31 MTAS 3 3 CTAS
Sub-total Public Service Units 34 34 UWA 1 1
Total Restricted E&G 929 86 1,735 1,559 4,309
TOTAL UNIVERSITY POSITIONS 4,262 918 4,055 5,931 15,166
Percent of Total 28% 6% 27% 39% 100%
RESTRICTED EDUCATION AND GENERAL (E&G)
University of Tennessee SystemFY 2016-17 Proposed Budget Positions
All Full-time and Part-time Positions
UNRESTRICTED EDUCATION AND GENERAL (E&G)
AUXILIARIES
D-17

The University of Tennessee at ChattanoogaFY 2017 Proposed Budget
Unrestricted E&G Funds
State Appropriations
$46.630%
Grants & Contracts
$0.5.3%
Other$0.2.2%
Sales & Services$4.93%
Tuition & Fees$103.066%
Revenues$155.4 mil l ion
Instruction$66.644%
Research$2.11%
Public Service$2.62%
Academic Support$12.48%
Student Services$24.216%
Institutional Support$12.08%
Oper./Maint.$20.413%
Scholarships/Fellowships
$12.78%
Expenditures$153.0 mi l l ion
Faculty 502
Administrative 142
Professional 264
Cler/Tech/Maint 393
TOTAL 1,301
FTE Positions (Unrestricted & Restricted)
July 1, 2016
Undergraduate 10,083
Graduate 1,304
TOTAL 11,387
First-time Freshmen 1,864
Fall 2015 Headcount Enrollment
Current FundRevenues($ Millions
Unrestricted Funds
E & G $155.4
Auxiliaries 14.2
Unrestricted Total $169.6
Restricted Funds
E & G 55.8
TOTAL FUNDS $225.4
D-18

ChattanoogaFY 2017 Proposed Budget Summary
Unrestricted Current Funds Revenues, Expenditures, and Transfers
CHANGEFY 2015 FY 2016 FY 2017 PROBABLE TO PROPOSED
ACTUALS PROBABLE PROPOSED AMOUNT %EDUCATIONAL AND GENERALRevenues
Tuition & Fees 101,724,207$ 102,628,250$ 102,981,384$ 353,134$ 0.3 %State Appropriations 38,442,081 42,640,805 46,639,305 3,998,500 9.4 %Grants & Contracts 802,628 662,845 453,856 (208,989) (31.5) %Sales & Service 5,757,143 5,088,679 5,088,679 Other Sources 266,489 239,500 239,500
Total Revenues 146,992,547$ 151,260,079$ 155,402,724$ 4,142,645$ 2.7 %
Expenditures and TransfersInstruction 58,758,457$ 65,562,795$ 66,516,644$ 953,849$ 1.5 %Research 2,789,532 3,221,033 2,129,881 (1,091,152) (33.9) %Public Service 2,353,088 2,731,245 2,626,075 (105,170) (3.9) %Academic Support 13,826,644 15,880,732 12,412,821 (3,467,911) (21.8) %Student Services 26,043,300 24,389,350 24,191,095 (198,255) (0.8) %Institutional Support 10,226,361 12,740,739 12,025,960 (714,779) (5.6) %Operation & Maintenance of Plant 14,811,159 19,775,690 20,422,813 647,123 3.3 %Scholarships & Fellowships 11,572,385 12,521,220 12,646,432 125,212 1.0 %
Subtotal Expenditures 140,380,925$ 156,822,804$ 152,971,721$ (3,851,083)$ (2.5) %Mandatory Transfers 688,528 667,115 874,165 207,050 31.0 %Non-Mandatory Transfers 5,558,862 (6,296,420) 1,490,258 7,786,678 123.7 %
Total Expenditures & Transfers 146,628,315$ 151,193,499$ 155,336,144$ 4,142,645$ 2.7 %Fund Balance Addition/(Reduction) 364,233$ 66,580$ 66,580$
AUXILIARIESRevenues 15,146,190$ 14,318,863$ 14,184,296$ (134,567)$ (0.9) %Expenditures and Transfers
Expenditures 9,768,772 10,495,305 10,360,738 (134,567) (1.3) %Mandatory Transfers 1,376,244 1,803,780 1,803,780 Non-Mandatory Transfers 3,875,617 2,019,778 2,019,778
Total Expenditures & Transfers 15,020,633$ 14,318,863$ 14,184,296$ (134,567)$ (0.9) %Fund Balance Addition/(Reduction) 125,557$
TOTALSRevenues 162,138,737$ 165,578,942$ 169,587,020$ 4,008,078$ 2.4 %Expenditures and Transfers
Expenditures 150,149,697$ 167,318,109$ 163,332,459$ (3,985,650)$ (2.4) %Mandatory Transfers 2,064,772 2,470,895 2,677,945 207,050 8.4 %Non-Mandatory Transfers 9,434,479 (4,276,642) 3,510,036 7,786,678 182.1 %
Total Expenditures & Transfers 161,648,948$ 165,512,362$ 169,520,440$ 4,008,078$ 2.4 %Fund Balance Addition/(Reduction) 489,789$ 66,580$ 66,580$
Schedule 15 - UTCD-19

FY 2013 FY 2014 FY 2015 FY 2016 FY 2017ACTUAL ACTUAL ACTUAL PROBABLE PROPOSED AMOUNT
EDUCATIONAL AND GENERALRevenues
Tuition & Fees 86,525,109$ 94,436,452$ 101,724,207$ 102,628,250$ 102,981,384$ 16,456,275$ 19.0 %State Appropriations 35,523,864 37,467,181 38,442,081 42,640,805 46,639,305 11,115,441 31.3 %Grants & Contracts 891,905 912,181 802,628 662,845 453,856 (438,049) (49.1) %Sales & Service 4,698,919 4,725,277 5,757,143 5,088,679 5,088,679 389,760 8.3 %Other Sources 334,235 221,685 266,489 239,500 239,500 (94,735) (28.3) %
Total Revenues 127,974,032$ 137,762,775$ 146,992,547$ 151,260,079$ 155,402,724$ 27,428,692$ 21.4
Expenditures and TransfersInstruction 55,186,168$ 57,801,004$ 58,758,457$ 65,562,795$ 66,516,644$ 11,330,476$ 20.5 %Research 3,498,130 3,212,076 2,789,532 3,221,033 2,129,881 (1,368,249) (39.1) %Public Service 2,331,469 2,387,884 2,353,088 2,731,245 2,626,075 294,606 12.6 %Academic Support 10,136,131 11,023,003 13,826,644 15,880,732 12,412,821 2,276,690 22.5 %Student Services 22,960,974 23,193,377 26,043,300 24,389,350 24,191,095 1,230,121 5.4 %Institutional Support 9,668,887 10,892,431 10,226,361 12,740,739 12,025,960 2,357,073 24.4 %Operation & Maintenance of Plant 14,046,694 14,806,376 14,811,159 19,775,690 20,422,813 6,376,119 45.4 %Scholarships & Fellowships 10,019,162 10,821,928 11,572,385 12,521,220 12,646,432 2,627,270 26.2 %
Subtotal Expenditures 127,847,614$ 134,138,078$ 140,380,925$ 156,822,804$ 152,971,721$ 25,124,107$ 19.7 %Mandatory Transfers 686,465 687,455 688,528 667,115 874,165 187,700 27.3 %Non-Mandatory Transfers (510,107) 2,416,245 5,558,862 (6,296,420) 1,490,258 2,000,365 392.1 %
Total Expenditures & Transfers 128,023,972$ 137,241,778$ 146,628,315$ 151,193,499$ 155,336,144$ 27,312,172$ 21.3 %Fund Balance Addition/(Reduction) (49,940)$ 520,997$ 364,233$ 66,580$ 66,580$
AUXILIARIESRevenues 12,457,401$ 13,733,782$ 15,146,190$ 14,318,863$ 14,184,296$ 1,726,895$ 13.9 %Expenditures and Transfers
Expenditures 8,260,043$ 9,003,458$ 9,768,772$ 10,495,305$ 10,360,738$ 2,100,695$ 25.4 %Mandatory Transfers 1,393,599 1,399,953 1,376,244 1,803,780 1,803,780 410,181 29.4 %Non-Mandatory Transfers 2,739,968 3,208,383 3,875,617 2,019,778 2,019,778 (720,190) (26.3) %
Total Expenditures & Transfers 12,393,610$ 13,611,794$ 15,020,633$ 14,318,863$ 14,184,296$ 1,790,686$ 14.4 %Fund Balance Addition/(Reduction) 63,791$ 121,988$ 125,557$
TOTALSRevenues 140,431,432$ 151,496,558$ 162,138,737$ 165,578,942$ 169,587,020$ 29,155,588$ 20.8 %Expenditures and Transfers
Expenditures 136,107,657$ 143,141,536$ 150,149,697$ 167,318,109$ 163,332,459$ 27,224,802$ 20.0 %Mandatory Transfers 2,080,064 2,087,408 2,064,772 2,470,895 2,677,945 597,881 28.7 %Non-Mandatory Transfers 2,229,861 5,624,628 9,434,479 (4,276,642) 3,510,036 1,280,175 57.4 %
Total Expenditures & Transfers 140,417,582$ 150,853,572$ 161,648,948$ 165,512,362$ 169,520,440$ 29,102,858$ 20.7 %Fund Balance Addition/(Reduction) 13,850$ 642,986$ 489,789$ 66,580$ 66,580$
ChattanoogaFive Year FY17 Proposed Budget Summary Comparison
Current Funds Revenues, Expenditures and Transfers - UNRESTRICTED
FY 2013 TO FY 2017%
CHANGE
Schedule 8 - UTCD-20

ChattanoogaUnrestricted Net Assets
E&G AUXILIARIES TOTALNet Assets - June 30, 2014 9,038,783$ 1,390,165$ 10,428,948$ Percent Unallocated of Expend. & Transfers * 4.44% 3.81% 4.39%
FY 2014-15 ACTUALRevenue 146,992,547$ 15,146,190$ 162,138,737$ Less:
Expenditures 140,380,925$ 9,768,772$ 150,149,697$ Mandatory Transfers 688,528 1,376,244 2,064,772 Non-Mandatory Transfers 5,558,862 3,875,617 9,434,479
Total Expenditures & Transfers 146,628,314$ 15,020,633$ 161,648,947$ Net Change 364,233$ 125,557$ 489,790$ Unrestricted Net Assets
Working Capital-Accounts Receivable 3,114,462$ $ 940,722$ 4,055,184$ Working Capital-Petty CashWorking Capital-Inventories 88,555 88,555 Revolving Funds - Encumbrances - Unexpended Gifts - Reappropriations - Unallocated 6,200,000 575,000 6,775,000
Net Assets - June 30, 2015 9,403,016$ 1,515,722$ 10,918,738$ Percent Unallocated of Expend. & Transfers * 4.23% 3.83% 4.19%
FY 2015-16 PROBABLE BUDGETRevenue 151,260,079$ 14,318,863$ 165,578,942$ Less:
Expenditures 156,822,804$ 10,495,305$ 167,318,109$ Mandatory Transfers 667,115 1,803,780 2,470,895 Non-Mandatory Transfers (6,296,420) 2,019,778 (4,276,642)
Total Expenditures & Transfers 151,193,499$ 14,318,863$ 165,512,362$ Net Change 66,580$ -$ 66,580$ Unrestricted Net Assets
Working Capital-Accounts Receivable 3,114,462$ $ 940,722$ 4,055,184$ Working Capital-Petty Cash - Working Capital-Inventories 88,555 88,555 Revolving Funds - Encumbrances - Unexpended Gifts - Reappropriations - Unallocated 6,266,579 575,000 6,841,579
Estimated Net Assets - June 30, 2016 9,469,596$ 1,515,722$ 10,985,318$ Percent Unallocated of Expend. & Transfers * 4.14% 4.02% 4.13%
FY 2016-17 PROPOSED BUDGETRevenue 155,402,724$ 14,184,296$ 169,587,020$ Less:
Expenditures 152,971,721$ 10,360,738$ 163,332,459$ Mandatory Transfers 874,165 1,803,780 2,677,945 Non-Mandatory Transfers 1,490,258 2,019,778 3,510,036
Total Expenditures & Transfers 155,336,144$ 14,184,296$ 169,520,440$ Net Change 66,580$ -$ 66,580$ Unrestricted Net Assets
Working Capital-Accounts Receivable 3,114,462$ $ 940,722$ 4,055,184$ Working Capital-Petty Cash - Working Capital-Inventories 88,555 88,555 Revolving Funds - Encumbrances - Unexpended Gifts - Reappropriations - Unallocated 6,333,159 575,000 6,908,159
Estimated Net Assets - June 30, 2017 9,536,176$ 1,515,722$ 11,051,898$ Percent Unallocated of Expend. & Transfers * 4.08% 4.05% 4.08%
* Recommended percent for unallocated expenditures is 2% to 5% for E&G and 3% to 5% for auxiliaries.
Net Assets ‐ UTCD-21
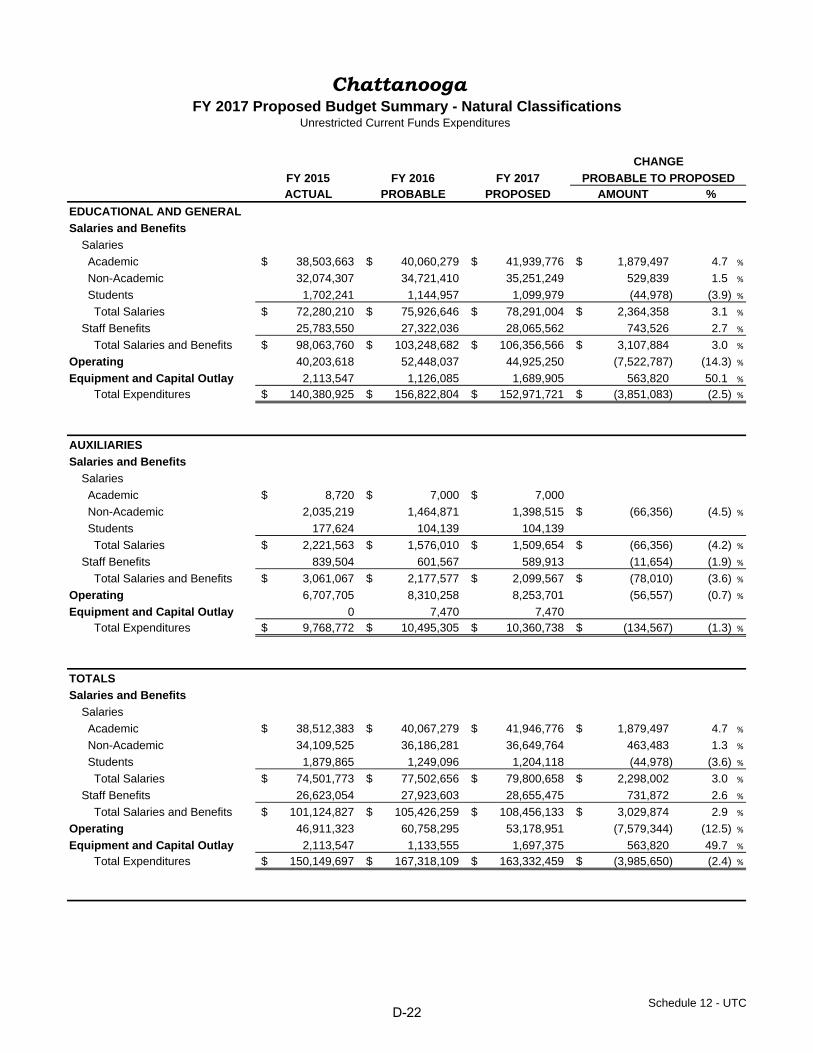
FY 2015 FY 2016 FY 2017ACTUAL PROBABLE PROPOSED AMOUNT
EDUCATIONAL AND GENERAL
Salaries and Benefits
Salaries
Academic 38,503,663$ 40,060,279$ 41,939,776$ 1,879,497$ 4.7 %
Non-Academic 32,074,307 34,721,410 35,251,249 529,839 1.5 %
Students 1,702,241 1,144,957 1,099,979 (44,978) (3.9) %
Total Salaries 72,280,210$ 75,926,646$ 78,291,004$ 2,364,358$ 3.1 %
Staff Benefits 25,783,550 27,322,036 28,065,562 743,526 2.7 %
Total Salaries and Benefits 98,063,760$ 103,248,682$ 106,356,566$ 3,107,884$ 3.0 %
Operating 40,203,618 52,448,037 44,925,250 (7,522,787) (14.3) %
Equipment and Capital Outlay 2,113,547 1,126,085 1,689,905 563,820 50.1 %
Total Expenditures 140,380,925$ 156,822,804$ 152,971,721$ (3,851,083)$ (2.5) %
AUXILIARIES
Salaries and Benefits
Salaries
Academic 8,720$ 7,000$ 7,000$
Non-Academic 2,035,219 1,464,871 1,398,515 (66,356)$ (4.5) %
Students 177,624 104,139 104,139
Total Salaries 2,221,563$ 1,576,010$ 1,509,654$ (66,356)$ (4.2) %
Staff Benefits 839,504 601,567 589,913 (11,654) (1.9) %
Total Salaries and Benefits 3,061,067$ 2,177,577$ 2,099,567$ (78,010)$ (3.6) %
Operating 6,707,705 8,310,258 8,253,701 (56,557) (0.7) %
Equipment and Capital Outlay 0 7,470 7,470Total Expenditures 9,768,772$ 10,495,305$ 10,360,738$ (134,567)$ (1.3) %
TOTALS
Salaries and Benefits
Salaries
Academic 38,512,383$ 40,067,279$ 41,946,776$ 1,879,497$ 4.7 %
Non-Academic 34,109,525 36,186,281 36,649,764 463,483 1.3 %
Students 1,879,865 1,249,096 1,204,118 (44,978) (3.6) %
Total Salaries 74,501,773$ 77,502,656$ 79,800,658$ 2,298,002$ 3.0 %
Staff Benefits 26,623,054 27,923,603 28,655,475 731,872 2.6 %
Total Salaries and Benefits 101,124,827$ 105,426,259$ 108,456,133$ 3,029,874$ 2.9 %
Operating 46,911,323 60,758,295 53,178,951 (7,579,344) (12.5) %
Equipment and Capital Outlay 2,113,547 1,133,555 1,697,375 563,820 49.7 %
Total Expenditures 150,149,697$ 167,318,109$ 163,332,459$ (3,985,650)$ (2.4) %
%
CHANGE
FY 2017 Proposed Budget Summary - Natural ClassificationsUnrestricted Current Funds Expenditures
Chattanooga
PROBABLE TO PROPOSED
Schedule 12 - UTCD-22

ChattanoogaFY 2017 Proposed Budget Summary
Auxiliary Enterprises Funds Revenues, Expenditures and Transfers
CHANGEFY 2015 FY 2016 FY 2017 PROBABLE TO PROPOSEDACTUAL PROBABLE PROPOSED AMOUNT %
HOUSINGRevenues 10,230,684$ 9,799,535$ 9,799,535$ Expenditures and TransfersExpenditures 7,347,236$ 6,792,013$ 6,792,013$ Mandatory Transfers 1,162,642 1,479,362 1,479,362 Non-Mandatory Transfers 1,670,109 1,528,160 1,528,160 Total Expenditures and Transfers 10,179,987$ 9,799,535$ 9,799,535$
Fund Balance Addition/(Reduction) 50,697$
FOOD SERVICERevenues 1,141,380$ 929,318$ 914,688$ (14,630)$ -1.6%Expenditures and TransfersExpenditures 322,032$ 801,835$ 787,205$ (14,630)$ -1.8%Mandatory TransfersNon-Mandatory Transfers 819,348 127,483 127,483 Total Expenditures and Transfers 1,141,380$ 929,318$ 914,688$ (14,630)$ -1.6%
Fund Balance Addition/(Reduction)
BOOKSTORESRevenues 1,019,994$ 400,758$ 500,000$ 99,242$ 24.8%Expenditures and TransfersExpenditures 82,868$ 152,205$ 251,447$ 99,242$ 65.2%Mandatory Transfers - 109,418 109,418 Non-Mandatory Transfers 937,126 139,135 139,135 Total Expenditures and Transfers 1,019,994$ 400,758$ 500,000$ 99,242$ 24.8%
Fund Balance Addition/(Reduction)
PARKINGRevenues 1,613,590$ 1,879,355$ 1,787,634$ (91,721)$ -4.9%Expenditures and TransfersExpenditures 1,331,533$ 1,439,355$ 1,347,634$ (91,721)$ -6.4%Mandatory Transfers 213,602 215,000 215,000 Non-Mandatory Transfers 68,455 225,000 225,000 Total Expenditures and Transfers 1,613,590$ 1,879,355$ 1,787,634$ (91,721)$ -4.9%
Fund Balance Addition/(Reduction)
ATHLETICSRevenues 568,132$ 262,500$ 262,500$ Expenditures and TransfersExpenditures 568,132$ 262,500$ 262,500$ Mandatory TransfersNon-Mandatory TransfersTotal Expenditures and Transfers 568,132$ 262,500$ 262,500$
Fund Balance Addition/(Reduction)
OTHERRevenues 572,410$ 1,047,397$ 919,939$ (127,458)$ -12.2%Expenditures and TransfersExpenditures 116,971$ 1,047,397$ 919,939$ (127,458)$ -12.2%Mandatory TransfersNon-Mandatory Transfers 380,580 Total Expenditures and Transfers 497,551$ 1,047,397$ 919,939$ (127,458)$ -12.2%
Fund Balance Addition/(Reduction) 74,859$
TOTALRevenues 15,146,190$ 14,318,863$ 14,184,296$ (134,567)$ -0.9%Expenditures and TransfersExpenditures 9,768,772$ 10,495,305$ 10,360,738$ (134,567)$ -1.3%Mandatory Transfers 1,376,244 1,803,780 1,803,780 Non-Mandatory Transfers 3,875,618 2,019,778 2,019,778 Total Expenditures and Transfers 15,020,634$ 14,318,863$ 14,184,296$ (134,567)$ -0.9%
Fund Balance Addition/(Reduction) 125,556$
Schedule 13 - Auxiliaries
D-23

Unrestricted Restricted Total Unrestricted Restricted Total Unrestricted Restricted Total Amount
EDUCATION AND GENERAL
Revenues
Tuition & Fees 101,724,207$ 101,724,207$ 102,628,250$ 102,628,250$ 102,981,384$ 102,981,384$ 353,134$ 0.3 %
State Appropriations 38,442,081 773,015$ 39,215,096 42,640,805 757,249$ 43,398,054 46,639,305 744,999$ 47,384,304 3,986,250 9.2 %
Grants & Contracts 802,628 47,298,178 48,100,806 662,845 44,726,919 45,389,764 453,856 44,726,919 45,180,775 (208,989) (0.5) %
Sales & Service 5,757,143 5,757,143 5,088,679 5,088,679 5,088,679 5,088,679
Other Sources 266,489 11,191,127 11,457,615 239,500 10,333,789 10,573,289 239,500 10,333,789 10,573,289
Total Revenues 146,992,547$ 59,262,319$ 206,254,867$ 151,260,079$ 55,817,957$ 207,078,036$ 155,402,724$ 55,805,707$ 211,208,431$ 4,130,395$ 2.0 %
Expenditures and Transfers
Instruction 58,758,457$ 4,883,305$ 63,641,761$ 65,562,795 4,883,305$ 70,446,100$ 66,516,644$ 4,883,305$ 71,399,949$ 953,849$ 1.4 %
Research 2,789,532 3,548,194 6,337,726 3,221,033 2,111,686 5,332,719 2,129,881 2,111,686 4,241,567 (1,091,152) (20.5) %
Public Service 2,353,088 978,131 3,331,218 2,731,245 1,193,137 3,924,382 2,626,075 1,193,137 3,819,212 (105,170) (2.7) %
Academic Support 13,826,644 3,353,143 17,179,787 15,880,732 2,447,873 18,328,605 12,412,821 2,447,873 14,860,694 (3,467,911) (18.9) %
Student Services 26,043,300 1,087,926 27,131,226 24,389,350 980,233 25,369,583 24,191,095 980,233 25,171,328 (198,255) (0.8) %
Institutional Support 10,226,361 342,802 10,569,162 12,740,739 188,926 12,929,665 12,025,960 188,926 12,214,886 (714,779) (5.5) %
Operation & Maintenance of Plant 14,811,159 606 14,811,765 19,775,690 1,000 19,776,690 20,422,813 1,000 20,423,813 647,123 3.3 %
Scholarships & Fellowships 11,572,385 43,404,012 54,976,398 12,521,220 43,263,065 55,784,285 12,646,432 43,263,065 55,909,497 125,212 0.2 %
Subtotal Expenditures 140,380,925$ 57,598,119$ 197,979,043$ 156,822,804$ 55,069,225$ 211,892,029$ 152,971,721$ 55,069,225$ 208,040,946$ (3,851,083)$ (1.8) %
Mandatory Transfers 688,528 688,528 667,115 667,115 874,165 874,165 207,050 31.0 %
Non-Mandatory Transfers 5,558,862 5,558,862 (6,296,420) (6,296,420) 1,490,258$ 1,490,258 7,786,678 123.7 %
Total Expenditures & Transfers 146,628,315$ 57,598,119$ 204,226,433$ 151,193,499$ 55,069,225$ 206,262,724$ 155,336,144$ 55,069,225$ 210,405,369$ 4,142,645$ 2.0 %
Fund Balance Addition / (Reduction) 364,233$ 1,664,201$ 2,028,433$ 66,580$ 748,732$ 815,312$ 66,580$ 736,482$ 803,062$
AUXILIARIES
Revenues 15,146,190$ 15,146,190$ 14,318,863$ 14,318,863$ 14,184,296$ 14,184,296$ (134,567)$ (0.9) %
Expenditures and Transfers
Expenditures 9,768,772$ 9,768,772$ 10,495,305$ 10,495,305$ 10,360,738$ 10,360,738$ (134,567)$ (1.3) %
Mandatory Transfers 1,376,244 1,376,244 1,803,780 1,803,780 1,803,780 1,803,780
Non-Mandatory Transfers 3,875,617 3,875,617 2,019,778 2,019,778 2,019,778 2,019,778
Total Expenditures & Transfers 15,020,633$ 15,020,633$ 14,318,863$ 14,318,863$ 14,184,296$ 14,184,296$ (134,567)$ (0.9) %
Fund Balance Addition / (Reduction) 125,557$ 125,557$
TOTALS
Revenues 162,138,737$ 59,262,319$ 221,401,056$ 165,578,942$ 55,817,957$ 221,396,899$ 169,587,020$ 55,805,707$ 225,392,727$ 3,995,828$ 1.8 %
Expenditures and Transfers
Expenditures 150,149,697$ 57,598,119$ 207,747,815$ 167,318,109$ 55,069,225$ 222,387,334$ 163,332,459$ 55,069,225$ 218,401,684$ (3,985,650)$ (1.8) %
Mandatory Transfers 2,064,772 2,064,772 2,470,895 2,470,895 2,677,945 2,677,945 207,050 8.4 %
Non-Mandatory Transfers 9,434,479 9,434,479 (4,276,642) (4,276,642) 3,510,036 3,510,036 7,786,678 182.1 %
Total Expenditures & Transfers 161,648,948$ 57,598,119$ 219,247,066$ 165,512,362$ 55,069,225$ 220,581,587$ 169,520,440$ 55,069,225$ 224,589,665$ 4,008,078$ 1.8 %
Fund Balance Addition / (Reduction) 489,789$ 1,664,201$ 2,153,990$ 66,580$ 748,732$ 815,312$ 66,580$ 736,482$ 803,062$
% FY 2015 Actual FY 2016 Probable FY 2017 Proposed
ChattanoogaFY 2017 Proposed Budget Summary
Unrestricted and Restricted Current Funds Revenues, Expenditures and Transfers
ChangeProbable to Proposed
Schedule 10 - UTCD-24

FY 2013 FY 2014 FY 2015 FY 2016 FY 2017ACTUAL ACTUAL ACTUAL PROBABLE PROPOSED AMOUNT
EDUCATIONAL AND GENERALRevenues
Tuition & Fees 86,525,109$ 94,436,452$ 101,724,207$ 102,628,250$ 102,981,384$ 16,456,275$ 19.0 %State Appropriations 36,288,362 38,259,242 39,215,096 43,398,054 47,384,304 11,095,942 30.6 %Grants & Contracts 48,711,499 48,065,126 48,100,806 45,389,764 45,180,775 (3,530,724) (7.2) %Sales & Service 4,698,919 4,725,277 5,757,143 5,088,679 5,088,679 389,760 8.3 %Other Sources 9,776,733 10,398,276 11,457,615 10,573,289 10,573,289 796,556 8.1 %
Total Revenues 186,000,621$ 195,884,373$ 206,254,867$ 207,078,036$ 211,208,431$ 25,207,810$ 13.6 %
Expenditures and TransfersInstruction 61,526,565$ 63,318,968$ 63,641,761$ 70,446,100$ 71,399,949$ 9,873,384$ 16.0 %Research 7,070,371 5,838,833 6,337,726 5,332,719 4,241,567 (2,828,804) (40.0) %Public Service 3,642,543 3,381,269 3,331,218 3,924,382 3,819,212 176,669 4.9 %Academic Support 13,461,924 14,868,270 17,179,787 18,328,605 14,860,694 1,398,770 10.4 %Student Services 24,061,518 24,758,917 27,131,226 25,369,583 25,171,328 1,109,810 4.6 %Institutional Support 10,007,009 11,154,440 10,569,162 12,929,665 12,214,886 2,207,877 22.1 %Operation & Maintenance of Plant 14,160,893 14,806,557 14,811,765 19,776,690 20,423,813 6,262,920 44.2 %Scholarships & Fellowships 51,962,993 53,321,690 54,976,398 55,784,285 55,909,497 3,946,504 7.6 %
Subtotal Expenditures 185,893,816$ 191,448,944$ 197,979,043$ 211,892,029$ 208,040,946$ 22,147,130$ 11.9 %Mandatory Transfers 686,465 687,455 688,528 667,115 874,165 187,700 27.3 %Non-Mandatory Transfers (510,107) 2,416,245 5,558,862 (6,296,420) 1,490,258 2,000,365 392.1 %
Total Expenditures & Transfers 186,070,174$ 194,552,644$ 204,226,433$ 206,262,724$ 210,405,369$ 24,335,195$ 13.1 %Fund Balance Addition/(Reduction) (69,553)$ 1,331,729$ 2,028,433$ 815,312$ 803,062$
AUXILIARIESRevenues 12,457,401$ 13,733,782$ 15,146,190$ 14,318,863$ 14,184,296$ 1,726,895$ 13.9 %Expenditures and Transfers
Expenditures 8,260,043$ 9,003,458$ 9,768,772$ 10,495,305$ 10,360,738$ 2,100,695$ 25.4 %Mandatory Transfers 1,393,599 1,399,953 1,376,244 1,803,780 1,803,780 410,181 29.4 %Non-Mandatory Transfers 2,739,968 3,208,383 3,875,617 2,019,778 2,019,778 (720,190) (26.3) %
Total Expenditures & Transfers 12,393,610$ 13,611,794$ 15,020,633$ 14,318,863$ 14,184,296$ 1,790,686$ 14.4 %Fund Balance Addition/(Reduction) 63,791$ 121,988$ 125,557$
TOTALSRevenues 198,458,022$ 209,618,155$ 221,401,056$ 221,396,899$ 225,392,727$ 26,934,705$ 13.6 %Expenditures and Transfers
Expenditures 194,153,859$ 200,452,402$ 207,747,815$ 222,387,334$ 218,401,684$ 24,247,825$ 12.5 %Mandatory Transfers 2,080,064 2,087,408 2,064,772 2,470,895 2,677,945 597,881 28.7 %Non-Mandatory Transfers 2,229,861 5,624,628 9,434,479 (4,276,642) 3,510,036 1,280,175 57.4 %
Total Expenditures & Transfers 198,463,784$ 208,164,438$ 219,247,066$ 220,581,587$ 224,589,665$ 26,125,881$ 13.2 %Fund Balance Addition/(Reduction) (5,762)$ 1,453,717$ 2,153,990$ 815,312$ 803,062$
ChattanoogaFive Year FY17 Proposed Budget Summary Comparison
Current Funds Revenues, Expenditures and Transfers - UNRESTRICTED AND RESTRICTED
FY 2013 TO FY 2017%
CHANGE
Schedule 9 - UTCD-25

The University of Tennessee at KnoxvilleFY 2017 Proposed Budget
Unrestricted E&G Funds
State Appropriations
$202.631%
Grants & Contracts$22.64%
Other$11.72%Sales & Services
$5.5.9%
Tuition & Fees$407.363%
Revenues$649.7 mil l ion
Instruction$282.645%
Research$23.54%
Public Service$12.72%
Academic Support$71.611%
Student Services$45.17%
Institutional Support$50.08%
Oper./Maint.$74.612%
Scholarships/Fellowships
$74.812%
Expenditures$634.9 mil l ion
Faculty 1,723
Administrative 404
Professional 1,677
Cler/Tech/Maint 2,527
TOTAL 6,331
FTE Positions (Unrestricted & Restricted)
July 1, 2016
Undergraduate 21,863
Graduate 5,982
TOTAL 27,845
First-time Freshmen 4,719
Fall 2015 Headcount Enrollment
Current FundRevenues($ Millions)
Unrestricted Funds
E & G $ 649.7
Auxiliaries 219.6
Unrestricted Total $ 869.3
Restricted Funds
E & G $ 242.9
Auxiliaries .3
Restricted Total $ 243.2
TOTAL FUNDS $ 1,112.5
D-26

KnoxvilleFY 2017 Proposed Budget Summary
Unrestricted Current Funds Revenues, Expenditures, and Transfers
CHANGEFY 2015 FY 2016 FY 2017 PROBABLE TO PROPOSED
ACTUALS PROBABLE PROPOSED AMOUNT %EDUCATIONAL AND GENERALRevenues
Tuition & Fees 363,293,977$ 391,725,353$ 407,278,045$ 15,552,692$ 4.0 %State Appropriations 182,310,443 191,207,355 202,644,855 11,437,500 6.0 %Grants & Contracts 25,913,526 22,560,000 22,560,000 Sales & Service 7,348,472 5,780,775 5,538,268 (242,507) (4.2) %Other Sources 12,751,006 11,610,693 11,708,857 98,164 0.8 %
Total Revenues 591,617,424$ 622,884,176$ 649,730,025$ 26,845,849$ 4.3 %
Expenditures and TransfersInstruction 234,529,087$ 283,165,480$ 282,648,112$ (517,368)$ (0.2) %Research 32,520,982 44,908,490 23,457,198 (21,451,292) (47.8) %Public Service 12,506,281 14,129,360 12,650,139 (1,479,221) (10.5) %Academic Support 65,409,954 71,324,950 71,624,930 299,980 0.4 %Student Services 43,849,688 44,908,408 45,150,420 242,012 0.5 %Institutional Support 44,966,990 49,904,670 49,882,809 (21,861) 0.0 %Operation & Maintenance of Plant 60,939,574 72,766,124 74,657,889 1,891,765 2.6 %Scholarships & Fellowships 59,826,184 64,228,188 74,811,428 10,583,240 16.5 %
Subtotal Expenditures 554,548,740$ 645,335,670$ 634,882,925$ (10,452,745)$ (1.6) %Mandatory Transfers 1,745,964 1,645,162 747,685 (897,477) (54.6) %Non-Mandatory Transfers 35,170,885 (24,096,656) 14,099,415 38,196,071 158.5 %
Total Expenditures & Transfers 591,465,589$ 622,884,176$ 649,730,025$ 26,845,849$ 4.3 %Fund Balance Addition/(Reduction) 151,835$
AUXILIARIESRevenues 203,163,591$ 202,976,598$ 219,639,669$ 16,663,071$ 8.2 %Expenditures and Transfers
Expenditures 145,086,602 158,643,562 165,632,322 6,988,760 4.4 %Mandatory Transfers 26,224,698 27,545,274 36,451,629 8,906,355 32.3 %Non-Mandatory Transfers 22,381,046 16,787,762 17,555,718 767,956 4.6 %
Total Expenditures & Transfers 193,692,346$ 202,976,598$ 219,639,669$ 16,663,071$ 8.2 %Fund Balance Addition/(Reduction) 9,471,244$
TOTALSRevenues 794,781,015$ 825,860,774$ 869,369,694$ 43,508,920$ 5.3 %Expenditures and Transfers
Expenditures 699,635,342$ 803,979,232$ 800,515,247$ (3,463,985)$ (0.4) %Mandatory Transfers 27,970,662 29,190,436 37,199,314 8,008,878 27.4 %Non-Mandatory Transfers 57,551,931 (7,308,894) 31,655,133 38,964,027 533.1 %
Total Expenditures & Transfers 785,157,935$ 825,860,774$ 869,369,694$ 43,508,920$ 5.3 %Fund Balance Addition/(Reduction) 9,623,079$
Schedule 15 - UTKD-27

FY 2013 FY 2014 FY 2015 FY 2016 FY 2017ACTUAL ACTUAL ACTUAL PROBABLE PROPOSED AMOUNT
EDUCATIONAL AND GENERALRevenues
Tuition & Fees 305,640,162$ 332,420,932$ 363,293,977$ 391,725,353$ 407,278,045$ 101,637,883$ 33.3 %State Appropriations 156,439,550 177,568,343 182,310,443 191,207,355 202,644,855 46,205,305 29.5 %Grants & Contracts 29,036,239 27,731,017 25,913,526 22,560,000 22,560,000 (6,476,239) (22.3) %Sales & Service 9,587,584 7,131,134 7,348,472 5,780,775 5,538,268 (4,049,316) (42.2) %Other Sources 12,947,014 12,172,412 12,751,006 11,610,693 11,708,857 (1,238,157) (9.6) %
Total Revenues 513,650,550$ 557,023,838$ 591,617,424$ 622,884,176$ 649,730,025$ 136,079,475$ 26.5 %
Expenditures and TransfersInstruction 218,498,737$ 230,436,968$ 234,529,087$ 283,165,480$ 282,648,112$ 64,149,375$ 29.4 %Research 35,594,360 30,367,552 32,520,982 44,908,490 23,457,198 (12,137,162) (34.1) %Public Service 13,677,751 12,994,444 12,506,281 14,129,360 12,650,139 (1,027,612) (7.5) %Academic Support 61,399,810 62,483,109 65,409,954 71,324,950 71,624,930 10,225,120 16.7 %Student Services 45,269,568 42,042,131 43,849,688 44,908,408 45,150,420 (119,148) (0.3) %Institutional Support 37,038,944 42,602,462 44,966,990 49,904,670 49,882,809 12,843,865 34.7 %Operation & Maintenance of Plant 59,694,101 61,585,123 60,939,574 72,766,124 74,657,889 14,963,788 25.1 %Scholarships & Fellowships 48,114,597 50,930,642 59,826,184 64,228,188 74,811,428 26,696,831 55.5 %
Subtotal Expenditures 519,287,869$ 533,442,430$ 554,548,740$ 645,335,670$ 634,882,925$ 115,595,056$ 22.3 %Mandatory Transfers 2,165,669 1,677,409 1,745,964 1,645,162 747,685 (1,417,984) (65.5) %Non-Mandatory Transfers (5,337,091) 21,108,263 35,170,885 (24,096,656) 14,099,415 19,436,506 364.2 %
Total Expenditures & Transfers 516,116,447$ 556,228,102$ 591,465,589$ 622,884,176$ 649,730,025$ 133,613,578$ 25.9 %Fund Balance Addition/(Reduction) (2,465,897)$ 795,736$ 151,835$
AUXILIARIESRevenues 173,429,399$ 178,979,903$ 203,163,591$ 202,976,598$ 219,639,669$ 46,210,270$ 26.6 %Expenditures and Transfers
Expenditures 130,374,337$ 139,179,254$ 145,086,602$ 158,643,562$ 165,632,322$ 35,257,985$ 27.0 %Mandatory Transfers 23,308,614 22,816,983 26,224,698 27,545,274 36,451,629 13,143,015 56.4 %Non-Mandatory Transfers 13,991,355 20,282,992 22,381,046 16,787,762 17,555,718 3,564,363 25.5 %
Total Expenditures & Transfers 167,674,306$ 182,279,229$ 193,692,346$ 202,976,598$ 219,639,669$ 51,965,363$ 31.0 %Fund Balance Addition/(Reduction) 5,755,093$ (3,299,326)$ 9,471,244$
TOTALSRevenues 687,079,949$ 736,003,741$ 794,781,015$ 825,860,774$ 869,369,694$ 182,289,745$ 26.5 %Expenditures and Transfers
Expenditures 649,662,206$ 672,621,684$ 699,635,342$ 803,979,232$ 800,515,247$ 150,853,041$ 23.2 %Mandatory Transfers 25,474,283 24,494,392 27,970,662 29,190,436 37,199,314 11,725,031 46.0 %Non-Mandatory Transfers 8,654,264 41,391,255 57,551,931 (7,308,894) 31,655,133 23,000,869 265.8 %
Total Expenditures & Transfers 683,790,753$ 738,507,331$ 785,157,935$ 825,860,774$ 869,369,694$ 185,578,941$ 27.1 %Fund Balance Addition/(Reduction) 3,289,196$ (2,503,590)$ 9,623,079$
KnoxvilleFive Year FY17 Proposed Budget Summary Comparison
Current Funds Revenues, Expenditures and Transfers - UNRESTRICTED
FY 2013 TO FY 2017%
CHANGE
Schedule 8 - UTKD-28

KnoxvilleUnrestricted Net Assets
E&G AUXILIARIES TOTAL
Net Assets - June 30, 2014 27,182,092$ 15,072,932$ 42,255,024$
Percent Unallocated of Expend. & Transfers * 3.30% 1.86% 2.94%
FY 2014-15 ACTUALRevenue 591,617,424$ 203,163,591$ 794,781,015$ Less:
Expenditures 554,548,740$ 145,086,602$ 699,635,342$ Mandatory Transfers 1,745,964 26,224,698 27,970,662 Non-Mandatory Transfers 35,170,885 22,381,046 57,551,931
Total Expenditures & Transfers 591,465,589$ 193,692,346$ 785,157,935$ Net Change 151,835$ 9,471,245$ 9,623,080$ Unrestricted Net Assets
Working Capital-Accounts Receivable 3,124,257$ 9,747,873$ 12,872,130$ Working Capital-Petty CashWorking Capital-Inventories 2,046,951 2,454,815 4,501,767 Revolving Funds 703,491 1,917,693 2,621,185 Encumbrances 1,548,334 1,548,334 Unexpended GiftsReappropriationsUnallocated 19,910,892 10,423,795 30,334,687
Net Assets - June 30, 2015 27,333,927$ 24,544,177$ 51,878,104$
Percent Unallocated of Expend. & Transfers * 3.37% 5.38% 3.86%
FY 2015-16 Probable BudgetRevenue 622,884,176$ 202,976,598$ 825,860,774$ Less:
Expenditures 645,335,670$ 158,643,562$ 803,979,232$ Mandatory Transfers 1,645,162 27,545,274 29,190,436 Non-Mandatory Transfers (24,096,656) 16,787,762 (7,308,894)
Total Expenditures & Transfers 622,884,176$ 202,976,598$ 825,860,774$ Net Change -$ -$ -$ Unrestricted Net Assets
Working Capital-Accounts Receivable 3,124,257$ 9,747,873$ 12,872,130$ Working Capital-Petty CashWorking Capital-Inventories 2,046,951 2,454,815 4,501,767 Revolving Funds 703,491 1,917,693 2,621,185 Encumbrances 1,548,334 1,548,334 Unexpended GiftsReappropriationsUnallocated 19,910,892 10,423,796 30,334,688
Estimated Net Assets - June 30, 2016 27,333,927$ 24,544,177$ 51,878,104$
Percent Unallocated of Expend. & Transfers * 3.20% 5.14% 3.67%
FY 2016-17 Proposed BudgetRevenue 649,730,025$ 219,639,669$ 869,369,694$ Less:
Expenditures 635,132,925$ 165,632,322$ 800,765,247$ Mandatory Transfers 747,685 36,451,629 37,199,314 Non-Mandatory Transfers 13,849,415 17,555,718 31,405,133
Total Expenditures & Transfers 649,730,025$ 219,639,669$ 869,369,694$ Net Change -$ -$ -$ Unrestricted Net Assets
Working Capital-Accounts Receivable 3,124,257$ 9,747,873$ 12,872,130$ Working Capital-Petty CashWorking Capital-Inventories 2,046,951 2,454,815 4,501,767 Revolving Funds 703,491 1,917,693 2,621,185 Encumbrances 1,548,334 1,548,334 Unexpended GiftsReappropriationsUnallocated 19,910,892 10,423,796 30,334,688
Estimated Net Assets - June 30, 2017 27,333,927$ 24,544,177$ 51,878,104$ Percent Unallocated of Expend. & Transfers * 3.06% 4.75% 3.49%
* Recommended percent for unallocated expenditures is 2% to 5% for E&G and 3% to 5% for auxiliaries.
Net Assets ‐ UTKD-29

FY 2015 FY 2016 FY 2017ACTUAL PROBABLE PROPOSED AMOUNT
EDUCATIONAL AND GENERAL
Salaries and Benefits
Salaries
Academic 159,836,578$ 162,777,730$ 165,074,437$ 2,296,707$ 1.4 %
Non-Academic 122,608,006 123,678,086 129,783,433 6,105,347 4.9 %
Students 5,566,854 4,834,559 4,819,975 (14,584) (0.3) %
Total Salaries 288,011,438$ 291,290,375$ 299,677,845$ 8,387,470$ 2.9 %
Staff Benefits 95,237,046 92,384,961 95,950,594 3,565,633 3.9 %
Total Salaries and Benefits 383,248,484$ 383,675,336$ 395,628,439$ 11,953,103$ 3.1 %
Operating 154,968,170 248,247,988 227,035,090 (21,212,898) (8.5) %
Equipment and Capital Outlay 16,332,086 13,412,346 12,219,396 (1,192,950) (8.9) %
Total Expenditures 554,548,740$ 645,335,670$ 634,882,925$ (10,452,745)$ (1.6) %
AUXILIARIES
Salaries and Benefits
Salaries
Academic 451,713$ 499,641$ 629,613$ 129,972$ 26.0 %
Non-Academic 42,325,222 43,374,862 46,006,372 2,631,510 6.1 %
Students 3,529,834 3,871,013 3,997,675 126,662 3.3 %
Total Salaries 46,306,769$ 47,745,516$ 50,633,660$ 2,888,144$ 6.0 %
Staff Benefits 12,197,403 12,210,071 12,494,977 284,906 2.3 %
Total Salaries and Benefits 58,504,172$ 59,955,587$ 63,128,637$ 3,173,050$ 5.3 %
Operating 86,401,169 97,989,475 101,761,885 3,772,410 3.8 %
Equipment and Capital Outlay 181,262 698,500 741,800 43,300 6.2 %
Total Expenditures 145,086,602$ 158,643,562$ 165,632,322$ 6,988,760$ 4.4 %
TOTALS
Salaries and Benefits
Salaries
Academic 160,288,291$ 163,277,371$ 165,704,050$ 2,426,679$ 1.5 %
Non-Academic 164,933,227 167,052,948 175,789,805 8,736,857 5.2 %
Students 9,096,688 8,705,572 8,817,650 112,078 1.3 %
Total Salaries 334,318,207$ 339,035,891$ 350,311,505$ 11,275,614$ 3.3 %
Staff Benefits 107,434,449 104,595,032 108,445,571 3,850,539 3.7 %
Total Salaries and Benefits 441,752,656$ 443,630,923$ 458,757,076$ 15,126,153$ 3.4 %
Operating 241,369,339 346,237,463 328,796,975 (17,440,488) (5.0) %
Equipment and Capital Outlay 16,513,348 14,110,846 12,961,196 (1,149,650) (8.1) %
Total Expenditures 699,635,342$ 803,979,232$ 800,515,247$ (3,463,985)$ (0.4) %
%
CHANGE
FY 2017 Proposed Budget Summary - Natural ClassificationsUnrestricted Current Funds Expenditures
Knoxville
PROBABLE TO PROPOSED
Schedule 12 - UTKD-30

KnoxvilleFY 2017 Proposed Budget Summary
Auxiliary Enterprises Funds Revenues, Expenditures and Transfers
CHANGEFY 2015 FY 2016 FY 2017 PROBABLE TO PROPOSEDACTUAL PROBABLE PROPOSED AMOUNT %
HOUSINGRevenues 46,187,132$ 43,475,035$ 47,653,740$ 4,178,705$ 9.6%Expenditures and TransfersExpenditures 25,902,059$ 28,969,999$ 29,643,447$ 673,448$ 2.3%Mandatory Transfers 6,358,646 8,647,592 15,276,187 6,628,595 76.7%Non-Mandatory Transfers 11,367,753 5,857,444 2,734,106 (3,123,338) -53.3%Total Expenditures and Transfers 43,628,459$ 43,475,035$ 47,653,740$ 4,178,705$ 9.6%
Fund Balance Addition/(Reduction) 2,558,673$
FOOD SERVICERevenues 4,899,400$ 5,299,811$ 6,937,549$ 1,637,738$ 30.9%Expenditures and TransfersExpenditures 1,703,806$ 1,890,174$ 2,014,837$ 124,663$ 6.6%Mandatory Transfers 2,703,864 Non-Mandatory Transfers 668,599 3,409,637 4,922,712 1,513,075 44.4%Total Expenditures and Transfers 5,076,269$ 5,299,811$ 6,937,549$ 1,637,738$ 30.9%
Fund Balance Addition/(Reduction) (176,869)$
BOOKSTORESRevenues 21,716,028$ 23,000,000$ 24,000,000$ 1,000,000$ 4.3%Expenditures and TransfersExpenditures 17,269,825$ 21,195,719$ 22,157,930$ 962,211$ 4.5%Mandatory TransfersNon-Mandatory Transfers 1,769,805 1,804,281 1,842,070 37,789 2.1%Total Expenditures and Transfers 19,039,630$ 23,000,000$ 24,000,000$ 1,000,000$ 4.3%
Fund Balance Addition/(Reduction) 2,676,398$
PARKINGRevenues 8,541,571$ 9,586,352$ 9,937,010$ 350,658$ 3.7%Expenditures and TransfersExpenditures 4,353,327$ 5,667,517$ 5,307,990$ (359,527)$ -6.3%Mandatory Transfers 2,285,969 2,546,320 3,729,204 1,182,884 46.5%Non-Mandatory Transfers 1,359,123 1,372,515 899,816 (472,699) -34.4%Total Expenditures and Transfers 7,998,418$ 9,586,352$ 9,937,010$ 350,658$ 3.7%
Fund Balance Addition/(Reduction) 543,153$
ATHLETICSRevenues 118,910,860$ 118,815,400$ 128,557,370$ 9,741,970$ 8.2%Expenditures and TransfersExpenditures 93,052,037$ 98,120,153$ 103,954,118$ 5,833,965$ 5.9%Mandatory Transfers 14,876,219 16,351,362 17,446,238 1,094,876 6.7%Non-Mandatory Transfers 7,157,162 4,343,885 7,157,014 2,813,129 64.8%Total Expenditures and Transfers 115,085,417$ 118,815,400$ 128,557,370$ 9,741,970$ 8.2%
Fund Balance Addition/(Reduction) 3,825,442$
OTHERRevenues 2,908,600$ 2,800,000$ 2,554,000$ (246,000)$ -8.8%Expenditures and TransfersExpenditures 2,805,549$ 2,800,000$ 2,554,000$ (246,000)$ -8.8%Mandatory TransfersNon-Mandatory Transfers 58,604 Total Expenditures and Transfers 2,864,154$ 2,800,000$ 2,554,000$ (246,000)$ -8.8%
Fund Balance Addition/(Reduction) 44,447$
TOTALRevenues 203,163,591$ 202,976,598$ 219,639,669$ 16,663,071$ 8.2%Expenditures and TransfersExpenditures 145,086,602$ 158,643,562$ 165,632,322$ 6,988,760$ 4.4%Mandatory Transfers 26,224,698 27,545,274 36,451,629 8,906,355 32.3%Non-Mandatory Transfers 22,381,046 16,787,762 17,555,718 767,956 4.6%Total Expenditures and Transfers 193,692,347$ 202,976,598$ 219,639,669$ 16,663,071$ 8.2%
Fund Balance Addition/(Reduction) 9,471,244$
Schedule 13 - Auxiliaries
D-31

Unrestricted Restricted Total Unrestricted Restricted Total Unrestricted Restricted Total Amount
EDUCATION AND GENERALRevenues
Tuition & Fees 363,293,977$ 363,293,977$ 391,725,353$ 391,725,353$ 407,278,045$ 407,278,045$ 15,552,692$ 4.0 %
State Appropriations 182,310,443 11,083,094$ 193,393,537 191,207,355 10,448,438$ 201,655,793 202,644,855 10,366,332$ 213,011,187 11,355,394 5.6 %
Grants & Contracts 25,913,526 198,801,506 224,715,031 22,560,000 197,431,562 219,991,562 22,560,000 198,633,668 221,193,668 1,202,106 0.5 %
Sales & Service 7,348,472 7,348,472 5,780,775 5,780,775 5,538,268 5,538,268 (242,507) (4.2) %
Other Sources 12,751,006 31,335,710 44,086,715 11,610,693 33,450,000 45,060,693 11,708,857 33,900,000 45,608,857 548,164 1.2 %
Total Revenues 591,617,424$ 241,220,310$ 832,837,734$ 622,884,176$ 241,330,000$ 864,214,176$ 649,730,025$ 242,900,000$ 892,630,025$ 28,415,849$ 3.3 %
Expenditures and Transfers
Instruction 234,529,087$ 11,008,259$ 245,537,346$ 283,165,480 9,900,000$ 293,065,480$ 282,648,112$ 10,100,000$ 292,748,112$ (317,368)$ (0.1) %
Research 32,520,982 102,068,797 134,589,779 44,908,490 100,600,000 145,508,490 23,457,198 101,000,000 124,457,198 (21,051,292) (14.5) %
Public Service 12,506,281 19,612,640 32,118,921 14,129,360 20,500,000 34,629,360 12,650,139 20,700,000 33,350,139 (1,279,221) (3.7) %
Academic Support 65,409,954 10,634,885 76,044,839 71,324,950 11,100,000 82,424,950 71,624,930 11,250,000 82,874,930 449,980 0.5 %
Student Services 43,849,688 524,109 44,373,797 44,908,408 310,000 45,218,408 45,150,420 310,000 45,460,420 242,012 0.5 %
Institutional Support 44,966,990 104,897 45,071,887 49,904,670 140,000 50,044,670 49,882,809 140,000 50,022,809 (21,861) - %
Operation & Maintenance of Plant 60,939,574 392,584 61,332,158 72,766,124 400,000 73,166,124 74,657,889 400,000 75,057,889 1,891,765 2.6 %
Scholarships & Fellowships 59,826,184 96,337,804 156,163,988 64,228,188 98,380,000 162,608,188 74,811,428 99,000,000 173,811,428 11,203,240 6.9 %
Subtotal Expenditures 554,548,740$ 240,683,975$ 795,232,715$ 645,335,670$ 241,330,000$ 886,665,670$ 634,882,925$ 242,900,000$ 877,782,925$ (8,882,745)$ (1.0) %
Mandatory Transfers 1,745,964 1,745,964 1,645,162 1,645,162 747,685 747,685 (897,477) (54.6)
Non-Mandatory Transfers 35,170,885 35,170,885 (24,096,656) (24,096,656) 14,099,415 14,099,415 38,196,071 158.5 %
Total Expenditures & Transfers 591,465,589$ 240,683,975$ 832,149,564$ 622,884,176$ 241,330,000$ 864,214,176$ 649,730,025$ 242,900,000$ 892,630,025$ 28,415,849$ 3.3 %
Fund Balance Addition / (Reduction) 151,835$ 536,334$ 688,169$
AUXILIARIES
Revenues 203,163,591$ 257,605$ 203,421,196$ 202,976,598$ 260,000$ 203,236,598$ 219,639,669$ 260,000$ 219,899,669$ 16,663,071$ 8.2 %
Expenditures and Transfers
Expenditures 145,086,602$ 281,309$ 145,367,912$ 158,643,562$ 260,000$ 158,903,562$ 165,632,322$ 260,000$ 165,892,322$ 6,988,760$ 4.4 %
Mandatory Transfers 26,224,698 26,224,698 27,545,274 27,545,274 36,451,629 36,451,629 8,906,355 32.3 %
Non-Mandatory Transfers 22,381,046 22,381,046 16,787,762 16,787,762 17,555,718 17,555,718 767,956 4.6 %
Total Expenditures & Transfers 193,692,346$ 281,309$ 193,973,656$ 202,976,598$ 260,000$ 203,236,598$ 219,639,669$ 260,000$ 219,899,669$ 16,663,071$ 8.2 %
Fund Balance Addition / (Reduction) 9,471,244$ (23,704)$ 9,447,540$ -$ -$ -$ -$ -$ -$
TOTALS
Revenues 794,781,015$ 241,477,915$ 1,036,258,929$ 825,860,774$ 241,590,000$ 1,067,450,774$ 869,369,694$ 243,160,000$ 1,112,529,694$ 45,078,920$ 4.2 %
Expenditures and Transfers
Expenditures 699,635,342$ 240,965,285$ 940,600,627$ 803,979,232$ 241,590,000$ 1,045,569,232$ 800,515,247$ 243,160,000$ 1,043,675,247$ (1,893,985)$ (0.2) %
Mandatory Transfers 27,970,662 27,970,662 29,190,436 29,190,436 37,199,314 37,199,314 8,008,878 27.4 %
Non-Mandatory Transfers 57,551,931 57,551,931 (7,308,894) (7,308,894) 31,655,133 31,655,133 38,964,027 533.1 %
Total Expenditures & Transfers 785,157,935$ 240,965,285$ 1,026,123,220$ 825,860,774$ 241,590,000$ 1,067,450,774$ 869,369,694$ 243,160,000$ 1,112,529,694$ 45,078,920$ 4.2 %
Fund Balance Addition / (Reduction) 9,623,079$ 512,630$ 10,135,709$
KnoxvilleFY 2017 Proposed Budget Summary
Unrestricted and Restricted Current Funds Revenues, Expenditures and Transfers
%
ChangeFY 2015 Actual FY 2016 Probable FY 2017 Proposed Probable to Proposed
Schedule 10 - UTKD-32

FY 2013 FY 2014 FY 2015 FY 2016 FY 2017ACTUAL ACTUAL ACTUAL PROBABLE PROPOSED AMOUNT
EDUCATIONAL AND GENERALRevenues
Tuition & Fees 305,640,162$ 332,420,932$ 363,293,977$ 391,725,353$ 407,278,045$ 101,637,883$ 33.3 %State Appropriations 166,535,662 188,462,640 193,393,537 201,655,793 213,011,187 46,475,525 27.9 %Grants & Contracts 240,080,971 230,759,646 224,715,031 219,991,562 221,193,668 (18,887,303) (7.9) %Sales & Service 9,587,584 7,131,134 7,348,472 5,780,775 5,538,268 (4,049,316) (42.2) %Other Sources 42,816,929 40,395,050 44,086,715 45,060,693 45,608,857 2,791,928 6.5 %
Total Revenues 764,661,308$ 799,169,402$ 832,837,734$ 864,214,176$ 892,630,025$ 127,968,717$ 16.7 %
Expenditures and TransfersInstruction 228,154,026$ 241,463,791$ 245,537,346$ 293,065,480$ 292,748,112$ 64,594,086$ 28.3 %Research 144,807,910 137,586,810 134,589,779 145,508,490 124,457,198 (20,350,712) (14.1) %Public Service 39,606,992 33,426,257 32,118,921 34,629,360 33,350,139 (6,256,853) (15.8) %Academic Support 73,608,172 73,355,989 76,044,839 82,424,950 82,874,930 9,266,758 12.6 %Student Services 45,689,204 42,432,483 44,373,797 45,218,408 45,460,420 (228,784) (0.5) %Institutional Support 37,210,844 42,686,623 45,071,887 50,044,670 50,022,809 12,811,965 34.4 %Operation & Maintenance of Plant 60,231,728 61,999,137 61,332,158 73,166,124 75,057,889 14,826,161 24.6 %Scholarships & Fellowships 143,410,919 147,547,746 156,163,988 162,608,188 173,811,428 30,400,509 21.2 %
Subtotal Expenditures 772,719,794$ 780,498,835$ 795,232,715$ 886,665,670$ 877,782,925$ 105,063,131$ 13.6 %Mandatory Transfers 2,165,669 1,677,409 1,745,964 1,645,162 747,685 (1,417,984) (65.5) %Non-Mandatory Transfers (5,337,091) 21,108,263 35,170,885 (24,096,656) 14,099,415 19,436,506 364.2 %
Total Expenditures & Transfers 769,548,372$ 803,284,507$ 832,149,564$ 864,214,176$ 892,630,025$ 123,081,653$ 16.0 %Fund Balance Addition/(Reduction) (4,887,064)$ (4,115,105)$ 688,169$
AUXILIARIESRevenues 173,903,700$ 180,100,777$ 203,421,196$ 203,236,598$ 219,899,669$ 45,995,969$ 26.4 %Expenditures and Transfers
Expenditures 131,433,846$ 139,272,521$ 145,367,912$ 158,903,562$ 165,892,322$ 34,458,476$ 26.2 %Mandatory Transfers 23,308,614 22,816,983 26,224,698 27,545,274 36,451,629 13,143,015 56.4 %Non-Mandatory Transfers 13,991,355 20,282,992 22,381,046 16,787,762 17,555,718 3,564,363 25.5 %
Total Expenditures & Transfers 168,733,815$ 182,372,496$ 193,973,656$ 203,236,598$ 219,899,669$ 51,165,854$ 30.3 %Fund Balance Addition/(Reduction) 5,169,886$ (2,271,720)$ 9,447,540$
TOTALSRevenues 938,565,008$ 979,270,179$ 1,036,258,929$ 1,067,450,774$ 1,112,529,694$ 173,964,686$ 18.5 %Expenditures and Transfers
Expenditures 904,153,640$ 919,771,356$ 940,600,627$ 1,045,569,232$ 1,043,675,247$ 139,521,607$ 15.4 %Mandatory Transfers 25,474,283 24,494,392 27,970,662 29,190,436 37,199,314 11,725,031 46.0 %Non-Mandatory Transfers 8,654,264 41,391,255 57,551,931 (7,308,894) 31,655,133 23,000,869 265.8 %
Total Expenditures & Transfers 938,282,187$ 985,657,003$ 1,026,123,220$ 1,067,450,774$ 1,112,529,694$ 174,247,507$ 18.6 %Fund Balance Addition/(Reduction) 282,822$ (6,386,824)$ 10,135,709$
KnoxvilleFive Year FY17 Proposed Budget Summary Comparison
Current Funds Revenues, Expenditures and Transfers - UNRESTRICTED AND RESTRICTED
FY 2013 TO FY 2017%
CHANGE
Schedule 9 - UTKD-33

The University of Tennessee at MartinFY 2017 Proposed Budget
Unrestricted E&G Funds
State Appropriations
$31.533%
Grants & Contracts
$0.20%
Other$0.61%
Sales & Services$3.43%
Tuition & Fees$61.263%
Revenues$96.9 mil l ion
Instruction$43.245%
Research$0.3.3%
Public Service$0.6.6%
Academic Support$11.412%
Student Services$12.413%
Institutional Support$6.67%
Oper./Maint.$11.8 12%
Scholarships/Fellowships
$9.310%
Expenditures$95.6 mil l ion
Faculty 333
Administrative 64
Professional 189
Cler/Tech/Maint 345
TOTAL 931
FTE Positions (Unrestricted & Restricted)
July 1, 2016
Undergraduate 6,435
Graduate 392
TOTAL 6,827
First-time Freshmen 1,024
Fall 2015 Headcount Enrollment
Current FundRevenues
FY 2016-17 Revenues
Unrestricted Funds
(In Millions)
E & G $96.9
Auxiliaries 10.2
Unrestricted Total $107.1
Restricted Funds
E & G 37.7
TOTAL REVENUES
$144.8
D-34
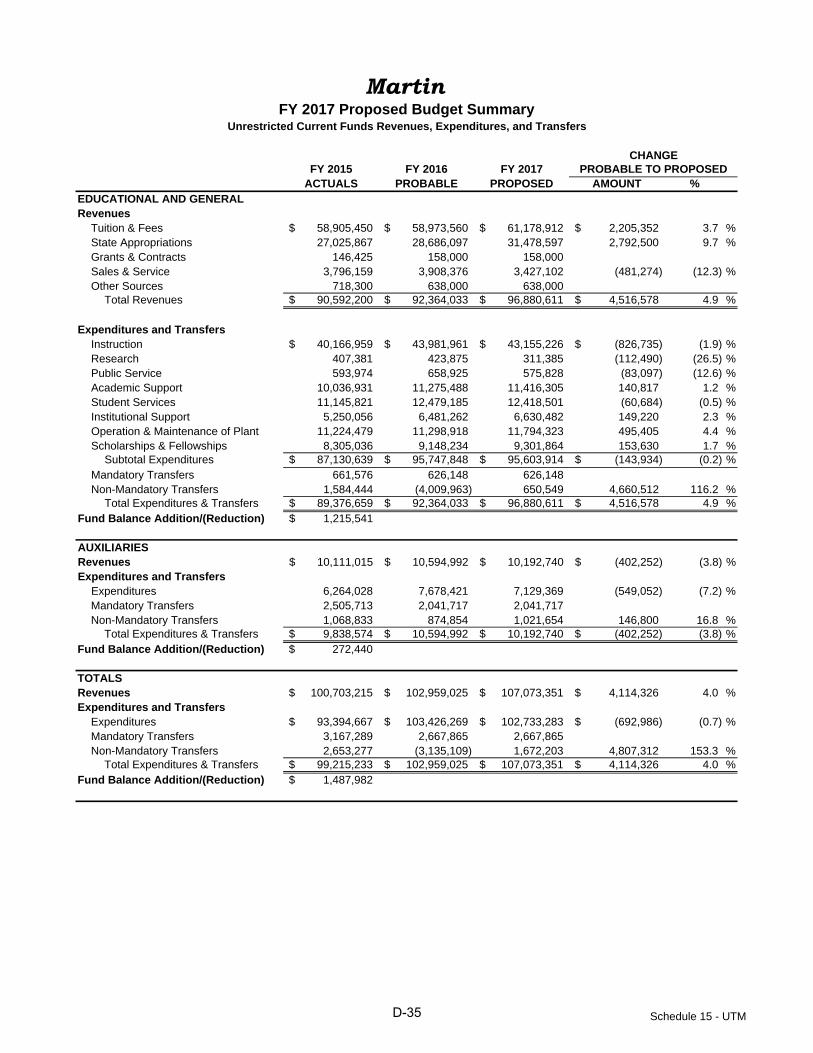
MartinFY 2017 Proposed Budget Summary
Unrestricted Current Funds Revenues, Expenditures, and Transfers
CHANGEFY 2015 FY 2016 FY 2017 PROBABLE TO PROPOSED
ACTUALS PROBABLE PROPOSED AMOUNT %EDUCATIONAL AND GENERALRevenues
Tuition & Fees 58,905,450$ 58,973,560$ 61,178,912$ 2,205,352$ 3.7 %State Appropriations 27,025,867 28,686,097 31,478,597 2,792,500 9.7 %Grants & Contracts 146,425 158,000 158,000 Sales & Service 3,796,159 3,908,376 3,427,102 (481,274) (12.3) %Other Sources 718,300 638,000 638,000
Total Revenues 90,592,200$ 92,364,033$ 96,880,611$ 4,516,578$ 4.9 %
Expenditures and TransfersInstruction 40,166,959$ 43,981,961$ 43,155,226$ (826,735)$ (1.9) %Research 407,381 423,875 311,385 (112,490) (26.5) %Public Service 593,974 658,925 575,828 (83,097) (12.6) %Academic Support 10,036,931 11,275,488 11,416,305 140,817 1.2 %Student Services 11,145,821 12,479,185 12,418,501 (60,684) (0.5) %Institutional Support 5,250,056 6,481,262 6,630,482 149,220 2.3 %Operation & Maintenance of Plant 11,224,479 11,298,918 11,794,323 495,405 4.4 %Scholarships & Fellowships 8,305,036 9,148,234 9,301,864 153,630 1.7 %
Subtotal Expenditures 87,130,639$ 95,747,848$ 95,603,914$ (143,934)$ (0.2) %Mandatory Transfers 661,576 626,148 626,148 Non-Mandatory Transfers 1,584,444 (4,009,963) 650,549 4,660,512 116.2 %
Total Expenditures & Transfers 89,376,659$ 92,364,033$ 96,880,611$ 4,516,578$ 4.9 %Fund Balance Addition/(Reduction) 1,215,541$
AUXILIARIESRevenues 10,111,015$ 10,594,992$ 10,192,740$ (402,252)$ (3.8) %Expenditures and Transfers
Expenditures 6,264,028 7,678,421 7,129,369 (549,052) (7.2) %Mandatory Transfers 2,505,713 2,041,717 2,041,717 Non-Mandatory Transfers 1,068,833 874,854 1,021,654 146,800 16.8 %
Total Expenditures & Transfers 9,838,574$ 10,594,992$ 10,192,740$ (402,252)$ (3.8) %Fund Balance Addition/(Reduction) 272,440$
TOTALSRevenues 100,703,215$ 102,959,025$ 107,073,351$ 4,114,326$ 4.0 %Expenditures and Transfers
Expenditures 93,394,667$ 103,426,269$ 102,733,283$ (692,986)$ (0.7) %Mandatory Transfers 3,167,289 2,667,865 2,667,865 Non-Mandatory Transfers 2,653,277 (3,135,109) 1,672,203 4,807,312 153.3 %
Total Expenditures & Transfers 99,215,233$ 102,959,025$ 107,073,351$ 4,114,326$ 4.0 %Fund Balance Addition/(Reduction) 1,487,982$
Schedule 15 - UTMD-35
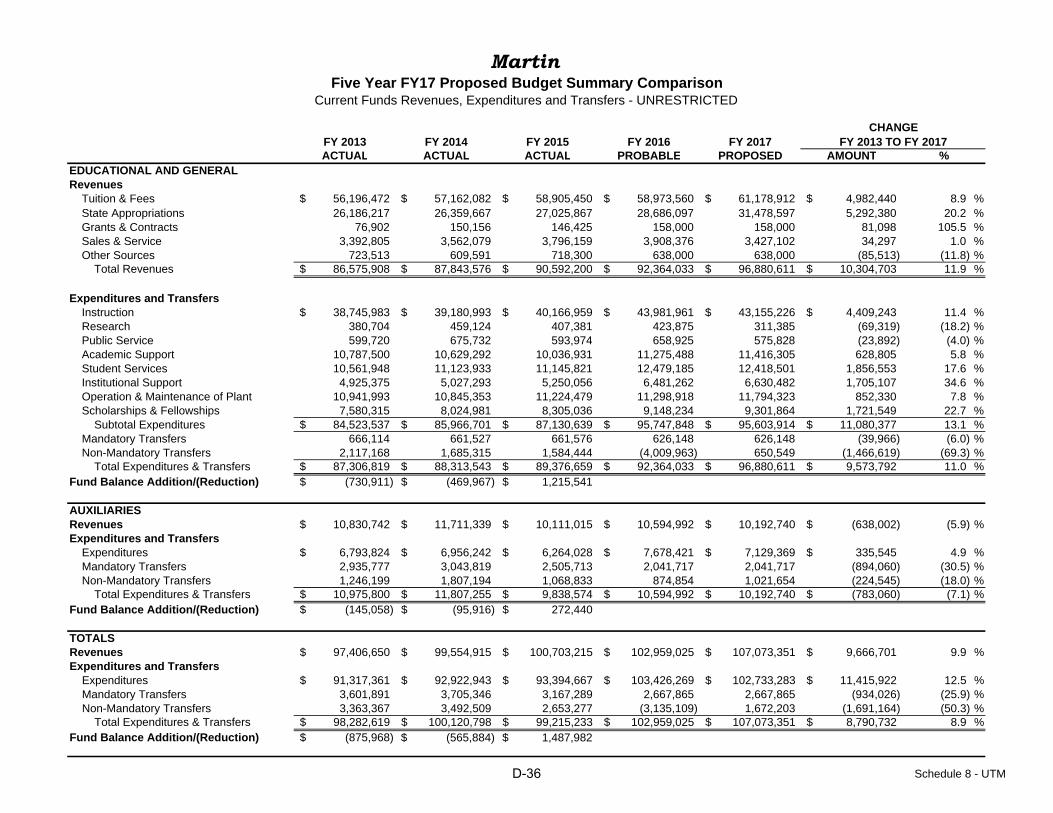
FY 2013 FY 2014 FY 2015 FY 2016 FY 2017ACTUAL ACTUAL ACTUAL PROBABLE PROPOSED AMOUNT
EDUCATIONAL AND GENERALRevenues
Tuition & Fees 56,196,472$ 57,162,082$ 58,905,450$ 58,973,560$ 61,178,912$ 4,982,440$ 8.9 %State Appropriations 26,186,217 26,359,667 27,025,867 28,686,097 31,478,597 5,292,380 20.2 %Grants & Contracts 76,902 150,156 146,425 158,000 158,000 81,098 105.5 %Sales & Service 3,392,805 3,562,079 3,796,159 3,908,376 3,427,102 34,297 1.0 %Other Sources 723,513 609,591 718,300 638,000 638,000 (85,513) (11.8) %
Total Revenues 86,575,908$ 87,843,576$ 90,592,200$ 92,364,033$ 96,880,611$ 10,304,703$ 11.9 %
Expenditures and TransfersInstruction 38,745,983$ 39,180,993$ 40,166,959$ 43,981,961$ 43,155,226$ 4,409,243$ 11.4 %Research 380,704 459,124 407,381 423,875 311,385 (69,319) (18.2) %Public Service 599,720 675,732 593,974 658,925 575,828 (23,892) (4.0) %Academic Support 10,787,500 10,629,292 10,036,931 11,275,488 11,416,305 628,805 5.8 %Student Services 10,561,948 11,123,933 11,145,821 12,479,185 12,418,501 1,856,553 17.6 %Institutional Support 4,925,375 5,027,293 5,250,056 6,481,262 6,630,482 1,705,107 34.6 %Operation & Maintenance of Plant 10,941,993 10,845,353 11,224,479 11,298,918 11,794,323 852,330 7.8 %Scholarships & Fellowships 7,580,315 8,024,981 8,305,036 9,148,234 9,301,864 1,721,549 22.7 %
Subtotal Expenditures 84,523,537$ 85,966,701$ 87,130,639$ 95,747,848$ 95,603,914$ 11,080,377$ 13.1 %Mandatory Transfers 666,114 661,527 661,576 626,148 626,148 (39,966) (6.0) %Non-Mandatory Transfers 2,117,168 1,685,315 1,584,444 (4,009,963) 650,549 (1,466,619) (69.3) %
Total Expenditures & Transfers 87,306,819$ 88,313,543$ 89,376,659$ 92,364,033$ 96,880,611$ 9,573,792$ 11.0 %Fund Balance Addition/(Reduction) (730,911)$ (469,967)$ 1,215,541$
AUXILIARIESRevenues 10,830,742$ 11,711,339$ 10,111,015$ 10,594,992$ 10,192,740$ (638,002)$ (5.9) %Expenditures and Transfers
Expenditures 6,793,824$ 6,956,242$ 6,264,028$ 7,678,421$ 7,129,369$ 335,545$ 4.9 %Mandatory Transfers 2,935,777 3,043,819 2,505,713 2,041,717 2,041,717 (894,060) (30.5) %Non-Mandatory Transfers 1,246,199 1,807,194 1,068,833 874,854 1,021,654 (224,545) (18.0) %
Total Expenditures & Transfers 10,975,800$ 11,807,255$ 9,838,574$ 10,594,992$ 10,192,740$ (783,060)$ (7.1) %Fund Balance Addition/(Reduction) (145,058)$ (95,916)$ 272,440$
TOTALSRevenues 97,406,650$ 99,554,915$ 100,703,215$ 102,959,025$ 107,073,351$ 9,666,701$ 9.9 %Expenditures and Transfers
Expenditures 91,317,361$ 92,922,943$ 93,394,667$ 103,426,269$ 102,733,283$ 11,415,922$ 12.5 %Mandatory Transfers 3,601,891 3,705,346 3,167,289 2,667,865 2,667,865 (934,026) (25.9) %Non-Mandatory Transfers 3,363,367 3,492,509 2,653,277 (3,135,109) 1,672,203 (1,691,164) (50.3) %
Total Expenditures & Transfers 98,282,619$ 100,120,798$ 99,215,233$ 102,959,025$ 107,073,351$ 8,790,732$ 8.9 %Fund Balance Addition/(Reduction) (875,968)$ (565,884)$ 1,487,982$
MartinFive Year FY17 Proposed Budget Summary Comparison
Current Funds Revenues, Expenditures and Transfers - UNRESTRICTED
FY 2013 TO FY 2017%
CHANGE
Schedule 8 - UTMD-36

MartinUnrestricted Net Assets
E&G AUXILIARIES TOTALNet Assets - June 30, 2014 8,056,694$ 700,160$ 8,756,854$ Percent Unallocated of Expend. & Transfers * 4.32% 2.48% 4.10%
FY 2014-15 ACTUALRevenue 90,592,200$ $ 10,111,015$ 100,703,215$ Less:
Expenditures 87,130,639$ $ 6,264,028$ 93,394,667$ Mandatory Transfers 661,576 $ 2,505,713 3,167,289 Non-Mandatory Transfers 1,584,444 1,068,833 2,653,277
Total Expenditures & Transfers 89,376,659$ 9,838,574$ 99,215,233$ Net Change 1,215,541$ 272,441$ 1,487,982$ Unrestricted Net Assets
Working Capital-Accounts Receivable 1,635,674$ $ 543,995$ 2,179,669$ Working Capital-Petty CashWorking Capital-Inventories 434,201 111,037 545,238 Revolving FundsEncumbrances 90,582 90,582 Unexpended GiftsReappropriations 3,000,000 3,000,000 Unallocated 4,111,778 317,569 4,429,347
Net Assets - June 30, 2015 9,272,235$ 972,601$ 10,244,836$ Percent Unallocated of Expend. & Transfers * 4.60% 3.23% 4.46%
FY 2015-16 PROBABLE BUDGETRevenue 92,364,033$ 10,594,992$ 102,959,025$ Less:
Expenditures 95,747,848$ 7,678,421$ 103,426,269$ Mandatory Transfers 626,148 2,041,717 2,667,865 Non-Mandatory Transfers (4,009,963) 874,854 (3,135,109)
Total Expenditures & Transfers 92,364,033$ 10,594,992$ 102,959,025$ Net Change -$ -$ -$ Unrestricted Net Assets
Working Capital-Accounts Receivable 1,635,674$ 543,995$ 2,179,669$ Working Capital-Petty CashWorking Capital-Inventories 434,201 111,037 545,238 Revolving FundsEncumbrances 90,582 90,582 Unexpended GiftsReappropriations 3,000,000 3,000,000 Unallocated 4,111,778 317,568 4,429,347
Estimated Net Assets - June 30, 2016 9,272,235$ 972,601$ 10,244,836$ Percent Unallocated of Expend. & Transfers * 4.45% 3.00% 4.30%
FY 2016-17 PROPOSED BUDGETRevenue 96,880,611$ 10,192,740$ 107,073,351$ Less:
Expenditures 95,603,914$ 7,129,369$ 102,733,283$ Mandatory Transfers 626,148 2,041,717 2,667,865 Non-Mandatory Transfers 650,549 1,021,654 1,672,203
Total Expenditures & Transfers 96,880,611$ 10,192,740$ 107,073,351$ Net Change -$ -$ -$ Unrestricted Net Assets
Working Capital-Accounts Receivable 1,635,674$ 543,995$ 2,179,669 Working Capital-Petty CashWorking Capital-Inventories 434,201 111,037 545,238 Revolving FundsEncumbrances 90,582 90,582 Unexpended GiftsReappropriations 3,000,000 3,000,000 Unallocated 4,111,778 317,568 4,429,347
Estimated Net Assets - June 30, 2017 9,272,235$ 972,601$ 10,244,836$ Percent Unallocated of Expend. & Transfers * 4.24% 3.12% 4.14%
* Recommended percent for unallocated expenditures is 2% to 5% for E&G and 3% to 5% for auxiliaries.
Net Assets ‐ UTM
D-37

FY 2015 FY 2016 FY 2017ACTUAL PROBABLE PROPOSED AMOUNT
EDUCATIONAL AND GENERAL
Salaries and Benefits
Salaries
Academic 23,244,382$ 24,238,616$ 23,939,727$ (298,889)$ (1.2) %
Non-Academic 18,924,884 20,757,580 20,989,989 232,409 1.1 %
Students 1,649,253 1,447,707 1,441,987 (5,720) (0.4) %
Total Salaries 43,818,519$ 46,443,903$ 46,371,703$ (72,200)$ (0.2) %
Staff Benefits 16,448,711 17,163,866 18,297,150 1,133,284 6.6 %
Total Salaries and Benefits 60,267,230$ 63,607,769$ 64,668,853$ 1,061,084$ 1.7 %
Operating 24,721,639 30,758,484 29,531,181 (1,227,303) (4.0) %
Equipment and Capital Outlay 2,141,770 1,381,595 1,403,880 22,285 1.6 %
Total Expenditures 87,130,639$ 95,747,848$ 95,603,914$ (143,934)$ (0.2) %
AUXILIARIES
Salaries and Benefits
Salaries
Academic 3,063$ 3,063$
Non-Academic 1,376,830 1,504,867 1,405,420 (99,447)$ (6.6) %
Students 556,104 562,344 562,344
Total Salaries 1,932,934$ 2,070,274$ 1,970,827$ (99,447)$ (4.8) %
Staff Benefits 725,009 680,960 680,960
Total Salaries and Benefits 2,657,943$ 2,751,234$ 2,651,787$ (99,447)$ (3.6) %
Operating 3,666,085 4,910,487 4,460,882 (449,605) (9.2) %
Equipment and Capital Outlay (60,000) 16,700 16,700Total Expenditures 6,264,028$ 7,678,421$ 7,129,369$ (549,052)$ (7.2) %
TOTALS
Salaries and Benefits
Salaries
Academic 23,244,382$ 24,241,679$ 23,942,790$ (298,889)$ (1.2) %
Non-Academic 20,301,713 22,262,447 22,395,409 132,962 0.6 %
Students 2,205,358 2,010,051 2,004,331 (5,720) (0.3) %
Total Salaries 45,751,453$ 48,514,177$ 48,342,530$ (171,647)$ (0.4) %
Staff Benefits 17,173,719 17,844,826 18,978,110 1,133,284 6.4 %
Total Salaries and Benefits 62,925,172$ 66,359,003$ 67,320,640$ 961,637$ 1.4 %
Operating 28,387,724 35,668,971 33,992,063 (1,676,908) (4.7) %
Equipment and Capital Outlay 2,081,770 1,398,295 1,420,580 22,285 1.6 %
Total Expenditures 93,394,667$ 103,426,269$ 102,733,283$ (692,986)$ (0.7) %
%
CHANGE
FY 2017 Proposed Budget Summary - Natural ClassificationsUnrestricted Current Funds Expenditures
Martin
PROBABLE TO PROPOSED
Schedule 12 - UTMD-38
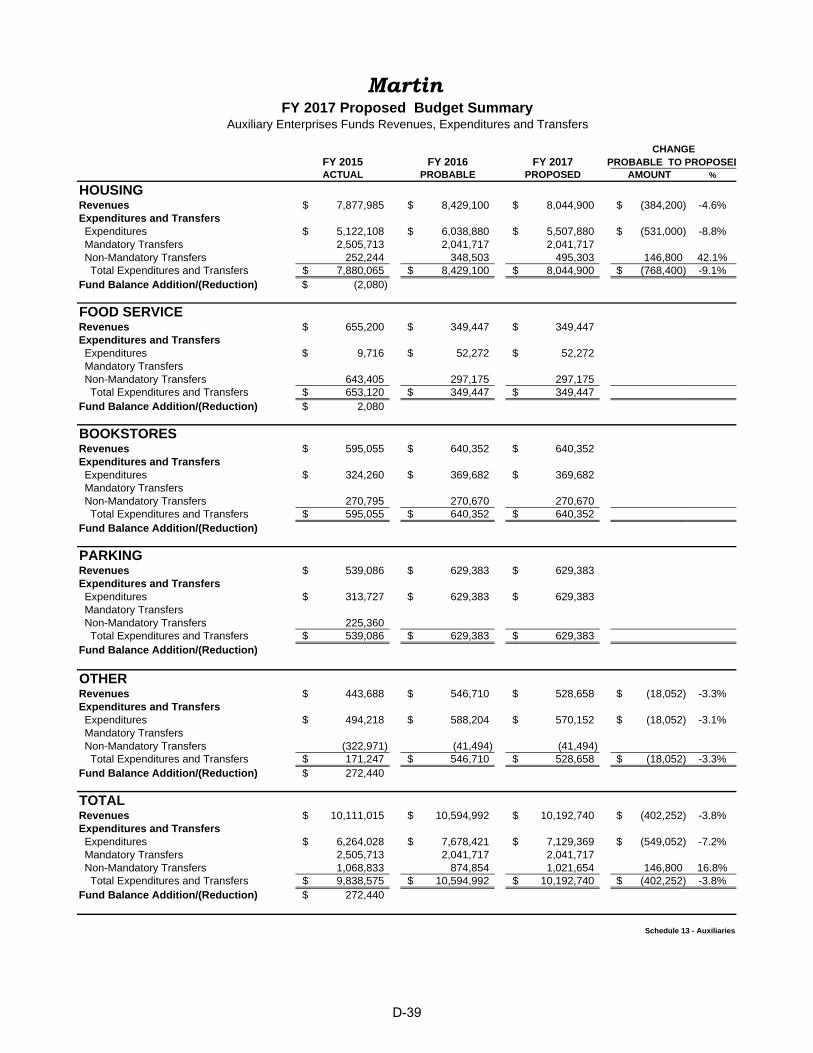
MartinFY 2017 Proposed Budget Summary
Auxiliary Enterprises Funds Revenues, Expenditures and Transfers
CHANGEFY 2015 FY 2016 FY 2017 PROBABLE TO PROPOSEDACTUAL PROBABLE PROPOSED AMOUNT %
HOUSINGRevenues 7,877,985$ 8,429,100$ 8,044,900$ (384,200)$ -4.6%Expenditures and TransfersExpenditures 5,122,108$ 6,038,880$ 5,507,880$ (531,000)$ -8.8%Mandatory Transfers 2,505,713 2,041,717 2,041,717 Non-Mandatory Transfers 252,244 348,503 495,303 146,800 42.1%Total Expenditures and Transfers 7,880,065$ 8,429,100$ 8,044,900$ (768,400)$ -9.1%
Fund Balance Addition/(Reduction) (2,080)$
FOOD SERVICERevenues 655,200$ 349,447$ 349,447$ Expenditures and TransfersExpenditures 9,716$ 52,272$ 52,272$ Mandatory TransfersNon-Mandatory Transfers 643,405 297,175 297,175 Total Expenditures and Transfers 653,120$ 349,447$ 349,447$
Fund Balance Addition/(Reduction) 2,080$
BOOKSTORESRevenues 595,055$ 640,352$ 640,352$ Expenditures and TransfersExpenditures 324,260$ 369,682$ 369,682$ Mandatory TransfersNon-Mandatory Transfers 270,795 270,670 270,670 Total Expenditures and Transfers 595,055$ 640,352$ 640,352$
Fund Balance Addition/(Reduction)
PARKINGRevenues 539,086$ 629,383$ 629,383$ Expenditures and TransfersExpenditures 313,727$ 629,383$ 629,383$ Mandatory TransfersNon-Mandatory Transfers 225,360 Total Expenditures and Transfers 539,086$ 629,383$ 629,383$
Fund Balance Addition/(Reduction)
OTHERRevenues 443,688$ 546,710$ 528,658$ (18,052)$ -3.3%Expenditures and TransfersExpenditures 494,218$ 588,204$ 570,152$ (18,052)$ -3.1%Mandatory TransfersNon-Mandatory Transfers (322,971) (41,494) (41,494) Total Expenditures and Transfers 171,247$ 546,710$ 528,658$ (18,052)$ -3.3%
Fund Balance Addition/(Reduction) 272,440$
TOTALRevenues 10,111,015$ 10,594,992$ 10,192,740$ (402,252)$ -3.8%Expenditures and TransfersExpenditures 6,264,028$ 7,678,421$ 7,129,369$ (549,052)$ -7.2%Mandatory Transfers 2,505,713 2,041,717 2,041,717 Non-Mandatory Transfers 1,068,833 874,854 1,021,654 146,800 16.8%Total Expenditures and Transfers 9,838,575$ 10,594,992$ 10,192,740$ (402,252)$ -3.8%
Fund Balance Addition/(Reduction) 272,440$
Schedule 13 - Auxiliaries
D-39
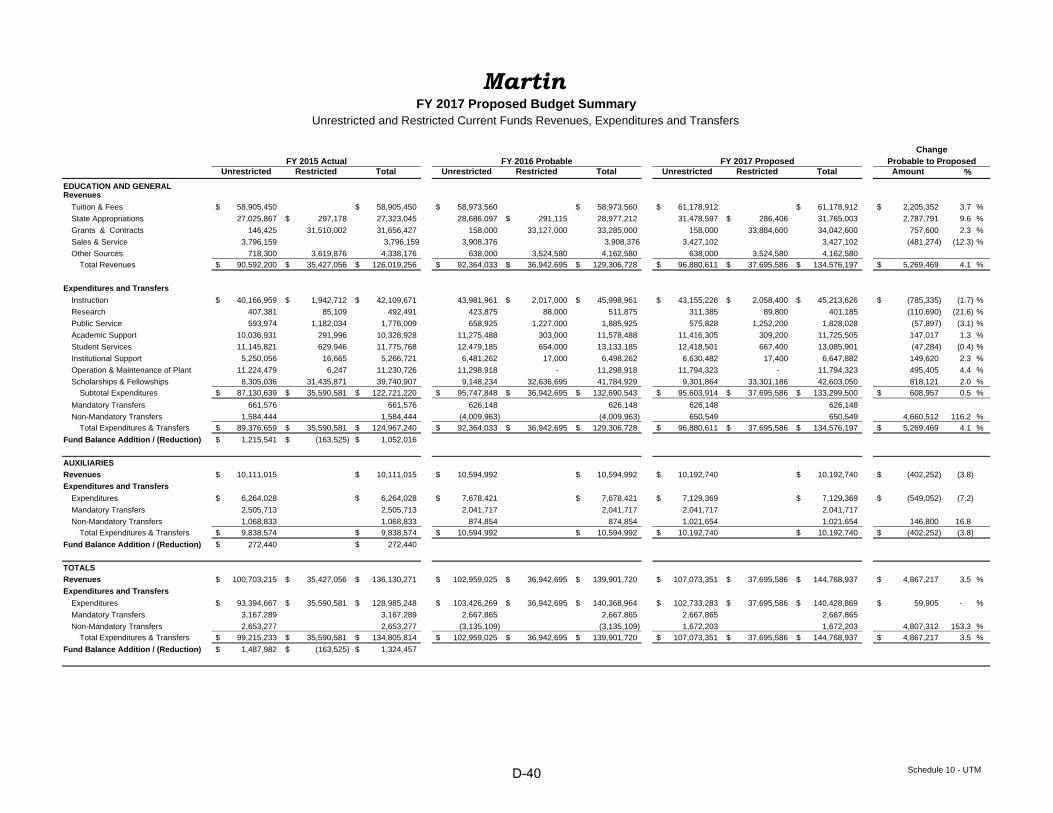
Unrestricted Restricted Total Unrestricted Restricted Total Unrestricted Restricted Total Amount
EDUCATION AND GENERALRevenues
Tuition & Fees 58,905,450$ 58,905,450$ 58,973,560$ 58,973,560$ 61,178,912$ 61,178,912$ 2,205,352$ 3.7 %
State Appropriations 27,025,867 297,178$ 27,323,045 28,686,097 291,115$ 28,977,212 31,478,597 286,406$ 31,765,003 2,787,791 9.6 %
Grants & Contracts 146,425 31,510,002 31,656,427 158,000 33,127,000 33,285,000 158,000 33,884,600 34,042,600 757,600 2.3 %
Sales & Service 3,796,159 3,796,159 3,908,376 3,908,376 3,427,102 3,427,102 (481,274) (12.3) %
Other Sources 718,300 3,619,876 4,338,176 638,000 3,524,580 4,162,580 638,000 3,524,580 4,162,580
Total Revenues 90,592,200$ 35,427,056$ 126,019,256$ 92,364,033$ 36,942,695$ 129,306,728$ 96,880,611$ 37,695,586$ 134,576,197$ 5,269,469$ 4.1 %
Expenditures and Transfers
Instruction 40,166,959$ 1,942,712$ 42,109,671$ 43,981,961 2,017,000$ 45,998,961$ 43,155,226$ 2,058,400$ 45,213,626$ (785,335)$ (1.7) %
Research 407,381 85,109 492,491 423,875 88,000 511,875 311,385 89,800 401,185 (110,690) (21.6) %
Public Service 593,974 1,182,034 1,776,009 658,925 1,227,000 1,885,925 575,828 1,252,200 1,828,028 (57,897) (3.1) %
Academic Support 10,036,931 291,996 10,328,928 11,275,488 303,000 11,578,488 11,416,305 309,200 11,725,505 147,017 1.3 %
Student Services 11,145,821 629,946 11,775,768 12,479,185 654,000 13,133,185 12,418,501 667,400 13,085,901 (47,284) (0.4) %
Institutional Support 5,250,056 16,665 5,266,721 6,481,262 17,000 6,498,262 6,630,482 17,400 6,647,882 149,620 2.3 %
Operation & Maintenance of Plant 11,224,479 6,247 11,230,726 11,298,918 - 11,298,918 11,794,323 - 11,794,323 495,405 4.4 %
Scholarships & Fellowships 8,305,036 31,435,871 39,740,907 9,148,234 32,636,695 41,784,929 9,301,864 33,301,186 42,603,050 818,121 2.0 %
Subtotal Expenditures 87,130,639$ 35,590,581$ 122,721,220$ 95,747,848$ 36,942,695$ 132,690,543$ 95,603,914$ 37,695,586$ 133,299,500$ 608,957$ 0.5 %
Mandatory Transfers 661,576 661,576 626,148 626,148 626,148 626,148
Non-Mandatory Transfers 1,584,444 1,584,444 (4,009,963) (4,009,963) 650,549 650,549 4,660,512 116.2 %
Total Expenditures & Transfers 89,376,659$ 35,590,581$ 124,967,240$ 92,364,033$ 36,942,695$ 129,306,728$ 96,880,611$ 37,695,586$ 134,576,197$ 5,269,469$ 4.1 %
Fund Balance Addition / (Reduction) 1,215,541$ (163,525)$ 1,052,016$
AUXILIARIES
Revenues 10,111,015$ 10,111,015$ 10,594,992$ 10,594,992$ 10,192,740$ 10,192,740$ (402,252)$ (3.8)
Expenditures and Transfers
Expenditures 6,264,028$ 6,264,028$ 7,678,421$ 7,678,421$ 7,129,369$ 7,129,369$ (549,052)$ (7.2)
Mandatory Transfers 2,505,713 2,505,713 2,041,717 2,041,717 2,041,717 2,041,717
Non-Mandatory Transfers 1,068,833 1,068,833 874,854 874,854 1,021,654 1,021,654 146,800 16.8
Total Expenditures & Transfers 9,838,574$ 9,838,574$ 10,594,992$ 10,594,992$ 10,192,740$ 10,192,740$ (402,252)$ (3.8)
Fund Balance Addition / (Reduction) 272,440$ 272,440$
TOTALS
Revenues 100,703,215$ 35,427,056$ 136,130,271$ 102,959,025$ 36,942,695$ 139,901,720$ 107,073,351$ 37,695,586$ 144,768,937$ 4,867,217$ 3.5 %
Expenditures and Transfers
Expenditures 93,394,667$ 35,590,581$ 128,985,248$ 103,426,269$ 36,942,695$ 140,368,964$ 102,733,283$ 37,695,586$ 140,428,869$ 59,905$ - %
Mandatory Transfers 3,167,289 3,167,289 2,667,865 2,667,865 2,667,865 2,667,865
Non-Mandatory Transfers 2,653,277 2,653,277 (3,135,109) (3,135,109) 1,672,203 1,672,203 4,807,312 153.3 %
Total Expenditures & Transfers 99,215,233$ 35,590,581$ 134,805,814$ 102,959,025$ 36,942,695$ 139,901,720$ 107,073,351$ 37,695,586$ 144,768,937$ 4,867,217$ 3.5 %
Fund Balance Addition / (Reduction) 1,487,982$ (163,525)$ 1,324,457$
Change
MartinFY 2017 Proposed Budget Summary
Unrestricted and Restricted Current Funds Revenues, Expenditures and Transfers
% Probable to ProposedFY 2015 Actual FY 2016 Probable FY 2017 Proposed
Schedule 10 - UTMD-40

FY 2013 FY 2014 FY 2015 FY 2016 FY 2017ACTUAL ACTUAL ACTUAL PROBABLE PROPOSED AMOUNT
EDUCATIONAL AND GENERALRevenues
Tuition & Fees 56,196,472$ 57,162,082$ 58,905,450$ 58,973,560$ 61,178,912$ 4,982,440$ 8.9 %State Appropriations 26,480,119 26,664,165 27,323,045 28,977,212 31,765,003 5,284,884 20.0 %Grants & Contracts 33,713,561 32,604,729 31,656,427 33,285,000 34,042,600 329,039 1.0 %Sales & Service 3,392,805 3,562,079 3,796,159 3,908,376 3,427,102 34,297 1.0 %Other Sources 3,456,465 3,811,873 4,338,176 4,162,580 4,162,580 706,115 20.4 %
Total Revenues 123,239,422$ 123,804,928$ 126,019,256$ 129,306,728$ 134,576,197$ 11,336,775$ 9.2 %
Expenditures and TransfersInstruction 40,604,990$ 40,957,652$ 42,109,671$ 45,998,961$ 45,213,626$ 4,608,636$ 11.3 %Research 412,343 530,334 492,491 511,875 401,185 (11,158) (2.7) %Public Service 1,625,610 1,967,088 1,776,009 1,885,925 1,828,028 202,418 12.5 %Academic Support 10,881,907 10,719,944 10,328,928 11,578,488 11,725,505 843,598 7.8 %Student Services 10,983,472 11,636,265 11,775,768 13,133,185 13,085,901 2,102,429 19.1 %Institutional Support 4,942,719 5,040,278 5,266,721 6,498,262 6,647,882 1,705,163 34.5 %Operation & Maintenance of Plant 10,939,447 10,846,367 11,230,726 11,298,918 11,794,323 854,876 7.8 %Scholarships & Fellowships 40,952,294 40,274,239 39,740,907 41,784,929 42,603,050 1,650,756 4.0 %
Subtotal Expenditures 121,342,782$ 121,972,167$ 122,721,220$ 132,690,543$ 133,299,500$ 11,956,718$ 9.9 %Mandatory Transfers 666,114 661,527 661,576 626,148 626,148 (39,966) (6.0) %Non-Mandatory Transfers 2,117,168 1,685,315 1,584,444 (4,009,963) 650,549 (1,466,619) (69.3) %
Total Expenditures & Transfers 124,126,064$ 124,319,009$ 124,967,240$ 129,306,728$ 134,576,197$ 10,450,133$ 8.4 %Fund Balance Addition/(Reduction) (886,642)$ (514,081)$ 1,052,016$
AUXILIARIESRevenues 10,830,742$ 11,711,339$ 10,111,015$ 10,594,992$ 10,192,740$ (638,002)$ (5.9) %Expenditures and Transfers
Expenditures 6,793,824$ 6,956,242$ 6,264,028$ 7,678,421$ 7,129,369$ 335,545$ 4.9 %Mandatory Transfers 2,935,777 3,043,819 2,505,713 2,041,717 2,041,717 (894,060) (30.5) %Non-Mandatory Transfers 1,246,199 1,807,194 1,068,833 874,854 1,021,654 (224,545) (18.0) %
Total Expenditures & Transfers 10,975,800$ 11,807,255$ 9,838,574$ 10,594,992$ 10,192,740$ (783,060)$ (7.1) %Fund Balance Addition/(Reduction) (145,058)$ (95,916)$ 272,440$
TOTALSRevenues 134,070,164$ 135,516,267$ 136,130,271$ 139,901,720$ 144,768,937$ 10,698,773$ 8.0 %Expenditures and Transfers
Expenditures 128,136,606$ 128,928,410$ 128,985,248$ 140,368,964$ 140,428,869$ 12,292,263$ 9.6 %Mandatory Transfers 3,601,891 3,705,346 3,167,289 2,667,865 2,667,865 (934,026) (25.9) %Non-Mandatory Transfers 3,363,367 3,492,509 2,653,277 (3,135,109) 1,672,203 (1,691,164) (50.3) %
Total Expenditures & Transfers 135,101,864$ 136,126,265$ 134,805,814$ 139,901,720$ 144,768,937$ 9,667,073$ 7.2 %Fund Balance Addition/(Reduction) (1,031,700)$ (609,997)$ 1,324,457$
MartinFive Year FY17 Proposed Budget Summary Comparison
Current Funds Revenues, Expenditures and Transfers - UNRESTRICTED AND RESTRICTED
FY 2013 TO FY 2017%
CHANGE
Schedule 9 - UTMD-41

Space InstituteFY 2017 Proposed Budget Summary
Unrestricted Current Funds Revenues, Expenditures, and Transfers
CHANGEFY 2015 FY 2016 FY 2017 PROBABLE TO PROPOSED
ACTUALS PROBABLE PROPOSED AMOUNT %EDUCATIONAL AND GENERALRevenues
Tuition & Fees 1,365,881$ 1,293,235$ 1,323,000$ 29,765$ 2.3 %
State Appropriations 8,012,212 8,286,603 8,578,403 291,800$ 3.5 %
Grants & Contracts 251,580 254,926 290,000 35,074 13.8 %
Sales & ServiceOther Sources 36,446 19,384 (19,384) (100.0) %
Total Revenues 9,666,119$ 9,854,148$ 10,191,403$ 337,255$ 3.4 %
Expenditures and TransfersInstruction 4,175,856$ 4,704,362$ 5,014,243$ 309,881$ 6.6 %
Research 1,444,985 1,700,009 609,360 (1,090,649) (64.2) %Public ServiceAcademic Support 258,219 543,118 527,194 (15,924) (2.9) %Student Services 94,020 74,191 76,048 1,857 2.5 %
Institutional Support 1,476,377 1,376,288 1,509,508 133,220 9.7 %
Operation & Maintenance of Plant 2,214,874 1,977,013 2,024,659 47,646 2.4 %
Scholarships & Fellowships 235,139 290,564 288,891 (1,673) (0.6) %Subtotal Expenditures 9,899,470$ 10,665,545$ 10,049,903$ (615,642)$ (5.8) %
Mandatory TransfersNon-Mandatory Transfers (263,564) (811,397) 141,500 952,897 117.4 %
Total Expenditures & Transfers 9,635,906$ 9,854,148$ 10,191,403$ 337,255$ 3.4 %
Fund Balance Addition/(Reduction) 30,213$
AUXILIARIESRevenues 175,895$ 178,850$ 215,000$ 36,150$ 20.2 %
Expenditures and TransfersExpenditures 330,237 254,266 215,000 (39,266)$ (15.4) %Mandatory TransfersNon-Mandatory Transfers (161,737) (75,416) - 75,416 100.0 %
Total Expenditures & Transfers 168,500$ 178,850$ 215,000$ 36,150$ 20.2 %
Fund Balance Addition/(Reduction) 7,395$
TOTALSRevenues 9,842,014$ 10,032,998$ 10,406,403$ 373,405$ 3.7 %
Expenditures and TransfersExpenditures 10,229,707$ 10,919,811$ 10,264,903$ (654,908)$ (6.0) %Mandatory TransfersNon-Mandatory Transfers (425,301) (886,813) 141,500 1,028,313 116.0 %
Total Expenditures & Transfers 9,804,406$ 10,032,998$ 10,406,403$ 373,405$ 3.7 %
Fund Balance Addition/(Reduction) 37,608$
Schedule 15 - UTSID-42

FY 2013 FY 2014 FY 2015 FY 2016 FY 2017ACTUAL ACTUAL ACTUAL PROBABLE PROPOSED AMOUNT
EDUCATIONAL AND GENERALRevenues
Tuition & Fees 1,354,039$ 1,329,067$ 1,365,881$ 1,293,235$ 1,323,000$ (31,039)$ (2.3) %State Appropriations 7,700,101 7,995,412 8,012,212 8,286,603 8,578,403 878,302 11.4 %Grants & Contracts 432,524 269,668 251,580 254,926 290,000 (142,524) (33.0) %Sales & Service 248,855 14,000 (248,855) (100.0) %Other Sources 15,064 43,255 36,446 19,384 (15,064) (100.0) %
Total Revenues 9,750,584$ 9,651,402$ 9,666,119$ 9,854,148$ 10,191,403$ 440,819$ 4.5 %
Expenditures and TransfersInstruction 4,348,223$ 4,316,257$ 4,175,856$ 4,704,362$ 5,014,243$ 666,020$ 15.3 %Research 1,229,780 1,004,844 1,444,985 1,700,009 609,360 (620,420) (50.4) %Public ServiceAcademic Support 309,950 325,317 258,219 543,118 527,194 217,244 70.1 %Student Services 35,684 31,120 94,020 74,191 76,048 40,364 113.1 %Institutional Support 1,490,197 1,500,259 1,476,377 1,376,288 1,509,508 19,311 1.3 %Operation & Maintenance of Plant 2,029,949 2,186,598 2,214,874 1,977,013 2,024,659 (5,290) (0.3) %Scholarships & Fellowships 345,476 314,901 235,139 290,564 288,891 (56,585) (16.4) %
Subtotal Expenditures 9,789,257$ 9,679,295$ 9,899,470$ 10,665,545$ 10,049,903$ 260,646$ 2.7 %Mandatory TransfersNon-Mandatory Transfers (34,214) 251,298 (263,564) (811,397) 141,500 175,714 513.6 %
Total Expenditures & Transfers 9,755,043$ 9,930,593$ 9,635,906$ 9,854,148$ 10,191,403$ 436,360$ 4.5 %Fund Balance Addition/(Reduction) (4,459)$ (279,191)$ 30,213$
AUXILIARIESRevenues 206,244$ 168,557$ 175,895$ 178,850$ 215,000$ 8,756$ 4.2 %Expenditures and Transfers
Expenditures 439,083$ 327,872$ 330,237$ 254,266$ 215,000$ (224,083)$ (51.0) %Mandatory TransfersNon-Mandatory Transfers (222,924) (178,383) (161,737) (75,416) 0 222,924 100.0 %
Total Expenditures & Transfers 216,159$ 149,489$ 168,500$ 178,850$ 215,000$ (1,159)$ (0.5) %Fund Balance Addition/(Reduction) (9,915)$ 19,067$ 7,395$
TOTALSRevenues 9,956,828$ 9,819,958$ 9,842,014$ 10,032,998$ 10,406,403$ 449,575$ 4.5 %Expenditures and Transfers
Expenditures 10,228,340$ 10,007,167$ 10,229,707$ 10,919,811$ 10,264,903$ 36,563$ 0.4 %Mandatory TransfersNon-Mandatory Transfers (257,138) 72,915 (425,301) (886,813) 141,500 398,638 155.0 %
Total Expenditures & Transfers 9,971,202$ 10,080,082$ 9,804,406$ 10,032,998$ 10,406,403$ 435,201$ 4.4 %Fund Balance Addition/(Reduction) (14,374)$ (260,124)$ 37,608$
Space InstituteFive Year FY17 Proposed Budget Summary Comparison
Current Funds Revenues, Expenditures and Transfers - UNRESTRICTED
FY 2013 TO FY 2017%
CHANGE
Schedule 8 - UTSID-43

Space InstituteUnrestricted Net Assets
E&G AUXILIARIES TOTALNet Assets - June 30, 2014 227,787$ 31,732$ 259,519$ Percent Unallocated of Expend. & Transfers * 2.05% 3.05% 2.07%
FY 2014-15 ACTUALRevenue 9,666,119$ 175,895$ 9,842,014$ Less:
Expenditures 9,899,470$ 330,237$ 10,229,707$ Mandatory TransfersNon-Mandatory Transfers (263,564) (161,737) (425,301)
Total Expenditures & Transfers 9,635,906$ 168,500$ 9,804,406$ Net Change 30,213$ 7,395$ 37,608$ Unrestricted Net Assets
Working Capital-Accounts Receivable 63,433$ 63,433$ Working Capital-Petty CashWorking Capital-Inventories 33,762$ 33,762 Revolving FundsEncumbrancesUnexpended GiftsReappropriationsUnallocated 194,567 5,365 199,932
Net Assets - June 30, 2015 258,000$ 39,127$ 297,127$ Percent Unallocated of Expend. & Transfers * 2.02% 3.18% 2.04%
FY 2015-16 PROBABLE BUDGETRevenue 9,854,148$ 178,850$ 10,032,998$ Less:
Expenditures 10,665,545$ 254,266$ 10,919,811$ Mandatory TransfersNon-Mandatory Transfers (811,397) (75,416) (886,813)
Total Expenditures & Transfers 9,854,148$ 178,850$ 10,032,998$ Net Change -$ -$ -$ Unrestricted Net Assets
Working Capital-Accounts Receivable 42,557$ 42,557$ Working Capital-Petty CashWorking Capital-Inventories 30,762$ 30,762 Revolving FundsEncumbrancesUnexpended GiftsReappropriationsUnallocated 215,444 8,365 223,809
Estimated Net Assets - June 30, 2016 258,000$ 39,127$ 297,127$ Percent Unallocated of Expend. & Transfers * 2.19% 4.68% 2.23%
FY 2016-17 PROPOSED BUDGETRevenue 10,191,403$ 215,000$ 10,406,403$ Less:
Expenditures 10,049,903$ 215,000$ 10,264,903$ Mandatory TransfersNon-Mandatory Transfers 141,500 141,500
Total Expenditures & Transfers 10,191,403$ 215,000$ 10,406,403$ Net Change -$ -$ -$ Unrestricted Net Assets
Working Capital-Accounts Receivable 42,557$ 42,557$ Working Capital-Petty CashWorking Capital-Inventories 30,762$ 30,762 Revolving FundsEncumbrancesUnexpended GiftsReappropriationsUnallocated 215,444 8,365 223,809
Estimated Net Assets - June 30, 2017 258,000$ 39,127$ 297,127$ Percent Unallocated of Expend. & Transfers * 2.11% 3.89% 2.15%
* Recommended percent for unallocated expenditures is 2% to 5% for E&G and 3% to 5% for auxiliaries.
Net Assets ‐ UTSID-44

Space InstituteFY 2017 Proposed Budget Summary
Auxiliary Enterprises Funds Revenues, Expenditures and Transfers
CHANGEFY 2015 FY 2016 FY 2017 PROBABLE TO PROPOSEDACTUAL PROBABLE PROPOSED AMOUNT %
HOUSINGRevenues 53,376$ 52,500$ 65,000$ 12,500$ 23.8%Expenditures and TransfersExpenditures 83,655$ 68,000$ 65,000$ (3,000)$ -4.4%Mandatory TransfersNon-Mandatory Transfers (290) (15,500) 15,500 -100.0%Total Expenditures and Transfers 83,365$ 52,500$ 65,000$ 12,500$ 23.8%
Fund Balance Addition/(Reduction) (29,989)$
FOOD SERVICERevenues 122,519$ 126,350$ 150,000$ 23,650$ 18.7%Expenditures and TransfersExpenditures 246,582$ 186,266$ 150,000$ (36,266)$ -19.5%Mandatory TransfersNon-Mandatory Transfers (161,447) (59,916) 59,916 -100.0%Total Expenditures and Transfers 85,135$ 126,350$ 150,000$ 23,650$ 18.7%
Fund Balance Addition/(Reduction) 37,384$
TOTALRevenues 175,895$ 178,850$ 215,000$ 36,150$ 20.2%Expenditures and TransfersExpenditures 330,237$ 254,266$ 215,000$ (39,266)$ -15.4%Mandatory TransfersNon-Mandatory Transfers (161,737) (75,416) 75,416 -100.0%Total Expenditures and Transfers 168,500$ 178,850$ 215,000$ 36,150$ 20.2%
Fund Balance Addition/(Reduction) 7,395$
Schedule 13 - Auxiliaries
D-45

FY 2015 FY 2016 FY 2017ACTUAL PROBABLE PROPOSED AMOUNT
EDUCATIONAL AND GENERAL
Salaries and Benefits
Salaries
Academic 2,239,724$ 2,632,527$ 3,171,097$ 538,570$ 20.5 %
Non-Academic 3,030,583 3,293,952 3,216,510 (77,442) (2.4) %
Students
Total Salaries 5,270,307$ 5,926,479$ 6,387,607$ 461,128$ 7.8 %
Staff Benefits 1,915,629 1,794,920 1,770,753 (24,167) (1.3) %
Total Salaries and Benefits 7,185,936$ 7,721,399$ 8,158,360$ 436,961$ 5.7 %
Operating 2,229,592 2,904,146 1,851,543 (1,052,603) (36.2) %
Equipment and Capital Outlay 483,942 40,000 40,000Total Expenditures 9,899,470$ 10,665,545$ 10,049,903$ (615,642)$ (5.8) %
AUXILIARIES
Salaries and Benefits
Salaries
Academic
Non-Academic 155,181$ 96,022$ 96,422$ 400$ 0.4 %
Students
Total Salaries 155,181$ 96,022$ 96,422$ 400$ 0.4 %
Staff Benefits 49,741 24,109 30,094 5,985 24.8 %
Total Salaries and Benefits 204,922$ 120,131$ 126,516$ 6,385$ 5.3 %
Operating 125,315 129,335 83,684 (45,651) (35.3) %
Equipment and Capital Outlay 4,800 4,800Total Expenditures 330,237$ 254,266$ 215,000$ (39,266)$ (15.4) %
TOTALS
Salaries and Benefits
Salaries
Academic 2,239,724$ 2,632,527$ 3,171,097$ 538,570$ 20.5 %
Non-Academic 3,185,764 3,389,974 3,312,932 (77,042) (2.3) %
Students
Total Salaries 5,425,488$ 6,022,501$ 6,484,029$ 461,528$ 7.7 %
Staff Benefits 1,965,370 1,819,029 1,800,847 (18,182) (1.0) %
Total Salaries and Benefits 7,390,858$ 7,841,530$ 8,284,876$ 443,346$ 5.7 %
Operating 2,354,906 3,033,481 1,935,227 (1,098,254) (36.2) %
Equipment and Capital Outlay 483,942 44,800 44,800 0 - Total Expenditures 10,229,707$ 10,919,811$ 10,264,903$ (654,908)$ (6.0) %
%
CHANGE
FY 2017 Proposed Budget Summary - Natural ClassificationsUnrestricted Current Funds Expenditures
Space Institute
PROBABLE TO PROPOSED
Schedule 12 ‐ UTSID-46

Unrestricted Restricted Total Unrestricted Restricted Total Unrestricted Restricted Total Amount
EDUCATION AND GENERALRevenues
Tuition & Fees 1,365,881$ 1,365,881$ 1,293,235$ 1,293,235$ 1,323,000$ 1,323,000$ 29,765$ 2.3 %
State Appropriations 8,012,212 833,564$ 8,845,776 8,286,603 816,564$ 9,103,167 8,578,403 803,354$ 9,381,757 278,590$ 3.1 %
Grants & Contracts 251,580 645,599 897,179 254,926 900,000 1,154,926 290,000 900,000 1,190,000 35,074 3.0 %
Sales & Service
Other Sources 36,446 549 36,995 19,384 240,000 259,384 220,000 220,000 (39,384) (15.2) %
Total Revenues 9,666,119$ 1,479,712$ 11,145,831$ 9,854,148$ 1,956,564$ 11,810,712$ 10,191,403$ 1,923,354$ 12,114,757$ 304,045$ 2.6 %
Expenditures and Transfers
Instruction 4,175,856$ 64,573$ 4,240,429$ 4,704,362 150,000$ 4,854,362$ 5,014,243$ 180,000$ 5,194,243$ 339,881$ 7.0 %
Research 1,444,985 1,352,807 2,797,792 1,700,009 1,773,864$ 3,473,873 609,360 1,711,354 2,320,714 (1,153,159) (33.2) %
Public Service
Academic Support 258,219 16,481 274,700 543,118 10,000 553,118 527,194 8,000 535,194 (17,924) (3.2) %
Student Services 94,020 94,020 74,191 74,191 76,048 76,048 1,857 2.5 %
Institutional Support 1,476,377 19,716 1,496,093 1,376,288 9,000 1,385,288 1,509,508 9,000 1,518,508 133,220 9.6 %
Operation & Maintenance of Plant 2,214,874 2,214,874 1,977,013 1,977,013 2,024,659 2,024,659 47,646 2.4 %
Scholarships & Fellowships 235,139 11,703 246,842 290,564 13,700 304,264 288,891 15,000 303,891 (373) (0.1) %
Subtotal Expenditures 9,899,470$ 1,465,280$ 11,364,750$ 10,665,545$ 1,956,564$ 12,622,109$ 10,049,903$ 1,923,354$ 11,973,257$ (648,852)$ (5.1) %
Mandatory Transfers
Non-Mandatory Transfers (263,564) (263,564) (811,397) (811,397) 141,500 141,500 952,897 117.4 %
Total Expenditures & Transfers 9,635,906$ 1,465,280$ 11,101,186$ 9,854,148$ 1,956,564$ 11,810,712$ 10,191,403$ 1,923,354$ 12,114,757$ 304,045$ 2.6 %
Fund Balance Addition / (Reduction) 30,213$ 14,433$ 44,645$ -$ -$ -$ -$ -$ -$
AUXILIARIES
Revenues 175,895$ 175,895$ 178,850$ 178,850$ 215,000$ 215,000$ 36,150$ 20.2 %
Expenditures and Transfers
Expenditures 330,237$ 330,237$ 254,266$ 254,266$ 215,000$ 215,000$ (39,266)$ (15.4) %
Mandatory Transfers
Non-Mandatory Transfers (161,737) (161,737) (75,416) (75,416) - - 75,416 100.0 %
Total Expenditures & Transfers 168,500$ 168,500$ 178,850$ 178,850$ 215,000$ 215,000$ 36,150$ 20.2
Fund Balance Addition / (Reduction) 7,395$ 7,395$
TOTALS
Revenues 9,842,014$ 1,479,712$ 11,321,726$ 10,032,998$ 1,956,564$ 11,989,562$ 10,406,403$ 1,923,354$ 12,329,757$ 340,195$ 2.8 %
Expenditures and Transfers
Expenditures 10,229,707$ 1,465,280$ 11,694,987$ 10,919,811$ 1,956,564$ 12,876,375$ 10,264,903$ 1,923,354$ 12,188,257$ (688,118)$ (5.3) %
Mandatory Transfers
Non-Mandatory Transfers (425,301) (425,301) (886,813) (886,813) 141,500 141,500 1,028,313 116.0 %
Total Expenditures & Transfers 9,804,406$ 1,465,280$ 11,269,686$ 10,032,998$ 1,956,564$ 11,989,562$ 10,406,403$ 1,923,354$ 12,329,757$ 340,195$ 2.8 %
Fund Balance Addition / (Reduction) 37,608$ 14,433$ 52,041$
%
Space InstituteFY 2017 Proposed Budget Summary
Unrestricted and Restricted Current Funds Revenues, Expenditures and Transfers
Probable to ProposedFY 2015 Actual FY 2016 Probable FY 2017 ProposedChange
Schedule 10 - UTSID-47

FY 2013 FY 2014 FY 2015 FY 2016 FY 2017ACTUAL ACTUAL ACTUAL PROBABLE PROPOSED AMOUNT
EDUCATIONAL AND GENERALRevenues
Tuition & Fees 1,354,039$ 1,329,067$ 1,365,881$ 1,293,235$ 1,323,000$ (31,039)$ (2.3) %State Appropriations 8,524,481 8,849,514 8,845,776 9,103,167 9,381,757 857,276 10.1 %Grants & Contracts 1,356,721 910,004 897,179 1,154,926 1,190,000 (166,721) (12.3) %Sales & Service 248,855 14,000 (248,855) (100.0) %Other Sources 59,003 249,850 36,995 259,384 220,000 160,998 272.9 %
Total Revenues 11,543,098$ 11,352,435$ 11,145,831$ 11,810,712$ 12,114,757$ 571,659$ 5.0 %
Expenditures and TransfersInstruction 4,348,723$ 4,316,257$ 4,240,429$ 4,854,362$ 5,194,243$ 845,520$ 19.4 %Research 3,062,035 2,491,618 2,797,792 3,473,873 2,320,714 (741,321) (24.2) %Public ServiceAcademic Support 316,775 329,820 274,700 553,118 535,194 218,419 69.0 %Student Services 35,684 31,120 94,020 74,191 76,048 40,364 113.1 %Institutional Support 1,529,908 1,503,224 1,496,093 1,385,288 1,518,508 (11,400) (0.7) %Operation & Maintenance of Plant 2,029,949 2,186,598 2,214,874 1,977,013 2,024,659 (5,290) (0.3) %Scholarships & Fellowships 359,176 326,401 246,842 304,264 303,891 (55,285) (15.4) %
Subtotal Expenditures 11,682,249$ 11,185,037$ 11,364,750$ 12,622,109$ 11,973,257$ 291,008$ 2.5 %Mandatory TransfersNon-Mandatory Transfers (34,214) 251,298 (263,564) (811,397) 141,500 175,714 513.6 %
Total Expenditures & Transfers 11,648,035$ 11,436,335$ 11,101,186$ 11,810,712$ 12,114,757$ 466,722$ 4.0 %Fund Balance Addition/(Reduction) (104,937)$ (83,900)$ 44,645$
AUXILIARIESRevenues 206,244$ 168,557$ 175,895$ 178,850$ 215,000$ 8,756$ 4.2 %Expenditures and Transfers
Expenditures 439,083$ 327,872$ 330,237$ 254,266$ 215,000$ (224,083)$ (51.0) %Mandatory TransfersNon-Mandatory Transfers (222,924) (178,383) (161,737) (75,416) 0 222,924 100.0 %
Total Expenditures & Transfers 216,159$ 149,489$ 168,500$ 178,850$ 215,000$ (1,159)$ (0.5) %Fund Balance Addition/(Reduction) (9,915)$ 19,067$ 7,395$ -$ -$
TOTALSRevenues 11,749,343$ 11,520,992$ 11,321,726$ 11,989,562$ 12,329,757$ 580,414$ 4.9 %Expenditures and Transfers
Expenditures 12,121,332$ 11,512,909$ 11,694,987$ 12,876,375$ 12,188,257$ 66,925$ 0.6 %Mandatory TransfersNon-Mandatory Transfers (257,138) 72,915 (425,301) (886,813) 141,500 398,638 155.0 %
Total Expenditures & Transfers 11,864,194$ 11,585,824$ 11,269,686$ 11,989,562$ 12,329,757$ 465,563$ 3.9 %Fund Balance Addition/(Reduction) (114,851)$ (64,832)$ 52,041$
Space InstituteFive Year FY17 Proposed Budget Summary Comparison
Current Funds Revenues, Expenditures and Transfers - UNRESTRICTED AND RESTRICTED
FY 2013 TO FY 2017%
CHANGE
Schedule 9 - UTSID-48

Health Science Center FY 2017 Proposed Budget Summary
Unrestricted Current Funds Revenues, Expenditures, and Transfers
CHANGEFY 2015 FY 2016 FY 2017 PROBABLE TO PROPOSED
ACTUALS PROBABLE PROPOSED AMOUNT %EDUCATIONAL AND GENERALRevenues
Tuition & Fees 78,753,143$ 81,951,644$ 84,640,459$ 2,688,815$ 3.3 %
State Appropriations 129,958,440 135,671,921 140,995,421 5,323,500 3.9 %
Grants & Contracts 14,969,407 16,772,027 16,865,745 93,718 0.6 %
Sales & Service 19,678,231 20,007,554 20,204,135 196,581 1.0 %
Other Sources 2,531,675 2,916,908 2,998,238 81,330 2.8 %Total Revenues 245,890,897$ 257,320,054$ 265,703,998$ 8,383,944$ 3.3 %
Expenditures and TransfersInstruction 126,169,173$ 145,070,751$ 138,570,757$ (6,499,994)$ (4.5) %Research 7,185,683 12,851,852 7,653,398 (5,198,454) (40.4) %Public Service 25,577 71,100 70,276 (824) (1.2) %Academic Support 42,692,206 51,154,807 42,655,010 (8,499,797) (16.6) %Student Services 6,314,922 6,574,843 6,244,485 (330,358) (5.0) %Institutional Support 24,373,093 28,183,824 23,817,362 (4,366,462) (15.5) %Operation & Maintenance of Plant 32,872,246 26,774,642 27,052,230 277,588 1.0 %
Scholarships & Fellowships 9,032,008 8,906,637 8,923,087 16,450 0.2 %Subtotal Expenditures 248,664,908$ 279,588,456$ 254,986,605$ (24,601,851)$ (8.8) %
Mandatory Transfers 4,077,472 6,022,718 6,206,893 184,175 3.1 %
Non-Mandatory Transfers (1,753,146) 4,151,800 4,510,500 358,700 8.6 %Total Expenditures & Transfers 250,989,234$ 289,762,974$ 265,703,998$ (24,058,976)$ (8.3) %
Fund Balance Addition/(Reduction) (5,098,337)$ (32,442,920)$
AUXILIARIESRevenues 1,401,760$ 1,711,178$ 1,731,222$ 20,044$ 1.2 %
Expenditures and TransfersExpenditures 1,038,289 1,524,276 1,360,722 (163,554) (10.7) %Mandatory Transfers 368,674 367,902 370,500 2,598 0.7 %
Non-Mandatory Transfers 11,431 (181,000) 181,000 100.0 %Total Expenditures & Transfers 1,418,394$ 1,711,178$ 1,731,222$ 20,044$ 1.2 %
Fund Balance Addition/(Reduction) (16,634)$
TOTALSRevenues 247,292,657$ 259,031,232$ 267,435,220$ 8,403,988$ 3.2 %
Expenditures and TransfersExpenditures 249,703,197$ 281,112,732$ 256,347,327$ (24,765,405)$ (8.8) %Mandatory Transfers 4,446,146 6,390,620 6,577,393 186,773 2.9 %
Non-Mandatory Transfers (1,741,715) 3,970,800 4,510,500 539,700 13.6 %Total Expenditures & Transfers 252,407,628$ 291,474,152$ 267,435,220$ (24,038,932)$ (8.2) %
Fund Balance Addition/(Reduction) (5,114,971)$ (32,442,920)$
Schedule 15 - UTHSCD-49

FY 2013 FY 2014 FY 2015 FY 2016 FY 2017ACTUAL ACTUAL ACTUAL PROBABLE PROPOSED AMOUNT
EDUCATIONAL AND GENERALRevenues
Tuition & Fees 72,145,924$ 76,610,797$ 78,753,143$ 81,951,644$ 84,640,459$ 12,494,535$ 17.3 %State Appropriations 122,200,499 129,470,351 129,958,440 135,671,921 140,995,421 18,794,922 15.4 %Grants & Contracts 13,954,817 14,105,913 14,969,407 16,772,027 16,865,745 2,910,928 20.9 %Sales & Service 19,788,611 20,327,689 19,678,231 20,007,554 20,204,135 415,524 2.1 %Other Sources 19,823,751 3,709,927 2,531,675 2,916,908 2,998,238 (16,825,513) (84.9) %
Total Revenues 247,913,602$ 244,224,676$ 245,890,897$ 257,320,054$ 265,703,998$ 17,790,396$ 7.2 %
Expenditures and TransfersInstruction 112,653,589$ 123,486,647$ 126,169,173$ 145,070,751$ 138,570,757$ 25,917,168$ 23.0 %Research 7,053,638 7,002,772 7,185,683 12,851,852 7,653,398 599,760 8.5 %Public Service 29,264 27,526 25,577 71,100 70,276 41,012 140.1 %Academic Support 39,196,623 42,541,896 42,692,206 51,154,807 42,655,010 3,458,387 8.8 %Student Services 5,289,960 5,816,979 6,314,922 6,574,843 6,244,485 954,525 18.0 %Institutional Support 19,464,973 23,569,881 24,373,093 28,183,824 23,817,362 4,352,389 22.4 %Operation & Maintenance of Plant 28,560,685 29,040,803 32,872,246 26,774,642 27,052,230 (1,508,455) (5.3) %Scholarships & Fellowships 8,345,309 8,736,712 9,032,008 8,906,637 8,923,087 577,778 6.9 %
Subtotal Expenditures 220,594,042$ 240,223,215$ 248,664,908$ 279,588,456$ 254,986,605$ 34,392,563$ 15.6 %Mandatory Transfers 2,620,096 3,021,421 4,077,472 6,022,718 6,206,893 3,586,797 136.9 %Non-Mandatory Transfers 7,531,633 7,342,031 (1,753,146) 4,151,800 4,510,500 (3,021,133) (40.1) %
Total Expenditures & Transfers 230,745,771$ 250,586,667$ 250,989,234$ 289,762,974$ 265,703,998$ 34,958,227$ 15.2 %Fund Balance Addition/(Reduction) 17,167,831$ (6,361,991)$ (5,098,337)$ (32,442,920)$
AUXILIARIESRevenues 2,247,338$ 1,550,222$ 1,401,760$ 1,711,178$ 1,731,222$ (516,116)$ (23.0) %Expenditures and Transfers
Expenditures 2,528,031$ 1,280,773$ 1,038,289$ 1,524,276$ 1,360,722$ (1,167,309)$ (46.2) %Mandatory Transfers 219,536 377,496 368,674 367,902 370,500 150,964 68.8 %Non-Mandatory Transfers (500,099) (84,215) 11,431 (181,000) 500,099 100.0 %
Total Expenditures & Transfers 2,247,468$ 1,574,054$ 1,418,394$ 1,711,178$ 1,731,222$ (516,246)$ (23.0) %Fund Balance Addition/(Reduction) (130)$ (23,831)$ (16,634)$
TOTALSRevenues 250,160,940$ 245,774,899$ 247,292,657$ 259,031,232$ 267,435,220$ 17,274,280$ 6.9 %Expenditures and Transfers
Expenditures 223,122,073$ 241,503,988$ 249,703,197$ 281,112,732$ 256,347,327$ 33,225,254$ 14.9 %Mandatory Transfers 2,839,632 3,398,917 4,446,146 6,390,620 6,577,393 3,737,761 131.6 %Non-Mandatory Transfers 7,031,534 7,257,816 (1,741,715) 3,970,800 4,510,500 (2,521,034) (35.9) %
Total Expenditures & Transfers 232,993,239$ 252,160,721$ 252,407,628$ 291,474,152$ 267,435,220$ 34,441,981$ 14.8 %Fund Balance Addition/(Reduction) 17,167,701$ (6,385,822)$ (5,114,971)$ (32,442,920)$
Health Science Center Five Year FY17 Proposed Budget Summary Comparison
Current Funds Revenues, Expenditures and Transfers - UNRESTRICTED
FY 2013 TO FY 2017%
CHANGE
Schedule 8 - HSC TOTALD-50

E&G AUXILIARIES TOTAL
Net Assets - June 30, 2014 62,063,973$ 88,297$ 62,152,270$
FY 2014-15 ACTUALRevenue 245,890,897$ 1,401,760$ 247,292,657 Less:Expenditures 248,664,908$ 1,038,289$ 249,703,197 Mandatory Transfers (In)/Out 4,077,472 368,674 4,446,146 Non-Mandatory Transfers(In)/Out (1,753,145) 11,431 (1,741,714) Total Expenditures & Transfers 250,989,235 1,418,394 252,407,629
Net Change (5,098,338) (16,634) (5,114,972) Unrestricted Net AssetsWorking Capital-Accounts Receivable 5,290,688$ 10,853$ 5,301,541$ Working Capital-Inventories 1,376,285 1,376,285 Revolving Funds 1,198,865 1,198,865 Encumbrances 3,135,887 205 3,136,092 Unexpended GiftsReappropriations 37,715,000 37,715,000 Unallocated 8,248,910 60,605 8,309,515
Net Assets - June 30, 2015 56,965,635 71,663 57,037,298 Percent Unallocated of Expend. & Transfers * 3.29% 4.27% 3.29%
FY 2015-16 PROBABLERevenue 257,320,054$ 1,711,178$ 259,031,232$ Less:Expenditures 279,588,456$ 1,524,276$ 281,112,732$ Mandatory Transfers (In)/Out 6,022,718 367,902 6,390,620 Non-Mandatory Transfers(In)/Out 4,151,800 (181,000) 3,970,800 Total Expenditures & Transfers 289,762,974$ 1,711,178$ 291,474,152$
Net Change (32,442,920)$ -$ (32,442,920)$ Unrestricted Net AssetsWorking Capital-Accounts Receivable 5,290,688$ 10,853$ 5,301,541$ Working Capital-Inventories 1,376,285 1,376,285 Revolving Funds 1,198,865 1,198,865 Encumbrances 428,797 205 429,002 Unexpended GiftsReappropriations 9,810,000 9,810,000 Unallocated 6,418,080 60,605 6,478,685
Estimated Net Assets - June 30, 2016 24,522,715$ 71,663$ 24,594,378$ Percent Unallocated of Expend. & Transfers * 2.21% 3.54% 2.22%
FY 2016-17 PROPOSED BUDGETRevenue 265,703,998$ 1,731,222$ 267,435,220$ Less:Expenditures 254,986,605$ 1,360,722$ 256,347,327$ Mandatory Transfers (In)/Out 6,206,893 370,500 6,577,393 Non-Mandatory Transfers(In)/Out 4,510,500 - 4,510,500 Total Expenditures & Transfers 265,703,998$ 1,731,222$ 267,435,220$
Net Change -$ -$ -$ Unrestricted Net AssetsWorking Capital-Accounts Receivable 5,290,688$ 10,853$ 5,301,541$ Working Capital-Inventories 1,376,285 1,376,285 Revolving Funds 1,198,865 1,198,865 Encumbrances 428,797 205 429,002 Unexpended GiftsReappropriations 9,810,000 9,810,000 Unallocated 6,418,080 60,605 6,478,685
Estimated Net Assets - June 30, 2017 24,522,715$ 71,663$ 24,594,378$ Percent Unallocated of Expend. & Transfers * 2.42% 3.50% 2.42%
* Recommended percent for unallocated expenditures is 2% to 5% for E&G and 3% to 5% for auxiliaries.
Health Science CenterUnrestricted Net Assets
HSC Net AssetsD-51
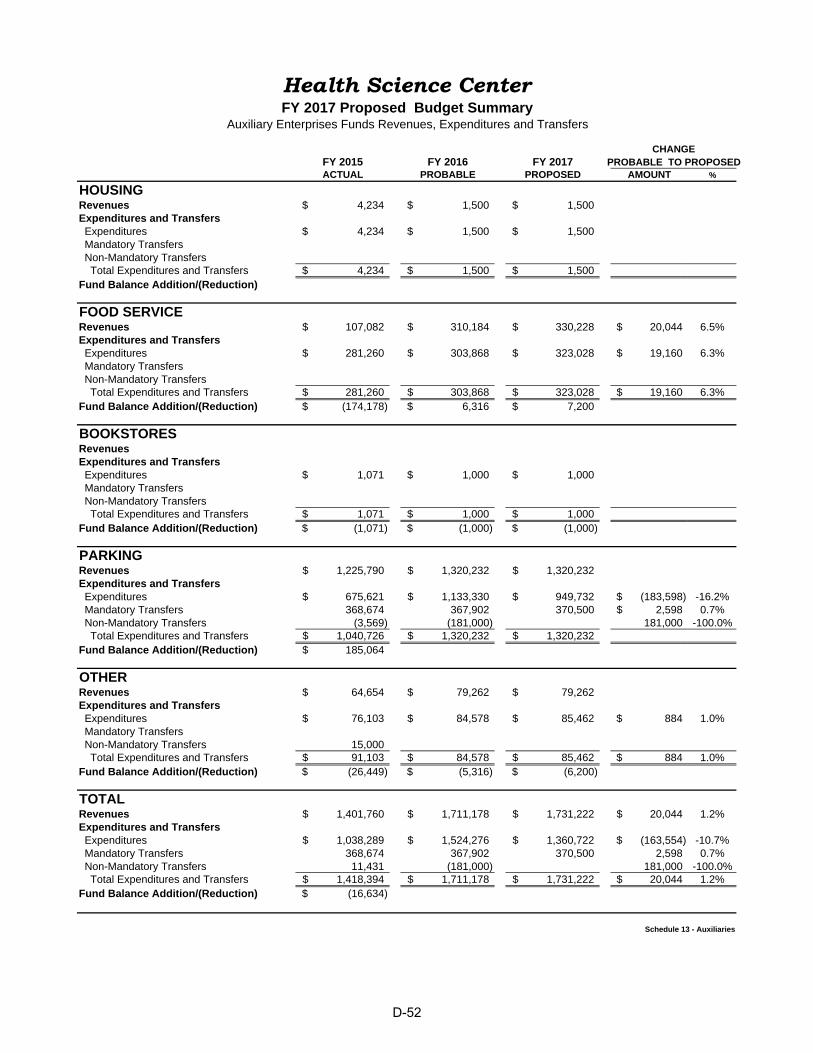
Health Science CenterFY 2017 Proposed Budget Summary
Auxiliary Enterprises Funds Revenues, Expenditures and Transfers
CHANGEFY 2015 FY 2016 FY 2017 PROBABLE TO PROPOSEDACTUAL PROBABLE PROPOSED AMOUNT %
HOUSINGRevenues 4,234$ 1,500$ 1,500$ Expenditures and TransfersExpenditures 4,234$ 1,500$ 1,500$ Mandatory TransfersNon-Mandatory TransfersTotal Expenditures and Transfers 4,234$ 1,500$ 1,500$
Fund Balance Addition/(Reduction)
FOOD SERVICERevenues 107,082$ 310,184$ 330,228$ 20,044$ 6.5%Expenditures and TransfersExpenditures 281,260$ 303,868$ 323,028$ 19,160$ 6.3%Mandatory TransfersNon-Mandatory TransfersTotal Expenditures and Transfers 281,260$ 303,868$ 323,028$ 19,160$ 6.3%
Fund Balance Addition/(Reduction) (174,178)$ 6,316$ 7,200$
BOOKSTORESRevenuesExpenditures and TransfersExpenditures 1,071$ 1,000$ 1,000$ Mandatory TransfersNon-Mandatory TransfersTotal Expenditures and Transfers 1,071$ 1,000$ 1,000$
Fund Balance Addition/(Reduction) (1,071)$ (1,000)$ (1,000)$
PARKINGRevenues 1,225,790$ 1,320,232$ 1,320,232$ Expenditures and TransfersExpenditures 675,621$ 1,133,330$ 949,732$ (183,598)$ -16.2%Mandatory Transfers 368,674 367,902 370,500 2,598$ 0.7%Non-Mandatory Transfers (3,569) (181,000) 181,000 -100.0%Total Expenditures and Transfers 1,040,726$ 1,320,232$ 1,320,232$
Fund Balance Addition/(Reduction) 185,064$
OTHERRevenues 64,654$ 79,262$ 79,262$ Expenditures and TransfersExpenditures 76,103$ 84,578$ 85,462$ 884$ 1.0%Mandatory TransfersNon-Mandatory Transfers 15,000 Total Expenditures and Transfers 91,103$ 84,578$ 85,462$ 884$ 1.0%
Fund Balance Addition/(Reduction) (26,449)$ (5,316)$ (6,200)$
TOTALRevenues 1,401,760$ 1,711,178$ 1,731,222$ 20,044$ 1.2%Expenditures and TransfersExpenditures 1,038,289$ 1,524,276$ 1,360,722$ (163,554)$ -10.7%Mandatory Transfers 368,674 367,902 370,500 2,598 0.7%Non-Mandatory Transfers 11,431 (181,000) 181,000 -100.0%Total Expenditures and Transfers 1,418,394$ 1,711,178$ 1,731,222$ 20,044$ 1.2%
Fund Balance Addition/(Reduction) (16,634)$
Schedule 13 - Auxiliaries
D-52

FY 2015 FY 2016 FY 2017ACTUAL PROBABLE PROPOSED AMOUNT
EDUCATIONAL AND GENERAL
Salaries and Benefits
Salaries
Academic 83,691,209$ 89,630,367$ 86,450,638$ (3,179,729)$ (3.5) %
Non-Academic 60,389,073 64,091,075 63,838,396 (252,679) (0.4) %
Students 908,650 1,150,320 674,481 (475,839) (41.4) %
Total Salaries 144,988,932$ 154,871,762$ 150,963,515$ (3,908,247)$ (2.5) %
Staff Benefits 45,000,008 45,785,526 45,928,704 143,178 0.3 %
Total Salaries and Benefits 189,988,940$ 200,657,288$ 196,892,219$ (3,765,069)$ (1.9) %
Operating 55,213,766 72,659,637 54,186,622 (18,473,015) (25.4) %
Equipment and Capital Outlay 3,462,203 6,271,531 3,907,764 (2,363,767) (37.7) %
Total Expenditures 248,664,908$ 279,588,456$ 254,986,605$ (24,601,851)$ (8.8) %
AUXILIARIES
Salaries and Benefits
Salaries
Academic
Non-Academic 391,313$ 221,366$ 205,580$ (15,786)$ (7.1) %
Students
Total Salaries 391,313$ 221,366$ 205,580$ (15,786)$ (7.1) %
Staff Benefits 151,317 159,636 159,928 292 0.2 %
Total Salaries and Benefits 542,629$ 381,002$ 365,508$ (15,494)$ (4.1) %
Operating 495,660 1,143,274 995,214 (148,060) (13.0) %
Equipment and Capital OutlayTotal Expenditures 1,038,289$ 1,524,276$ 1,360,722$ (163,554)$ (10.7) %
TOTALS
Salaries and Benefits
Salaries
Academic 83,691,209$ 89,630,367$ 86,450,638$ (3,179,729)$ (3.5) %
Non-Academic 60,780,386 64,312,441 64,043,976 (268,465) (0.4) %
Students 908,650 1,150,320 674,481 (475,839) (41.4) %
Total Salaries 145,380,244$ 155,093,128$ 151,169,095$ (3,924,033)$ (2.5) %
Staff Benefits 45,151,325 45,945,162 46,088,632 143,470 0.3 %
Total Salaries and Benefits 190,531,569$ 201,038,290$ 197,257,727$ (3,780,563)$ (1.9) %
Operating 55,709,425 73,802,911 55,181,836 (18,621,075) (25.2) %
Equipment and Capital Outlay 3,462,203 6,271,531 3,907,764 (2,363,767) (37.7) %Total Expenditures 249,703,197$ 281,112,732$ 256,347,327$ (24,765,405)$ (8.8) %
%
Health Science CenterFY 2017 Proposed Budget Summary - Natural Classifications
Unrestricted Current Funds Expenditures
CHANGE
PROBABLE TO PROPOSED
Schedule 12 ‐ HSC TOTALD-53

Unrestricted Restricted Total Unrestricted Restricted Total Unrestricted Restricted Total
EDUCATION AND GENERALRevenues
Tuition & Fees 78,753,143$ 78,753,143$ 81,951,644$ 81,951,644$ 84,640,459$ 84,640,459$ 2,688,815$ 3.3 %
State Appropriations 129,958,440 6,234,119$ 136,192,559 135,671,921 6,003,543$ 141,675,464 140,995,421 5,980,105$ 146,975,526 5,300,062 3.7 %
Grants & Contracts 14,969,407 212,057,094 227,026,501 16,772,027 184,629,000 201,401,027 16,865,745 187,929,000 204,794,745 3,393,718 1.7 %
Sales & Service 19,678,231 19,678,231 20,007,554 20,007,554 20,204,135 20,204,135 196,581 1.0 %
Other Sources 2,531,675 19,826,889 22,358,564 2,916,908 18,149,728 21,066,636 2,998,238 18,149,728 21,147,966 81,330 0.4 %
Total Revenues 245,890,897$ 238,118,101$ 484,008,998$ 257,320,054$ 208,782,271$ 466,102,325$ 265,703,998$ 212,058,833$ 477,762,831$ 11,660,506$ 2.5 %
Expenditures and Transfers
Instruction 126,169,173$ 150,001,704$ 276,170,876$ 145,070,751 130,540,000$ 275,610,751$ 138,570,757$ 130,540,000$ 269,110,757$ (6,499,994)$ (2.4) %
Research 7,185,683 42,566,893 49,752,577 12,851,852 45,609,703 58,461,555 7,653,398 45,609,703 53,263,101 (5,198,454) (8.9) %
Public Service 25,577 11,992,410 12,017,987 71,100 9,506,300 9,577,400 70,276 11,806,300 11,876,576 2,299,176 24.0 %
Academic Support 42,692,206 24,773,631 67,465,837 51,154,807 17,601,100 68,755,907 42,655,010 18,601,100 61,256,110 (7,499,797) (10.9) %
Student Services 6,314,922 2,927 6,317,849 6,574,843 (2,000) 6,572,843 6,244,485 (2,000) 6,242,485 (330,358) (5.0) %
Institutional Support 24,373,093 881,607 25,254,700 28,183,824 716,600 28,900,424 23,817,362 716,600 24,533,962 (4,366,462) (15.1) %
Operation & Maintenance of Plant 32,872,246 32,872,246 26,774,642 26,774,642 27,052,230 27,052,230 277,588 1.0 %
Scholarships & Fellowships 9,032,008 3,294,070 12,326,079 8,906,637 4,700,000 13,606,637 8,923,087 4,700,000 13,623,087 16,450 0.1 %
Subtotal Expenditures 248,664,908$ 233,513,242$ 482,178,150$ 279,588,456$ 208,671,703$ 488,260,159$ 254,986,605$ 211,971,703$ 466,958,308$ (21,301,851)$ (4.4) %
Mandatory Transfers 4,077,472 4,077,472 6,022,718 6,022,718 6,206,893 6,206,893 184,175 3.1 %
Non-Mandatory Transfers (1,753,146) (1,753,146) 4,151,800 4,151,800 4,510,500 4,510,500 358,700 8.6 %
Total Expenditures & Transfers 250,989,234$ 233,513,242$ 484,502,476$ 289,762,974$ 208,671,703$ 498,434,677$ 265,703,998$ 211,971,703$ 477,675,701$ (20,758,976)$ (4.2) %
Fund Balance Addition / (Reduction) (5,098,337)$ 4,604,860$ (493,477)$ (32,442,920)$ 110,568$ (32,332,352)$ -$ 87,130$ 87,130$
AUXILIARIES
Revenues 1,401,760$ 1,401,760$ 1,711,178$ 1,711,178$ 1,731,222$ 1,731,222$ 20,044$ 1.2 %
Expenditures and Transfers
Expenditures 1,038,289$ 1,038,289$ 1,524,276$ 1,524,276$ 1,360,722$ 1,360,722$ (163,554)$ (10.7) %
Mandatory Transfers 368,674 368,674 367,902 367,902 370,500 370,500 2,598 0.7 %
Non-Mandatory Transfers 11,431 11,431 (181,000) (181,000) 181,000 100.0 %
Total Expenditures & Transfers 1,418,394$ 1,418,394$ 1,711,178$ 1,711,178$ 1,731,222$ 1,731,222$ 20,044$ 1.2 %
Fund Balance Addition / (Reduction) (16,634)$ (16,634)$
TOTALS
Revenues 247,292,657$ 238,118,101$ 485,410,758$ 259,031,232$ 208,782,271$ 467,813,503$ 267,435,220$ 212,058,833$ 479,494,053$ 11,680,550$ 2.5 %
Expenditures and Transfers
Expenditures 249,703,197$ 233,513,242$ 483,216,439$ 281,112,732$ 208,671,703$ 489,784,435$ 256,347,327$ 211,971,703$ 468,319,030$ (21,465,405)$ (4.4) %
Mandatory Transfers 4,446,146 4,446,146 6,390,620 6,390,620 6,577,393 6,577,393 186,773 2.9 %
Non-Mandatory Transfers (1,741,715) (1,741,715) 3,970,800 3,970,800 4,510,500 4,510,500 539,700 13.6 %
Total Expenditures & Transfers 252,407,628$ 233,513,242$ 485,920,870$ 291,474,152$ 208,671,703$ 500,145,855$ 267,435,220$ 211,971,703$ 479,406,923$ (20,738,932)$ (4.1) %
Fund Balance Addition / (Reduction) (5,114,971)$ 4,604,860$ (510,112)$ (32,442,920)$ 110,568$ (32,332,352)$ 87,130$ 87,130$
Amount
Health Science CenterFY 2017 Proposed Budget Summary
Unrestricted and Restricted Current Funds Revenues, Expenditures and Transfers
FY 2015 Actual FY 2016 Probable FY 2017 ProposedChange
Probable to Proposed
Schedule 10 - HSC TotalD-54

FY 2013 FY 2014 FY 2015 FY 2016 FY 2017ACTUAL ACTUAL ACTUAL PROBABLE PROPOSED AMOUNT
EDUCATIONAL AND GENERALRevenues
Tuition & Fees 72,145,924$ 76,610,797$ 78,753,143$ 81,951,644$ 84,640,459$ 12,494,535$ 17.3 %State Appropriations 125,110,686 135,249,071 136,192,559 141,675,464 146,975,526 21,864,840 17.5 %Grants & Contracts 201,016,559 201,991,166 227,026,501 201,401,027 204,794,745 3,778,186 1.9 %Sales & Service 19,788,611 20,327,689 19,678,231 20,007,554 20,204,135 415,524 2.1 %Other Sources 54,399,861 20,073,589 22,358,564 21,066,636 21,147,966 (33,251,895) (61.1) %
Total Revenues 472,461,641$ 454,252,311$ 484,008,998$ 466,102,325$ 477,762,831$ 5,301,190$ 1.1 %
Expenditures and TransfersInstruction 248,761,833$ 256,184,046$ 276,170,876$ 275,610,751$ 269,110,757$ 20,348,924$ 8.2 %Research 53,589,987 51,036,300 49,752,577 58,461,555 53,263,101 (326,886) (0.6) %Public Service 9,508,305 10,015,737 12,017,987 9,577,400 11,876,576 2,368,271 24.9 %Academic Support 51,451,745 60,623,474 67,465,837 68,755,907 61,256,110 9,804,365 19.1 %Student Services 5,287,888 5,815,290 6,317,849 6,572,843 6,242,485 954,597 18.1 %Institutional Support 20,276,447 24,256,531 25,254,700 28,900,424 24,533,962 4,257,515 21.0 %Operation & Maintenance of Plant 28,560,685 29,040,803 32,872,246 26,774,642 27,052,230 (1,508,455) (5.3) %Scholarships & Fellowships 13,353,062 12,744,674 12,326,079 13,606,637 13,623,087 270,025 2.0 %
Subtotal Expenditures 430,789,952$ 449,716,855$ 482,178,150$ 488,260,159$ 466,958,308$ 36,168,356$ 8.4 %Mandatory Transfers 2,620,096 3,021,421 4,077,472 6,022,718 6,206,893 3,586,797 136.9 %Non-Mandatory Transfers 7,531,633 7,342,031 (1,753,146) 4,151,800 4,510,500 (3,021,133) (40.1) %
Total Expenditures & Transfers 440,941,681$ 460,080,307$ 484,502,476$ 498,434,677$ 477,675,701$ 36,734,020$ 8.3 %Fund Balance Addition/(Reduction) 31,519,961$ (5,827,996)$ (493,477)$ (32,332,352)$ 87,130$
AUXILIARIESRevenues 2,247,338$ 1,550,222$ 1,401,760$ 1,711,178$ 1,731,222$ (516,116)$ (23.0) %Expenditures and Transfers
Expenditures 2,528,031$ 1,280,773$ 1,038,289$ 1,524,276$ 1,360,722$ (1,167,309)$ (46.2) %Mandatory Transfers 219,536 377,496 368,674 367,902 370,500 150,964 68.8 %Non-Mandatory Transfers (500,099) (84,215) 11,431 (181,000) 500,099 100.0 %
Total Expenditures & Transfers 2,247,468$ 1,574,054$ 1,418,394$ 1,711,178$ 1,731,222$ (516,246)$ (23.0) %Fund Balance Addition/(Reduction) (130)$ (23,831)$ (16,634)$
TOTALSRevenues 474,708,979$ 455,802,534$ 485,410,758$ 467,813,503$ 479,494,053$ 4,785,074$ 1.0 %Expenditures and Transfers
Expenditures 433,317,983$ 450,997,628$ 483,216,439$ 489,784,435$ 468,319,030$ 35,001,047$ 8.1 %Mandatory Transfers 2,839,632 3,398,917 4,446,146 6,390,620 6,577,393 3,737,761 131.6 %Non-Mandatory Transfers 7,031,534 7,257,816 (1,741,715) 3,970,800 4,510,500 (2,521,034) (35.9) %
Total Expenditures & Transfers 443,189,149$ 461,654,361$ 485,920,870$ 500,145,855$ 479,406,923$ 36,217,774$ 8.2 %Fund Balance Addition/(Reduction) 31,519,831$ (5,851,827)$ (510,112)$ (32,332,352)$ 87,130$
Health Science CenterFive Year FY17 Proposed Budget Summary Comparison
Current Funds Revenues, Expenditures and Transfers - UNRESTRICTED AND RESTRICTED
FY 2013 TO FY 2017%
CHANGE
Schedule 9 - HSC TOTALD-55

Institute of Agriculture TotalFY 2017 Proposed Budget Summary
Unrestricted Current Funds Revenues, Expenditures, and Transfers
CHANGEFY 2015 FY 2016 FY 2017 PROBABLE TO PROPOSED
ACTUALS PROBABLE PROPOSED AMOUNT %EDUCATIONAL AND GENERALRevenues
Tuition & Fees 11,503,126$ 11,465,726$ 12,385,308$ 919,582$ 8.0 %State Appropriations 73,768,007 76,809,564 80,032,064 3,222,500 4.2 %Grants & Contracts 4,393,533 4,023,071 4,018,071 (5,000) (0.1) %Sales & Service 23,515,434 23,005,258 23,574,553 569,295 2.5 %Other Sources 19,762,802 16,350,710 16,328,486 (22,224) (0.1) %
Total Revenues 132,942,901$ 131,654,329$ 136,338,482$ 4,684,153$ 3.6 %
Expenditures and TransfersInstruction 28,552,824$ 34,554,702$ 34,966,411$ 411,709$ 1.2 %Research 38,899,428 46,717,493 39,171,799 (7,545,694) (16.2) %Public Service 40,853,462 54,093,834 47,393,012 (6,700,822) (12.4) %Academic Support 8,126,846 8,247,558 7,916,520 (331,038) (4.0) %Student ServicesInstitutional Support 2,330,160 2,664,536 2,599,599 (64,937) (2.4) %Operation & Maintenance of Plant 3,430,670 3,189,353 3,238,095 48,742 1.5 %Scholarships & Fellowships 13,481 59,455 39,455 (20,000) (33.6) %
Subtotal Expenditures 122,206,870$ 149,526,931$ 135,324,891$ (14,202,040)$ (9.5) %Mandatory Transfers 437,348 Non-Mandatory Transfers 8,475,325 (8,227,354) 1,644,200 9,871,554 120.0 %
Total Expenditures & Transfers 131,119,543$ 141,299,577$ 136,969,091$ (4,330,486)$ (3.1) %Fund Balance Addition/(Reduction) 1,823,359$ (9,645,248)$ (630,609)$
Schedule 15 - UT AG TOTALD-56

FY 2013 FY 2014 FY 2015 FY 2016 FY 2017ACTUAL ACTUAL ACTUAL PROBABLE PROPOSED AMOUNT
EDUCATIONAL AND GENERALRevenues
Tuition & Fees 11,947,683$ 11,360,199$ 11,503,126$ 11,465,726$ 12,385,308$ 437,625$ 3.7 %State Appropriations 69,781,361 73,363,607 73,768,007 76,809,564 80,032,064 10,250,703 14.7 %Grants & Contracts 4,836,798 4,219,672 4,393,533 4,023,071 4,018,071 (818,727) (16.9) %Sales & Service 20,139,556 21,022,516 23,515,434 23,005,258 23,574,553 3,434,997 17.1 %Other Sources 15,855,733 15,228,531 19,762,802 16,350,710 16,328,486 472,753 3.0 %
Total Revenues 122,561,132$ 125,194,525$ 132,942,901$ 131,654,329$ 136,338,482$ 13,777,350$ 11.2 %
Expenditures and TransfersInstruction 25,741,872$ 28,095,485$ 28,552,824$ 34,554,702$ 34,966,411$ 9,224,539$ 35.8 %Research 38,407,900 39,973,390 38,899,428 46,717,493 39,171,799 763,899 2.0 %Public Service 39,080,945 40,397,891 40,853,462 54,093,834 47,393,012 8,312,067 21.3 %Academic Support 8,581,426 7,640,957 8,126,846 8,247,558 7,916,520 (664,906) (7.7) %Student ServicesInstitutional Support 2,307,312 2,357,349 2,330,160 2,664,536 2,599,599 292,287 12.7 %Operation & Maintenance of Plant 3,220,475 3,349,835 3,430,670 3,189,353 3,238,095 17,620 0.5 %Scholarships & Fellowships 74,921 44,595 13,481 59,455 39,455 (35,466) (47.3) %
Subtotal Expenditures 117,414,850$ 121,859,502$ 122,206,870$ 149,526,931$ 135,324,891$ 17,910,041$ 15.3 %Mandatory Transfers 315,421 437,348Non-Mandatory Transfers 2,158,333 8,483,847 8,475,325 (8,227,354) 1,644,200 (514,133) (23.8) %
Total Expenditures & Transfers 119,573,183$ 130,658,770$ 131,119,543$ 141,299,577$ 136,969,091$ 17,395,908$ 14.5 %Fund Balance Addition/(Reduction) 2,987,949$ (5,464,245)$ 1,823,359$ (9,645,248)$ (630,609)$
Institute of Agriculture TotalFive Year FY17 Proposed Budget Summary Comparison
Current Funds Revenues, Expenditures and Transfers - UNRESTRICTED
FY 2013 TO FY 2017%
CHANGE
Schedule 8 - AG TOTALD-57

Institute of AgricultureUnrestricted Net Assets
EXPERIMENT STATION UT EXTENSION
VETERINARY MEDICINE
TOTAL
Net Assets - June 30, 2014 1,944,387$ 8,705,815$ 6,700,410$ 17,350,612$
Percent Unallocated of Expend. & Transfers * 2.99% 3.10% 3.56% 3.22%
FY 2014-15 ACTUALRevenue 40,062,680$ 49,113,214$ 43,767,008$ 132,942,902$ Less:
Expenditures 38,882,437$ 42,181,073$ 41,143,360$ 122,206,870$ Mandatory Transfers 437,348 437,348 Non-Mandatory Transfers 1,056,534 3,999,558 3,419,233 8,475,325
Total Expenditures & Transfers 39,938,971$ 46,180,631$ 44,999,941$ 131,119,543$ Net Change 123,709$ 2,932,583$ (1,232,933)$ 1,823,359$ Unrestricted Net Assets
Working Capital-Accounts Receivable 18,965$ 700,979$ 719,944$ Working Capital-Petty CashWorking Capital-Inventories 341,260 341,260 Revolving FundsEncumbrances 650,612$ 90,913 146,450 887,975 Unexpended GiftsReappropriations 9,750,000 2,498,843 12,248,843 Unallocated 1,417,485 1,778,519 1,779,945 4,975,949
Net Assets - June 30, 2015 2,068,096$ 11,638,398$ 5,467,477$ 19,173,971$ Percent Unallocated of Expend. & Transfers * 3.55% 3.85% 3.96% 3.79%
FY 2015-16 PROBABLE BUDGETRevenue 38,968,010$ 47,799,163$ 44,887,156$ 131,654,329$ Less:
Expenditures 46,108,420$ 56,210,788$ 47,207,723$ 149,526,931$ Mandatory Transfers Non-Mandatory Transfers (7,157,888) 879,112 (1,948,578) (8,227,354)
Total Expenditures & Transfers 38,950,532$ 57,089,900$ 45,259,145$ 141,299,577$ Net Change 17,478$ (9,290,737)$ (371,989)$ (9,645,248)$ Unrestricted Net Assets
Working Capital-Accounts Receivable 18,965$ 700,979$ 719,944$ Working Capital-Petty CashWorking Capital-Inventories 341,260 341,260 Revolving FundsEncumbrances 650,612 90,913 146,450 887,975 Unexpended GiftsReappropriations 2,498,843 2,498,843 Unallocated 1,434,962 2,237,783$ 1,407,956 5,080,701
Estimated Net Assets - June 30, 2016 2,085,574$ 2,347,661$ 5,095,488$ 9,528,723$ Percent Unallocated of Expend. & Transfers * 3.68% 3.92% 3.11% 3.60%
FY 2016-17 PROPOSED BUDGET
Revenue 40,071,186$ 49,263,374$ 47,003,922$ 136,338,482$ Less:
Expenditures 39,493,586$ 48,987,709$ 46,843,596$ 135,324,891$ Mandatory Transfers Non-Mandatory Transfers 577,600 619,800 446,800 1,644,200
Total Expenditures & Transfers 40,071,186$ 49,607,509$ 47,290,396$ 136,969,091$ Net Change -$ (344,135)$ (286,474)$ (630,609)$ Unrestricted Net Assets
Working Capital-Accounts Receivable 18,965$ 700,979$ 719,944$ Working Capital-Petty CashWorking Capital-Inventories 341,260 341,260 Revolving FundsEncumbrances 650,612 90,913 146,450 887,975 Unexpended GiftsReappropriations 1,713,526 1,713,526 Unallocated 1,434,962 1,893,648$ 1,906,799 5,235,409
Estimated Net Assets - June 30, 2017 2,085,574$ 2,003,526$ 4,809,014$ 8,898,114$ Percent Unallocated of Expend. & Transfers * 3.58% 3.82% 4.03% 3.82%
* Recommended percent for unallocated expenditures is 2% to 5% for E&G and 3% to 5% for auxiliaries.
Net Assets ‐ Inst of AgricultureD-58

FY 2015 FY 2016 FY 2017ACTUAL PROBABLE PROPOSED AMOUNT
EDUCATIONAL AND GENERAL
Salaries and Benefits
Salaries
Academic 26,109,967$ 28,715,801$ 30,035,975$ 1,320,174$ 4.6 %
Non-Academic 39,700,498 42,396,378 44,202,348 1,805,970 4.3 %
Students 591,422 427,567 465,989 38,422 9.0 %
Total Salaries 66,401,888$ 71,539,746$ 74,704,312$ 3,164,566$ 4.4 %
Staff Benefits 26,166,376 27,403,146 27,901,923 498,777 1.8 %
Total Salaries and Benefits 92,568,263$ 98,942,892$ 102,606,235$ 3,663,343$ 3.7 %
Operating 28,055,289 49,561,352 32,361,877 (17,199,475) (34.7) %
Equipment and Capital Outlay 1,583,318 1,022,687 356,779 (665,908) (65.1) %
Total Expenditures 122,206,870$ 149,526,931$ 135,324,891$ (14,202,040)$ (9.5) %
%
CHANGE
FY 2017 Proposed Budget Summary - Natural ClassificationsUnrestricted Current Funds Expenditures
Institute of Agriculture Total
PROBABLE TO PROPOSED
Schedule 12 ‐ AG TOTALD-59

Unrestricted Restricted Total Unrestricted Restricted Total Unrestricted Restricted Total Amount
EDUCATION AND GENERALRevenues
Tuition & Fees 11,503,126$ 11,503,126$ 11,465,726$ 11,465,726$ 12,385,308$ 12,385,308$ 919,582$ 8.0 %
State Appropriations 73,768,007 764,974$ 74,532,981 76,809,564 500,321$ 77,309,885 80,032,064 492,228$ 80,524,292 3,214,407 4.2 %
Grants & Contracts 4,393,533 37,657,524 42,051,057 4,023,071 39,766,680 43,789,751 4,018,071 39,766,680 43,784,751 (5,000) - %
Sales & Service 23,515,434 23,515,434 23,005,258 23,005,258 23,574,553 23,574,553 569,295 2.5 %
Other Sources 19,762,802 5,426,985 25,189,787 16,350,710 5,002,954 21,353,664 16,328,486 5,002,954 21,331,440 (22,224) (0.1) %
Total Revenues 132,942,901$ 43,849,483$ 176,792,385$ 131,654,329$ 45,269,955$ 176,924,284$ 136,338,482$ 45,261,862$ 181,600,344$ 4,676,060$ 2.6 %
Expenditures and Transfers
Instruction 28,552,824$ 1,553,755$ 30,106,578$ 34,554,702 1,575,589$ 36,130,291$ 34,966,411$ 1,575,589$ 36,542,000$ 411,709$ 1.1 %
Research 38,899,428 21,568,316 60,467,743 46,717,493 23,086,735 69,804,228 39,171,799 23,078,642 62,250,441 (7,553,787) (10.8) %
Public Service 40,853,462 20,095,662 60,949,124 54,093,834 19,984,728 74,078,562 47,393,012 19,984,728 67,377,740 (6,700,822) (9.0) %
Academic Support 8,126,846 156,436 8,283,282 8,247,558 104,155 8,351,713 7,916,520 104,155 8,020,675 (331,038) (4.0) %
Student Services
Institutional Support 2,330,160 62,846 2,393,006 2,664,536 104,298 2,768,834 2,599,599 104,298 2,703,897 (64,937) (2.3) %
Operation & Maintenance of Plant 3,430,670 13,805 3,444,475 3,189,353 14,000 3,203,353 3,238,095 14,000 3,252,095 48,742 1.5 %
Scholarships & Fellowships 13,481 323,844 337,325 59,455 400,450 459,905 39,455 400,450 439,905 (20,000) (4.3) %
Subtotal Expenditures 122,206,870$ 43,774,663$ 165,981,533$ 149,526,931$ 45,269,955$ 194,796,886$ 135,324,891$ 45,261,862$ 180,586,753$ (14,210,133)$ (7.3) %
Mandatory Transfers 437,348 437,348
Non-Mandatory Transfers 8,475,325 8,475,325 (8,227,354) (8,227,354) 1,644,200 1,644,200 9,871,554 120.0 %
Total Expenditures & Transfers 131,119,543$ 43,774,663$ 174,894,206$ 141,299,577$ 45,269,955$ 186,569,532$ 136,969,091$ 45,261,862$ 182,230,953$ (4,338,579)$ (2.3) %
Fund Balance Addition / (Reduction) 1,823,359$ 74,820$ 1,898,178$ (9,645,248)$ (9,645,248)$ (630,609)$ (630,609)$
Institute of AgricultureFY 2017 Proposed Budget Summary
Unrestricted and Restricted Current Funds Revenues, Expenditures and Transfers
%Probable to Proposed
ChangeFY 2015 Actual FY 2016 Probable FY 2017 Proposed
Schedule 10 - AG TotalD-60

FY 2013 FY 2014 FY 2015 FY 2016 FY 2017ACTUAL ACTUAL ACTUAL PROBABLE PROPOSED AMOUNT
EDUCATIONAL AND GENERALRevenues
Tuition & Fees 11,947,683$ 11,360,199$ 11,503,126$ 11,465,726$ 12,385,308$ 437,625$ 3.7 %State Appropriations 70,824,981 74,267,959 74,532,981 77,309,885 80,524,292 9,699,311 13.7 %Grants & Contracts 43,524,768 40,282,864 42,051,057 43,789,751 43,784,751 259,983 0.6 %Sales & Service 20,139,556 21,022,516 23,515,434 23,005,258 23,574,553 3,434,997 17.1 %Other Sources 20,218,650 19,794,861 25,189,787 21,353,664 21,331,440 1,112,790 5.5 %
Total Revenues 166,655,638$ 166,728,399$ 176,792,385$ 176,924,284$ 181,600,344$ 14,944,706$ 9.0 %
Expenditures and TransfersInstruction 28,146,717$ 29,727,037$ 30,106,578$ 36,130,291$ 36,542,000$ 8,395,283$ 29.8 %Research 61,085,342 60,796,892 60,467,743 69,804,228 62,250,441 1,165,099 1.9 %Public Service 58,043,102 58,910,123 60,949,124 74,078,562 67,377,740 9,334,638 16.1 %Academic Support 8,679,308 7,770,653 8,283,282 8,351,713 8,020,675 (658,633) (7.6) %Student ServicesInstitutional Support 2,455,744 2,431,215 2,393,006 2,768,834 2,703,897 248,153 10.1 %Operation & Maintenance of Plant 3,223,273 3,367,011 3,444,475 3,203,353 3,252,095 28,822 0.9 %Scholarships & Fellowships 258,035 345,389 337,325 459,905 439,905 181,870 70.5 %
Subtotal Expenditures 161,891,521$ 163,348,320$ 165,981,533$ 194,796,886$ 180,586,753$ 18,695,232$ 11.5 %Mandatory Transfers 315,421 437,348Non-Mandatory Transfers 2,158,333 8,483,847 8,475,325 (8,227,354) 1,644,200 (514,133) (23.8) %
Total Expenditures & Transfers 164,049,854$ 172,147,588$ 174,894,206$ 186,569,532$ 182,230,953$ 18,181,099$ 11.1 %Fund Balance Addition/(Reduction) 2,605,784$ (5,419,189)$ 1,898,178$ (9,645,248)$ (630,609)$
Institute of Agriculture TotalFive Year FY17 Proposed Budget Summary Comparison
Current Funds Revenues, Expenditures and Transfers - UNRESTRICTED AND RESTRICTED
FY 2013 TO FY 2017%
CHANGE
Schedule 9 - AG TOTALD-61

Agricultural Experiment StationFY 2017 Proposed Budget Summary
Unrestricted Current Funds Revenues, Expenditures, and Transfers
CHANGEFY 2015 FY 2016 FY 2017 PROBABLE TO PROPOSED
ACTUALS PROBABLE PROPOSED AMOUNT %EDUCATIONAL AND GENERALRevenues
Tuition & FeesState Appropriations 25,698,486$ 26,669,788$ 27,697,588$ 1,027,800$ 3.9 %
Grants & Contracts 2,699,009 2,343,384 2,343,384 Sales & Service 4,908,965 3,151,368 3,227,443 76,075 2.4 %
Other Sources 6,756,220 6,803,470 6,802,771 (699) 0.0 %Total Revenues 40,062,680$ 38,968,010$ 40,071,186$ 1,103,176$ 2.8 %
Expenditures and TransfersInstructionResearch 35,790,080 42,786,422$ 36,229,794$ (6,556,628)$ (15.3) %Public Service 58,453 Academic Support 1,677,959 1,696,410 1,701,637 5,227 0.3 %
Student ServicesInstitutional Support 920,143 1,149,904 1,119,012 (30,892) (2.7) %Operation & Maintenance of Plant 435,803 475,684 443,143 (32,541) (6.8) %Scholarships & Fellowships
Subtotal Expenditures 38,882,437$ 46,108,420$ 39,493,586$ (6,614,834)$ (14.3) %Mandatory TransfersNon-Mandatory Transfers 1,056,534 (7,157,888) 577,600 7,735,488 108.1 %
Total Expenditures & Transfers 39,938,971$ 38,950,532$ 40,071,186$ 1,120,654$ 2.9 %
Fund Balance Addition/(Reduction) 123,710$ 17,478$
Schedule 15 - AG EXPERD-62

FY 2013 FY 2014 FY 2015 FY 2016 FY 2017ACTUAL ACTUAL ACTUAL PROBABLE PROPOSED AMOUNT
EDUCATIONAL AND GENERALRevenues
Tuition & FeesState Appropriations 24,480,573$ 25,579,486$ 25,698,486$ 26,669,788$ 27,697,588$ 3,217,015$ 13.1 %Grants & Contracts 2,942,751 2,757,315 2,699,009 2,343,384 2,343,384 (599,367) (20.4) %Sales & Service 4,231,830 4,200,506 4,908,965 3,151,368 3,227,443 (1,004,387) (23.7) %Other Sources 10,704,293 6,342,787 6,756,220 6,803,470 6,802,771 (3,901,522) (36.4) %
Total Revenues 42,359,447$ 38,880,094$ 40,062,680$ 38,968,010$ 40,071,186$ (2,288,261)$ (5.4) %
Expenditures and TransfersInstruction 511$ (511)$ (511)$ (100.0)Research 34,694,962$ 36,401,138$ 35,790,080 42,786,422 36,229,794$ 1,534,832$ 4.4 %Public Service 29,976 58,453 (29,976) (100.0)Academic Support 1,492,175 1,569,602 1,677,959 1,696,410 1,701,637 209,462 14.0 %Student ServicesInstitutional Support 918,286 941,677 920,143 1,149,904 1,119,012 200,726 21.9 %Operation & Maintenance of Plant 446,965 431,030 435,803 475,684 443,143 (3,822) (0.9) %Scholarships & Fellowships
Subtotal Expenditures 37,582,876$ 39,342,935$ 38,882,437$ 46,108,420$ 39,493,586$ 1,910,710$ 5.1 %Mandatory TransfersNon-Mandatory Transfers 70,530 3,986,050 1,056,534 (7,157,888) 577,600 507,070 718.9 %
Total Expenditures & Transfers 37,653,406$ 43,328,985$ 39,938,971$ 38,950,532$ 40,071,186$ 2,417,780$ 6.4 %Fund Balance Addition/(Reduction) 4,706,042$ (4,448,891)$ 123,710$ 17,478$
Agricultural Experiment StationFive Year FY17 Proposed Budget Summary Comparison
Current Funds Revenues, Expenditures and Transfers - UNRESTRICTED
FY 2013 TO FY 2017%
CHANGE
Schedule 8 - AG EXPERD-63
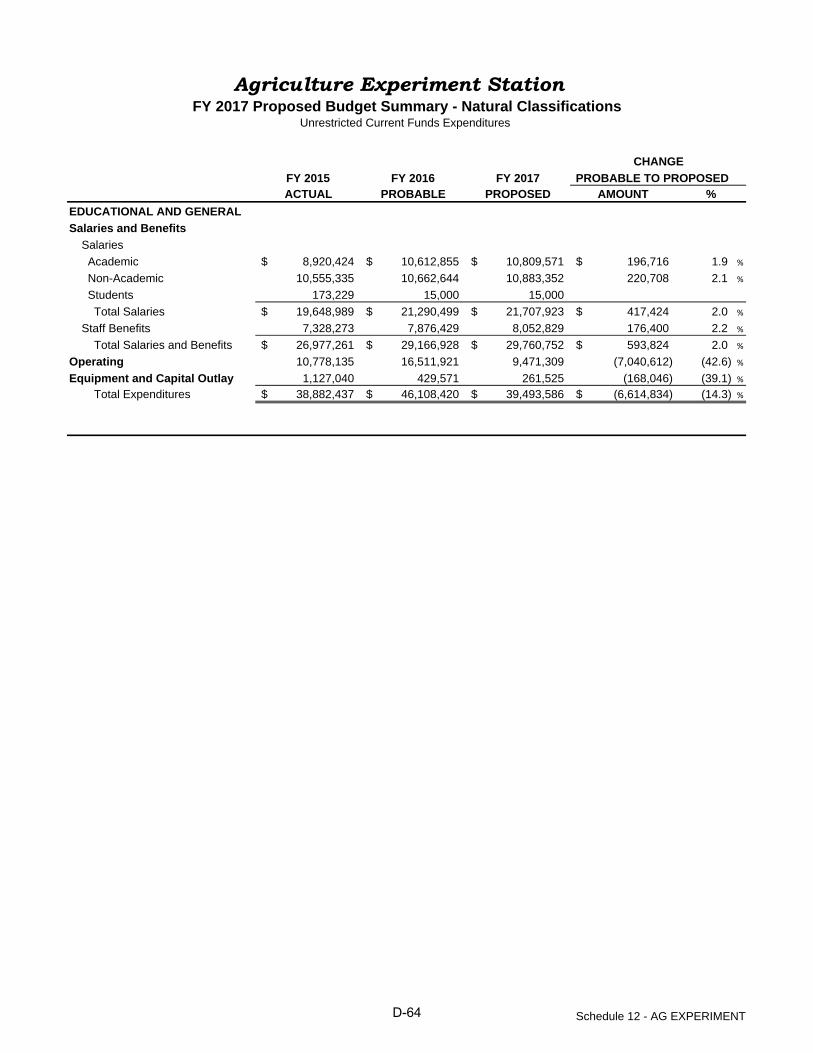
FY 2015 FY 2016 FY 2017ACTUAL PROBABLE PROPOSED AMOUNT
EDUCATIONAL AND GENERAL
Salaries and Benefits
Salaries
Academic 8,920,424$ 10,612,855$ 10,809,571$ 196,716$ 1.9 %
Non-Academic 10,555,335 10,662,644 10,883,352 220,708 2.1 %
Students 173,229 15,000 15,000
Total Salaries 19,648,989$ 21,290,499$ 21,707,923$ 417,424$ 2.0 %
Staff Benefits 7,328,273 7,876,429 8,052,829 176,400 2.2 %
Total Salaries and Benefits 26,977,261$ 29,166,928$ 29,760,752$ 593,824$ 2.0 %
Operating 10,778,135 16,511,921 9,471,309 (7,040,612) (42.6) %
Equipment and Capital Outlay 1,127,040 429,571 261,525 (168,046) (39.1) %
Total Expenditures 38,882,437$ 46,108,420$ 39,493,586$ (6,614,834)$ (14.3) %
%
CHANGE
FY 2017 Proposed Budget Summary - Natural ClassificationsUnrestricted Current Funds Expenditures
Agriculture Experiment Station
PROBABLE TO PROPOSED
Schedule 12 - AG EXPERIMENTD-64

Unrestricted Restricted Total Unrestricted Restricted Total Unrestricted Restricted Total Amount
EDUCATION AND GENERALRevenues
Tuition & Fees
State Appropriations 25,698,486$ 276,571$ 25,975,057$ 26,669,788$ 26,669,788$ 27,697,588$ 27,697,588$ 1,027,800$ 3.9 %
Grants & Contracts 2,699,009 17,190,031 19,889,039 2,343,384 19,200,500$ 21,543,884 2,343,384 19,200,500 21,543,884
Sales & Service 4,908,965 4,908,965 3,151,368 3,151,368 3,227,443 3,227,443 76,075 2.4 %
Other Sources 6,756,220 1,243,150 7,999,371 6,803,470 1,010,000 7,813,470 6,802,771 1,010,000 7,812,771 (699) -
Total Revenues 40,062,680$ 18,709,752$ 58,772,432$ 38,968,010$ 20,210,500$ 59,178,510$ 40,071,186$ 20,210,500$ 60,281,686$ 1,103,176$ 1.9 %
Expenditures and Transfers
Instruction 5,000$ 5,000$ 5,000$ 5,000$
Research 35,790,080 18,586,507 54,376,587 42,786,422$ 20,065,500 62,851,922 36,229,794$ 20,065,500 56,295,294 (6,556,628)$ (10.4) %
Public Service 58,453 22,605 81,057 20,000 20,000 $20,000 20,000
Academic Support 1,677,959 67,019 1,744,978 1,696,410 20,000 1,716,410 1,701,637 $20,000 1,721,637 5,227 0.3 %
Student Services
Institutional Support 920,143 54,389 974,531 1,149,904 100,000 1,249,904 1,119,012 $100,000 1,219,012 (30,892) (2.5) %
Operation & Maintenance of Plant 435,803 435,803 475,684 475,684 443,143 443,143 (32,541) (6.8) %
Scholarships & Fellowships
Subtotal Expenditures 38,882,437$ 18,730,520$ 57,612,956$ 46,108,420$ 20,210,500$ 66,318,920$ 39,493,586$ 20,210,500$ 59,704,086$ (6,614,834)$ (10.0) %
Mandatory Transfers
Non-Mandatory Transfers 1,056,534 1,056,534 (7,157,888) (7,157,888) 577,600 577,600 7,735,488 108.1 %
Total Expenditures & Transfers 39,938,971$ 18,730,520$ 58,669,490$ 38,950,532$ 20,210,500$ 59,161,032$ 40,071,186$ 20,210,500$ 60,281,686$ 1,120,654$ 1.9
Fund Balance Addition / (Reduction) 123,710$ (20,768)$ 102,942$ 17,478$ 17,478$
%
Agricultural Experiment StationFY 2017 Proposed Budget Summary
Unrestricted and Restricted Current Funds Revenues, Expenditures and Transfers
Probable to ProposedFY 2015 Actual FY 2016 Probable FY 2017 ProposedChange
Schedule 10 - AG ExperimentD-65

FY 2013 FY 2014 FY 2015 FY 2016 FY 2017ACTUAL ACTUAL ACTUAL PROBABLE PROPOSED AMOUNT
EDUCATIONAL AND GENERALRevenues
Tuition & FeesState Appropriations 24,781,538$ 25,908,791$ 25,975,057$ 26,669,788$ 27,697,588$ 2,916,050$ 11.8 %Grants & Contracts 21,836,263 19,849,746 19,889,039 21,543,884 21,543,884 (292,379) (1.3) %Sales & Service 4,231,830 4,200,506 4,908,965 3,151,368 3,227,443 (1,004,387) (23.7) %Other Sources 11,710,594 7,241,274 7,999,371 7,813,470 7,812,771 (3,897,823) (33.3) %
Total Revenues 62,560,224$ 57,200,317$ 58,772,432$ 59,178,510$ 60,281,686$ (2,278,538)$ (3.6) %
Expenditures and TransfersInstruction 4,833$ 14,706$ 5,000$ 5,000$ 167$ 3.5 %Research 54,962,036 54,723,543 54,376,587 62,851,922 56,295,294 1,333,258 2.4 %Public Service 98,702 30,890 81,057 20,000 20,000 (78,702) (79.7) %Academic Support 1,514,310 1,607,900 1,744,978 1,716,410 1,721,637 207,327 13.7 %Student ServicesInstitutional Support 1,033,705 997,990 974,531 1,249,904 1,219,012 185,307 17.9 %Operation & Maintenance of Plant 446,965 431,030 435,803 475,684 443,143 (3,822) (0.9) %Scholarships & Fellowships
Subtotal Expenditures 58,060,550$ 57,806,059$ 57,612,956$ 66,318,920$ 59,704,086$ 1,643,536$ 2.8 %Mandatory TransfersNon-Mandatory Transfers 70,530 3,986,050 1,056,534 (7,157,888) 577,600 507,070 718.9 %
Total Expenditures & Transfers 58,131,080$ 61,792,109$ 58,669,490$ 59,161,032$ 60,281,686$ 2,150,606$ 3.7 %Fund Balance Addition/(Reduction) 4,429,144$ (4,591,791)$ 102,942$ 17,478$
Agricultural Experiment StationFive Year FY17 Proposed Budget Summary Comparison
Current Funds Revenues, Expenditures and Transfers - UNRESTRICTED AND RESTRICTED
FY 2013 TO FY 2017%
CHANGE
Schedule 9 - AG EXPERD-66

UT ExtensionFY 2017 Proposed Budget Summary
Unrestricted Current Funds Revenues, Expenditures, and Transfers
CHANGEFY 2015 FY 2016 FY 2017 PROBABLE TO PROPOSED
ACTUALS PROBABLE PROPOSED AMOUNT %EDUCATIONAL AND GENERALRevenues
Tuition & FeesState Appropriations 31,195,267$ 32,406,617$ 33,903,617$ 1,497,000$ 4.6 %Grants & Contracts 756,352 705,000 700,000 (5,000) (0.7) %Sales & Service 4,402,890 5,379,927 5,362,638 (17,289) (0.3) %Other Sources 12,758,705 9,307,619 9,297,119 (10,500) (0.1) %
Total Revenues 49,113,214$ 47,799,163$ 49,263,374$ 1,464,211$ 3.1 %
Expenditures and TransfersInstruction 536,908$ 57,798$ (479,110)$ (89.2) %ResearchPublic Service 40,618,406$ 53,997,357 47,269,168 (6,728,189) (12.5) %Academic Support 822,411 902,131 907,131 5,000 0.6 %Student ServicesInstitutional Support 740,256 774,392 753,612 (20,780) (2.7) %Operation & Maintenance of PlantScholarships & Fellowships
Subtotal Expenditures 42,181,073$ 56,210,788$ 48,987,709$ (7,223,079)$ (12.8) %Mandatory TransfersNon-Mandatory Transfers 3,999,558 879,112 619,800 (259,312) (29.5) %
Total Expenditures & Transfers 46,180,631$ 57,089,900$ 49,607,509$ (7,482,391)$ (13.1) %Fund Balance Addition/(Reduction) 2,932,583$ (9,290,737)$ (344,135)$
Schedule 15 - UT EXTD-67

FY 2013 FY 2014 FY 2015 FY 2016 FY 2017ACTUAL ACTUAL ACTUAL PROBABLE PROPOSED AMOUNT
EDUCATIONAL AND GENERALRevenues
Tuition & FeesState Appropriations 29,580,016$ 30,987,767$ 31,195,267$ 32,406,617$ 33,903,617$ 4,323,601$ 14.6 %Grants & Contracts 556,988 566,134 756,352 705,000 700,000 143,012 25.7 %Sales & Service 4,161,248 4,159,190 4,402,890 5,379,927 5,362,638 1,201,390 28.9 %Other Sources 4,903,715 8,647,450 12,758,705 9,307,619 9,297,119 4,393,404 89.6 %
Total Revenues 39,201,967$ 44,360,541$ 49,113,214$ 47,799,163$ 49,263,374$ 10,061,407$ 25.7 %
Expenditures and TransfersInstruction 536,908$ 57,798$ 57,798$ 100.0 %ResearchPublic Service 38,941,284$ 40,284,313$ 40,618,406$ 53,997,357$ 47,269,168$ 8,327,884$ 21.4 %Academic Support 1,001,865 794,785 822,411 902,131 907,131 (94,734) (9.5) %Student ServicesInstitutional Support 724,511 726,396 740,256 774,392 753,612 29,101 4.0 %Operation & Maintenance of PlantScholarships & Fellowships
Subtotal Expenditures 40,667,660$ 41,805,494$ 42,181,073$ 56,210,788$ 48,987,709$ 8,320,049$ 20.5 %Mandatory TransfersNon-Mandatory Transfers 1,014,769 1,099,094 3,999,558 879,112 619,800 (394,969) (38.9) %
Total Expenditures & Transfers 41,682,429$ 42,904,588$ 46,180,631$ 57,089,900$ 49,607,509$ 7,925,080$ 19.0 %Fund Balance Addition/(Reduction) (2,480,463)$ 1,455,953$ 2,932,583$ (9,290,737)$ (344,135)$
UT ExtensionFive Year FY17 Proposed Budget Summary Comparison
Current Funds Revenues, Expenditures and Transfers - UNRESTRICTED
FY 2013 TO FY 2017%
CHANGE
Schedule 8 - UT EXTENSIOND-68

FY 2015 FY 2016 FY 2017ACTUAL PROBABLE PROPOSED AMOUNT
EDUCATIONAL AND GENERAL
Salaries and Benefits
Salaries
Academic 4,357,128$ 4,362,026$ 4,995,447$ 633,421$ 14.5 %
Non-Academic 18,724,886 20,894,323 21,825,934 931,611 4.5 %
Students 102,188 117,336 169,960 52,624 44.8 %
Total Salaries 23,184,202$ 25,373,685$ 26,991,341$ 1,617,656$ 6.4 %
Staff Benefits 10,811,944 10,825,691 10,825,691
Total Salaries and Benefits 33,996,146$ 36,199,376$ 37,817,032$ 1,617,656$ 4.5 %
Operating 8,083,315 19,970,020 11,170,677 (8,799,343) (44.1) %
Equipment and Capital Outlay 101,612 41,392 (41,392) (100.0) %
Total Expenditures 42,181,073$ 56,210,788$ 48,987,709$ (7,223,079)$ (12.8) %
%
CHANGE
FY 2017 Proposed Budget Summary - Natural ClassificationsUnrestricted Current Funds Expenditures
UT Extension
PROBABLE TO PROPOSED
Schedule 12 - UT EXTENSIOND-69
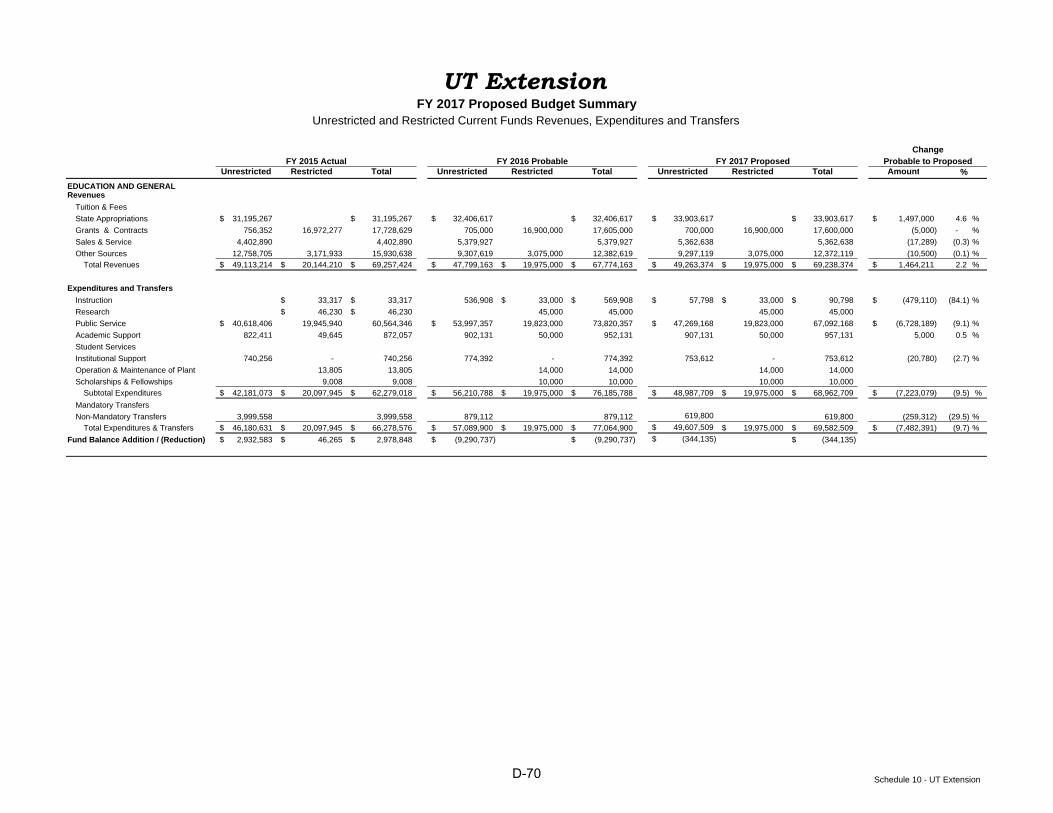
Unrestricted Restricted Total Unrestricted Restricted Total Unrestricted Restricted Total Amount
EDUCATION AND GENERALRevenues
Tuition & Fees
State Appropriations 31,195,267$ 31,195,267$ 32,406,617$ 32,406,617$ 33,903,617$ 33,903,617$ 1,497,000$ 4.6 %
Grants & Contracts 756,352 16,972,277 17,728,629 705,000 16,900,000 17,605,000 700,000 16,900,000 17,600,000 (5,000) - %
Sales & Service 4,402,890 4,402,890 5,379,927 5,379,927 5,362,638 5,362,638 (17,289) (0.3) %
Other Sources 12,758,705 3,171,933 15,930,638 9,307,619 3,075,000 12,382,619 9,297,119 3,075,000 12,372,119 (10,500) (0.1) %
Total Revenues 49,113,214$ 20,144,210$ 69,257,424$ 47,799,163$ 19,975,000$ 67,774,163$ 49,263,374$ 19,975,000$ 69,238,374$ 1,464,211$ 2.2 %
Expenditures and Transfers
Instruction 33,317$ 33,317$ 536,908 33,000$ 569,908$ 57,798$ 33,000$ 90,798$ (479,110)$ (84.1) %
Research 46,230$ 46,230$ 45,000 45,000 45,000 45,000
Public Service 40,618,406$ 19,945,940 60,564,346 53,997,357$ 19,823,000 73,820,357 47,269,168$ 19,823,000 67,092,168 (6,728,189)$ (9.1) %
Academic Support 822,411 49,645 872,057 902,131 50,000 952,131 907,131 50,000 957,131 5,000 0.5 %
Student Services
Institutional Support 740,256 - 740,256 774,392 - 774,392 753,612 - 753,612 (20,780) (2.7) %
Operation & Maintenance of Plant 13,805 13,805 14,000 14,000 14,000 14,000
Scholarships & Fellowships 9,008 9,008 10,000 10,000 10,000 10,000
Subtotal Expenditures 42,181,073$ 20,097,945$ 62,279,018$ 56,210,788$ 19,975,000$ 76,185,788$ 48,987,709$ 19,975,000$ 68,962,709$ (7,223,079)$ (9.5) %
Mandatory Transfers
Non-Mandatory Transfers 3,999,558 3,999,558 879,112 879,112 619,800 619,800 (259,312) (29.5) %
Total Expenditures & Transfers 46,180,631$ 20,097,945$ 66,278,576$ 57,089,900$ 19,975,000$ 77,064,900$ 49,607,509$ 19,975,000$ 69,582,509$ (7,482,391)$ (9.7) %
Fund Balance Addition / (Reduction) 2,932,583$ 46,265$ 2,978,848$ (9,290,737)$ (9,290,737)$ (344,135)$ (344,135)$
UT ExtensionFY 2017 Proposed Budget Summary
Unrestricted and Restricted Current Funds Revenues, Expenditures and Transfers
% Probable to Proposed
ChangeFY 2015 Actual FY 2016 Probable FY 2017 Proposed
Schedule 10 - UT ExtensionD-70

FY 2013 FY 2014 FY 2015 FY 2016 FY 2017ACTUAL ACTUAL ACTUAL PROBABLE PROPOSED AMOUNT
EDUCATIONAL AND GENERALRevenues
Tuition & FeesState Appropriations 29,817,561$ 31,039,493$ 31,195,267$ 32,406,617$ 33,903,617$ 4,086,056$ 13.7 %Grants & Contracts 16,651,539 16,386,992 17,728,629 17,605,000 17,600,000 948,461 5.7 %Sales & Service 4,161,248 4,159,190 4,402,890 5,379,927 5,362,638 1,201,390 28.9 %Other Sources 7,320,115 11,274,330 15,930,638 12,382,619 12,372,119 5,052,004 69.0 %
Total Revenues 57,950,462$ 62,860,006$ 69,257,424$ 67,774,163$ 69,238,374$ 11,287,912$ 19.5 %
Expenditures and TransfersInstruction 8,352$ 33,317$ 569,908$ 90,798$ 82,446$ 987.1 %Research 60,169 47,843 46,230$ 45,000 45,000 (15,169) (25.2) %Public Service 57,615,862 58,489,536 60,564,346 73,820,357 67,092,168 9,476,306 16.4 %Academic Support 1,028,210 839,200 872,057 952,131 957,131 (71,079) (6.9) %Student ServicesInstitutional Support 724,511 726,396 740,256 774,392 753,612 29,101 4.0 %Operation & Maintenance of Plant 2,798 17,176 13,805 14,000 14,000 11,202 400.4 %Scholarships & Fellowships 4,521 4,232 9,008 10,000 10,000 5,480 121.2 %
Subtotal Expenditures 59,444,423$ 60,124,384$ 62,279,018$ 76,185,788$ 68,962,709$ 9,518,286$ 16.0 %Mandatory TransfersNon-Mandatory Transfers 1,014,769 1,099,094 3,999,558 879,112 619,800 (394,969) (38.9) %
Total Expenditures & Transfers 60,459,192$ 61,223,478$ 66,278,576$ 77,064,900$ 69,582,509$ 9,123,317$ 15.1 %Fund Balance Addition/(Reduction) (2,508,730)$ 1,636,528$ 2,978,848$ (9,290,737)$ (344,135)$
UT ExtensionFive Year FY17 Proposed Budget Summary Comparison
Current Funds Revenues, Expenditures and Transfers - UNRESTRICTED AND RESTRICTED
FY 2013 TO FY 2017%
CHANGE
Schedule 9 - UT EXTENSIOND-71

College of Veterinary MedicineFY 2017 Proposed Budget Summary
Unrestricted Current Funds Revenues, Expenditures, and Transfers
CHANGEFY 2015 FY 2016 FY 2017 PROBABLE TO PROPOSED
ACTUALS PROBABLE PROPOSED AMOUNT %EDUCATIONAL AND GENERALRevenues
Tuition & Fees 11,503,126$ 11,465,726$ 12,385,308$ 919,582$ 8.0 %State Appropriations 16,874,254 17,733,159 18,430,859 697,700 3.9 %Grants & Contracts 938,172 974,687 974,687 Sales & Service 14,203,579 14,473,963 14,984,472 510,509 3.5 %Other Sources 247,877 239,621 228,596 (11,025) (4.6) %
Total Revenues 43,767,008$ 44,887,156$ 47,003,922$ 2,116,766$ 4.7 %
Expenditures and TransfersInstruction 28,552,824$ 34,017,794$ 34,908,613$ 890,819$ 2.6 %Research 3,109,348 3,931,071 2,942,005 (989,066) (25.2) %Public Service 176,603 96,477 123,844 27,367 28.4 %Academic Support 5,626,476 5,649,017 5,307,752 (341,265) (6.0) %Student ServicesInstitutional Support 669,762 740,240 726,975 (13,265) (1.8) %Operation & Maintenance of Plant 2,994,867 2,713,669 2,794,952 81,283 3.0 %Scholarships & Fellowships 13,481 59,455 39,455 (20,000) (33.6) %
Subtotal Expenditures 41,143,360$ 47,207,723$ 46,843,596$ (364,127)$ (0.8) %Mandatory Transfers 437,348 Non-Mandatory Transfers 3,419,233 (1,948,578) 446,800 2,395,378 122.9 %
Total Expenditures & Transfers 44,999,941$ 45,259,145$ 47,290,396$ 2,031,251$ 4.5 %Fund Balance Addition/(Reduction) (1,232,934)$ (371,989)$ (286,474)$
Schedule 15 - VET MEDD-72

FY 2013 FY 2014 FY 2015 FY 2016 FY 2017ACTUAL ACTUAL ACTUAL PROBABLE PROPOSED AMOUNT
EDUCATIONAL AND GENERALRevenues
Tuition & Fees 11,947,683$ 11,360,199$ 11,503,126$ 11,465,726$ 12,385,308$ 437,625$ 3.7 %State Appropriations 15,720,772 16,796,354 16,874,254 17,733,159 18,430,859 2,710,087 17.2 %Grants & Contracts 1,337,059 896,223 938,172 974,687 974,687 (362,372) (27.1) %Sales & Service 11,746,479 12,662,820 14,203,579 14,473,963 14,984,472 3,237,993 27.6 %Other Sources 247,725 238,294 247,877 239,621 228,596 (19,129) (7.7) %
Total Revenues 40,999,718$ 41,953,889$ 43,767,008$ 44,887,156$ 47,003,922$ 6,004,204$ 14.6 %
Expenditures and TransfersInstruction 25,741,361$ 28,095,996$ 28,552,824$ 34,017,794$ 34,908,613$ 9,167,252$ 35.6 %Research 3,712,938 3,572,252 3,109,348 3,931,071 2,942,005 (770,933) (20.8) %Public Service 109,685 113,578 176,603 96,477 123,844 14,159 12.9 %Academic Support 6,087,386 5,276,570 5,626,476 5,649,017 5,307,752 (779,634) (12.8) %Student ServicesInstitutional Support 664,515 689,276 669,762 740,240 726,975 62,460 9.4 %Operation & Maintenance of Plant 2,773,510 2,918,805 2,994,867 2,713,669 2,794,952 21,442 0.8 %Scholarships & Fellowships 74,921 44,595 13,481 59,455 39,455 (35,466) (47.3) %
Subtotal Expenditures 39,164,314$ 40,711,072$ 41,143,360$ 47,207,723$ 46,843,596$ 7,679,282$ 19.6 %Mandatory Transfers 315,421 437,348Non-Mandatory Transfers 1,073,034 3,398,703 3,419,233 (1,948,578) 446,800 (626,234) (58.4) %
Total Expenditures & Transfers 40,237,348$ 44,425,196$ 44,999,941$ 45,259,145$ 47,290,396$ 7,053,048$ 17.5 %Fund Balance Addition/(Reduction) 762,370$ (2,471,307)$ (1,232,934)$ (371,989)$ (286,474)$
College of Veterinary MedicineFive Year FY17 Proposed Budget Summary Comparison
Current Funds Revenues, Expenditures and Transfers - UNRESTRICTED
FY 2013 TO FY 2017%
CHANGE
Schedule 8 - VET MEDD-73

FY 2015 FY 2016 FY 2017ACTUAL PROBABLE PROPOSED AMOUNT
EDUCATIONAL AND GENERAL
Salaries and Benefits
Salaries
Academic 12,832,415$ 13,740,920$ 14,230,957$ 490,037$ 3.6 %
Non-Academic 10,420,277 10,839,411 11,493,062 653,651 6.0 %
Students 316,005 295,231 281,029 (14,202) (4.8) %
Total Salaries 23,568,697$ 24,875,562$ 26,005,048$ 1,129,486$ 4.5 %
Staff Benefits 8,026,159 8,701,026 9,023,403 322,377 3.7 %
Total Salaries and Benefits 31,594,856$ 33,576,588$ 35,028,451$ 1,451,863$ 4.3 %
Operating 9,193,839 13,079,411 11,719,891 (1,359,520) (10.4) %
Equipment and Capital Outlay 354,666 551,724 95,254 (456,470) (82.7) %
Total Expenditures 41,143,360$ 47,207,723$ 46,843,596$ (364,127)$ (0.8) %
%
CHANGE
FY 2017 Proposed Budget Summary - Natural ClassificationsUnrestricted Current Funds Expenditures
College of Veterinary Medicine
PROBABLE TO PROPOSED
Schedule 12 - VET MEDD-74

Unrestricted Restricted Total Unrestricted Restricted Total Unrestricted Restricted Total Amount
EDUCATION AND GENERALRevenues
Tuition & Fees 11,503,126$ 11,503,126$ 11,465,726$ 11,465,726$ 12,385,308$ 12,385,308$ 919,582$ 8.0 %
State Appropriations 16,874,254 488,403$ 17,362,657 17,733,159 500,321$ 18,233,480 18,430,859 492,228$ 18,923,087 689,607 3.8 %
Grants & Contracts 938,172 3,495,217 4,433,389 974,687 3,666,180 4,640,867 974,687 3,666,180 4,640,867
Sales & Service 14,203,579 14,203,579 14,473,963 14,473,963 14,984,472 14,984,472 510,509 3.5 %
Other Sources 247,877 1,011,902 1,259,779 239,621 917,954 1,157,575 228,596 917,954 1,146,550 (11,025) (1.0) %
Total Revenues 43,767,008$ 4,995,521$ 48,762,529$ 44,887,156$ 5,084,455$ 49,971,611$ 47,003,922$ 5,076,362$ 52,080,284$ 2,108,673$ 4.2 %
Expenditures and Transfers
Instruction 28,552,824$ 1,520,438$ 30,073,262$ 34,017,794 1,537,589$ 35,555,383$ 34,908,613$ 1,537,589$ 36,446,202$ 890,819$ 2.5 %
Research 3,109,348 2,935,579 6,044,927 3,931,071 2,976,235 6,907,306 2,942,005 2,968,142 5,910,147 (997,159) (14.4) %
Public Service 176,603 127,117 303,720 96,477 141,728 238,205 123,844 141,728 265,572 27,367 11.5 %
Academic Support 5,626,476 39,771 5,666,247 5,649,017 34,155 5,683,172 5,307,752 34,155 5,341,907 (341,265) (6.0) %
Student Services
Institutional Support 669,762 8,457 678,219 740,240 4,298 744,538 726,975 4,298 731,273 (13,265) (1.8) %
Operation & Maintenance of Plant 2,994,867 2,994,867 2,713,669 2,713,669 2,794,952 2,794,952 81,283 3.0 %
Scholarships & Fellowships 13,481 314,836 328,317 59,455 390,450 449,905 39,455 390,450 429,905 (20,000) (4.4) %
Subtotal Expenditures 41,143,360$ 4,946,199$ 46,089,559$ 47,207,723$ 5,084,455$ 52,292,178$ 46,843,596$ 5,076,362$ 51,919,958$ (372,220)$ (0.7) %
Mandatory Transfers 437348 437348
Non-Mandatory Transfers 3,419,233 3,419,233 (1,948,578) (1,948,578) 446,800 446,800 2,395,378 122.9 %
Total Expenditures & Transfers 44,999,941$ 4,946,199$ 49,946,140$ 45,259,145$ 5,084,455$ 50,343,600$ 47,290,396$ 5,076,362$ 52,366,758$ 2,023,158$ 4.0 %
Fund Balance Addition / (Reduction) (1,232,934)$ 49,323$ (1,183,611)$ (371,989)$ (371,989)$ (286,474)$ (286,474)$
College of Veterinary MedicineFY 2017 Proposed Budget Summary
Unrestricted and Restricted Current Funds Revenues, Expenditures and Transfers
% Probable to Proposed
ChangeFY 2015 Actual FY 2016 Probable FY 2017 Proposed
Schedule 10 - Vet MedD-75

FY 2013 FY 2014 FY 2015 FY 2016 FY 2017ACTUAL ACTUAL ACTUAL PROBABLE PROPOSED AMOUNT
EDUCATIONAL AND GENERALRevenues
Tuition & Fees 11,947,683$ 11,360,199$ 11,503,126$ 11,465,726$ 12,385,308$ 437,625$ 3.7 %State Appropriations 16,225,882 17,319,675 17,362,657 18,233,480 18,923,087 2,697,205 16.6 %Grants & Contracts 5,036,967 4,046,126 4,433,389 4,640,867 4,640,867 (396,100) (7.9) %Sales & Service 11,746,479 12,662,820 14,203,579 14,473,963 14,984,472 3,237,993 27.6 %Other Sources 1,187,941 1,279,257 1,259,779 1,157,575 1,146,550 (41,391) (3.5) %
Total Revenues 46,144,952$ 46,668,076$ 48,762,529$ 49,971,611$ 52,080,284$ 5,935,332$ 12.9 %
Expenditures and TransfersInstruction 28,133,532$ 29,712,331$ 30,073,262$ 35,555,383$ 36,446,202$ 8,312,670$ 29.5 %Research 6,063,138 6,025,505 6,044,927 6,907,306 5,910,147 (152,991) (2.5) %Public Service 328,538 389,697 303,720 238,205 265,572 (62,966) (19.2) %Academic Support 6,136,788 5,323,553 5,666,247 5,683,172 5,341,907 (794,881) (13.0) %Student ServicesInstitutional Support 697,528 706,829 678,219 744,538 731,273 33,745 4.8 %Operation & Maintenance of Plant 2,773,510 2,918,805 2,994,867 2,713,669 2,794,952 21,442 0.8 %Scholarships & Fellowships 253,515 341,157 328,317 449,905 429,905 176,390 69.6 %
Subtotal Expenditures 44,386,548$ 45,417,878$ 46,089,559$ 52,292,178$ 51,919,958$ 7,533,410$ 17.0 %Mandatory Transfers 315,421 437,348Non-Mandatory Transfers 1,073,034 3,398,703 3,419,233 (1,948,578) 446,800 (626,234) (58.4) %
Total Expenditures & Transfers 45,459,582$ 49,132,002$ 49,946,140$ 50,343,600$ 52,366,758$ 6,907,176$ 15.2 %Fund Balance Addition/(Reduction) 685,370$ (2,463,926)$ (1,183,611)$ (371,989)$ (286,474)$
College of Veterinary MedicineFive Year FY17 Proposed Budget Summary Comparison
Current Funds Revenues, Expenditures and Transfers - UNRESTRICTED AND RESTRICTED
FY 2013 TO FY 2017%
CHANGE
Schedule 9 - VET MEDD-76

Institute for Public Service TotalFY 2017 Proposed Budget Summary
Unrestricted Current Funds Revenues, Expenditures, and Transfers
CHANGEFY 2015 FY 2016 FY 2017 PROBABLE TO PROPOSED
ACTUALS PROBABLE PROPOSED AMOUNT %EDUCATIONAL AND GENERALRevenues
Tuition & FeesState Appropriations 9,936,524$ 10,342,187$ 11,033,687$ 691,500$ 6.7 %Grants & Contracts 321,566 219,397 184,042 (35,355) (16.1) %Sales & ServiceOther Sources 7,100,662 7,229,853 7,598,916 369,063 5.1 %
Total Revenues 17,358,752$ 17,791,437$ 18,816,645$ 1,025,208$ 5.8 %
Expenditures and TransfersInstructionResearchPublic Service 15,032,667$ 15,422,217$ 17,242,519$ 1,820,302$ 11.8 %Academic Support 262,964 277,673 267,153 (10,520) (3.8) %Student ServicesInstitutional Support 934,964 772,442 935,651 163,209 21.1 %Operation & Maintenance of PlantScholarships & Fellowships
Subtotal Expenditures 16,230,595$ 16,472,332$ 18,445,323$ 1,972,991$ 12.0 %Mandatory TransfersNon-Mandatory Transfers 1,076,037 1,408,526 580,507 (828,019) (58.8) %
Total Expenditures & Transfers 17,306,632$ 17,880,858$ 19,025,830$ 1,144,972$ 6.4 %Fund Balance Addition/(Reduction) 52,120$ (89,421)$ (209,185)$
Schedule 15 - IPS TOTD-77

FY 2013 FY 2014 FY 2015 FY 2016 FY 2017ACTUAL ACTUAL ACTUAL PROBABLE PROPOSED AMOUNT
EDUCATIONAL AND GENERALRevenues
Tuition & FeesState Appropriations 9,447,397$ 9,899,924$ 9,936,524$ 10,342,187$ 11,033,687$ 1,586,290$ 16.8 %Grants & Contracts 313,398 313,085 321,566 219,397 184,042 (129,356) (41.3) %Sales & ServiceOther Sources 6,689,516 7,109,470 7,100,662 7,229,853 7,598,916 909,400 13.6 %
Total Revenues 16,450,311$ 17,322,479$ 17,358,752$ 17,791,437$ 18,816,645$ 2,366,334$ 14.4 %
Expenditures and TransfersInstructionResearchPublic Service 14,595,929$ 14,735,439$ 15,032,667$ 15,422,217$ 17,242,519$ 2,646,590$ 18.1 %Academic Support 282,712 287,979 262,964 277,673 267,153 (15,559) (5.5) %Student ServicesInstitutional Support 1,102,865 1,166,371 934,964 772,442 935,651 (167,214) (15.2) %Operation & Maintenance of PlantScholarships & Fellowships
Subtotal Expenditures 15,981,506$ 16,189,790$ 16,230,595$ 16,472,332$ 18,445,323$ 2,463,817$ 15.4 %Mandatory TransfersNon-Mandatory Transfers 825,218 1,052,539 1,076,037 1,408,526 580,507 (244,711) (29.7) %
Total Expenditures & Transfers 16,806,724$ 17,242,329$ 17,306,632$ 17,880,858$ 19,025,830$ 2,219,106$ 13.2 %Fund Balance Addition/(Reduction) (356,413)$ 80,150$ 52,120$ (89,421)$ (209,185)$
Institute for Public Service TotalFive Year FY17 Proposed Budget Summary Comparison
Current Funds Revenues, Expenditures and Transfers - UNRESTRICTED
FY 2013 TO FY 2017%
CHANGE
Schedule 8 - PUB SVC UNIT TOTALD-78

Institute for Public Service TotalUnrestricted Net Assets
IPS MTAS CTAS TOTALNet Assets - June 30, 2014 497,391$ 389,694$ 286,347$ 1,173,432$
Percent Unallocated of Expend. & Transfers * 3.67% 3.90% 3.88% 3.81%
FY 2014-15 ACTUAL
Revenue 6,189,953$ 6,223,056$ 4,945,743$ 17,358,752$ Less:
Expenditures 5,391,151$ 5,963,827$ 4,875,617$ 16,230,595$ Mandatory TransfersNon-Mandatory Transfers 803,828 254,675 17,534 1,076,037
Total Expenditures & Transfers 6,194,979$ 6,218,502$ 4,893,151$ 17,306,632$ Net Change (5,026)$ 4,554$ 52,592$ 52,120$ Unrestricted Net Assets
Working Capital-Accounts Receivable 60,952$ 6,151$ 67,103$ Working Capital-Petty CashWorking Capital-InventoriesRevolving FundsEncumbrancesUnexpended GiftsReappropriations 150,000 150,000 150,000$ 450,000 Unallocated 281,413 238,097 188,939 708,449
Net Assets - June 30, 2015 492,365$ 394,248$ 338,939$ 1,225,552$
Percent Unallocated of Expend. & Transfers * 4.54% 3.83% 3.86% 4.09%
FY 2015-16 PROBABLE BUDGET
Revenue 6,323,607$ 6,455,862$ 5,011,968$ 17,791,437$ Less:
Expenditures 5,241,659$ 6,287,048$ 4,943,625$ 16,472,332$ Mandatory TransfersNon-Mandatory Transfers 1,188,533 136,721 83,272 1,408,526
Total Expenditures & Transfers 6,430,192$ 6,423,769$ 5,026,897$ 17,880,858$ Net Change (106,585)$ 32,093$ (14,929)$ (89,421)$ Unrestricted Net Assets
Working Capital-Accounts ReceivableWorking Capital-Petty CashWorking Capital-InventoriesRevolving FundsEncumbrancesUnexpended GiftsReappropriations 150,000$ 150,000$ 150,000$ 450,000$ Unallocated 235,779 276,341 174,010 686,130
Estimated Net Assets - June 30, 2016 385,780$ 426,341$ 324,010$ 1,136,131$
Percent Unallocated of Expend. & Transfers * 3.67% 4.30% 3.46% 3.84%
* Recommended percent for unallocated expenditures is 2% to 5% for E&G and 3% to 5% for auxiliaries.
Net Assets ‐ Inst for Public Service
D-79

FY 2015 FY 2016 FY 2017ACTUAL PROBABLE PROPOSED AMOUNT
EDUCATIONAL AND GENERAL
Salaries and Benefits
Salaries
Academic 30,055$ 399,740$ 267,396$ (132,344)$ (33.1) %
Non-Academic 8,718,079 8,769,654 9,645,658 876,004$ 10.0 %
Students 23,571 40,486 25,290 (15,196) (37.5) %
Total Salaries 8,771,705$ 9,209,880$ 9,938,344$ 728,464$ 7.9 %
Staff Benefits 3,076,410 3,102,191 3,372,971 270,780 8.7 %
Total Salaries and Benefits 11,848,115$ 12,312,071$ 13,311,315$ 999,244$ 8.1 %
Operating 4,303,112 4,068,421 5,064,858 996,437 24.5 %
Equipment and Capital Outlay 79,368 91,840 69,150 (22,690) (24.7) %
Total Expenditures 16,230,595$ 16,472,332$ 18,445,323$ 1,972,991$ 12.0 %
%
CHANGE
FY 2017 Proposed Budget Summary - Natural ClassificationsUnrestricted Current Funds Expenditures
Institute for Public Service Total
PROBABLE TO PROPOSED
Schedule 12 - PUBLIC SERVICED-80
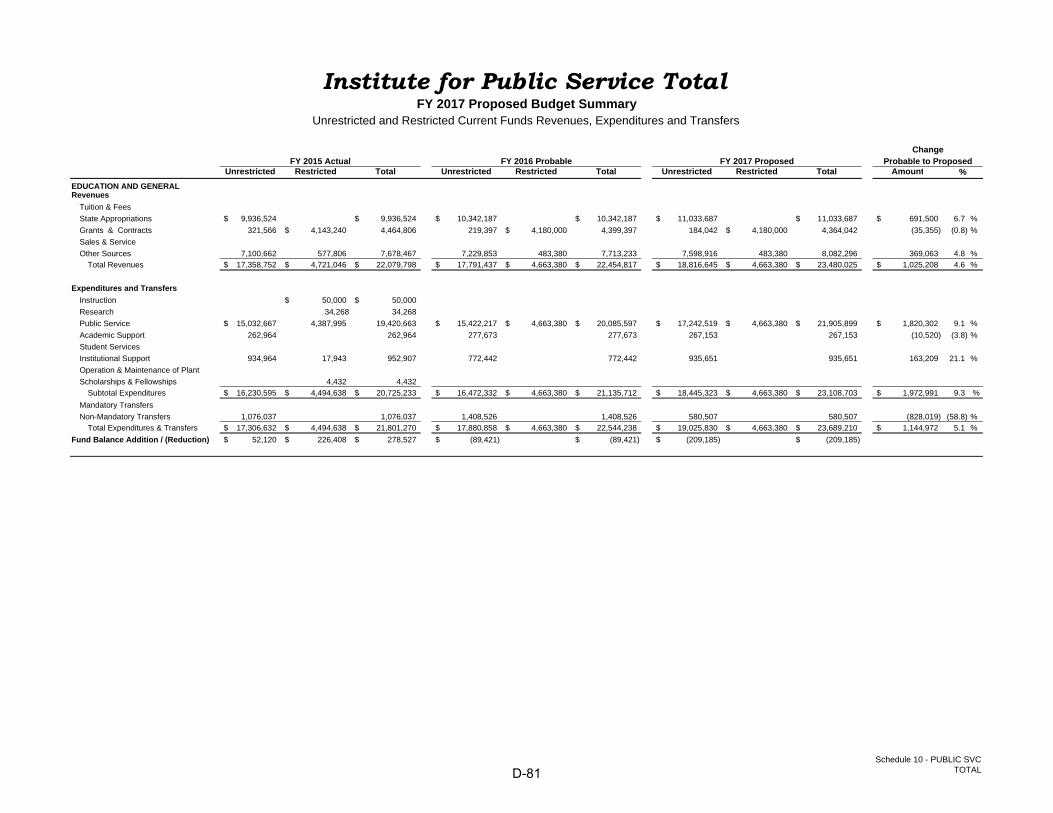
Unrestricted Restricted Total Unrestricted Restricted Total Unrestricted Restricted Total Amount
EDUCATION AND GENERALRevenues
Tuition & Fees
State Appropriations 9,936,524$ 9,936,524$ 10,342,187$ 10,342,187$ 11,033,687$ 11,033,687$ 691,500$ 6.7 %
Grants & Contracts 321,566 4,143,240$ 4,464,806 219,397 4,180,000$ 4,399,397 184,042 4,180,000$ 4,364,042 (35,355) (0.8) %
Sales & Service
Other Sources 7,100,662 577,806 7,678,467 7,229,853 483,380 7,713,233 7,598,916 483,380 8,082,296 369,063 4.8 %
Total Revenues 17,358,752$ 4,721,046$ 22,079,798$ 17,791,437$ 4,663,380$ 22,454,817$ 18,816,645$ 4,663,380$ 23,480,025$ 1,025,208$ 4.6 %
Expenditures and Transfers
Instruction 50,000$ 50,000$
Research 34,268 34,268
Public Service 15,032,667$ 4,387,995 19,420,663 15,422,217$ 4,663,380$ 20,085,597$ 17,242,519$ 4,663,380$ 21,905,899$ 1,820,302$ 9.1 %
Academic Support 262,964 262,964 277,673 277,673 267,153 267,153 (10,520) (3.8) %
Student Services
Institutional Support 934,964 17,943 952,907 772,442 772,442 935,651 935,651 163,209 21.1 %
Operation & Maintenance of Plant
Scholarships & Fellowships 4,432 4,432
Subtotal Expenditures 16,230,595$ 4,494,638$ 20,725,233$ 16,472,332$ 4,663,380$ 21,135,712$ 18,445,323$ 4,663,380$ 23,108,703$ 1,972,991$ 9.3 %
Mandatory Transfers
Non-Mandatory Transfers 1,076,037 1,076,037 1,408,526 1,408,526 580,507 580,507 (828,019) (58.8) %
Total Expenditures & Transfers 17,306,632$ 4,494,638$ 21,801,270$ 17,880,858$ 4,663,380$ 22,544,238$ 19,025,830$ 4,663,380$ 23,689,210$ 1,144,972$ 5.1 %
Fund Balance Addition / (Reduction) 52,120$ 226,408$ 278,527$ (89,421)$ (89,421)$ (209,185)$ (209,185)$
Institute for Public Service TotalFY 2017 Proposed Budget Summary
Unrestricted and Restricted Current Funds Revenues, Expenditures and Transfers
%Probable to Proposed
ChangeFY 2015 Actual FY 2016 Probable FY 2017 Proposed
Schedule 10 - PUBLIC SVC TOTALD-81

FY 2013 FY 2014 FY 2015 FY 2016 FY 2017ACTUAL ACTUAL ACTUAL PROBABLE PROPOSED AMOUNT
EDUCATIONAL AND GENERALRevenues
Tuition & FeesState Appropriations 9,447,397$ 9,899,924$ 9,936,524$ 10,342,187$ 11,033,687$ 1,586,290$ 16.8 %Grants & Contracts 4,840,706 4,708,249 4,464,806 4,399,397 4,364,042 (476,664) (9.8) %Sales & ServiceOther Sources 7,214,529 7,630,486 7,678,467 7,713,233 8,082,296 867,767 12.0 %
Total Revenues 21,502,632$ 22,238,658$ 22,079,798$ 22,454,817$ 23,480,025$ 1,977,393$ 9.2 %
Expenditures and TransfersInstruction 26,541$ 1,113$ 50,000$ (26,541)$ (100.0) %Research 34,268 Public Service 19,419,103 19,351,972 19,420,663 20,085,597$ 21,905,899$ 2,486,796 12.8 %Academic Support 284,157 297,067 262,964 277,673 267,153 (17,004) (6.0) %Student ServicesInstitutional Support 1,113,169 1,180,050 952,907 772,442 935,651 (177,518) (15.9) %Operation & Maintenance of PlantScholarships & Fellowships 1,006 6,438 4,432 (1,006) (100.0) %
Subtotal Expenditures 20,843,976$ 20,836,639$ 20,725,233$ 21,135,712$ 23,108,703$ 2,264,727$ 10.9 %Mandatory TransfersNon-Mandatory Transfers 825,218 1,052,539 1,076,037 1,408,526 580,507 (244,711) (29.7) %
Total Expenditures & Transfers 21,669,194$ 21,889,178$ 21,801,270$ 22,544,238$ 23,689,210$ 2,020,016$ 9.3 %Fund Balance Addition/(Reduction) (166,562)$ 349,480$ 278,527$ (89,421)$ (209,185)$
Institute for Public Service TotalFive Year FY17 Proposed Budget Summary Comparison
Current Funds Revenues, Expenditures and Transfers - UNRESTRICTED AND RESTRICTED
FY 2013 TO FY 2017%
CHANGE
Schedule 9 - PUB SVC UNIT TOTALD-82

Institute for Public ServiceFY 2017 Proposed Budget Summary
Unrestricted Current Funds Revenues, Expenditures, and Transfers
CHANGEFY 2015 FY 2016 FY 2017 PROBABLE TO PROPOSED
ACTUALS PROBABLE PROPOSED AMOUNT %EDUCATIONAL AND GENERALRevenues
Tuition & FeesState Appropriations 5,265,298$ 5,439,285$ 5,639,985$ 200,700$ 3.7 %Grants & Contracts 301,450 191,622 156,267 (35,355) (18.5) %Sales & ServiceOther Sources 623,205 692,700 925,400 232,700 33.6 %
Total Revenues 6,189,953$ 6,323,607$ 6,721,652$ 398,045$ 6.3 %
Expenditures and TransfersInstructionResearchPublic Service 4,466,659$ 4,485,952$ 5,336,778$ 850,826$ 19.0 %Academic SupportStudent ServicesInstitutional Support 924,492 755,707 918,916 163,209 21.6 %Operation & Maintenance of PlantScholarships & Fellowships
Subtotal Expenditures 5,391,151$ 5,241,659$ 6,255,694$ 1,014,035$ 19.3 %Mandatory TransfersNon-Mandatory Transfers 803,828 1,188,533 465,958 (722,575) (60.8) %
Total Expenditures & Transfers 6,194,979$ 6,430,192$ 6,721,652$ 291,460$ 4.5 %Fund Balance Addition/(Reduction) (5,026)$ (106,585)$
Schedule 15 - IPSD-83

FY 2013 FY 2014 FY 2015 FY 2016 FY 2017ACTUAL ACTUAL ACTUAL PROBABLE PROPOSED AMOUNT
EDUCATIONAL AND GENERALRevenues
Tuition & FeesState Appropriations 5,058,459$ 5,249,898$ 5,265,298$ 5,439,285$ 5,639,985$ 581,526$ 11.5 %Grants & Contracts 298,292 292,867 301,450 191,622 156,267 (142,025) (47.6) %Sales & ServiceOther Sources 660,979 837,426 623,205 692,700 925,400 264,421 40.0 %
Total Revenues 6,017,730$ 6,380,191$ 6,189,953$ 6,323,607$ 6,721,652$ 703,922$ 11.7 %
Expenditures and TransfersInstructionResearchPublic Service 4,380,723$ 4,164,483$ 4,466,659$ 4,485,952$ 5,336,778$ 956,055$ 21.8 %Academic SupportStudent ServicesInstitutional Support 1,093,964 1,157,338 924,492 755,707 918,916 (175,048) (16.0) %Operation & Maintenance of PlantScholarships & Fellowships
Subtotal Expenditures 5,474,687$ 5,321,822$ 5,391,151$ 5,241,659$ 6,255,694$ 781,007$ 14.3 %Mandatory TransfersNon-Mandatory Transfers 612,219 961,047 803,828 1,188,533 465,958 (146,261) (23.9) %
Total Expenditures & Transfers 6,086,906$ 6,282,869$ 6,194,979$ 6,430,192$ 6,721,652$ 634,746$ 10.4 %Fund Balance Addition/(Reduction) (69,176)$ 97,323$ (5,026)$ (106,585)$
Institute For Public ServiceFive Year FY17 Proposed Budget Summary Comparison
Current Funds Revenues, Expenditures and Transfers - UNRESTRICTED
FY 2013 TO FY 2017%
CHANGE
Schedule 8 - IPSD-84

FY 2015 FY 2016 FY 2017ACTUAL PROBABLE PROPOSED AMOUNT
EDUCATIONAL AND GENERAL
Salaries and Benefits
Salaries
Academic 20,155$ 272,743$ 192,406$ (80,337)$ (29.5) %
Non-Academic 2,554,360 2,359,432 2,715,889 356,457$ 15.1 %
Students 17,656 20,486 15,290 (5,196) (25.4) %
Total Salaries 2,592,170$ 2,652,661$ 2,923,585$ 270,924$ 10.2 %
Staff Benefits 864,889 855,612 1,044,767 189,155 22.1 %
Total Salaries and Benefits 3,457,060$ 3,508,273$ 3,968,352$ 460,079$ 13.1 %
Operating 1,925,461 1,713,386 2,287,342 573,956 33.5 %
Equipment and Capital Outlay 8,630 20,000 (20,000) (100.0) %
Total Expenditures 5,391,151$ 5,241,659$ 6,255,694$ 1,014,035$ 19.3 %
%
CHANGE
FY 2017 Proposed Budget Summary - Natural ClassificationsUnrestricted Current Funds Expenditures
Institute of Public Service
PROBABLE TO PROPOSED
Schedule 12 - IPSD-85

Unrestricted Restricted Total Unrestricted Restricted Total Unrestricted Restricted Total Amount
EDUCATION AND GENERALRevenues
Tuition & Fees
State Appropriations 5,265,298$ 5,265,298$ 5,439,285$ 5,439,285$ 5,639,985$ 5,639,985$ 200,700$ 3.7 %
Grants & Contracts 301,450 3,956,606$ 4,258,056 191,622 4,070,000$ 4,261,622 156,267 4,070,000$ 4,226,267 (35,355) (0.8) %
Sales & Service
Other Sources 623,205 277,058 900,263 692,700 176,280 868,980 925,400 176,280 1,101,680 232,700 26.8 %
Total Revenues 6,189,953$ 4,233,664$ 10,423,617$ 6,323,607$ 4,246,280$ 10,569,887$ 6,721,652$ 4,246,280$ 10,967,932$ 398,045$ 3.8 %
Expenditures and Transfers
Instruction 50,000$ 50,000$
Research 34,268 34,268
Public Service 4,466,659$ 4,014,653 8,481,312 4,485,952$ 4,246,280$ 8,732,232$ 5,336,778$ 4,246,280$ 9,583,058$ 850,826$ 9.7 %
Academic Support
Student Services
Institutional Support 924,492 14,228 938,720 755,707 755,707 918,916 918,916 163,209 21.6 %
Operation & Maintenance of Plant
Scholarships & Fellowships 4,432 4,432
Subtotal Expenditures 5,391,151$ 4,117,581$ 9,508,732$ 5,241,659$ 4,246,280$ 9,487,939$ 6,255,694$ 4,246,280$ 10,501,974$ 1,014,035$ 10.7 %
Mandatory Transfers
Non-Mandatory Transfers 803,828 803,828 1,188,533 1,188,533 465,958 465,958 (722,575) (60.8) %
Total Expenditures & Transfers 6,194,979$ 4,117,581$ 10,312,560$ 6,430,192$ 4,246,280$ 10,676,472$ 6,721,652$ 4,246,280$ 10,967,932$ 291,460$ 2.7 %
Fund Balance Addition / (Reduction) (5,026)$ 116,083$ 111,057$ (106,585)$ (106,585)$
Institute for Public ServiceFY 2017 Proposed Budget Summary
Unrestricted and Restricted Current Funds Revenues, Expenditures and Transfers
% Probable to Proposed
ChangeFY 2015 Actual FY 2016 Probable FY 2017 Proposed
Schedule 10 - IPSD-86

FY 2013 FY 2014 FY 2015 FY 2016 FY 2017ACTUAL ACTUAL ACTUAL PROBABLE PROPOSED AMOUNT
EDUCATIONAL AND GENERALRevenues
Tuition & FeesState Appropriations 5,058,459$ 5,249,898$ 5,265,298$ 5,439,285$ 5,639,985$ 581,526$ 11.5 %Grants & Contracts 4,433,214 4,482,923 4,258,056 4,261,622 4,226,267 (206,947) (4.7) %Sales & ServiceOther Sources 920,636 1,076,599 900,263 868,980 1,101,680 181,044 19.7 %
Total Revenues 10,412,309$ 10,809,420$ 10,423,617$ 10,569,887$ 10,967,932$ 555,623$ 5.3 %
Expenditures and TransfersInstruction 41,238$ 1,113$ 50,000$ (41,238)$ (100.0) %Research 34,268Public Service 8,708,169 8,404,312 8,481,312 8,732,232 9,583,058 874,889 10.0 %Academic Support 1,445 6,720 (1,445) (100.0) %Student ServicesInstitutional Support 1,103,326 1,169,971 938,720 755,707 918,916 (184,410) (16.7) %Operation & Maintenance of PlantScholarships & Fellowships 1,006 6,438 4,432 (1,006) (100.0) %
Subtotal Expenditures 9,855,184$ 9,588,554$ 9,508,732$ 9,487,939$ 10,501,974$ 646,790$ 6.6 %Mandatory TransfersNon-Mandatory Transfers 612,219 961,047 803,828 1,188,533 465,958 (146,261) (23.9) %
Total Expenditures & Transfers 10,467,403$ 10,549,601$ 10,312,560$ 10,676,472$ 10,967,932$ 500,529$ 4.8 %Fund Balance Addition/(Reduction) (55,094)$ 259,819$ 111,057$ (106,585)$
Institute For Public ServiceFive Year FY17 Proposed Budget Summary Comparison
Current Funds Revenues, Expenditures and Transfers - UNRESTRICTED AND RESTRICTED
FY 2013 TO FY 2017%
CHANGE
Schedule 9 - IPSD-87

Municipal Technical Advisory ServiceFY 2017 Proposed Budget Summary
Unrestricted Current Funds Revenues, Expenditures, and Transfers
CHANGEFY 2015 FY 2016 FY 2017 PROBABLE TO PROPOSED
ACTUALS PROBABLE PROPOSED AMOUNT %EDUCATIONAL AND GENERALRevenues
Tuition & FeesState Appropriations 2,903,313$ 3,039,651$ 3,156,651$ 117,000$ 3.8 %Grants & Contracts 20,116 27,775 27,775 Sales & ServiceOther Sources 3,299,627 3,388,436 3,465,239 76,803 2.3 %
Total Revenues 6,223,056$ 6,455,862$ 6,649,665$ 193,803$ 3.0 %
Expenditures and TransfersInstructionResearchPublic Service 5,694,708$ 6,000,475$ 6,222,811$ 222,336$ 3.7 %Academic Support 262,964 277,673 267,153 (10,520) (3.8) %Student ServicesInstitutional Support 6,155 8,900 8,900 Operation & Maintenance of PlantScholarships & Fellowships
Subtotal Expenditures 5,963,827$ 6,287,048$ 6,498,864$ 211,816$ 3.4 %Mandatory TransfersNon-Mandatory Transfers 254,675 136,721 179,339 42,618 31.2 %
Total Expenditures & Transfers 6,218,502$ 6,423,769$ 6,678,203$ 254,434$ 4.0 %Fund Balance Addition/(Reduction) 4,554$ 32,093$ (28,538)$
Schedule 15 - MTASD-88

FY 2013 FY 2014 FY 2015 FY 2016 FY 2017ACTUAL ACTUAL ACTUAL PROBABLE PROPOSED AMOUNT
EDUCATIONAL AND GENERALRevenues
Tuition & FeesState Appropriations 2,737,969$ 2,892,013$ 2,903,313$ 3,039,651$ 3,156,651$ 418,682$ 15.3 %Grants & Contracts 15,067 20,218 20,116 27,775 27,775 12,708 84.3 %Sales & ServiceOther Sources 2,940,078 3,267,493 3,299,627 3,388,436 3,465,239 525,161 17.9 %
Total Revenues 5,693,114$ 6,179,724$ 6,223,056$ 6,455,862$ 6,649,665$ 956,551$ 16.8 %
Expenditures and TransfersInstructionResearchPublic Service 5,327,551$ 5,725,726$ 5,694,708$ 6,000,475$ 6,222,811$ 895,260$ 16.8 %Academic Support 282,712 287,979 262,964 277,673 267,153 (15,559) (5.5) %Student ServicesInstitutional Support 5,329 5,297 6,155 8,900 8,900 3,571 67.0 %Operation & Maintenance of PlantScholarships & Fellowships
Subtotal Expenditures 5,615,592$ 6,019,002$ 5,963,827$ 6,287,048$ 6,498,864$ 883,272$ 15.7 %Mandatory TransfersNon-Mandatory Transfers 265,563 138,107 254,675 136,721 179,339 (86,224) (32.5) %
Total Expenditures & Transfers 5,881,155$ 6,157,109$ 6,218,502$ 6,423,769$ 6,678,203$ 797,048$ 13.6 %Fund Balance Addition/(Reduction) (188,040)$ 22,615$ 4,554$ 32,093$ (28,538)$
Municipal Advisory Technical ServiceFive Year FY17 Proposed Budget Summary Comparison
Current Funds Revenues, Expenditures and Transfers - UNRESTRICTED
FY 2013 TO FY 2017%
CHANGE
Schedule 8 - MTASD-89

FY 2015 FY 2016 FY 2017ACTUAL PROBABLE PROPOSED AMOUNT
EDUCATIONAL AND GENERAL
Salaries and Benefits
Salaries
Academic 74,997$ 74,990$ (7)$ - %
Non-Academic 3,616,831$ 3,665,412 3,836,342 170,930 4.7 %
Students 5,915 20,000 10,000 (10,000) (50.0) %
Total Salaries 3,622,746$ 3,760,409$ 3,921,332$ 160,923$ 4.3 %
Staff Benefits 1,249,216 1,246,485 1,311,102 64,617 5.2 %
Total Salaries and Benefits 4,871,962$ 5,006,894$ 5,232,434$ 225,540$ 4.5 %
Operating 1,054,070 1,237,154 1,227,280 (9,874) (0.8) %
Equipment and Capital Outlay 37,796 43,000 39,150 (3,850) (9.0) %
Total Expenditures 5,963,827$ 6,287,048$ 6,498,864$ 211,816$ 3.4 %
%
CHANGE
FY 2017 Proposed Budget Summary - Natural ClassificationsUnrestricted Current Funds Expenditures
Municipal Technical Advisory Service
PROBABLE TO PROPOSED
Schedule 12 - MTASD-90

Unrestricted Restricted Total Unrestricted Restricted Total Unrestricted Restricted Total Amount
EDUCATION AND GENERALRevenues
Tuition & Fees
State Appropriations 2,903,313$ 2,903,313$ 3,039,651$ 3,039,651$ 3,156,651$ 3,156,651$ 117,000$ 3.8 %
Grants & Contracts 20,116 186,184$ 206,301 27,775 110,000$ 137,775 27,775 110,000$ 137,775
Sales & Service
Other Sources 3,299,627 200,610 3,500,237 3,388,436 210,000 3,598,436 3,465,239 210,000 3,675,239 76,803 2.1 %
Total Revenues 6,223,056$ 386,795$ 6,609,851$ 6,455,862$ 320,000$ 6,775,862$ 6,649,665$ 320,000$ 6,969,665$ 193,803$ 2.9 %
Expenditures and Transfers
Instruction
Research
Public Service 5,694,708$ 360,963$ 6,055,672$ 6,000,475$ 320,000$ 6,320,475$ 6,222,811$ 320,000$ 6,542,811$ 222,336$ 3.5 %
Academic Support 262,964 262,964 277,673 277,673 267,153 267,153 (10,520) (3.8) %
Student Services
Institutional Support 6,155 6,155 8,900 8,900 8,900 8,900
Operation & Maintenance of Plant
Scholarships & Fellowships
Subtotal Expenditures 5,963,827$ 360,963$ 6,324,791$ 6,287,048$ 320,000$ 6,607,048$ 6,498,864$ 320,000$ 6,818,864$ 211,816$ 3.2 %
Mandatory Transfers
Non-Mandatory Transfers 254,675 254,675 136,721 136,721 179,339 179,339 42,618 31.2 %
Total Expenditures & Transfers 6,218,502$ 360,963$ 6,579,466$ 6,423,769$ 320,000$ 6,743,769$ 6,678,203$ 320,000$ 6,998,203$ 254,434$ 3.8 %
Fund Balance Addition / (Reduction) 4,554$ 25,831$ 30,385$ 32,093$ 32,093$ (28,538)$ (28,538)$
%
Municipal Technical Advisory ServiceFY 2017 Proposed Budget Summary
Unrestricted and Restricted Current Funds Revenues, Expenditures and Transfers
FY 2015 Actual FY 2016 Probable FY 2017 Proposed Probable to ProposedChange
Schedule 10 - MTASD-91

FY 2013 FY 2014 FY 2015 FY 2016 FY 2017ACTUAL ACTUAL ACTUAL PROBABLE PROPOSED AMOUNT
EDUCATIONAL AND GENERALRevenues
Tuition & FeesState Appropriations 2,737,969$ 2,892,013$ 2,903,313$ 3,039,651$ 3,156,651$ 418,682$ 15.3 %Grants & Contracts 155,129 175,025 206,301 137,775 137,775 (17,354) (11.2) %Sales & ServiceOther Sources 3,109,719 3,452,227 3,500,237 3,598,436 3,675,239 565,520 18.2 %
Total Revenues 6,002,817$ 6,519,266$ 6,609,851$ 6,775,862$ 6,969,665$ 966,848$ 16.1 %
Expenditures and TransfersInstructionResearchPublic Service 5,559,880$ 6,024,740$ 6,055,672$ 6,320,475$ 6,542,811$ 982,931$ 17.7 %Academic Support 282,712 290,346 262,964 277,673 267,153 (15,559) (5.5) %Student ServicesInstitutional Support 5,329 5,297 6,155 8,900 8,900 3,571 67.0 %Operation & Maintenance of PlantScholarships & Fellowships
Subtotal Expenditures 5,847,921$ 6,320,383$ 6,324,791$ 6,607,048$ 6,818,864$ 970,943$ 16.6 %Mandatory TransfersNon-Mandatory Transfers 265,563 138,107 254,675 136,721 179,339 (86,224) (32.5) %
Total Expenditures & Transfers 6,113,484$ 6,458,490$ 6,579,466$ 6,743,769$ 6,998,203$ 884,719$ 14.5 %Fund Balance Addition/(Reduction) (110,667)$ 60,776$ 30,385$ 32,093$ (28,538)$
Municipal Advisory Technical ServiceFive Year FY17 Proposed Budget Summary Comparison
Current Funds Revenues, Expenditures and Transfers - UNRESTRICTED AND RESTRICTED
FY 2013 TO FY 2017%
CHANGE
Schedule 9 - MTASD-92

County Technical Assistance ServiceFY 2017 Proposed Budget Summary
Unrestricted Current Funds Revenues, Expenditures, and Transfers
CHANGEFY 2015 FY 2016 FY 2017 PROBABLE TO PROPOSED
ACTUALS PROBABLE PROPOSED AMOUNT %EDUCATIONAL AND GENERALRevenues
Tuition & FeesState Appropriations 1,767,913$ 1,863,251$ 2,237,051$ 373,800$ 20.1 %Grants & ContractsSales & ServiceOther Sources 3,177,830 3,148,717 3,208,277 59,560 1.9 %
Total Revenues 4,945,743$ 5,011,968$ 5,445,328$ 433,360$ 8.6 %
Expenditures and TransfersInstructionResearchPublic Service 4,871,300$ 4,935,790$ 5,682,930$ 747,140$ 15.1 %Academic SupportStudent ServicesInstitutional Support 4,317 7,835 7,835 Operation & Maintenance of PlantScholarships & Fellowships
Subtotal Expenditures 4,875,617$ 4,943,625$ 5,690,765$ 747,140$ 15.1 %Mandatory TransfersNon-Mandatory Transfers 17,534 83,272 (64,790) (148,062) (177.8)
Total Expenditures & Transfers 4,893,151$ 5,026,897$ 5,625,975$ 599,078$ 11.9 %Fund Balance Addition/(Reduction) 52,592$ (14,929)$ (180,647)$
Schedule 15 - CTASD-93

FY 2013 FY 2014 FY 2015 FY 2016 FY 2017ACTUAL ACTUAL ACTUAL PROBABLE PROPOSED AMOUNT
EDUCATIONAL AND GENERALRevenues
Tuition & FeesState Appropriations 1,650,969$ 1,758,013$ 1,767,913$ 1,863,251$ 2,237,051$ 586,082$ 35.5 %Grants & Contracts 38 (38) (100.0) %Sales & ServiceOther Sources 3,088,459 3,004,551 3,177,830 3,148,717 3,208,277 119,818 3.9 %
Total Revenues 4,739,467$ 4,762,564$ 4,945,743$ 5,011,968$ 5,445,328$ 705,861$ 14.9 %
Expenditures and TransfersInstructionResearchPublic Service 4,887,656$ 4,845,230$ 4,871,300$ 4,935,790$ 5,682,930$ 795,275$ 16.3 %Academic SupportStudent ServicesInstitutional Support 3,572 3,736 4,317 7,835 7,835 4,263 119.3 %Operation & Maintenance of PlantScholarships & Fellowships
Subtotal Expenditures 4,891,228$ 4,848,966$ 4,875,617$ 4,943,625$ 5,690,765$ 799,538$ 16.3 %Mandatory TransfersNon-Mandatory Transfers (52,564) (46,615) 17,534 83,272 (64,790) (12,226) (23.3) %
Total Expenditures & Transfers 4,838,664$ 4,802,351$ 4,893,151$ 5,026,897$ 5,625,975$ 787,312$ 16.3 %Fund Balance Addition/(Reduction) (99,197)$ (39,788)$ 52,592$ (14,929)$ (180,647)$
County Technical Assistance ServiceFive Year FY17 Proposed Budget Summary Comparison
Current Funds Revenues, Expenditures and Transfers - UNRESTRICTED
FY 2013 TO FY 2017%
CHANGE
Schedule 8 - CTASD-94
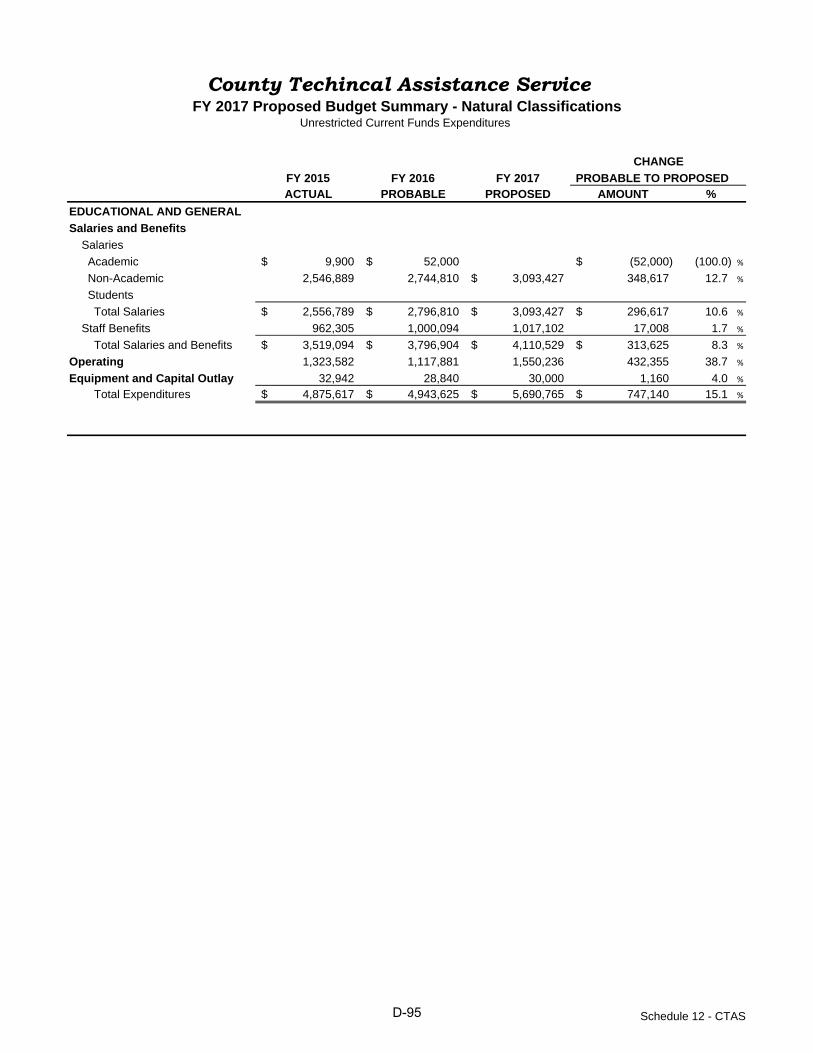
FY 2015 FY 2016 FY 2017ACTUAL PROBABLE PROPOSED AMOUNT
EDUCATIONAL AND GENERAL
Salaries and Benefits
Salaries
Academic 9,900$ 52,000$ (52,000)$ (100.0) %
Non-Academic 2,546,889 2,744,810 3,093,427$ 348,617 12.7 %
Students
Total Salaries 2,556,789$ 2,796,810$ 3,093,427$ 296,617$ 10.6 %
Staff Benefits 962,305 1,000,094 1,017,102 17,008 1.7 %
Total Salaries and Benefits 3,519,094$ 3,796,904$ 4,110,529$ 313,625$ 8.3 %
Operating 1,323,582 1,117,881 1,550,236 432,355 38.7 %
Equipment and Capital Outlay 32,942 28,840 30,000 1,160 4.0 %
Total Expenditures 4,875,617$ 4,943,625$ 5,690,765$ 747,140$ 15.1 %
%
CHANGE
FY 2017 Proposed Budget Summary - Natural ClassificationsUnrestricted Current Funds Expenditures
County Techincal Assistance Service
PROBABLE TO PROPOSED
Schedule 12 - CTASD-95

Unrestricted Restricted Total Unrestricted Restricted Total Unrestricted Restricted Total Amount
EDUCATION AND GENERALRevenues
Tuition & Fees
State Appropriations 1,767,913$ 1,767,913$ 1,863,251$ 1,863,251$ 2,237,051$ 2,237,051$ 373,800$ 20.1 %
Grants & Contracts 450$ 450
Sales & Service
Other Sources 3,177,830 100,137 3,277,967 3,148,717 97,100$ 3,245,817 3,208,277 97,100 3,305,377 59,560 1.8 %
Total Revenues 4,945,743$ 100,587$ 5,046,330$ 5,011,968 97,100$ 5,109,068$ 5,445,328 97,100$ 5,542,428$ 433,360$ 8.5 %
Expenditures and Transfers
Instruction
Research
Public Service 4,871,300$ 12,379 4,883,679 4,935,790$ 97,100$ 5,032,890$ 5,682,930$ 97,100$ 5,780,030$ 747,140$ 14.8 %
Academic Support
Student Services
Institutional Support 4,317 3,715 8,032 7,835 7,835 7,835 7,835
Operation & Maintenance of Plant
Scholarships & Fellowships
Subtotal Expenditures 4,875,617$ 16,094$ 4,891,711$ 4,943,625$ 97,100$ 5,040,725$ 5,690,765$ 97,100$ 5,787,865$ 747,140$ 14.8 %
Mandatory Transfers
Non-Mandatory Transfers 17,534 17,534 83,272 83,272 (64,790) (64,790) (148,062) (177.8) %
Total Expenditures & Transfers 4,893,151$ 16,094$ 4,909,245$ 5,026,897$ 97,100$ 5,123,997$ 5,625,975$ 97,100$ 5,723,075$ 599,078$ 11.7 %
Fund Balance Addition / (Reduction) 52,592$ 84,493$ 137,085$ (14,929)$ (14,929)$ (180,647)$ (180,647)$
County Technical Assistance ServiceFY 2017 Proposed Budget Summary
Unrestricted and Restricted Current Funds Revenues, Expenditures and Transfers
% Probable to Proposed
ChangeFY 2015 Actual FY 2016 Probable FY 2017 Proposed
Schedule 10 - CTASD-96

FY 2013 FY 2014 FY 2015 FY 2016 FY 2017ACTUAL ACTUAL ACTUAL PROBABLE PROPOSED AMOUNT
EDUCATIONAL AND GENERALRevenues
Tuition & FeesState Appropriations 1,650,969$ 1,758,013$ 1,767,913$ 1,863,251$ 2,237,051$ 586,082$ 35.5 %Grants & Contracts 252,363 50,300 450 (252,363) (100.0) %Sales & ServiceOther Sources 3,184,174 3,101,660 3,277,967 3,245,817 3,305,377 121,203 3.8 %
Total Revenues 5,087,506$ 4,909,973$ 5,046,330$ 5,109,068$ 5,542,428$ 454,922$ 8.9 %
Expenditures and TransfersInstruction (14,698)$ 14,698$ 100.0 %ResearchPublic Service 5,151,055 4,922,920 4,883,679$ 5,032,890$ 5,780,030$ 628,975 12.2 %Academic SupportStudent ServicesInstitutional Support 4,514 4,782 8,032 7,835 7,835 3,321 73.6 %Operation & Maintenance of PlantScholarships & Fellowships
Subtotal Expenditures 5,140,871$ 4,927,702$ 4,891,711$ 5,040,725$ 5,787,865$ 646,994$ 12.6 %Mandatory TransfersNon-Mandatory Transfers (52,564) (46,615) 17,534 83,272 (64,790) (12,226) (23.3) %
Total Expenditures & Transfers 5,088,307$ 4,881,087$ 4,909,245$ 5,123,997$ 5,723,075$ 634,768$ 12.5 %Fund Balance Addition/(Reduction) (800)$ 28,886$ 137,085$ (14,929)$ (180,647)$
County Technical Assistance ServiceFive Year FY17 Proposed Budget Summary Comparison
Current Funds Revenues, Expenditures and Transfers - UNRESTRICTED AND RESTRICTED
FY 2013 TO FY 2017%
CHANGE
Schedule 9 - CTASD-97

System AdministrationFY 2017 Proposed Budget Summary
Unrestricted Current Funds Revenues, Expenditures, and Transfers
CHANGEFY 2015 FY 2016 FY 2017 PROBABLE TO PROPOSED
ACTUALS PROBABLE PROPOSED AMOUNT %EDUCATIONAL AND GENERALRevenues
Tuition & FeesState Appropriations 4,794,038$ 4,995,217$ 5,263,217$ 268,000$ 5.4 %Grants & ContractsSales & ServiceOther Sources 18,981,510 17,666,635 17,666,635
Total Revenues 23,775,548$ 22,661,852$ 22,929,852$ 268,000$ 1.2 %
Expenditures and TransfersInstructionResearch 239,983$ 250,000$ 250,000$ Public ServiceAcademic SupportStudent ServicesInstitutional Support 43,559,856 48,269,623$ 49,967,394$ 1,697,771$ 3.5 %Operation & Maintenance of PlantScholarships & Fellowships
Subtotal Expenditures 43,799,839$ 48,519,623$ 50,217,394$ 1,697,771$ 3.5 %Mandatory Transfers 91,568 135,000 135,000 Non-Mandatory Transfers (23,112,344) (25,627,911) (27,422,542) (1,794,631) (7.0) %
Total Expenditures & Transfers 20,779,063$ 23,026,712$ 22,929,852$ (96,860)$ (0.4) %Fund Balance Addition/(Reduction) 2,996,484$ (364,860)$
Schedule 15 - UWAD-98

FY 2013 FY 2014 FY 2015 FY 2016 FY 2017ACTUAL ACTUAL ACTUAL PROBABLE PROPOSED AMOUNT
EDUCATIONAL AND GENERALRevenues
Tuition & FeesState Appropriations 4,571,278$ 4,721,538$ 4,794,038$ 4,995,217$ 5,263,217$ 691,939$ 15.1 %Grants & ContractsSales & ServiceOther Sources 13,709,384 18,748,561 18,981,510 17,666,635 17,666,635 3,957,251 28.9 %
Total Revenues 18,280,662$ 23,470,099$ 23,775,548$ 22,661,852$ 22,929,852$ 4,649,190$ 25.4 %
Expenditures and TransfersInstructionResearch 470,299$ 227,303$ 239,983$ 250,000$ 250,000 (220,299)$ (46.8) %Public ServiceAcademic SupportStudent ServicesInstitutional Support 46,699,522 45,707,635 43,559,856 48,269,623$ 49,967,394$ 3,267,872 7.0 %Operation & Maintenance of PlantScholarships & Fellowships
Subtotal Expenditures 47,169,821$ 45,934,938$ 43,799,839$ 48,519,623$ 50,217,394$ 3,047,573$ 6.5 %Mandatory Transfers 134,948 135,209 91,568 135,000 135,000 52 0.0 %Non-Mandatory Transfers (24,274,085) (21,484,705) (23,112,344) (25,627,911) (27,422,542) (3,148,457) (13.0) %
Total Expenditures & Transfers 23,030,684$ 24,585,442$ 20,779,063$ 23,026,712$ 22,929,852$ (100,832)$ (0.4) %Fund Balance Addition/(Reduction) (4,750,023)$ (1,115,343)$ 2,996,484$ (364,860)$
System AdministrationFive Year FY17 Proposed Budget Summary Comparison
Current Funds Revenues, Expenditures and Transfers - UNRESTRICTED
FY 2013 TO FY 2017%
CHANGE
Schedule 8 - UWAD-99

System AdministrationUnrestricted Net Assets
E&GNet Assets - June 30, 2014 20,304,137$ Percent Unallocated of Expenditure & Transfers * 2.02%
FY 2014-15 ACTUALRevenue 23,775,548$ Less:
Expenditures 43,799,839$ Mandatory Transfers 91,568Non-Mandatory Transfers (23,112,344)
Total Expenditures & Transfers 20,779,063$ Net Change 2,996,485$ Unrestricted Net Assets
Working Capital-Accounts Receivable 3,184,931$ Working Capital-Petty Cash 1,708,936Working Capital-Inventories 290,994Revolving Funds 16,019,480EncumbrancesUnexpended Gifts 284,887Reappropriations 792,382Unallocated 1,019,012
Net Assets - June 30, 2015 23,300,622$ Percent Unallocated of Expenditure & Transfers * 2.99%
FY 2015-16 PROBABLE BUDGETRevenue 22,661,852$ Less:
Expenditures 48,519,623$ Mandatory Transfers 135,000Non-Mandatory Transfers (25,627,911)
Total Expenditures & Transfers 23,026,712$ Net Change (364,860)$ Unrestricted Net Assets
Working Capital-Accounts Receivable 3,184,931$ Working Capital-Petty Cash 1,708,936Working Capital-Inventories 290,994Revolving Funds 16,019,480EncumbrancesUnexpended Gifts 284,887ReappropriationsUnallocated 1,446,534
Estimated Net Assets - June 30, 2016 22,935,762$ Percent Unallocated of Expenditure & Transfers * 3.82%
FY 2016-17 PROPOSED BUDGETRevenue 22,929,852$ Less:
Expenditures 50,217,394$ Mandatory Transfers 135,000Non-Mandatory Transfers (27,422,542)
Total Expenditures & Transfers 22,929,852$ Net Change -$ Unrestricted Net Assets
Working Capital-Accounts Receivable 3,184,931$ Working Capital-Petty Cash 1,708,936Working Capital-Inventories 290,994Revolving Funds 16,019,480EncumbrancesUnexpended Gifts 284,887ReappropriationsUnallocated 1,446,534
Estimated Net Assets - June 30, 2017 22,935,762$ Percent Unallocated of Expenditure & Transfers * 3.63%
* Recommended percent for unallocated expenditures is 2% to 5% for E&G.
Net Assets ‐ Sys AdministrationD-100

FY 2015 FY 2016 FY 2017ACTUAL PROBABLE PROPOSED AMOUNT
EDUCATIONAL AND GENERAL
Salaries and Benefits
Salaries
Academic 224,306$ 137,900$ 140,900$ 3,000$ 2.2 %
Non-Academic 20,923,259 23,185,784 23,807,347 621,563 2.7 %
Students 131,145 123,186 130,686 7,500 6.1 %
Total Salaries 21,278,709$ 23,446,870$ 24,078,933$ 632,063$ 2.7 %
Staff Benefits 7,148,368 7,690,008 7,932,948 242,940 3.2 %
Total Salaries and Benefits 28,427,077$ 31,136,878$ 32,011,881$ 875,003$ 2.8 %
Operating 14,921,295 17,368,514 18,205,513 836,999 4.8 %
Equipment and Capital Outlay 451,468 14,231 (14,231) (100.0) %Total Expenditures 43,799,839$ 48,519,623$ 50,217,394$ 1,697,771$ 3.5 %
System Administration
%
CHANGE
FY 2017 Proposed Budget Summary - Natural ClassificationsUnrestricted Current Funds Expenditures
PROBABLE TO PROPOSED
Schedule 12 - UWAD-101

Unrestricted Restricted Total Unrestricted Restricted Total Unrestricted Restricted Total Amount
EDUCATION AND GENERALRevenues
Tuition & Fees
State Appropriations 4,794,038$ 4,601,500$ 9,395,538$ 4,995,217$ -$ 4,995,217$ 5,263,217$ -$ 5,263,217$ 268,000$ 5.4 %
Grants & Contracts 485,319 485,319 1,250,000 1,250,000 1,250,000 1,250,000
Sales & Service
Other Sources 18,981,510 926,793 19,908,303 17,666,635 600,000 18,266,635 17,666,635 600,000 18,266,635
Total Revenues 23,775,548$ 6,013,611$ 29,789,159$ 22,661,852$ 1,850,000$ 24,511,852$ 22,929,852$ 1,850,000$ 24,779,852$ 268,000$ 1.1 %
Expenditures and Transfers
Instruction 104,706$ 104,706$ 8,000$ 8,000$ 8,000$ 8,000$
Research 239,983$ 2,067,459$ 2,307,442$ 250,000 682,000 932,000 250,000 682,000 932,000
Public Service 473,729 473,729 600,000 600,000 600,000 600,000
Academic Support
Student Services
Institutional Support 43,559,856 568,160 44,128,016 48,269,623$ 520,000 48,789,623 49,967,394$ 520,000 50,487,394 1,697,771$ 3.5 %
Operation & Maintenance of Plant
Scholarships & Fellowships 49,200 49,200 40,000 40,000 40,000 40,000
Subtotal Expenditures 43,799,839$ 3,263,253$ 47,063,092$ 48,519,623$ 1,850,000$ 50,369,623$ 50,217,394$ 1,850,000$ 52,067,394$ 1,697,771$ 3.4 %
Mandatory Transfers 91,568 91,568 135,000 135,000 135,000 135,000
Non-Mandatory Transfers (23,112,344) (23,112,344) (25,627,911) (25,627,911)$ (27,422,542) (27,422,542)$ (1,794,631) (7.0) %
Total Expenditures & Transfers 20,779,063$ 3,263,253$ 24,042,316$ 23,026,712$ 1,850,000$ 24,876,712$ 22,929,852$ 1,850,000$ 24,779,852$ (96,860)$ (0.4) %
Fund Balance Addition / (Reduction) 2,996,484$ 2,750,359$ 5,746,843$ (364,860)$ (364,860)$
Change
System AdministrationFY 2017 Proposed Budget Summary
Unrestricted and Restricted Current Funds Revenues, Expenditures and Transfers
% Probable to ProposedFY 2015 Actual FY 2016 Probable FY 2017 Proposed
Schedule 10 - UWAD-102

FY 2013 FY 2014 FY 2015 FY 2016 FY 2017ACTUAL ACTUAL ACTUAL PROBABLE PROPOSED AMOUNT
EDUCATIONAL AND GENERALRevenues
Tuition & FeesState Appropriations 4,261,608$ 4,469,600$ 9,395,538$ 4,995,217$ 5,263,217$ 1,001,609$ 23.5 %Grants & Contracts 1,274,546 875,647 485,319 1,250,000 1,250,000 (24,546) (1.9) %Sales & ServiceOther Sources 14,202,215 19,387,034 19,908,303 18,266,635 18,266,635 4,064,420 28.6 %
Total Revenues 19,738,370$ 24,732,280$ 29,789,159$ 24,511,852$ 24,779,852$ 5,041,482$ 25.5 %
Expenditures and TransfersInstruction 51,069$ 104,706$ 8,000$ 8,000$ 8,000$ 100.0 %Research 7,734,171$ 2,424,628$ 2,307,442 932,000 932,000 (6,802,171) (87.9) %Public Service 1,274,546 875,647$ 473,729 600,000 600,000 (674,546) (52.9) %Academic SupportStudent Services %Institutional Support 47,513,047 46,311,554 44,128,016 48,789,623$ 50,487,394$ 2,974,347 6.3 %Operation & Maintenance of PlantScholarships & Fellowships 34,074 40,000 49,200 40,000 40,000 5,926 17.4 %
Subtotal Expenditures 56,555,838$ 49,702,899$ 47,063,092$ 50,369,623$ 52,067,394$ (4,488,444)$ (7.9) %Mandatory Transfers 134,948 135,209 91,568 135,000 135,000 52 0.0 %Non-Mandatory Transfers (24,274,085) (21,484,705) (23,112,344) (25,627,911) (27,422,542) (3,148,457) (13.0) %
Total Expenditures & Transfers 32,416,701$ 28,353,403$ 24,042,316$ 24,876,712$ 24,779,852$ (7,636,849)$ (23.6) %Fund Balance Addition/(Reduction) (12,678,332)$ (3,621,123)$ 5,746,843$ (364,860)$
System AdministrationFive Year FY17 Proposed Budget Summary Comparison
Current Funds Revenues, Expenditures and Transfers - UNRESTRICTED AND RESTRICTED
FY 2013 TO FY 2017%
CHANGE
Schedule 9 - UWAD-103

The University of Tennessee FY 2016-17 Proposed Budget Document
Ron Maples, Interim Treasurer & Chief Financial Officer System Budget and Finance Office Ron Loewen, Budget Director John Bodin-Henderson
We gratefully acknowledge the effort and cooperation of the campus and unit budget staff and the IRIS staff who contribute to the preparation of the University budget.
Knoxville and Space Institute Chris Cimino, Vice Chancellor, Finance and Administration Jonee Daniels Lindstrom James Price Suzan Thompson Gary Gray David Price Matt Ward
Chattanooga Richard Brown, Executive Vice Chancellor Tyler Forrest Chris Sherbesman
Martin Petra McPhearson, Interim Vice Chancellor Finance and Admin. Ann Payne Deica Disney Annette Moore
Health Science Center Anthony Ferrara, Vice Chancellor, Finance and Operations Michael Ebbs Charles Cossar Kimberly Moore Betty Lee Pace
Institute for Agriculture Tim Fawver, Chief Business Officer to the Chancellor Cynthia Nichols David Stone Missy Kitts Tonya Kenley Kathy Yates
Institute for Public Service Gail White, Chief Business Officer
IRIS Jim Sauceman, Director Mark Hall Laurie Rees Information Technology Services Jay Eckles, Director of Business Intelligence Denise Haley David Goforth
The University of Tennessee does not discriminate on the basis of race, sex, color, religion, national origin, age, disability or veteran status in provision of edu cational programs and services or e mployment opportunities and benefits. This policy extends to both employment by and admission to the University. The University d oes not discri minate on the basis of race, sex, or disability in its education programs and activities pursuant to the requirements of Title VI of the Civil Rights Act of 1964, Title IX of the Education Amendments of 1972, Section 504 of the Rehabilitation Act of 1973, and the Americans with Disabilities Act (ADA) of 1990. Inquiries and charges of violation concerning Title VI, Title IX, Section 504, ADA or the Age Discrimination in Employment Act (ADEA) or any of the other above r eferenced policies should be directed to the Office of E quity and Diver sity (OED), 1840 M elrose Avenue, Knoxville, TN 3 7996-3560, telephone (865) 974- 2498 (V/TTY available) or 974-2440. Requests for acco mmodation of a disability should be directed to the ADA Coordinator at the UT Knoxville Office of Human Resources, 600 Henley Street, Knoxville, TN 37996-4125. Publication Authorization Number: E17-0140-001-16
D-104


![FY17 2nd Quarter Financial Results [IFRS] · 2. FY17 2nd Quarter Financial Results [IFRS] 1. FY17 Q1-Q2 (Highlights) 4. Reference. 3. FY17 Outlook . 2.Status of Progress on the Mid-Term](https://static.fdocuments.in/doc/165x107/5f1e629b38af5e5e6a417bd6/fy17-2nd-quarter-financial-results-ifrs-2-fy17-2nd-quarter-financial-results.jpg)