Position Generator measures and their relationship to other … · Position Generator measures and...
34
Position Generator measures and their relationship to other Social Capital measures * Martin Van der Gaag, Tom A.B. Snijders, Henk D. Flap † ICS Vrije Universiteit Amsterdam University of Groningen Utrecht University 20th October 2004 * This research is part of the Research Program “Creation of and returns to social capital; Social Capital in education and labor markets” (SCALE), a combined project of the universities of Utrecht (UU), Groningen (RuG), and Amsterdam (UvA), funded by the Dutch Organization for Scientific Research, project number 510-50-204. † Corresponding author: Martin van der Gaag, Faculty of Social Sciences, department of method- ology, Vrije Universiteit Amsterdam, De Boelelaan 1081c, 1081 HV Amsterdam, The Netherlands, [email protected] 1
Transcript of Position Generator measures and their relationship to other … · Position Generator measures and...
Position Generator measures and their relationship to
other Social Capital measures ∗
Martin Van der Gaag, Tom A.B. Snijders, Henk D. Flap †
ICS
Vrije Universiteit Amsterdam
University of Groningen
Utrecht University
20th October 2004
∗This research is part of the Research Program “Creation of and returns to social capital; Social
Capital in education and labor markets” (SCALE), a combined project of the universities of Utrecht
(UU), Groningen (RuG), and Amsterdam (UvA), funded by the Dutch Organization for Scientific
Research, project number 510-50-204.†Corresponding author: Martin van der Gaag, Faculty of Social Sciences, department of method-
ology, Vrije Universiteit Amsterdam, De Boelelaan 1081c, 1081 HV Amsterdam, The Netherlands,
1
Abstract
This chapter discusses a number of questions concerning the measures for social
capital that can be derived from Position Generator data. One of the key issues
regarding its application in prospective research remains the emphasis of such
measures on the prestige of occupations as a main representation of social re-
sources. Whereas occupational prestige can be a suitable operationalisation for
the study of ‘big social capital issues’ such as status attainment and labour mar-
ket opportunities, other social capital questions may need different methods. For
the 1999-2000 Survey on the Social Networks of the Dutch we therefore compare
various measures calculated from Position Generator data with measures derived
from the the Name generator / interpreter exchange relationship method (Mc-
Callister & Fischer, 1978), and the Resource Generator method (Snijders, 1999;
Van der Gaag & Snijders, 2004b). Results show that especially Position Gener-
ator and Name Generator measures are weakly related. Position Generator data
remain the most useful for (comparative) general studies of social capital and
instrumental action in particular. However, for the study of returns to specif-
ically expressive or goal specific actions with social capital, other measurement
methods may be more valid, for which a tentative, parsimonious measurement
strategy is proposed.
Keywords: Social capital; measurement; Position Generator; scale construction.
2
1 introduction
Since its first use in the 1975 Albany study (Lin & Dumin, 1986) the Position Gen-
erator has not only proven to be a consistently constructed, but also popular and
consistently applied method for the measurement of social capital. The instrument
has especially been appealing for investigations of the productivity of general in-
dividual social capital, i.e. social capital research about general populations, that
does not focus on a particular life domain. The logic and theoretical rigor behind
the instrument make it possible to develop a Position Generator for every society in
which occupations, occupational prestiges and/or job-related socioeconomic indices
have been catalogued. These characteristics make the instrument very appealing for
comparisons of returns to social capital between populations.
It must be kept in mind however that the original idea of operationalisation
behind the construction of the Position Generator implies clear theoretical restric-
tions. Lin (2001a:45-46) suggested that individual actions accomplished with the
help of social capital can be classified into instrumental actions (gaining resources),
and expressive actions (maintaining resources). The operationalisation of social re-
source measurement in Position Generator measures is traditionally moulded in access
to higher occupational prestiges and access to diverse networks (see also section ‘in-
dicator construction’). These are useful abstractions to characterise networks helpful
in the accomplishment of instrumental actions: finding a (better) job, a house, etc.
For the investigation of other social capital questions, such measures are less suitable.
In expressive actions, expected returns from social capital are e.g. the reception of
personal support, and the sharing of sentiments (Lin, 2001a:45). Such outcomes are
less obviously a result from access to prestige-rich positions; there is no reason to
believe that network members in more prestigious occupations are also more directly
supportive in expressive actions. Lin (2001a:63) already remarked that having only
ties of high status does not meet many different life needs; support in the form of
3
practical assistance may especially come from network members in lower positions.
Also, the argument that alters in powerful positions are more influential and more
likely to provide access to resources in their network is less relevant for expressive
actions, since e.g. socio-emotional support from ‘friends of friends’ is generally not
useful. Position Generator indicators of network diversity that do not refer to oc-
cupational prestiges may be more valid for studying expressive actions. It could be
argued that more diverse networks give better access to any kind of social resource,
since they include more different alters, each with different personal resource collec-
tions and different relationships to a focal individual. Yet, the expected relationship
between diversity in network prestige, occupational diversity and personal support
remains a rather indirect one.
Because of its focus on accessing network members holding occupational titles,
the Position Generator also ignores access to network members who have positions
in society that are traditionally not associated with occupational prestiges: home-
makers, the unemployed, retired people, and younger people still in education. While
not having a classifiable occupation, such network members can be valuable social
capital for expressive actions; they can all contribute attention, care, accompaniment,
love, and various other resources incorporated in their human and cultural capital.
The presence of these resources is mostly independent of job title. Therefore, when
we aim to measure ‘the’ social capital of the general population across the general
life domain using only the Position Generator instrument, measurements will result
in underestimations of specific parts of social capital.
In this contribution, we aim to begin an answer to the question for which so-
cial capital research question which measurement instrument is useful. We do this by
using the Position Generator as a reference point, and subsequently observe for which
questions other models and measures may be more suitable. We will compare Posi-
tion Generator measures with indicators constructed from alternative social capital
measurement instruments, and in addition investigate the inter-relationships between
4
the various measures that can be calculated from Position Generator data.
2 available instruments
The Position Generator is a measurement method for the social capital of individuals
from a class of models that start operationalisation from specific theoretical choices.
First of these choices is the inclusion of indicators for all three dimensions of social
capital that have been established as essential for measurement (Flap, 2002; Lin,
2001b): the presence of alters, the resources of these alters, as well as the availability
of these resources to a focal individual. Furthermore, it includes an emphasis on the
construction of ‘access’ type measures, that indicate potentially available, positive
social resources embedded in personal social networks, but that do not consider their
actual use or application in individual actions. Such a separation between studying
access and use avoids confounding social capital measurements with individual needs
and other contextual variables (Flap, 2002; Lin 2001a, Van der Gaag & Snijders,
2004a). In its aim to be ‘content free’ (Lin et al, 2001), the Position Generator is also
one of several social capital measurement instruments designed to cover the ‘general’
life domain of the modern western individual (see also Lin & Erickson, this volume),
without considering specific areas of goal attainment, life domains, or subpopulations.
Other measurement instruments for social capital complying with these choices
are versions of the Name Generator / interpreter method and the Resource Gener-
ator. The extensive social network inventory performed with the Name Generator
/ interpreter is the oldest measurement method for social capital, and has been ap-
plied by many researchers. While various types of name generating questions have
been tested (e.g. Van Sonderen et al, 1990), the ‘exchange’ type Name Generator
proposed by McCallister & Fischer (1978) eventually found its widest use—its most
famous example being the single ‘core’-network identifying GSS-item “with whom do
you talk about personal matters?” (see e.g. Burt, 1984; Marsden, 1987). For social
5
capital research the Name Generator / interpreter can provide detailed social network
and social capital information, but its costs may be high (see also Lin & Erickson,
this volume), while for many research questions it may also retrieve much superfluous
data (Van der Gaag & Snijders, 2004a). The Resource Generator (Snijders, 1999;
Van der Gaag & Snijders, 2004b) offers a new development in measuring social cap-
ital, by using a ‘checklist’: in an interview situation access is checked to of a list of
useful and concrete social resources for which exchange is acceptable. This method
combines the economy of the Position Generator with the thoroughness and content
validity of the Name generator / interpreter method. While its data are concrete and
its administration is quick, its construction proves to be challenging, and bound to a
specific population (Van der Gaag & Snijders, 2004b).
While Position Generator, Name Generator, and Resource Generator instru-
ments operate from the same theoretical perspective, an overall comparison showed
that each instrument emphasises different aspects of social capital; in addition, mea-
sures from each instrument have distinctive predictive value on specific outcomes of
social capital (Van der Gaag & Snijders, 2003). While these outcomes emphasise that
a social capital measurement instrument needs to be carefully chosen, it also tells us
that each instrument has its own merits. In this contribution, we will further specify
which.
3 data and methods
For the investigation of relationships between three social capital measurement mod-
els we analyse data of the “Survey on the Social Networks of the Dutch” (SSND),
which were collected for this purpose in 1999-2000. Specially trained interviewers
administered questionnaires in the respondents’ homes, with interviews lasting one
hour and fifty minutes on average (questions of other research projects were also
included). The sample (N=1,004), collected in 40 randomly selected municipalities
6
across the country, consisted of two subsamples of the adult population (aged 18-65)
for the Netherlands. In the initial sample, only wage-earning individuals were selected
(N=500); in an additional sample, all agreeing to an interview were included. This
resulted in an over-representation of wage-earners in the sample. The response rate
for the combined, final sample is 40% (for a more detailed description of the sample
see Volker & Flap, 2004).
In the SSND questionnaire, a set of 13 exchange type Name Generator / in-
terpreter questions (see appendix, Table A) was based on many earlier investigations
(e.g. Fischer, 1982; for a detailed description of all questions and interview procedure
see Van der Gaag & Snijders, 2003). A 33-item Resource Generator was newly devel-
oped for this purpose (see appendix, Table B and Van der Gaag & Snijders, 2004b).
The set of 30 Position Generator items central to our investigations (Table 1) was
based on earlier research in the Netherlands (Boxman et al, 1991; Moerbeek, 2001)
and the former GDR (Volker, 1995; Volker & Flap, 1999).
Table 1 about here
It was assumed that this set of occupations was representative for the Netherlands
in 1999. The occupations were coded using the 1992 standard classification for occu-
pations of the Dutch Central Bureau of Statistics (CBS, 1993), and linked to Sixma
and Ultee’s 1992 occupational prestige measures and international ISEI measures for
socioeconomic status (Bakker et al, 1997; see Table 1). These measures have a slightly
different interpretation: prestige measures refer more to “social rewards people can
expect in human interactions”, while socio-economic indices refer more directly to
human resources and economic rewards (Ganzeboom & Treiman, 2003; p.173). Each
of the measures therefore focuses on distinct aspects of ‘access to occupations’ as
intended by Lin (2001a/b): while prestige measures could be argued to indicate in-
fluence attached to higher positions in society, socioeconomic measures may be closer
to indications of (social) resource collections associated with occupations. Also be-
7
cause ISEI measures enable better comparisons with other data, in the remainder
of this chapter all Position Generator measures are based on ISEI measures.1 For
reasons of fluidity, we will however use the term ‘prestige’ for these indications.
The general question for the Position Generator was whether the respondent
‘knew anyone in each of these occupations’ (whereas Table 1 shows the occupations
in order of occupational prestige, in the questionnaire the order was randomised (see
column ‘item #’)). As a criterion of ‘knowing’ a person, the respondent was asked
to imagine that when accidentally met on the street, he or she would know the
(first) name of that person, and both could start a conversation with each other. A
second question asked to identify the person as an acquaintance, a friend, or a family
member holding that occupation; the exact interpretation of these roles was left up
to the respondent. Responses to the items were coded as (0) no person at all (1) an
acquaintance (2) a friend or (3) a family member. In order to save interview time, only
the strongest relation was coded following this increasing order of tie strength. Thus,
when a respondent mentioned an acquaintance in response, it was asked whether he
or she also knew a friend or family member; when a friend was mentioned, whether
a family member in that position was also known, and when a family member was
mentioned as a first response, the interviewer moved to the question about the next
occupation. Different from other Position Generator studies, this could result in
information implicitly including an assumption of a positive effect of accessing social
capital through stronger ties. To avoid this bias, for the calculation of social capital
indicators only dichotomised answers were used: (1) ‘knowing at least one person, in
any relationship’ or (0) ‘no person at all’.1Ultee & Sixma prestige and ISEI values for the 30 occupations in the SSND Position Generator
are highly correlated (r=0.91; p ≤0.001); the same analyses with Ultee & Sixma prestige measures
(reported in Van der Gaag, 2005: ch. 6) show almost the same results.
8
4 Position Generator responses and measures
4.1 distribution of initial responses
The distribution of initial responses to the Position Generator items is shown in Table
1. Averaged over the 30 occupations, 50% of the respondents say to know at least
one alter in this occupation, through any relationship. The most popular items (with
the most positive responses) are nurse, teacher, mechanic, and director of a company.
Occupations that are least often accessed are trade union manager, engine driver,
foreman, and postman. There is no relation between the prestige of the occupations
and their overall popularity (r=0.19; p=0.33).
On average, 37% of the occupations was accessed through acquaintances, 22%
through friends, and 41% through family relationships (see Table 1, right columns).
For most occupations ‘friends’ are about 20% of the relationships that give access
to these positions; occupations more often accessed though ‘acquaintances’ are trade
union manager, estate agent, police officer, insurance agent, hairdresser, postman,
and cleaner. Family members gave access to the most popular occupations: manager,
director of a company, teacher, nurse, and sales employee. On average, family rela-
tionships gave access to more different occupations (6.39) than acquaintances (5.19)
and friends (3.35).
4.2 indicator construction
Irrespective of the used type of questions, several notions have been developed to
express the beneficiality of social capital. These have been described as social cap-
ital volume or extensity, diversity, and the presence of resources of specific quality
in social networks. Position Generator, Name Generator and Resource Generator
instruments all enable the calculation of measures based on these notions (Van der
Gaag & Snijders, 2004b).
Since the introduction of the Position Generator, the construction of social
9
capital indicators from this instrument in particular has remained largely standard-
ised. Three deductive measures, directly derived from Lin’s social capital propositions
(Lin, 2001a:61-63), are also the measures most often used. Highest accessed prestige
is currently the only regularly used social capital measure referring to specific social
resource quality. It is based on the hypothesis that positive social capital effects result
from accessing network members with high prestiges (Lin, 2001a:62). Two Position
Generator measures are diversity measures, based on the idea proposed by several
authors (Burt, 1992; Erickson, 1996, 2003; Granovetter, 1973; Lin, 2001a; see also
Erickson, this volume) that specific resources and relationships can be located and
accessed more succesfully when more differentiation in resources and relationships is
present in the network, hence resulting in better social capital. Range in accessed
prestige is calculated as the difference between highest and lowest accessed prestige,
while number of different positions accessed is the total number of occupations in
which a respondent says to know anyone.
In addition to these often used measures, we calculated two additional ones.
The average accessed prestige, a measure introduced by Campbell et al (1986) is
calculated as the mean of the prestige of all occupations in which the respondent says
to know anyone. Total accessed prestige is a social capital volume measure used by
Hsung & Hwang (1992; cf. Lin, 1999), and calculated as the cumulative prestige of
all accessed occupations.
An alternative way to construct measures may be performed in an inductive
rather than a deductive fashion: multiple sets of domain-specific social capital mea-
sures can be constructed by identifying latent traits in social capital data (Van der
Gaag & Snijders, 2004a/b). Models developed from Item Response Theory (IRT)
provide the most suitable methodology to construct such measures, since social capi-
tal data typically have an ordinal level of measurement with few categories (Van der
Gaag & Snijders, 2004a/b). Within IRT a distinction can be made between cumu-
lative and unfolding models (see e.g. Van der Linden & Hambleton, 1996). For the
10
identification of latent traits in social capital, cumulative models are closest in mean-
ing to the idea of having ‘more’ or ‘less’ access to subcollections of social capital (Van
der Gaag & Snijders, 2004b). Therefore, we chose to perform explorative analyses
with non-parametric cumulative ‘Mokken’-scaling analyses (Mokken, 1996; Sijtsma
& Molenaar, 2002) with special software MSP (Molenaar & Sijtsma, 2000), for all
sets of social capital measurement items in the SSND data. In the scaling procedure,
there is a trade-off between reliability and homogeneity; we chose to focus on scales
with sufficient reliability, resulting in scales with relatively weak homogeneity. These
analyses result in the identification of subscales with a cumulative character. This
means that on a population level we can expect that respondents who access very
unpopular items in a scale, they will also access more popular items in the same scale
(this will become clear in the results below).2
An exploration of SSND Position Generator data identified two scales. High
prestige social capital is a scale indicating access to a scientist, policy maker, lawyer,
medical person, higher civil servant, manager, director of a company, and teacher
– since the scale is cumulative, respondents who access a scientist (least accessed
item) will also access the other positions (similarly, respondents who access a policy
maker (second least accessed item) will also access more popular items lawyer, doctor,
manager, etc.). Low prestige social capital is a cumulative scale indicating access to an
engine driver, cleaner, unskilled labourer, hairdresser, sales person, and construction
worker.3
2The quality of these subscales can be judged as follows. Scale homogeneity (or unidimensionality)
is expressed with Loevinger’s H, that can reach a maximum value of 1 (perfect homogeneity), but
can also reach negative values (Loevinger, 1947). Scales with H ≥ 0.4 are regarded as medium strong
scales, and ≥ 0.5 as strong scales (Mokken, 1996). Within each scale, an item-specific homogeneity
value Hi indicates its fit into the scale. The reliability of cumulative scales is expressed with coefficient
rho, that can reach values between 0 and 1; values from about 0.60 are considered sufficiently reliable
(Molenaar & Sijtsma, 2000).3The Position Generator items also form a bipolar unfolding scale for the SSND data; the two
11
4.3 indicator characteristics
In Table 2, the distribution characteristics of all calculated Position Generator mea-
sures are shown.
Table 2 about here
Clearly, the distribution of some measures seriously deviates from normality, which
can be a disadvantage in their use as variables in predictive analyses (Table 2, column
‘skewness’). For the most skewed measures, ‘highest accessed prestige’ and ‘range in
accessed prestige’, this is caused by the fact that there are only 30 occupations in
the Position Generator, as a result of which these measures can only show a limited
number of different values. The deductive measures show less variation in scores
than inductive measures (see Table 3, column ‘variation’). Correlations between the
measures are almost all positive.
Table 3 about here
Highest accessed prestige is substantially positively correlated with almost all other
measures. Because it is almost uncorrelated with low prestige social capital, these
measures clearly refer to a separate, resource-rich and possibly influential domain
within social capital (Table 3). This is also shown in the correlations between aver-
age accessed prestige and the inductive measures: a higher average accessed prestige
means better access to higher prestige social capital, but less access to lower prestige
occupations. Table 3 also shows that average accessed prestige is relatively indepen-
dent from social capital diversity: it is unrelated to range of accessed prestige and
number of items accessed. Finally, the measure total accessed prestige is positively
correlated with all other measures, and even almost identical to number of accessed
positions.
cumulative scales are reconfigurations of both ends of this scale. For reasons of parsimony, these
analyses are not discussed in this chapter.
12
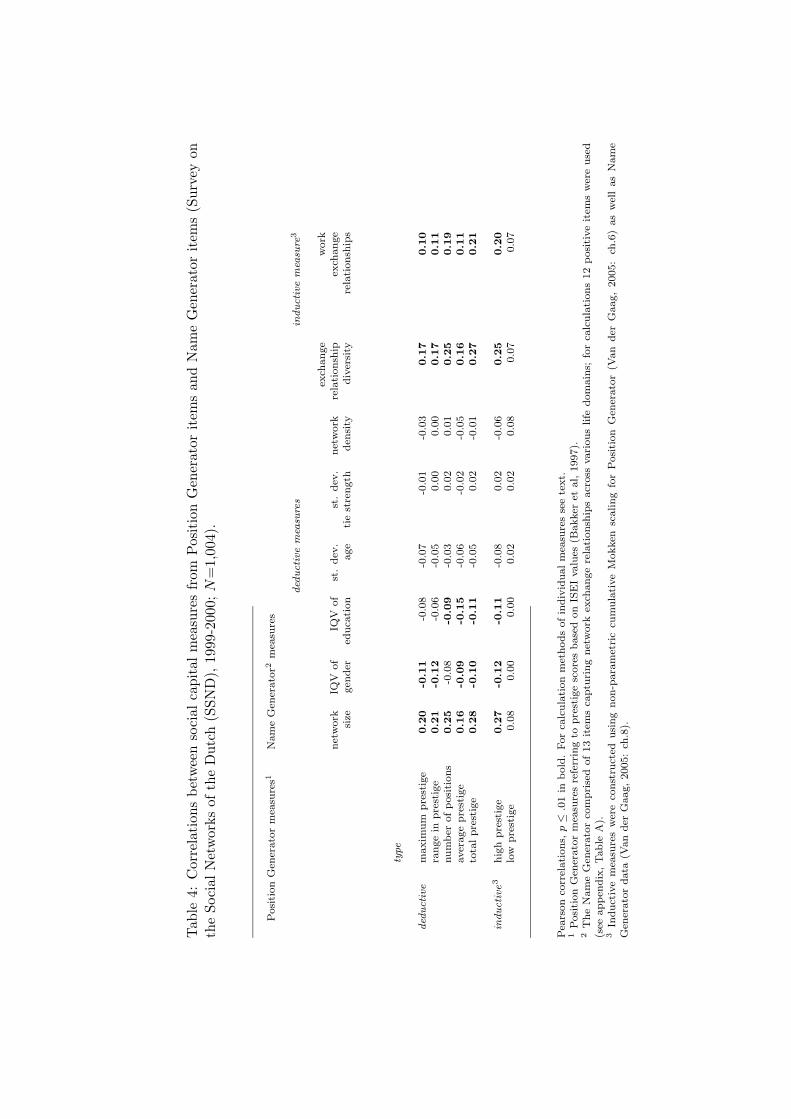
5 comparison with Name Generator measures
For comparison with Position Generator measures, several social capital indicators
were computed from Name Generator data (see Table 4). Since one Name Generator
question (item 3, see appendix Table A) referred to negative social relationships, the
responses to this question were left out of all calculations.
Table 4 about here
Network size is a typical measure of social capital volume, counting the total number
of people mentioned in response to the 12 items. Seven other measures are indicators
of social capital diversity, based on alter or relationship characteristics previously dis-
cussed by other authors: gender, education, age, and tie strength (see e.g. Campbell
et al, 1986; Campbell & Lee, 1991). For gender and education, network diversity
measures were calculated as the Standardised Index of Qualitative Variation (IQV)
introduced by Mueller & Schuessler (1961; cf. Agresti & Agresti, 1978). For diver-
sity of age and tie strength network-level standard deviations were calculated. To
calculate the measure indicating network diversity of tie strength, first a tie strength
indicator was constructed as the unweighted sum of the perceived liking, trust and
intensity of relationships (α=0.85)4, similar to Boxman (1992:101-102).
Seen from Burt’s (1992) perspective on structural holes, a measure of network
density should work as an inverse indicator of network diversity: more disconnected
networks give access to more diverse relationships. A density measure was calculated
as the fraction of positive relationships between the first mentioned alters to five of
the Name Generator questions (for a more detailed calculation of the density mea-
sure see Van der Gaag & Snijders, 2003). For the construction of a final network
diversity measure it was assumed that each Name Generator item also referred to the
exchange of specific resources. Therefore exchange relationship diversity was defined4These relationship attributes were all part of the name interpretation part of the Name generator
procedure.
13
as a measure indicating the number of different name generator questions in answer
to which at least one alter was mentioned (i.e. the sum score of 12 dichotomised
Name Generator items, see appendix Table A). An inductive cumulative scaling anal-
ysis (see section 4.2) resulted in a homogenous, reliable subscale for this measure,
indicating access to a diversity of work relationships in specific (i.e. the sum score of
work-related Name Generator items 1, 2a, 2b, 4, and 5; see appendix, Tables A and
C, and Van der Gaag, 2005: ch.8).
An overview of all correlations between Position Generator and Name Gen-
erator measures (Table 4) shows that the outcomes of both measurement models
have little to do with each other. Higher maxima, ranges, averages and totals of ac-
cessed prestige are positively associated with larger networks; the same is true for the
number of different exchange relationships present in the social network. Network
density, age, and tie strength composition of networks are almost all unrelated to
accessed prestige or slightly negatively correlated: networks with higher prestiges are
somewhat less diverse in gender, education, and age composition. By contrast, the
inductive measure indicating access to lower prestige occupations has low correlations
with all other measures.
5.1 comparison with Resource Generator measures
From the Resource Generator model only one deductive measure was calculated: the
total number of resource items accessed. Being the sumscore of all items, this measure
has characteristics of both a social capital volume and diversity indicator (see Table
5).
Table 5 about here
Several domain-specific social capital measures were constructed in an inductive fash-
ion. Non-parametric cumulative scaling analysis (see section 4.2) identified four social
capital subscales referring to specific resource collections present in social networks:
14

prestige and education related social capital, political and financial skills social capital,
personal skills social capital, and personal support social capital. All these scales have
medium homogeneity values for H, and all except one show sufficient reliability (see
appendix Table C and Van der Gaag, 2005: ch.7; Van der Gaag & Snijders, 2004b).5
Measures from the Resource Generator model are more in accordance with
Position Generator measures than those from the Name Generator; overall correla-
tions are positive and of medium size (Table 5). Networks in which higher maxima,
ranges, averages and totals of prestige are accessed also give access to more diverse
social resources (Table 5). There is however variation in the extent to which such
networks give access to various kinds of more domain-specific social capital. Position
Generator measures are most related to prestige and education related resources, and
less to personal skills social capital.
6 discussion
In this study we investigated the measurement properties of the Position Generator
for a Dutch population sample by constructing several measures from its data, and
making internal and external comparisons of their measurement properties using two
alternative measurement instruments. In this discussion, we will focus on two main
questions. 1) which measures should be considered using the Position Generator
model? 2) which measurement model is most suitable for which research question?
6.1 position generator measures
Similar to earlier findings (Lai et al, 1998; Lin et al, 2001) the three ‘traditional’
Position Generator measures (highest accessed prestige, range in accessed prestige,5The reported four scales are those that showed sufficient reliability. The explorative scaling
procedure also identified more fragmented social capital domains, for which additional scales could
have been constructed if more different, appropriate items would have been included in the instrument.
15
and number of positions accessed) are substantially positively correlated with one
another: networks with higher prestiges also show a larger diversity in occupations.
When all three Position Generator measures are used in predictive analyses, this can
cause multicollinearity problems. We can think of three general solutions to this
problem.
First, as has been proposed and performed by other authors, by calculating
an unrotated principal component over all three measures as a single social capital
indicator (see Lin et al, 2001; Lin, this volume (?)). However, when correlations
between Position Generator measures are very high, a second solution could be to
simply omit one or two measures from analyses. For example, in our data measuring
an upward reach in social capital besides resource variety in another measure (or
vice versa) seems to have limited added value. A third solution is to select a single
measure for subsequent analyses. Based on our results, two measures are candidates.
Total accessed prestige could be a good choice, since this measure is highly positively
correlated with all other Position Generator measures, and summarises these similar
to an unrotated, first principal component. In addition, it can also have the advantage
that its distribution does not deviate much from normality, which for some analyses
and interpretations may be problematic with the measures highest accessed prestige,
range in accessed prestige.
More based on theoretical grounds, the use of one single Position Generator
measure is selected in the works of Erickson (1996, 1998, 1999, 2004), where gener-
ally only the number of accessed positions is used in analyses. In terms of validity,
this is the most content-free of all Position Generator measures. As stated in the
introduction, highest accessed prestige and range in accessed prestige are social cap-
ital indicators focusing strongly on the use of social capital in instrumental actions;
diversity in accessed occupations however can also be more generally interpreted as
access to a variety of people controlling various resource collections. A good practical
argument to use this single measure is that is the simplest for the researcher, because
16
it does not involve the choice and application of a socioeconomic index or prestige
measure associated with occupations.
The social capital researcher should be aware however that using a single
social capital measure a priori can mean a loss of potentially interesting information.
After all, high correlations between Position Generator measures may not be found
for every population. In earlier contributions we have emphasised that including
opportunities for more specific social capital measurement, and therefore the use of
multiple measures, is more than welcome and can lead to more specific predictions
(Van der Gaag & Snijders, 2004a). Therefore, when Position Generator measures
do correlate highly, a more sophisticated and more informative third option is to
choose differently constructed sets of indicators. In our data, a Position Generator
measure relatively independent from other measures is average accessed prestige: it is
only moderately correlated with range in accessed prestige, and number of positions
accessed. This measure could therefore be a valuable addition to the other, more
often used measures. It could also be considered as a replacement for the measure
highest accessed prestige. Its theoretical interpretation is not identical, but close to
“the best resource accessed through social ties” (Lin, 2001a:62), and for some social
capital questions a reformulation to “good resources accessed through social ties” may
also be sufficient. For some analyses and interpretations, the average accessed prestige
measure also has the advantage that its distribution is less skewed than that of highest
accessed prestige. A disadvantage, however, is that other analyses on our data showed
that average accessed prestige is also more correlated to socio-demographic variables
than other Position Generator measures (Van der Gaag, 2005; ch.6), and therefore a
less independent social capital indicator.
Other ways to make Position Generator data more specific and informative for
analyses are also available. In this chapter and elsewhere (Van der Gaag & Snijders,
2004a), we have already suggested that dimensional analyses of measurement items,
leading to more domain-specific measures in an inductive way, may lead to better
17
predictions of the goal-specificity of social capital. Scaling analyses performed on
Position Generator data (Van der Gaag, 2005: ch.6 and the present chapter) showed
that multiple domains can be distinguished in accessed occupations. Differential
access to each of these domains may be directly linked to access to the specific resource
collections of the holders of these occupations. Specific measures for access to each
of these domains may therefore be promising social capital indicators. However, in
our data the structure of social capital measured this way is fragmented, and it is
difficult to construct reliable, homogenous measurement scales from a limited number
of Position Generator items not specifically designed for such analyses. However,
Volker & Flap (elsewhere in this volume) follow a different approach to this problem,
by disaggregating the occupational prestiges of Position Generator items into separate
indicators for specific financial social resources and cultural social resource collections.
When the social capital researcher considers the use of the Position Generator
but is still in the stage of planning data collection, another innovation may also be
considered. Erickson (2004) used a Position Generator with separate questions for
knowing men and women in several occupations. Based on the idea that knowing a
man or woman in a certain position may give access to different resources, this is also
an option to retrieve more specific social capital information from survey questions.
The Position Generator used in this chapter is also subject to improvements.
When respondents are asked to report ties in each of the categories family, friends,
or acquaintances, usually the widest access to occupations is found through acquain-
tances (Erickson, 1996; Volker & Flap, 1999). Also in the Netherlands acquaintances
are the most diverse and numerous fraction of social networks (Van der Gaag, 2005:
ch.5, ch.8). The finding in the present chapter that the widest variation of occupa-
tions is accessed through family members must therefore result from the used inter-
view methodology. In retrospect, coding only the strongest relation through which
positions are accessed is a design flaw that limits the researcher in options for analyses
and hampers the interpretation of results, and should be avoided.
18
A final advice for future users of the Position Generator is to include a large
enough number of occupations in the instrument. This has the regular advantages
of more reliable estimations of measures, but the use of larger numbers of items may
also lead to less skewed distributions of some measures (see above). Finally, the
suggested dimensional analyses on Position Generator items are only feasible when
larger numbers of items are available: at least 15–20, but preferrably more.
6.2 comparison of measurement models
We also considered other social capital measurement instruments besides the Position
Generator. An overview of the relationships between social capital measures from dif-
ferent measurement instruments showed that these refer to different aspects of social
capital, or—more carefully put—at least tap different cognitions from respondents,
since their mutual correlations are low. Especially relationships between Position
Generator measures and Name Generator measures were found to be weak.
In the Netherlands, having a social network with more diverse members re-
garding age, gender, education and the strength of relationships maintained does not
seem to be related to having access to network members with higher prestiges. Only
having a larger social network is correlated with Position Generator measures; larger
networks contained alters with higher (average) prestiges, larger ranges in prestige,
and more variety in occupations, a finding also reported by others (Lin, 1999; Lin et
al, 2001). However, some of these findings are also very logical, and hence somewhat
trivial: if all relationships present in the population would be randomly distributed
over networks, larger networks would also show higher maxima and ranges of pres-
tige, because they have a larger chance to include relationships with the highest and
lowest prestiges, respectively. Also, the correlation between social network size and
the diversity of potential exchanges with network members is only partly interest-
ing: within a certain range, it is logical that giving a positive answer to more Name
Generator questions leads to more network members listed.
19

More interesting for social capital research is that our results show that larger
networks include higher average prestiges of network members, and that networks
including persons with higher prestiges and wider ranges in prestige show more variety
in both network exchanges and access to more specific collections of concrete social
resources. This is emphasised by the finding that accessing lower prestige social capital
shows much smaller correlations with access to various resources. Access to prestige-
and education-related social capital is most strongly related to Position Generator
measures, which emphasises that the Position Generator model (consistent with its
purpose) puts more emphasis on measuring resources that figure in the ‘big issues’
in social capital related to instrumental action: unequal distributions in human and
financial resources underlying social mobility and inequality. Measures of personal,
instrumental assistance on a practical level show lower correlations with Position
Generator measures, while the lowest correlations are found with general skills social
capital. Since most people in our sample indicated access to these social resources, this
can be understood as that access to them is independent from other characteristics
of networks members: they can easily be found in any network.
Summarised, these findings make the idea that ‘larger networks are better’
somewhat more explicit in terms of actual resources, although an interpretation of
the causal order of these associations must remain tentative with the present, cross-
sectional data.6
6.3 conclusion: a proposed measurement strategy
Since each social capital measurement instrument taps information of different quality
within a general population sample, the social capital researcher should be very aware
of the choice of instruments when planning measurements for specific studies. Based
on our findings, in Table 6 we suggest a tentative, parsimonious measurement strategy
for social capital researchers.6A second wave of the SSND data collection is under development.
20
The most general questions, about whether there is any effect of the presence
of social networks on an outcome of interest, can be answered with any instrument.
In our results, network size, all Position Generator measures, and most Resource
Generator measures are all positively correlated. If our findings can be replicated
for other populations, such measures should all be able to detect the most basic of
social capital effects. This could then also be a confirmation for the use of older
datasets, that often have been collected with name generators. However, it should be
reminded that single social capital indicators cannot detect whether there are either
goal specific, or more general ‘castor oil’ effects of social capital (Flap, 2002; Van der
Gaag & Snijders, 2004a). For the collections of new data for general questions, the
Position Generator may be the most economical choice, since its construction and
administration are the easiest of all instruments. Of its derivative measures number
of accessed positions is the most content free and easiest to construct, and therefore
the most useful for general questions.
When studying effects of social capital on instrumental action in specific, the
use of a Position Generator and the calculation of multiple, derivative measures is a
good choice. Our results showed that its derivative measures are also correlated to the
actual presence of available social resources in social networks, but are unrelated to
network structure and network relationship heterogeneity. When separate social cap-
ital effects are expected from access to network prestige and network variety, choosing
alternatively constructed indicators from the Position Generator (such as the average
accessed prestige) may offer some methodological advantages over traditionally used
measures. When a parsimonious, single measure version is desired, the total accessed
prestige measure or an unrotated principal component over various measures are good
measurement choices. When new data are going to be collected, versions with gender
specific and/or larger numbers of items have advantages.
For the investigation of expressive actions with social capital, the Position
Generator offers limited possibilities. If it is the only instrument available or af-
21
fordable, using the single measure number of accessed positions appears to be the
most valid, since it refers the least to occupational prestiges in specific. However,
even then underestimations of social capital useful in expressive actions are possible
(see introduction). For the investigation of social capital in expressive actions it may
therefore be worthwhile to construct a version of a Resource Generator, listing various
social resources possibly useful in any domain of individual goal attainment. From
the resulting data, separate domain-specific measures may then be constructed in a
deductive or inductive fashion (see Van der Gaag & Snijders, 2004a). For parsimo-
nious use in analyses, also a single sumscore measure over applicable items may be
used.
Finally, the social capital researcher may want to investigate both ‘castor oil’
and goal-specific effects on outcomes of interest without a special interest in either
instrumental or expressive actions. This most elaborate social capital question may
be performed with either a Resource Generator or a Name Generator / interpreter
combination; of these the Resource Generator is the most economic in use. When
general social capital is studied, the construction of both instruments can be a chal-
lenge, however with the danger of incomparability between studies. Conducting an
elaborate Name Generator study with various name interpretation questions (that
may include information about any social resource) also remains an option. Such
queries can be customised to provide answers to questions about any social capital
dimension: alters, relationships, resources, and the availability of resources. When
specific questions about the influence of network structure on social capital outcomes
need to be studied, it is also the only measurement option, since it is the only method
that identifies network members. However, its costs remain considerable.
REFERENCES
Agresti, A.; Agresti, B. (1978) Statistical analysis of qualitative variation. Pp.204-237 in:Schuessler, K.F. (eds.) “Sociological Methodology.” San Francisco: Jossey-Bass.
22

Bakker, B.; Sieben, I.; Nieuwbeerta, P.; Ganzeboom, H. (1997) Maten voor prestige, sociaal-economische status en sociale klasse voor de Standaard beroepenclassificatie 1992.[Measures for prestige, socio-economic status and social class for the Standard occupa-tional classification 1992.] Sociale Wetenschappen 40:1-22.
Boxman, E. (1992) Contacten en carriere: Een empirisch-theoretisch onderzoek naar derelatie tussen sociale netwerken en arbeidsmarktposities. [Contacts and careers: anempirical-theoretical investigation of the relationship between social networks and labourmarket positions.] Amsterdam: Thela Thesis (Ph.D thesis, University of Utrecht).
Boxman, E.; De Graaf, P.M.; Flap, H.D. (1991) The impact of social and human capital onthe income attainment of Dutch managers. Social Networks 13:51-73.
Burt, R.S. (1984) Network items and the General Social Survey. Social Networks 6:293-339.
Burt, R.S. (1992) Structural holes: the social structure of competition. Cambridge MA:Harvard University Press.
Campbell, K.E.; Lee, B.A. (1991) Name generators in surveys of personal networks. SocialNetworks 13:203-221.
Campbell, K.E.; Marsden, P.V.; Hurlbert, J.S. (1986) Social resources and socioeconomicstatus. Social Networks 8:97-117.
CBS (Central Bureau of Statistics) (1993) Standaard beroepenclassificatie 1992. [Standardoccupational codes for 1992.] ’s-Gravenhage: SDU uitgeverij/ CBS-publikaties.
Erickson, B.H. (1996) Culture, class, and connections. American Journal of Sociology102:217-251.
Erickson, B.H. (1998) Social capital and its profits, local and global. Paper presented at theSunbelt XVIII and 5th European International Conference on Social networks, Sitges,Spain.
Erickson, B.H. (2001) Good networks and good jobs: the value of social capital to employersand employees. Pp.127-158 in: Lin, N.; Cook, K.; Burt, R.S. (eds.) “Social capital:theory and research.” New York: Aldine De Gruyter.
Erickson, B.H. (2003) Social networks: the value of variety. Contexts 2:25-31.
Erickson, B.H. (2004) The distribution of gendered social capital in Canada. Pp.27-50in: Flap, H. & Volker B. (eds.) ”Creation and returns of Social Capital.” London:Routledge.
Fischer, C.S. (1982) To dwell among friends. Chicago: The University Of Chicago Press.
Flap, H. (2002) No man is an island. Pp.29-59 in: Lazega, E.; Favereau, O. (eds.) “Conven-tions and Structures.” Oxford: University Press.
Flap, H.; De Graaf, N.D. (1986) Social capital and attained occupational status. NetherlandsJournal of Sociology 22:145-161.
23
Ganzeboom, H.B.G.; Treiman, D.J. (2003). Three internationally standardised measures forcomparative research on occupational status. Pp.159-193 in: Hoffmeyer-Zlotnik, J.H.P.& Wolf, C. (eds.) “Advances in Cross-National Comparison. A European WorkingBook for Demographic and Socio-Economic Variables.” New York: Kluwer AcademicPress.
Granovetter, M. (1973) The strength of weak ties. American Journal of Sociology 78:1360-1380.
Hsung, R-M; Hwang, Y-J. (1992) Job mobility in Taiwan: job search methods and contactsstatus. Paper presented at the Sunbelt XII International Conference on Social networks,San Diego, US, February.
Lai, G.W.F.; Lin, N.; Leung, S.Y. (1998) Network resources, contact resources, and statusattainment. Social Networks 20:159-178.
Lin, N. (2001a) Social capital: a theory of social structure and action. Cambridge: Cam-bridge University Press.
Lin, N. (2001b) Building a network theory of social capital. Pp.3-30 in: Lin, N.; Cook, K.;Burt, R.S. (eds.) “Social capital: theory and research.” New York: Aldine De Gruyter.
Lin, N. (1999) Social networks and status attainment. Annual Review of Sociology 25:467-487.
Lin, N.; Dumin, M. (1986) Access to occupations through social ties. Social Networks 8:365-385.
Lin, N.; Fu, Y.; Hsung, R. (2001) The Position Generator: measurement techniques forsocial capital. Pp.57-84 in: Lin, N.; Cook, K.; Burt, R.S. (eds.) “Social capital: theoryand research.” New York: Aldine De Gruyter.
Loevinger, J. (1947) A systematic approach to the construction and evaluation of test ofability. Psychological monographs 61(4).
Marsden, P.V. (1987) Core discussion networks of Americans. American Sociological Review52:122-131.
McCallister, L.; Fischer, C. (1978) A procedure for surveying personal networks. SociologicalMethods and Research 7:131-148.
Moerbeek, H. (2001) Friends and foes in the occupational career. Nijmegen: Ph.D disserta-tion.
Mokken, Robert J. (1996) Nonparametric models for dichotomous responses. Pp.351-367 in:Van der Linden, W.J.; Hambleton, R.K. (eds.) “Handbook of modern item responsetheory.” New York etc.: Springer.
Molenaar, I.; Sijtsma, K. (2000) User’s manual MSP5 for Windows: A program for Mokkenscale analysis for polytomous items. Groningen: ProGAMMA.
Sijtsma, K.; Molenaar, I.W. (2002) Introduction to nonparametric Item Response Theory.Thousand Oaks, CA [etc.]: Sage.
24
Snijders, T.A.B. (1999) Prologue to the measurement of social capital. La Revue TocquevilleXX:27-44.
Van der Gaag, M.P.J. (2005) The measurement of individual social capital. Groningen:Ph.D dissertation (forthcoming).
Van der Gaag, M.P.J.; Snijders, T.A.B. (2003) A comparison of measures for individual socialcapital. Paper presented at the conference “Creation and returns of Social Capital”;october 30-31, Amsterdam, The Netherlands.
Van der Gaag, M.P.J.; Snijders, T.A.B. (2004a) Proposals for the measurement of individualsocial capital. Pp.199-218 in: Flap, H.D. & Volker, B. (eds.) “Creation and returns ofSocial Capital.” London: Routledge.
Van der Gaag, M.P.J.; Snijders, T.A.B. (2004b) The Resource Generator: measurement ofindividual social capital with concrete items. Submitted to Social Networks.
Van der Linden, W.J.; Hambleton R.K. (1997) Handbook of modern item response theory.New York etc.: Springer.
Van Sonderen, E.; Ormel, J.; Brilman, E.; Van Linden van den Heuvell, Ch. (1990) A com-parison of the exchange, affective, and role-relation approach. Pp.101-120 in: Knip-scheer, C.P.M.; Antonucci, T.C. (eds.) “Social Network Research: Methodologicalquestions and substantive issues.” Lisse: Swets & Zeitlinger.
Volker, B. (1995) Should auld acquaintance be forgot...? Institutions of communism, thetransition to capitalism and personal networks: the case of East Germany. Amsterdam:Ph.D dissertation.
Volker, B.; Flap, H. (1999) Getting ahead in the GDR: social capital and status attainmentunder communism. Acta Sociologica 41:17-34.
Volker, B.; Flap, H. (2004) Social networks and performance at work: a study of the returnsof social capital in doing one’s job. Pp.172-196 in: Flap, H.D. & Volker, B. (eds.)“Creation and returns of Social Capital.” London: Routledge.
25
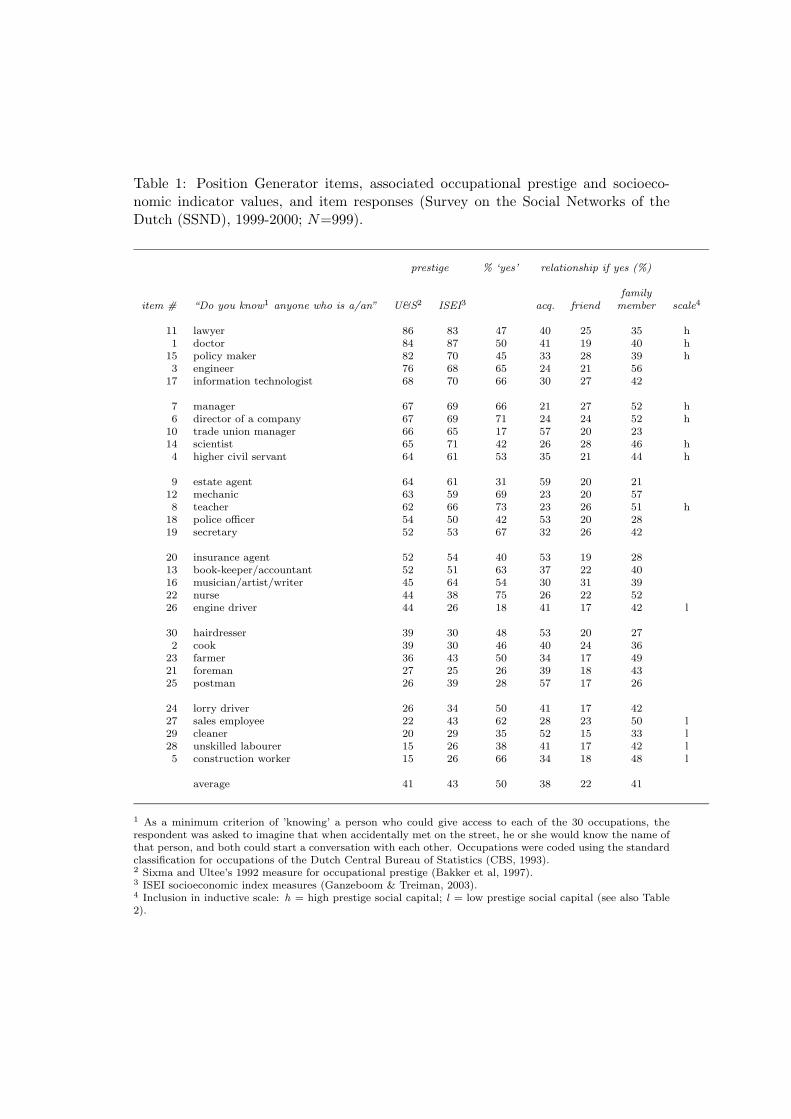
Table 1: Position Generator items, associated occupational prestige and socioeco-nomic indicator values, and item responses (Survey on the Social Networks of theDutch (SSND), 1999-2000; N=999).
prestige % ‘yes’ relationship if yes (%)
familyitem # “Do you know1 anyone who is a/an” U&S2 ISEI3 acq. friend member scale4
11 lawyer 86 83 47 40 25 35 h1 doctor 84 87 50 41 19 40 h
15 policy maker 82 70 45 33 28 39 h3 engineer 76 68 65 24 21 56
17 information technologist 68 70 66 30 27 42
7 manager 67 69 66 21 27 52 h6 director of a company 67 69 71 24 24 52 h
10 trade union manager 66 65 17 57 20 2314 scientist 65 71 42 26 28 46 h4 higher civil servant 64 61 53 35 21 44 h
9 estate agent 64 61 31 59 20 2112 mechanic 63 59 69 23 20 578 teacher 62 66 73 23 26 51 h
18 police officer 54 50 42 53 20 2819 secretary 52 53 67 32 26 42
20 insurance agent 52 54 40 53 19 2813 book-keeper/accountant 52 51 63 37 22 4016 musician/artist/writer 45 64 54 30 31 3922 nurse 44 38 75 26 22 5226 engine driver 44 26 18 41 17 42 l
30 hairdresser 39 30 48 53 20 272 cook 39 30 46 40 24 36
23 farmer 36 43 50 34 17 4921 foreman 27 25 26 39 18 4325 postman 26 39 28 57 17 26
24 lorry driver 26 34 50 41 17 4227 sales employee 22 43 62 28 23 50 l29 cleaner 20 29 35 52 15 33 l28 unskilled labourer 15 26 38 41 17 42 l5 construction worker 15 26 66 34 18 48 l
average 41 43 50 38 22 41
1 As a minimum criterion of ’knowing’ a person who could give access to each of the 30 occupations, therespondent was asked to imagine that when accidentally met on the street, he or she would know the name ofthat person, and both could start a conversation with each other. Occupations were coded using the standardclassification for occupations of the Dutch Central Bureau of Statistics (CBS, 1993).2 Sixma and Ultee’s 1992 measure for occupational prestige (Bakker et al, 1997).3 ISEI socioeconomic index measures (Ganzeboom & Treiman, 2003).4 Inclusion in inductive scale: h = high prestige social capital; l = low prestige social capital (see also Table2).
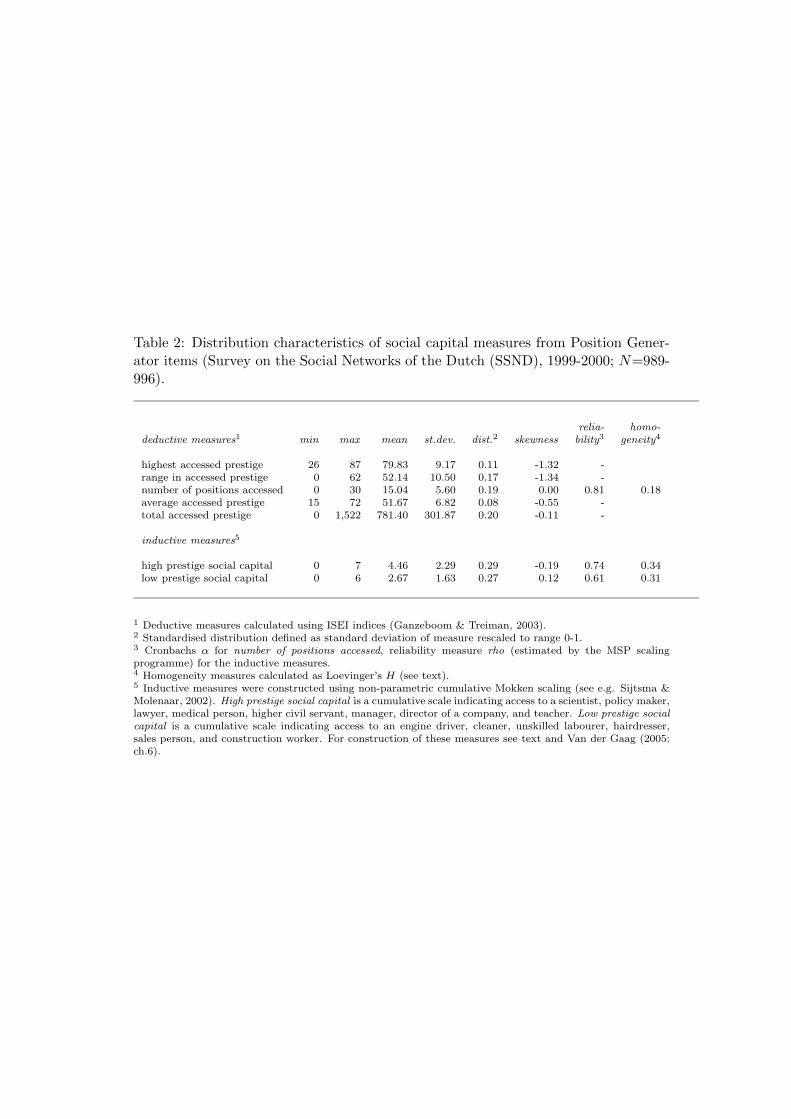
Table 2: Distribution characteristics of social capital measures from Position Gener-ator items (Survey on the Social Networks of the Dutch (SSND), 1999-2000; N=989-996).
relia- homo-deductive measures1 min max mean st.dev. dist.2 skewness bility3 geneity4
highest accessed prestige 26 87 79.83 9.17 0.11 -1.32 -range in accessed prestige 0 62 52.14 10.50 0.17 -1.34 -number of positions accessed 0 30 15.04 5.60 0.19 0.00 0.81 0.18average accessed prestige 15 72 51.67 6.82 0.08 -0.55 -total accessed prestige 0 1,522 781.40 301.87 0.20 -0.11 -
inductive measures5
high prestige social capital 0 7 4.46 2.29 0.29 -0.19 0.74 0.34low prestige social capital 0 6 2.67 1.63 0.27 0.12 0.61 0.31
1 Deductive measures calculated using ISEI indices (Ganzeboom & Treiman, 2003).2 Standardised distribution defined as standard deviation of measure rescaled to range 0-1.3 Cronbachs α for number of positions accessed, reliability measure rho (estimated by the MSP scalingprogramme) for the inductive measures.4 Homogeneity measures calculated as Loevinger’s H (see text).5 Inductive measures were constructed using non-parametric cumulative Mokken scaling (see e.g. Sijtsma &Molenaar, 2002). High prestige social capital is a cumulative scale indicating access to a scientist, policy maker,lawyer, medical person, higher civil servant, manager, director of a company, and teacher. Low prestige socialcapital is a cumulative scale indicating access to an engine driver, cleaner, unskilled labourer, hairdresser,sales person, and construction worker. For construction of these measures see text and Van der Gaag (2005:ch.6).
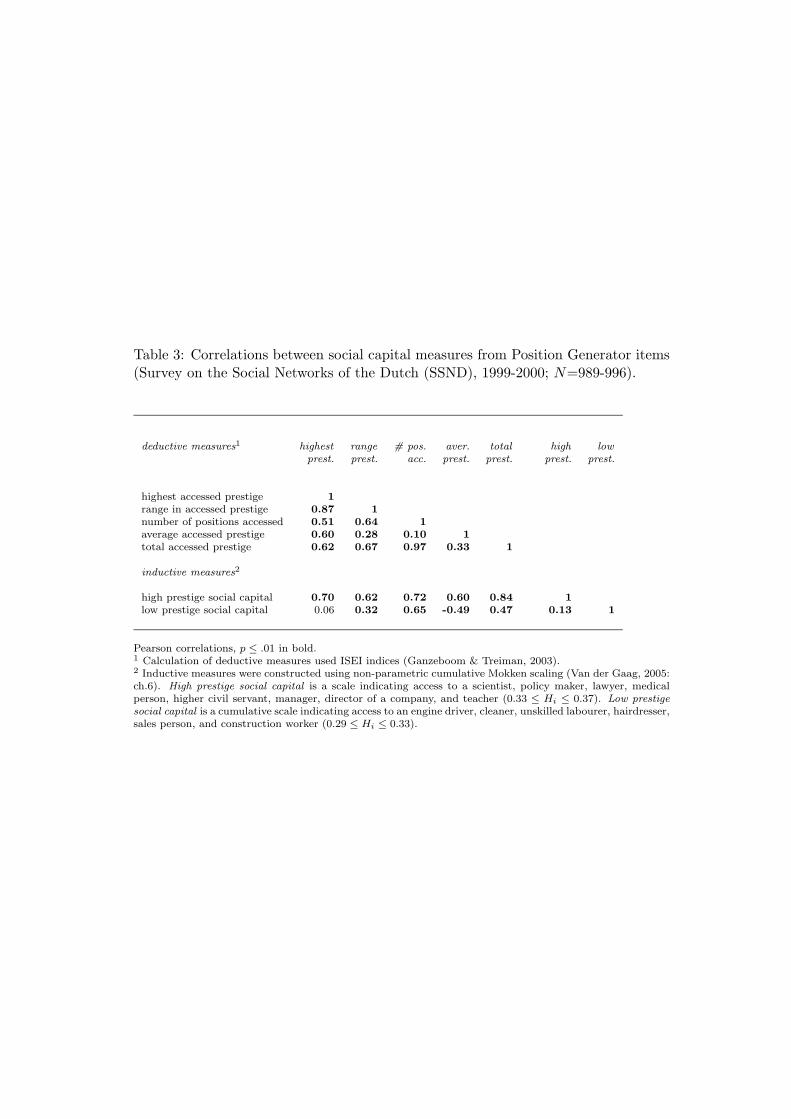
Table 3: Correlations between social capital measures from Position Generator items(Survey on the Social Networks of the Dutch (SSND), 1999-2000; N=989-996).
deductive measures1 highest range # pos. aver. total high lowprest. prest. acc. prest. prest. prest. prest.
highest accessed prestige 1range in accessed prestige 0.87 1number of positions accessed 0.51 0.64 1average accessed prestige 0.60 0.28 0.10 1total accessed prestige 0.62 0.67 0.97 0.33 1
inductive measures2
high prestige social capital 0.70 0.62 0.72 0.60 0.84 1low prestige social capital 0.06 0.32 0.65 -0.49 0.47 0.13 1
Pearson correlations, p ≤ .01 in bold.1 Calculation of deductive measures used ISEI indices (Ganzeboom & Treiman, 2003).2 Inductive measures were constructed using non-parametric cumulative Mokken scaling (Van der Gaag, 2005:ch.6). High prestige social capital is a scale indicating access to a scientist, policy maker, lawyer, medicalperson, higher civil servant, manager, director of a company, and teacher (0.33 ≤ Hi ≤ 0.37). Low prestigesocial capital is a cumulative scale indicating access to an engine driver, cleaner, unskilled labourer, hairdresser,sales person, and construction worker (0.29 ≤ Hi ≤ 0.33).
Tab
le4:
Cor
rela
tion
sbe
twee
nso
cial
capi
tal
mea
sure
sfr
omP
osit
ion
Gen
erat
orit
ems
and
Nam
eG
ener
ator
item
s(S
urve
yon
the
Soci
alN
etw
orks
ofth
eD
utch
(SSN
D),
1999
-200
0;N
=1,
004)
.
Posi
tion
Gen
erato
rm
easu
res1
Nam
eG
ener
ato
r2m
easu
res
ded
uct
ive
mea
sure
sin
du
ctiv
em
easu
re3
exch
an
ge
work
net
work
IQV
of
IQV
of
st.
dev
.st
.d
ev.
net
work
rela
tion
ship
exch
an
ge
size
gen
der
edu
cati
on
age
tie
stre
ngth
den
sity
div
ersi
tyre
lati
on
ship
s
type
ded
uct
ive
maxim
um
pre
stig
e0.2
0-0
.11
-0.0
8-0
.07
-0.0
1-0
.03
0.1
70.1
0ra
nge
inp
rest
ige
0.2
1-0
.12
-0.0
6-0
.05
0.0
00.0
00.1
70.1
1nu
mb
erof
posi
tion
s0.2
5-0
.08
-0.0
9-0
.03
0.0
20.0
10.2
50.1
9aver
age
pre
stig
e0.1
6-0
.09
-0.1
5-0
.06
-0.0
2-0
.05
0.1
60.1
1to
tal
pre
stig
e0.2
8-0
.10
-0.1
1-0
.05
0.0
2-0
.01
0.2
70.2
1
ind
uct
ive
3h
igh
pre
stig
e0.2
7-0
.12
-0.1
1-0
.08
0.0
2-0
.06
0.2
50.2
0lo
wp
rest
ige
0.0
80.0
00.0
00.0
20.0
20.0
80.0
70.0
7
Pea
rson
corr
elati
on
s,p≤.0
1in
bold
.F
or
calc
ula
tion
met
hod
sof
ind
ivid
ual
mea
sure
sse
ete
xt.
1P
osi
tion
Gen
erato
rm
easu
res
refe
rrin
gto
pre
stig
esc
ore
sb
ase
don
ISE
Ivalu
es(B
akker
etal,
1997).
2T
he
Nam
eG
ener
ato
rco
mp
rise
dof
13
item
sca
ptu
rin
gn
etw
ork
exch
an
ge
rela
tion
ship
sacr
oss
vari
ou
sli
fed
om
ain
s;fo
rca
lcu
lati
on
s12
posi
tive
item
sw
ere
use
d(s
eeap
pen
dix
,T
ab
leA
).3
Ind
uct
ive
mea
sure
sw
ere
con
stru
cted
usi
ng
non
-para
met
ric
cum
ula
tive
Mokken
scali
ng
for
Posi
tion
Gen
erato
r(V
an
der
Gaag,
2005:
ch.6
)as
wel
las
Nam
eG
ener
ato
rd
ata
(Van
der
Gaag,
2005:
ch.8
).
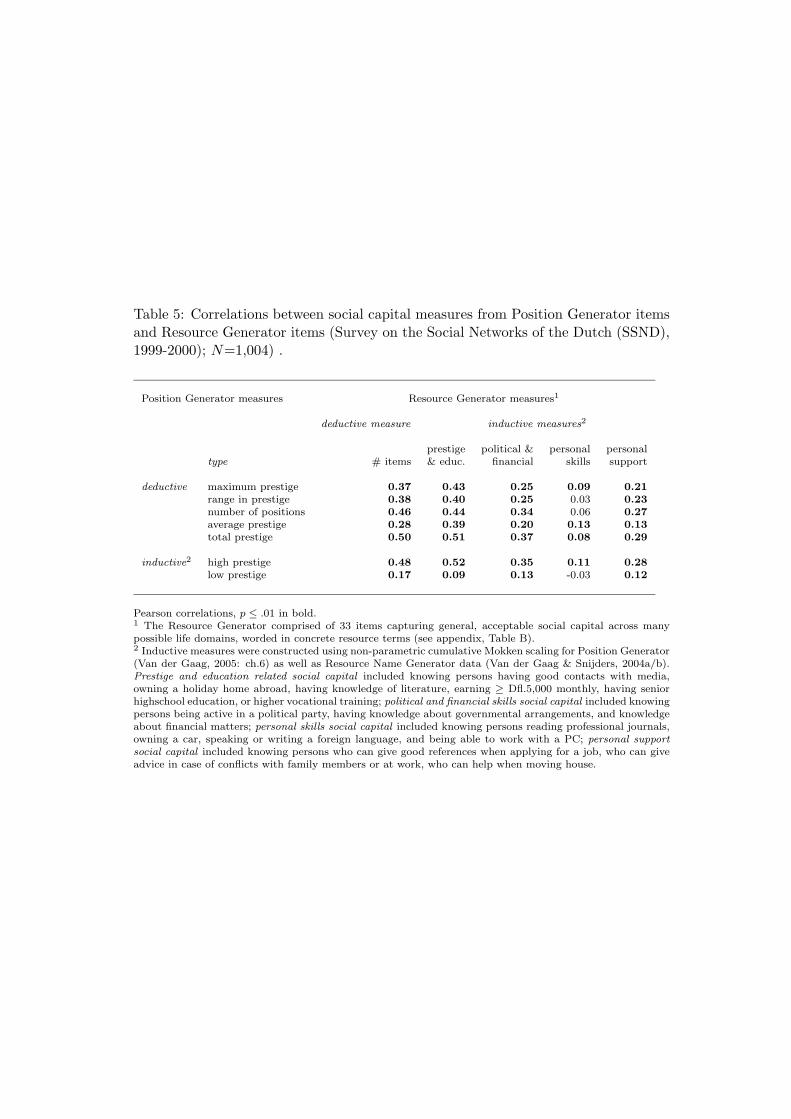
Table 5: Correlations between social capital measures from Position Generator itemsand Resource Generator items (Survey on the Social Networks of the Dutch (SSND),1999-2000); N=1,004) .
Position Generator measures Resource Generator measures1
deductive measure inductive measures2
prestige political & personal personaltype # items & educ. financial skills support
deductive maximum prestige 0.37 0.43 0.25 0.09 0.21range in prestige 0.38 0.40 0.25 0.03 0.23number of positions 0.46 0.44 0.34 0.06 0.27average prestige 0.28 0.39 0.20 0.13 0.13total prestige 0.50 0.51 0.37 0.08 0.29
inductive2 high prestige 0.48 0.52 0.35 0.11 0.28low prestige 0.17 0.09 0.13 -0.03 0.12
Pearson correlations, p ≤ .01 in bold.1 The Resource Generator comprised of 33 items capturing general, acceptable social capital across manypossible life domains, worded in concrete resource terms (see appendix, Table B).2 Inductive measures were constructed using non-parametric cumulative Mokken scaling for Position Generator(Van der Gaag, 2005: ch.6) as well as Resource Name Generator data (Van der Gaag & Snijders, 2004a/b).Prestige and education related social capital included knowing persons having good contacts with media,owning a holiday home abroad, having knowledge of literature, earning ≥ Dfl.5,000 monthly, having seniorhighschool education, or higher vocational training; political and financial skills social capital included knowingpersons being active in a political party, having knowledge about governmental arrangements, and knowledgeabout financial matters; personal skills social capital included knowing persons reading professional journals,owning a car, speaking or writing a foreign language, and being able to work with a PC; personal supportsocial capital included knowing persons who can give good references when applying for a job, who can giveadvice in case of conflicts with family members or at work, who can help when moving house.
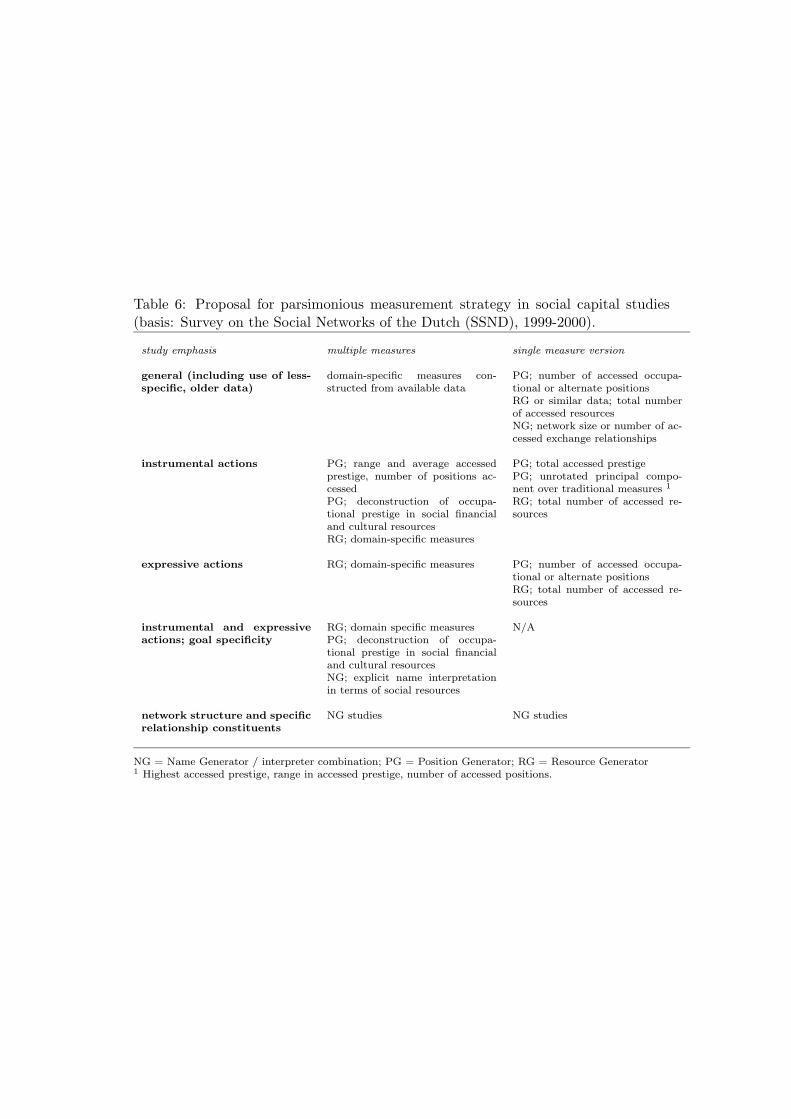
Table 6: Proposal for parsimonious measurement strategy in social capital studies(basis: Survey on the Social Networks of the Dutch (SSND), 1999-2000).
study emphasis multiple measures single measure version
general (including use of less-specific, older data)
domain-specific measures con-structed from available data
PG; number of accessed occupa-tional or alternate positionsRG or similar data; total numberof accessed resourcesNG; network size or number of ac-cessed exchange relationships
instrumental actions PG; range and average accessedprestige, number of positions ac-cessedPG; deconstruction of occupa-tional prestige in social financialand cultural resourcesRG; domain-specific measures
PG; total accessed prestigePG; unrotated principal compo-nent over traditional measures 1
RG; total number of accessed re-sources
expressive actions RG; domain-specific measures PG; number of accessed occupa-tional or alternate positionsRG; total number of accessed re-sources
instrumental and expressiveactions; goal specificity
RG; domain specific measuresPG; deconstruction of occupa-tional prestige in social financialand cultural resourcesNG; explicit name interpretationin terms of social resources
N/A
network structure and specificrelationship constituents
NG studies NG studies
NG = Name Generator / interpreter combination; PG = Position Generator; RG = Resource Generator1 Highest accessed prestige, range in accessed prestige, number of accessed positions.
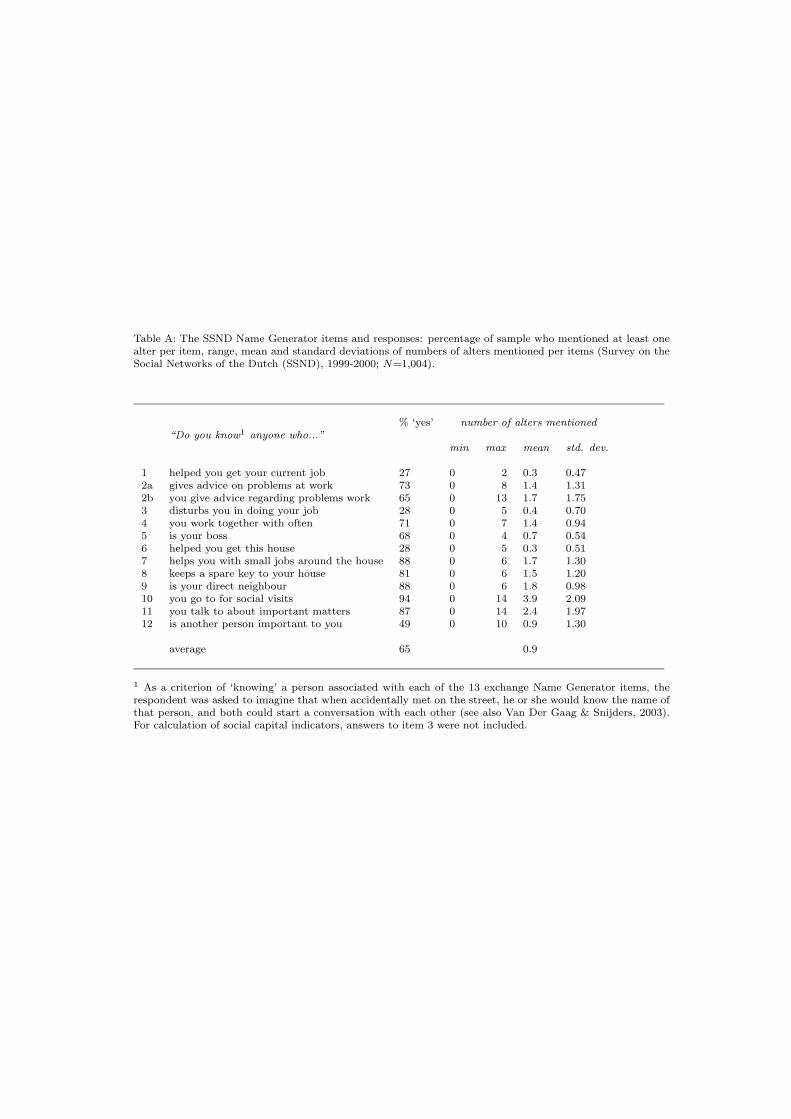
Table A: The SSND Name Generator items and responses: percentage of sample who mentioned at least onealter per item, range, mean and standard deviations of numbers of alters mentioned per items (Survey on theSocial Networks of the Dutch (SSND), 1999-2000; N=1,004).
% ‘yes’ number of alters mentioned“Do you know1 anyone who...”
min max mean std. dev.
1 helped you get your current job 27 0 2 0.3 0.472a gives advice on problems at work 73 0 8 1.4 1.312b you give advice regarding problems work 65 0 13 1.7 1.753 disturbs you in doing your job 28 0 5 0.4 0.704 you work together with often 71 0 7 1.4 0.945 is your boss 68 0 4 0.7 0.546 helped you get this house 28 0 5 0.3 0.517 helps you with small jobs around the house 88 0 6 1.7 1.308 keeps a spare key to your house 81 0 6 1.5 1.209 is your direct neighbour 88 0 6 1.8 0.9810 you go to for social visits 94 0 14 3.9 2.0911 you talk to about important matters 87 0 14 2.4 1.9712 is another person important to you 49 0 10 0.9 1.30
average 65 0.9
1 As a criterion of ‘knowing’ a person associated with each of the 13 exchange Name Generator items, therespondent was asked to imagine that when accidentally met on the street, he or she would know the name ofthat person, and both could start a conversation with each other (see also Van Der Gaag & Snijders, 2003).For calculation of social capital indicators, answers to item 3 were not included.
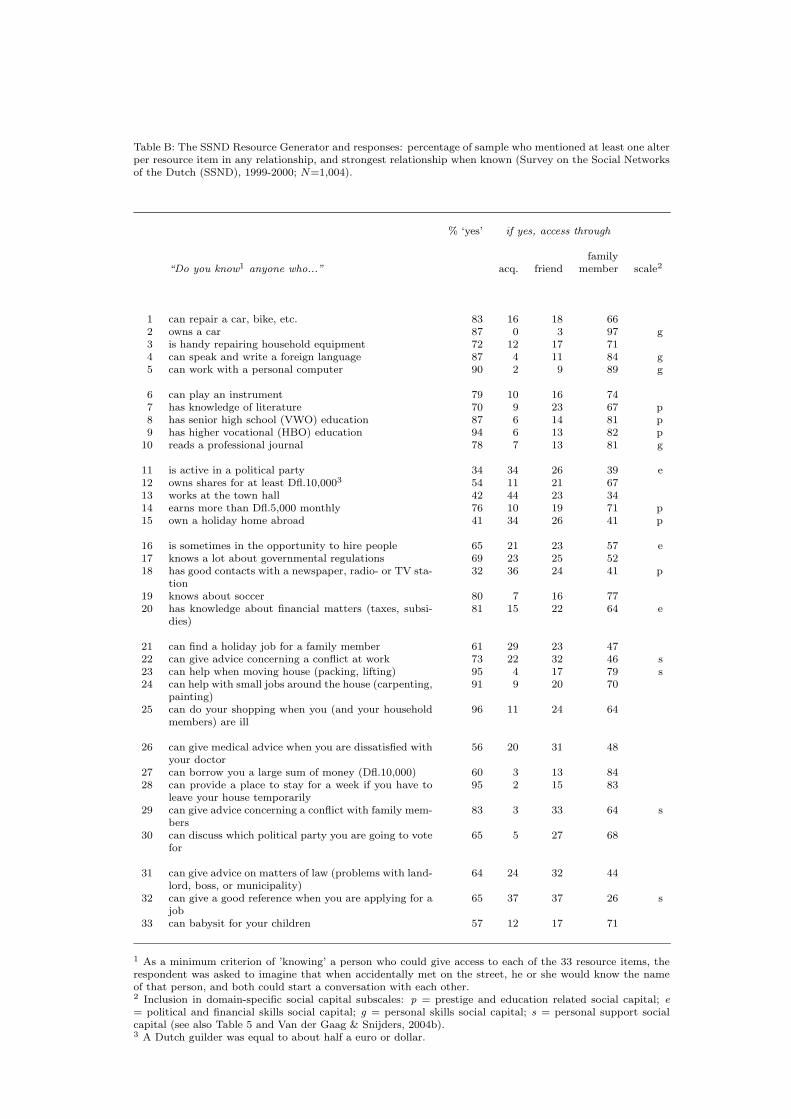
Table B: The SSND Resource Generator and responses: percentage of sample who mentioned at least one alterper resource item in any relationship, and strongest relationship when known (Survey on the Social Networksof the Dutch (SSND), 1999-2000; N=1,004).
% ‘yes’ if yes, access through
family“Do you know1 anyone who...” acq. friend member scale2
1 can repair a car, bike, etc. 83 16 18 662 owns a car 87 0 3 97 g3 is handy repairing household equipment 72 12 17 714 can speak and write a foreign language 87 4 11 84 g5 can work with a personal computer 90 2 9 89 g
6 can play an instrument 79 10 16 747 has knowledge of literature 70 9 23 67 p8 has senior high school (VWO) education 87 6 14 81 p9 has higher vocational (HBO) education 94 6 13 82 p
10 reads a professional journal 78 7 13 81 g
11 is active in a political party 34 34 26 39 e12 owns shares for at least Dfl.10,0003 54 11 21 6713 works at the town hall 42 44 23 3414 earns more than Dfl.5,000 monthly 76 10 19 71 p15 own a holiday home abroad 41 34 26 41 p
16 is sometimes in the opportunity to hire people 65 21 23 57 e17 knows a lot about governmental regulations 69 23 25 5218 has good contacts with a newspaper, radio- or TV sta-
tion32 36 24 41 p
19 knows about soccer 80 7 16 7720 has knowledge about financial matters (taxes, subsi-
dies)81 15 22 64 e
21 can find a holiday job for a family member 61 29 23 4722 can give advice concerning a conflict at work 73 22 32 46 s23 can help when moving house (packing, lifting) 95 4 17 79 s24 can help with small jobs around the house (carpenting,
painting)91 9 20 70
25 can do your shopping when you (and your householdmembers) are ill
96 11 24 64
26 can give medical advice when you are dissatisfied withyour doctor
56 20 31 48
27 can borrow you a large sum of money (Dfl.10,000) 60 3 13 8428 can provide a place to stay for a week if you have to
leave your house temporarily95 2 15 83
29 can give advice concerning a conflict with family mem-bers
83 3 33 64 s
30 can discuss which political party you are going to votefor
65 5 27 68
31 can give advice on matters of law (problems with land-lord, boss, or municipality)
64 24 32 44
32 can give a good reference when you are applying for ajob
65 37 37 26 s
33 can babysit for your children 57 12 17 71
1 As a minimum criterion of ’knowing’ a person who could give access to each of the 33 resource items, therespondent was asked to imagine that when accidentally met on the street, he or she would know the nameof that person, and both could start a conversation with each other.2 Inclusion in domain-specific social capital subscales: p = prestige and education related social capital; e= political and financial skills social capital; g = personal skills social capital; s = personal support socialcapital (see also Table 5 and Van der Gaag & Snijders, 2004b).3 A Dutch guilder was equal to about half a euro or dollar.
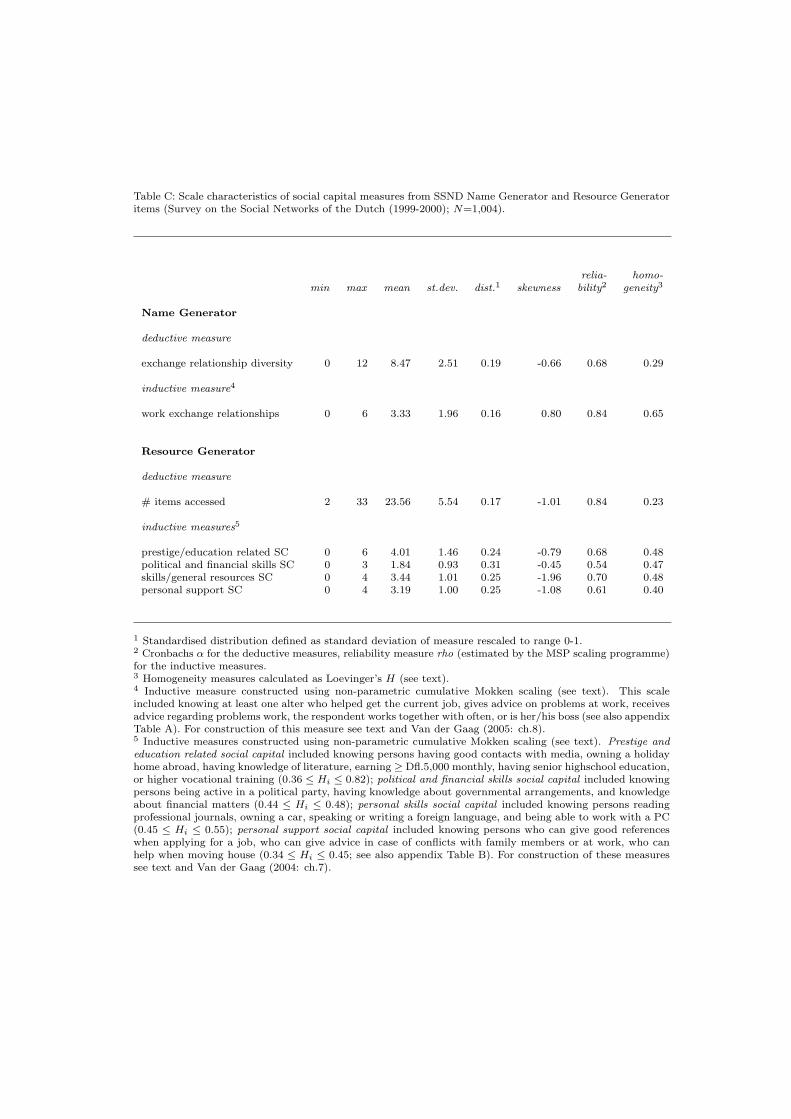
Table C: Scale characteristics of social capital measures from SSND Name Generator and Resource Generatoritems (Survey on the Social Networks of the Dutch (1999-2000); N=1,004).
relia- homo-min max mean st.dev. dist.1 skewness bility2 geneity3
Name Generator
deductive measure
exchange relationship diversity 0 12 8.47 2.51 0.19 -0.66 0.68 0.29
inductive measure4
work exchange relationships 0 6 3.33 1.96 0.16 0.80 0.84 0.65
Resource Generator
deductive measure
# items accessed 2 33 23.56 5.54 0.17 -1.01 0.84 0.23
inductive measures5
prestige/education related SC 0 6 4.01 1.46 0.24 -0.79 0.68 0.48political and financial skills SC 0 3 1.84 0.93 0.31 -0.45 0.54 0.47skills/general resources SC 0 4 3.44 1.01 0.25 -1.96 0.70 0.48personal support SC 0 4 3.19 1.00 0.25 -1.08 0.61 0.40
1 Standardised distribution defined as standard deviation of measure rescaled to range 0-1.2 Cronbachs α for the deductive measures, reliability measure rho (estimated by the MSP scaling programme)for the inductive measures.3 Homogeneity measures calculated as Loevinger’s H (see text).4 Inductive measure constructed using non-parametric cumulative Mokken scaling (see text). This scaleincluded knowing at least one alter who helped get the current job, gives advice on problems at work, receivesadvice regarding problems work, the respondent works together with often, or is her/his boss (see also appendixTable A). For construction of this measure see text and Van der Gaag (2005: ch.8).5 Inductive measures constructed using non-parametric cumulative Mokken scaling (see text). Prestige andeducation related social capital included knowing persons having good contacts with media, owning a holidayhome abroad, having knowledge of literature, earning ≥ Dfl.5,000 monthly, having senior highschool education,or higher vocational training (0.36 ≤ Hi ≤ 0.82); political and financial skills social capital included knowingpersons being active in a political party, having knowledge about governmental arrangements, and knowledgeabout financial matters (0.44 ≤ Hi ≤ 0.48); personal skills social capital included knowing persons readingprofessional journals, owning a car, speaking or writing a foreign language, and being able to work with a PC(0.45 ≤ Hi ≤ 0.55); personal support social capital included knowing persons who can give good referenceswhen applying for a job, who can give advice in case of conflicts with family members or at work, who canhelp when moving house (0.34 ≤ Hi ≤ 0.45; see also appendix Table B). For construction of these measuressee text and Van der Gaag (2004: ch.7).