Portugal Economic Profile - Harvard Business School Files/CAON Australia 07-24-02... · Australian...
60
Australian Competitiveness Professor Michael E. Porter Institute for Strategy and Competitiveness Harvard Business School Sydney, Australia IIR Leading Minds Conference 1 August, 2002 This presentation draws on ideas from Professor Porter’s articles and books, in particular, The Competitive Advantage of Nations (The Free Press, 1990), “The Microeconomic Foundations of Economic Development,” in The Global Competitiveness Report 2001 , (World Economic Forum, 2001), “Clusters and the New Competitive Agenda for Companies and Governments” in On Competition (Harvard Business School Press, 1998), and the Clusters of Innovation Initiative (www.compete.org), a joint effort of the Council on Competitiveness, Monitor Group, and Professor Porter. No part of this publication may be reproduced, stored in a retrieval system, or transmitted in any form or by any means - electronic, mechanical, photocopying, recording, or otherwise - without the permission of Michael E. Porter. Additional information may be found at the website of the Institute for Strategy and Competitiveness, www.isc.hbs.edu
Transcript of Portugal Economic Profile - Harvard Business School Files/CAON Australia 07-24-02... · Australian...

Australian Competitiveness
Professor Michael E. PorterInstitute for Strategy and Competitiveness
Harvard Business School
Sydney, AustraliaIIR Leading Minds Conference
1 August, 2002
This presentation draws on ideas from Professor Porter’s articles and books, in particular, The Competitive Advantage of Nations (The Free Press, 1990), “The Microeconomic Foundations of Economic Development,” in The Global Competitiveness Report 2001, (World Economic Forum, 2001), “Clusters and the New Competitive Agenda for Companies and Governments” in On Competition (Harvard Business School Press, 1998), and the Clusters of Innovation Initiative (www.compete.org), a joint effort of the Council on Competitiveness, Monitor Group, and Professor Porter. No part of this publication may be reproduced, stored in a retrieval system, or transmitted in any form or by any means - electronic, mechanical, photocopying, recording, or otherwise - without the permission of Michael E. Porter.Additional information may be found at the website of the Institute for Strategy and Competitiveness, www.isc.hbs.edu

2 Copyright 2002 © Professor Michael E. PorterCAON Australia 07-30-02 CK.ppt
Sources of Firm Success
InternalInternalInternal ExternalExternalExternal
• Competitive advantage resides partly in the locations at which a company’s business units are based
• Cluster participation is an important contributor to company success
• Competitive advantage resides solely inside a company or in its industry
• Competitive success depends primarily on company choices

3 Copyright 2002 © Professor Michael E. PorterCAON Australia 07-30-02 CK.ppt
Australia 2002
• Australia’s strong economic performance over the last decade was due to fundamental economic reforms
• The competitiveness of Australian companies is still being constrained by some elements of the business environment
• Australian companies can and should play a more forceful role in enhancing the nation’s business environment

4 Copyright 2002 © Professor Michael E. PorterCAON Australia 07-30-02 CK.ppt
Australian Economic Performance
15,000
17,000
19,000
21,000
23,000
25,000
27,000
29,000
31,000
33,000
35,000
0% 1% 2% 3% 4% 5% 6% 7%
Canada
Germany
Israel
South Korea
New Zealand
SingaporeSweden
Taiwan
US
AUSTRALIAJapan
UK
Finland
Ireland*
Compound annual growth rate of real GDP per capita, 1990-2000
GDP per capita (PPP
adjusted) in US-$,
2000
Portugal
Spain
Note: Irish GNP per capita is about 20% lower than the reported GDP per capita figure due to large dividend outflows to foreign investors. We use GNP per capita for Ireland because it is more representative. For other countries GDP and GNP are very similar.
Source: WTO
5 Copyright 2002 © Professor Michael E. PorterCAON Australia 07-30-02 CK.ppt
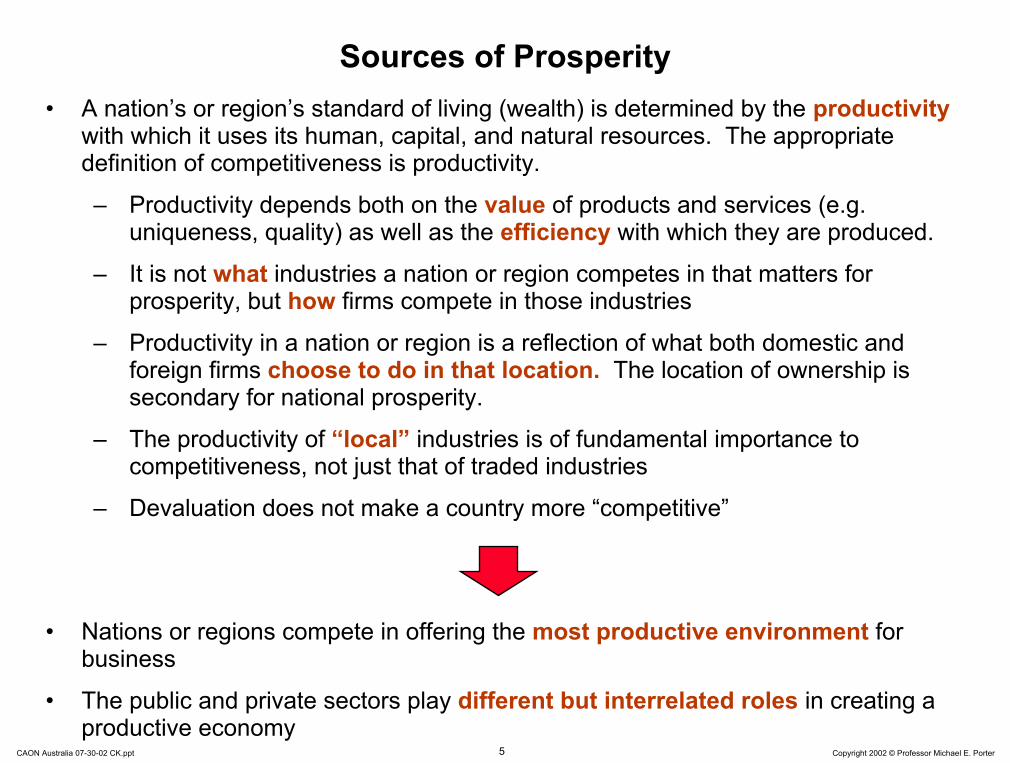
Sources of Prosperity• A nation’s or region’s standard of living (wealth) is determined by the productivity
with which it uses its human, capital, and natural resources. The appropriate definition of competitiveness is productivity.
– Productivity depends both on the value of products and services (e.g. uniqueness, quality) as well as the efficiency with which they are produced.
– It is not what industries a nation or region competes in that matters for prosperity, but how firms compete in those industries
– Productivity in a nation or region is a reflection of what both domestic and foreign firms choose to do in that location. The location of ownership is secondary for national prosperity.
– The productivity of “local” industries is of fundamental importance to competitiveness, not just that of traded industries
– Devaluation does not make a country more “competitive”
• Nations or regions compete in offering the most productive environment for business
• The public and private sectors play different but interrelated roles in creating a productive economy

6 Copyright 2002 © Professor Michael E. PorterCAON Australia 07-30-02 CK.ppt
Innovation and Prosperity
ProsperityProsperityProsperity
ProductivityProductivity Competitiveness
InnovationInnovationInnovation
There are no low-tech industries, only low-tech firms
Innovation is more than just scientific discovery

7 Copyright 2002 © Professor Michael E. PorterCAON Australia 07-30-02 CK.ppt
Determinants of Productivity and Productivity Growth
Macroeconomic, Political, Legal, and Social Context for Development
Macroeconomic, Political, Legal, and Social Macroeconomic, Political, Legal, and Social Context for DevelopmentContext for Development
Microeconomic Foundations of DevelopmentMicroeconomic Foundations of Development
Quality of the Microeconomic
BusinessEnvironment
Quality of the Quality of the MicroeconomicMicroeconomic
BusinessBusinessEnvironmentEnvironment
Sophisticationof Company
Operations andStrategy
SophisticationSophisticationof Companyof Company
Operations andOperations andStrategyStrategy
• A sound macroeconomic, political, legal, and social context creates the potential for competitiveness, but is not sufficient
• Competitiveness ultimately depends on improving the microeconomic capability of the economy and the sophistication of local competition
8 Copyright 2002 © Professor Michael E. PorterCAON Australia 07-30-02 CK.ppt
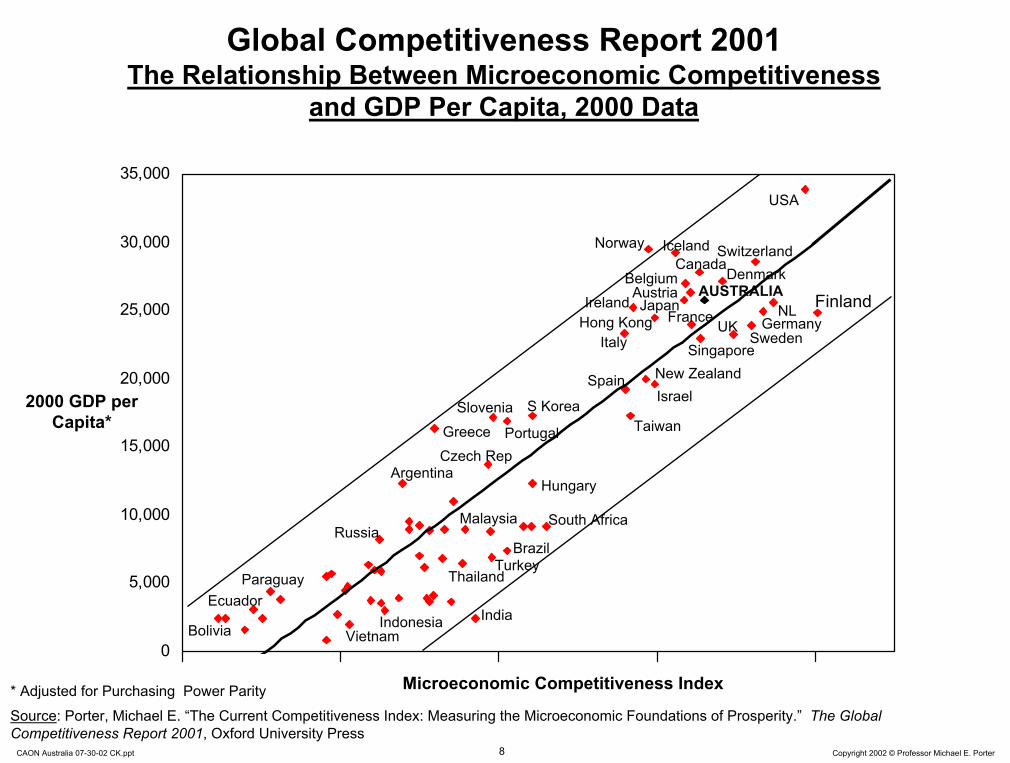
Global Competitiveness Report 2001The Relationship Between Microeconomic Competitiveness
and GDP Per Capita, 2000 Data
0
5,000
10,000
15,000
20,000
25,000
30,000
35,000USA
FinlandNL
Sweden
Switzerland
GermanyUK
DenmarkAUSTRALIA
SingaporeNew Zealand
Taiwan
Norway Iceland
Ireland
Greece
Israel
Hong KongItaly
S Korea
ArgentinaHungary
India
Japan
BelgiumAustria
France
Canada
Spain
Czech Rep
Slovenia
Portugal
Microeconomic Competitiveness Index
2000 GDP per Capita*
South Africa
BrazilTurkey
Thailand
Indonesia
MalaysiaRussia
Bolivia
Ecuador
Vietnam
Paraguay
* Adjusted for Purchasing Power ParitySource: Porter, Michael E. “The Current Competitiveness Index: Measuring the Microeconomic Foundations of Prosperity.” The Global Competitiveness Report 2001, Oxford University Press
9 Copyright 2002 © Professor Michael E. PorterCAON Australia 07-30-02 CK.ppt
Context for Firm
Strategy and Rivalry
Context for Context for Firm Firm
Strategy Strategy and Rivalryand Rivalry
Related and Supporting Industries
Related and Supporting Industries
Factor(Input)
Conditions
FactorFactor(Input) (Input)
ConditionsConditions
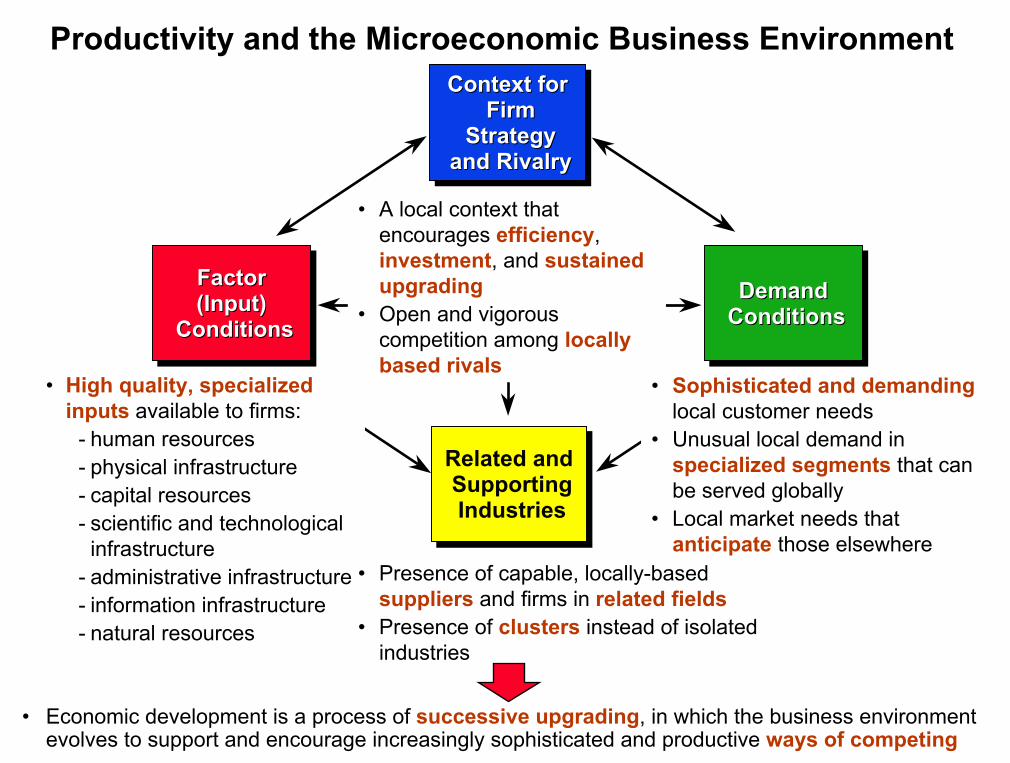
• A local context that encourages efficiency,investment, and sustained upgrading
• Open and vigorous competition among locally based rivals
Demand ConditionsDemand Demand
ConditionsConditions
Productivity and the Microeconomic Business Environment
• Economic development is a process of successive upgrading, in which the business environment evolves to support and encourage increasingly sophisticated and productive ways of competing
• Sophisticated and demandinglocal customer needs
• Unusual local demand in specialized segments that can be served globally
• Local market needs that anticipate those elsewhere
• High quality, specialized inputs available to firms:
- human resources- physical infrastructure- capital resources- scientific and technological
infrastructure- administrative infrastructure- information infrastructure- natural resources
• Presence of capable, locally-based suppliers and firms in related fields
• Presence of clusters instead of isolated industries
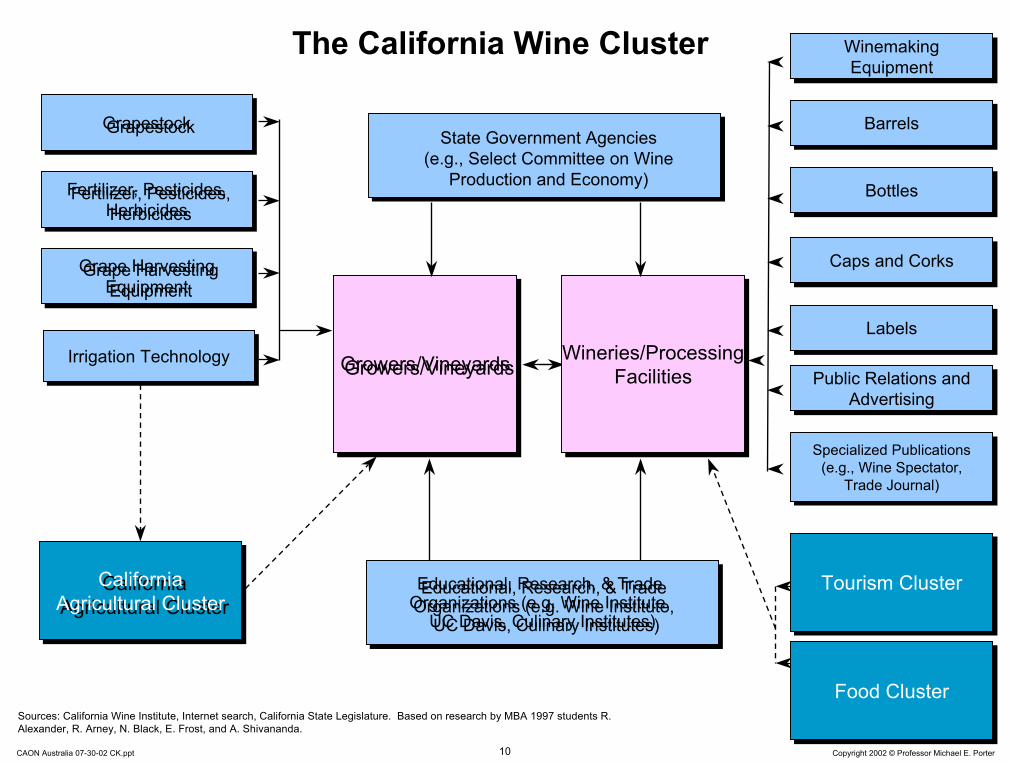
10 Copyright 2002 © Professor Michael E. PorterCAON Australia 07-30-02 CK.ppt
Wineries/ProcessingFacilities
Wineries/ProcessingFacilities
Irrigation TechnologyIrrigation Technology
State Government Agencies(e.g., Select Committee on Wine
Production and Economy)
The California Wine Cluster Winemaking Equipment
Winemaking Equipment
Educational, Research, & Trade Organizations (e.g. Wine Institute,
UC Davis, Culinary Institutes)
Educational, Research, & Trade Organizations (e.g. Wine Institute,
UC Davis, Culinary Institutes)
Growers/VineyardsGrowers/Vineyards
Sources: California Wine Institute, Internet search, California State Legislature. Based on research by MBA 1997 students R. Alexander, R. Arney, N. Black, E. Frost, and A. Shivananda.
GrapestockGrapestock BarrelsBarrels
Fertilizer, Pesticides, Herbicides
Fertilizer, Pesticides, Herbicides
BottlesBottles
Caps and CorksCaps and CorksGrape Harvesting Equipment
Grape Harvesting Equipment
LabelsLabels
Public Relations and Advertising
Public Relations and Advertising
Specialized Publications (e.g., Wine Spectator,
Trade Journal)
Specialized Publications (e.g., Wine Spectator,
Trade Journal)
Food ClusterFood Cluster
Tourism ClusterTourism ClusterCalifornia Agricultural Cluster
California Agricultural Cluster

Institutions for CollaborationSelected Institutions for Collaboration in San Diego
Source: Clusters of Innovation project (www.compete.org)
GeneralGeneral Cluster-SpecificCluster-SpecificPrivate Sector
San Diego Chamber of CommerceSan Diego MIT Enterprise ForumCorporate Director’s ForumSan Diego DialogueService Corps of Retired Executives, San Diego
Joint Private / PublicSan Diego Regional Economic Development CorporationCenter for Applied Competitive TechnologiesSan Diego World Trade Center
Public SectorSan Diego Regional Technology AllianceSan Diego Science and Technology CouncilOffice of Trade and Business Development
Informal NetworksUCSD Alumni
Private SectorSan Diego Chamber of CommerceSan Diego MIT Enterprise ForumCorporate Director’s ForumSan Diego DialogueService Corps of Retired Executives, San Diego
Joint Private / PublicSan Diego Regional Economic Development CorporationCenter for Applied Competitive TechnologiesSan Diego World Trade Center
Public SectorSan Diego Regional Technology AllianceSan Diego Science and Technology CouncilOffice of Trade and Business Development
Informal NetworksUCSD Alumni
Private SectorLinkabit AlumniHybritech Alumni Scripps Research Institute Alumni
Joint Private / PublicBIOCOMMUCSD Connect
Private SectorLinkabit AlumniHybritech Alumni Scripps Research Institute Alumni
Joint Private / PublicBIOCOMMUCSD Connect

12 Copyright 2002 © Professor Michael E. PorterCAON Australia 07-30-02 CK.ppt
The Process of Cluster DevelopmentHistory of the San Diego Biotech / Pharma Cluster
Source: Clusters of Innovation Project
1964
UCSD founded
1978
Hybritech founded
1986
Hybritech sold to Eli Lilly
1991
Biocom founded
1955
Salk Institute Founded
1960
Scripps Research Institute founded
1976
Burnham Institute founded
1985
UCSD Connect founded
1991
Biomedical Industry Council founded
1992
Nanogen founded
1998
Novartis Agricultural Discovery Institute founded

13 Copyright 2002 © Professor Michael E. PorterCAON Australia 07-30-02 CK.ppt
The Evolution of Regional EconomiesSan Diego
U.S. U.S. MilitaryMilitary
CommunicationsEquipment
Sporting Goods
Analytical Instruments
Power GenerationAerospace Vehicles
and Defense
Transportationand Logistics
Information Technology
Bioscience Bioscience Research Research CentersCenters
Climate Climate and and
GeographyGeography
Hospitality and Tourism
Medical Devices
Biotech / Pharmaceuticals
Education andKnowledge Creation
19101910 19301930 19501950 1990199019701970

14 Copyright 2002 © Professor Michael E. PorterCAON Australia 07-30-02 CK.ppt
Role of the Private Sector in Economic Development
• A company’s competitive advantage is partly the result of the local environment
• Company membership in a cluster offers collective benefits
• Private investment in “public goods” enhances competitive advantages
• Take an active role in upgrading the local infrastructure
• Nurture local suppliers and attract new supplier investments
• Work closely with local educational and research institutions
• Provide government with information and substantive input on regulatory issues and constraints to cluster development
• An important role for trade associations
– Influence and cost sharing

15 Copyright 2002 © Professor Michael E. PorterCAON Australia 07-30-02 CK.ppt
Public / Private Cooperation in Cluster UpgradingMinnesota’s Medical Device Cluster
Context for Firm
Strategy and Rivalry
Related and Supporting Industries
Related and Supporting Industries
Factor(Input)
Conditions
FactorFactor(Input) (Input)
ConditionsConditionsDemand
ConditionsDemand Demand
ConditionsConditions
• Joint development of vocational-technical college curricula with the medical device industry
• Minnesota Project Outreach exposes businesses to resources available at university and state government agencies
• Active medical technology licensing through University of Minnesota
• State-formed Greater Minnesota Corp. to finance applied research, invest in new products, and assist in technology transfer
• State sanctioned reimbursement policies to enable easier adoption and reimbursement for innovative products
• Aggressive trade associations(Medical Alley Association, High Tech Council)
• Effective global marketing of the cluster and of Minnesota as the “The Great State of Health”
• Full-time “Health Care Industry Specialist” in the department of Trade and Economic Development
Context for Context for Firm Firm
Strategy Strategy and Rivalryand Rivalry

16 Copyright 2002 © Professor Michael E. PorterCAON Australia 07-30-02 CK.ppt
Geographic Levels and Competitiveness
World EconomyWorld EconomyWorld Economy
Broad Economic AreasBroad Economic AreasBroad Economic Areas APEC
Groups of Neighboring Nations
Groups of Neighboring Groups of Neighboring NationsNations
Oceania
States, ProvincesStates, ProvincesStates, Provinces
Cities, Metropolitan Areas
Cities, Metropolitan Cities, Metropolitan AreasAreas
Nations AustraliaNationsNations
New South Wales
Sydney

17 Copyright 2002 © Professor Michael E. PorterCAON Australia 07-30-02 CK.ppt
Comparative Economic PerformanceReal GDP Growth Rates
-10%
-5%
0%
5%
10%
15%
1990 1991 1992 1993 1994 1995 1996 1997 1998 1999 2000 2001
SpainAustraliaFranceNew ZealandCanadaUSSwedenNetherlandsFinlandSingaporeUKGermany
Source: EIU (2001), OECD (2002), Singapore Statistics (2002)
18 Copyright 2002 © Professor Michael E. PorterCAON Australia 07-30-02 CK.ppt
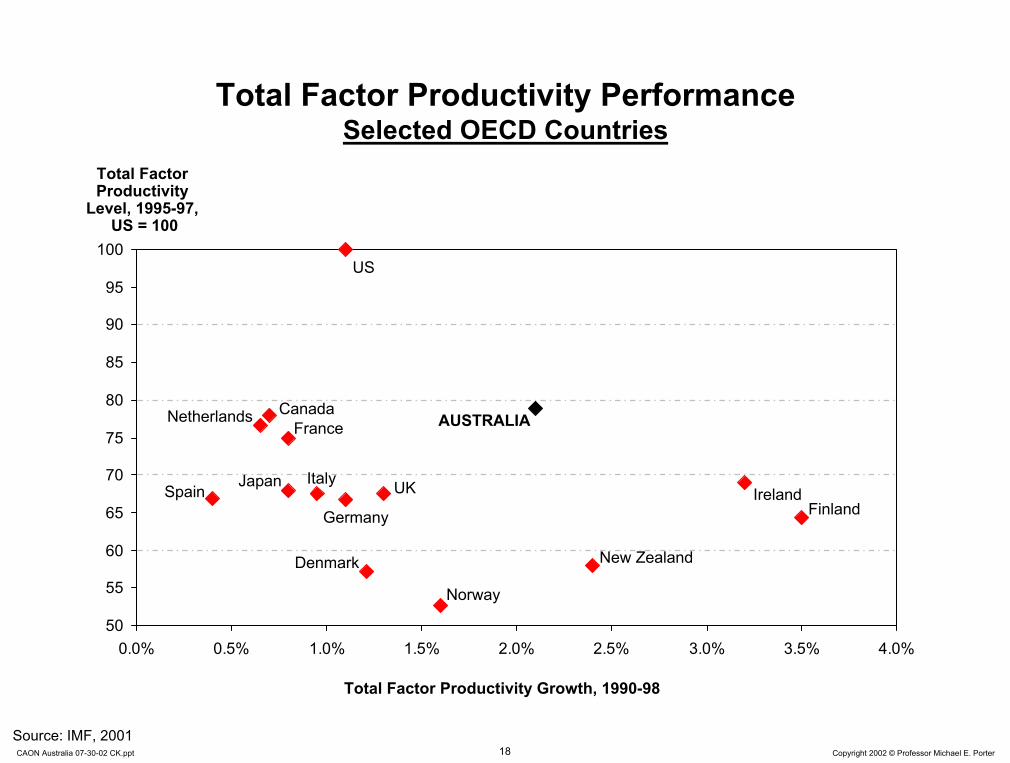
Total Factor Productivity PerformanceSelected OECD Countries
50
55
60
65
70
75
80
85
90
95
100
0.0% 0.5% 1.0% 1.5% 2.0% 2.5% 3.0% 3.5% 4.0%
Ireland
Total Factor Productivity
Level, 1995-97,US = 100
AUSTRALIA
Finland
US
Germany
UK
New Zealand
JapanSpain
CanadaFrance
Netherlands
Italy
Denmark
Norway
Total Factor Productivity Growth, 1990-98
Source: IMF, 2001

19 Copyright 2002 © Professor Michael E. PorterCAON Australia 07-30-02 CK.ppt
Australia’s Achievements1990 - 2002
• GDP per capita growth has been remarkably resilient in the face of the Asian crisis and the current global economic weakness
• Productivity has increased rapidly, especially total factor productivity• Economic reforms have begun to fundamentally transform the quality of the
Australian business environment– Sound macroeconomic policies– Modernization of the tax system – Redesigned social policies to encourage participation in the economy– Deregulation of product and labor markets– Market opening for telecommunications, utilities, and the provision of public
services– Strengthening of competition policy– Creation of institutions to monitor competitive upgrading, e.g. Productivity
Commission
• The positive effects of the past economic reforms have not yet been fully felt and will continue to benefit the performance of the Australian economy in coming years

20 Copyright 2002 © Professor Michael E. PorterCAON Australia 07-30-02 CK.ppt
International Patenting OutputAnnual U.S. patents
per 1 million population, 2001
Compound annual growth rate of US-registered patents, 1990 - 2001
0
50
100
150
200
250
300
350
400
0% 10% 20% 30% 40%
AUSTRALIA
Canada
Germany
Japan
South Korea
New Zealand
Singapore
Sweden
Taiwan
UK
Israel
USA
Finland= 10,000 patents granted in 2001
Source: US Patent and Trademark Office (www.uspto.gov). Author’s analysis.

21 Copyright 2002 © Professor Michael E. PorterCAON Australia 07-30-02 CK.ppt
Current Competitiveness IndexAustralia’s Position over Time
Rank
1
Current Competitivenss Rank National BusinessEnvironment Rank
Company Operation &Strategy Rank
1998199920002001
5
10
15
20
25
30
Source: Global Competitiveness Report 2001

22 Copyright 2002 © Professor Michael E. PorterCAON Australia 07-30-02 CK.ppt
Australia’s Challenges
• A number of corporate failures and company relocations have shaken confidence in Australia’s corporate basis
• The innovation performance of Australia is weak compared to international standards
• Australia has relatively few clusters that are well developed
• Government is under pressure to “do something” but there is no clear vision for the next stage in economic development after market opening and deregulation
• These challenges are connected; a concerted strategy is needed to address them

23 Copyright 2002 © Professor Michael E. PorterCAON Australia 07-30-02 CK.ppt
Australia’s Economic Agenda 2002
• Continue upgrading the microeconomic business environment
• Strengthen innovative capacity
• Mount a broad-based program of cluster development
• Upgrade company strategies
• Pursue stronger economic coordination with neighboring countries
• Articulate a new national economic vision

24 Copyright 2002 © Professor Michael E. PorterCAON Australia 07-30-02 CK.ppt
Factor(Input)
Conditions
Factor(Input)
ConditionsFactor (Input) ConditionsAustralia’s Relative Position
Availability and Cost of Cellular Phones 1
Judicial Independence 1
Quality of Management Schools 1
Road Infrastructure Quality 2
Speed and Cost of Internet Access 2
Venture Capital Availability 2
Administrative Burden for Start-Ups 3
Police Protection of Businesses 3
Adequacy of Public Sector Legal 4Recourse
Competitive Advantages Relative to GDP per Capita
Country Ranking
Competitive Disadvantages Relative to GDP per Capita
Country Ranking
Local Equity Market Access 36
Telephone/Fax Infrastructure Quality 25
Availability of Scientists and Engineers 24
Patents per Capita (2000) 20
Railroad Infrastructure Quality 20
Port Infrastructure Quality 15
Quality of Math and Science Education 15
University/Industry Research 15Collaboration
Ease of Access to Loans 14
Overall Infrastructure Quality 13
Quality of Public Schools 11
Air Transport Infrastructure Quality 10
Note: Rank by countries; overall Australia ranks 9th (7th on Quality of the National Business Environment; 11th on GDP per Capita)Source: Global Competitiveness Report 2001

25 Copyright 2002 © Professor Michael E. PorterCAON Australia 07-30-02 CK.ppt
Context for Firm Strategy and Rivalry
Context for Context for Firm Strategy and RivalryAustralia’s Relative Position
Firm Strategy and Rivalry
Effectiveness of Anti-Trust Policy 2
Efficacy of Corporate Boards 2
Hidden Trade Barrier Liberalization 3
Extent of Locally Based Competitors 4
Extent of Distortive Government 5Subsidies
Competitive Advantages Relative to GDP per Capita
Country Ranking
Competitive Disadvantages Relative to GDP per Capita
Country Ranking
Intensity of Local Competition 58
Cooperation in Labor-Employer Relations 51
Favoritism in Decisions of Government 16 Officials
Decentralization of Corporate Activity 10
Intellectual Property Protection 10
Note: Rank by countries; overall Australia ranks 9th (7th on Quality of the National Business Environment; 11th on GDP per Capita) Source: Global Competitiveness Report 2001

26 Copyright 2002 © Professor Michael E. PorterCAON Australia 07-30-02 CK.ppt
The Importance of Local Competition
• A decade of research and findings for the Global Competitiveness Report indicate the critical role of local competition and effective anti-trust policy for prosperity and prosperity growth
• Modern antitrust policy must recognize the critical importance of productivity and innovation, and shift the basis for evaluating mergers and other company behavior towards these benchmarks
• There is no trade-off between anti-trust policy and competitiveness policy; they reinforce each other
Source: Michael E Porter, Competition and Antitrust: Towards a Productivity-Based Approach to Evaluating Mergers and Joint Ventures, Antitrust Bulletin, 2001.

27 Copyright 2002 © Professor Michael E. PorterCAON Australia 07-30-02 CK.ppt
Demand ConditionsAustralia’s Relative Position
Demand ConditionsDemand
Conditions
Consumer Adoption of Latest Products 2
Presence of Demanding Regulatory 8Standards
Competitive Advantages Relative to GDP per Capita
Country Ranking
Competitive Disadvantages Relative to GDP per Capita
Country Ranking
Government Procurement of Advanced 21 Technology Products
Buyer Sophistication 18
Stringency of Environmental Regulations 15
Laws Relating to Information Technology 13
Note: Rank by countries; overall Australia ranks 9th (7th on Quality of the National Business Environment; 11th on GDP per Capita) Source: Global Competitiveness Report 2001
28 Copyright 2002 © Professor Michael E. PorterCAON Australia 07-30-02 CK.ppt
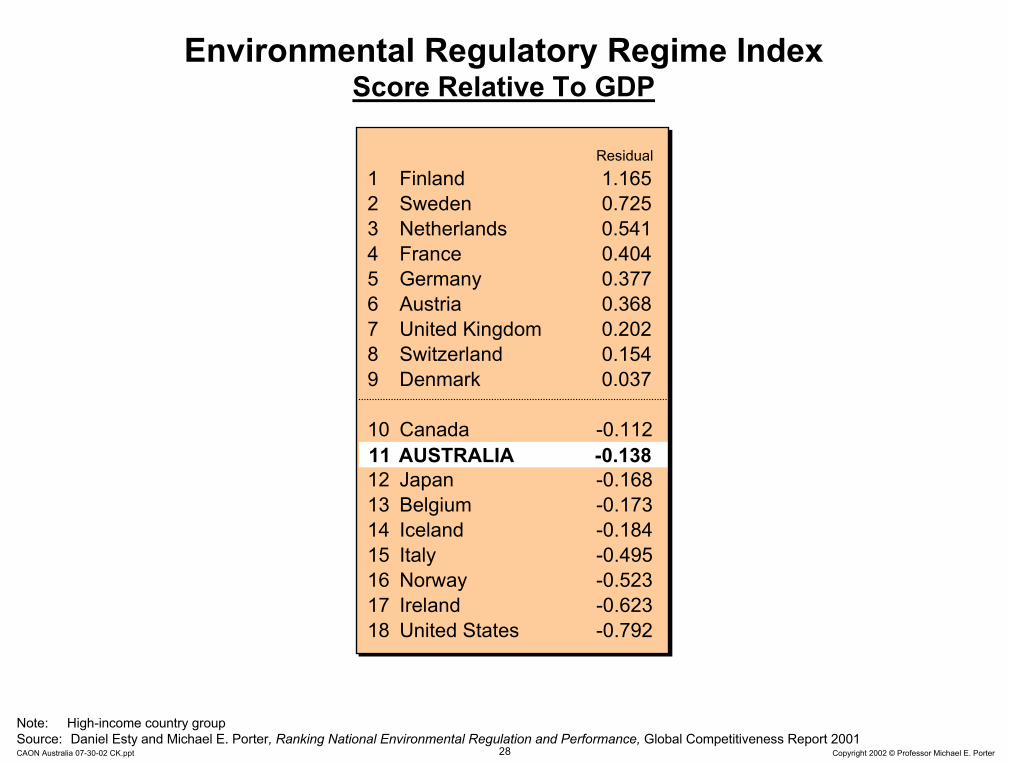
Environmental Regulatory Regime Index Score Relative To GDP
Residual1 Finland 1.1652 Sweden 0.7253 Netherlands 0.5414 France 0.4045 Germany 0.3776 Austria 0.3687 United Kingdom 0.2028 Switzerland 0.1549 Denmark 0.037
10 Canada -0.11211 Australia -0.13812 Japan -0.16813 Belgium -0.17314 Iceland -0.18415 Italy -0.49516 Norway -0.52317 Ireland -0.62318 United States -0.792
11 AUSTRALIA -0.138
Note: High-income country groupSource: Daniel Esty and Michael E. Porter, Ranking National Environmental Regulation and Performance, Global Competitiveness Report 2001

29 Copyright 2002 © Professor Michael E. PorterCAON Australia 07-30-02 CK.ppt
Environmental Regulation and Competitiveness
• Competing based on weak environmental standards perpetuates low incomes
• Corporate pollution is a sign of inefficient and unproductive use of resources
Firm• Inefficient extraction of resources• Incomplete material utilization• Unnecessary waste products• Unnecessary energy use• Unproductive land use
Customer• Usable materials in products that
are discarded • Products that use energy
inefficiently • Discarded or unnecessary
packaging• The need to control or treat pollution causes companies to perform activities
that add cost but create no customer value- e.g., handling, storage, processing, disposal
• Pollution is a reflection of unsophisticated technology and weak management
• Strict environmental regulation stimulates the upgrading necessary to achieve advanced economic development

30 Copyright 2002 © Professor Michael E. PorterCAON Australia 07-30-02 CK.ppt
Australia’s Economic Agenda 2002
• Continue upgrading the microeconomic business environment
• Strengthen innovative capacity
• Mount a broad-based program of cluster development
• Upgrade company strategies
• Pursue stronger economic coordination with neighboring countries
• Articulate a new national economic vision

31 Copyright 2002 © Professor Michael E. PorterCAON Australia 07-30-02 CK.ppt
Change in R&D InvestmentsCompound Annual Growth Rate in R&D Expenditures, 1985-1998
R&D Spending as Share of GDP, 1998
0.0%
0.5%
1.0%
1.5%
2.0%
2.5%
3.0%
3.5%
4.0%
4.5%
0% 5% 10% 15% 20% 25%
USA
Germany
UK
Sweden
Canada
Singapore
Japan
Ireland
Italy New Zealand
South Korea
France Israel
R&D Expenditures, CAGR, 1985 - 1998
Netherlands
Belgium
Denmark
Finland
Spain
AUSTRALIA
Portugal
Source: OECD Science, Technology and Industry Scoreboard 2001.
32 Copyright 2002 © Professor Michael E. PorterCAON Australia 07-30-02 CK.ppt
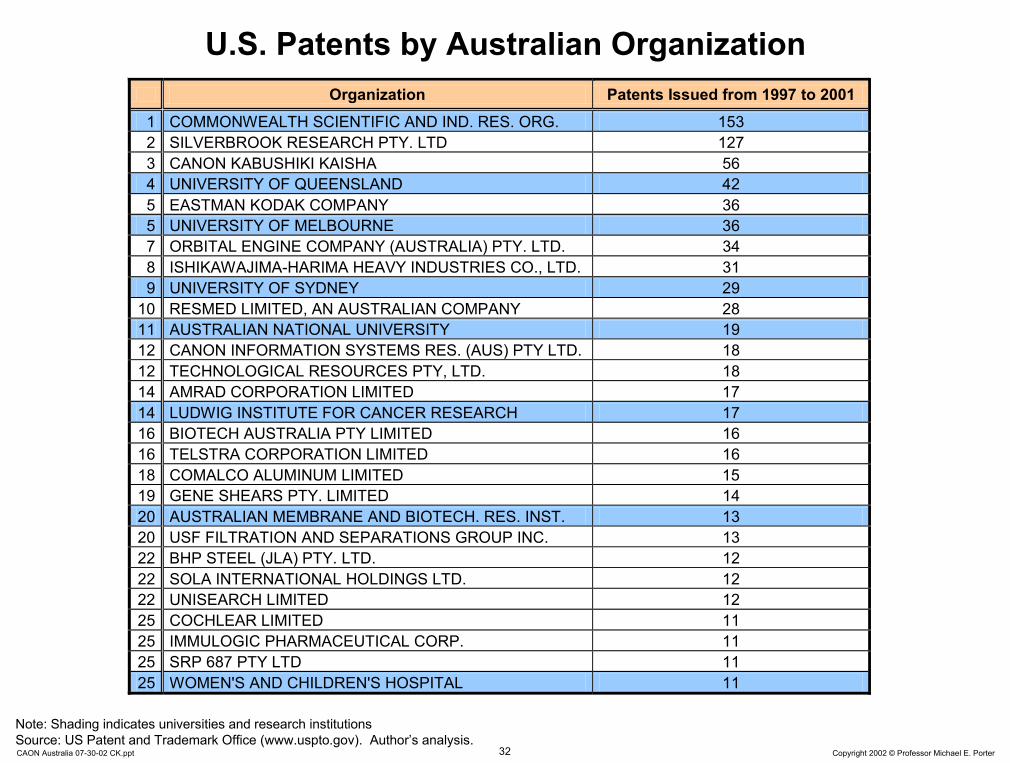
U.S. Patents by Australian Organization Organization Patents Issued from 1997 to 2001 1 COMMONWEALTH SCIENTIFIC AND IND. RES. ORG. 153 2 SILVERBROOK RESEARCH PTY. LTD 127 3 CANON KABUSHIKI KAISHA 56 4 UNIVERSITY OF QUEENSLAND 42 5 EASTMAN KODAK COMPANY 36 5 UNIVERSITY OF MELBOURNE 36 7 ORBITAL ENGINE COMPANY (AUSTRALIA) PTY. LTD. 34 8 ISHIKAWAJIMA-HARIMA HEAVY INDUSTRIES CO., LTD. 31 9 UNIVERSITY OF SYDNEY 29
10 RESMED LIMITED, AN AUSTRALIAN COMPANY 28 11 AUSTRALIAN NATIONAL UNIVERSITY 19 12 CANON INFORMATION SYSTEMS RES. (AUS) PTY LTD. 18 12 TECHNOLOGICAL RESOURCES PTY, LTD. 18 14 AMRAD CORPORATION LIMITED 17 14 LUDWIG INSTITUTE FOR CANCER RESEARCH 17 16 BIOTECH AUSTRALIA PTY LIMITED 16 16 TELSTRA CORPORATION LIMITED 16 18 COMALCO ALUMINUM LIMITED 15 19 GENE SHEARS PTY. LIMITED 14 20 AUSTRALIAN MEMBRANE AND BIOTECH. RES. INST. 13 20 USF FILTRATION AND SEPARATIONS GROUP INC. 13 22 BHP STEEL (JLA) PTY. LTD. 12 22 SOLA INTERNATIONAL HOLDINGS LTD. 12 22 UNISEARCH LIMITED 12 25 COCHLEAR LIMITED 11 25 IMMULOGIC PHARMACEUTICAL CORP. 11 25 SRP 687 PTY LTD 11 25 WOMEN'S AND CHILDREN'S HOSPITAL 11
Note: Shading indicates universities and research institutions
Source: US Patent and Trademark Office (www.uspto.gov). Author’s analysis.

33 Copyright 2002 © Professor Michael E. PorterCAON Australia 07-30-02 CK.ppt
Patents by OrganizationCommonwealth of Massachusetts, 1995–1999
Source: Cluster Mapping Project, Institute for Strategy and Competitiveness, Harvard Business School
Organization Patents Issued from 1995 to 1999 1 DIGITAL EQUIPMENT CORPORATION 382 2 MASSACHUSETTS INSTITUTE OF TECHNOLOGY 369 3 POLAROID CORPORATION 220 4 MASSACHUSETTS GENERAL HOSPITAL 138 5 ANALOG DEVICES, INC. 136 6 HARVARD COLLEGE, PRESIDENT AND FELLOWS 105 7 GENETICS INSTITUTE, INC. 82 8 EMC CORPORATION 82 9 GENERAL ELECTRIC COMPANY 79 10 MOTOROLA, INC. 79 11 QUANTUM CORP. (CA) 79 12 BOSTON SCIENTIFIC CORPORATION 77 13 HEWLETT-PACKARD COMPANY 69 14 CHARLES STARK DRAPER LABORATORY, INC. 66 15 SAINT GOBAIN/NORTON INDUSTRIAL CERAMICS CORP. 65 16 RAYTHEON COMPANY 64 17 BOSTON UNIVERSITY 63 18 BRIGHAM AND WOMEN'S HOSPITAL 62 19 DANA-FARBER CANCER INSTITUTE, INC. 60 20 TEXAS INSTRUMENTS, INCORPORATED 59 21 GILLETTE COMPANY 57 22 SHIPLEY COMPANY INC. 52 23 UNITED STATES OF AMERICA, AIR FORCE 52 24 LISCO, INC. 50 25 HYBRIDON, INC. 48

34 Copyright 2002 © Professor Michael E. PorterCAON Australia 07-30-02 CK.ppt
Scientists & Engineers Researchers Relative To Workforce, Selected Countries
Growth Rate of Researchers, CAGR 1991 - 1999
Researchers per 10’000 Employed, 1998
0
20
40
60
80
100
120
-2% 0% 2% 4% 6% 8% 10%
Italy
Finland
Sweden
UK Canada
US
France
Spain
AUSTRALIA
Japan
Germany
NetherlandsNew Zealand
Note: Finnish Growth Rate for 1991-98Source: OECD, 2001

35 Copyright 2002 © Professor Michael E. PorterCAON Australia 07-30-02 CK.ppt
Number of Company ResearchersSelected OECD Countries
0
10
20
30
40
50
60
70
80
US
Japa
n
Sw
eden
Finl
and
Ger
man
y
Irela
nd UK
Sw
itzer
land
Can
ada
Kor
ea
Fran
ce
Den
mar
k
Net
herla
nds
Aus
tralia
Italy
Spa
in
New
Zea
land
Company Researchers per 10’000 Employed,
1998
OECD Average: 38.9
Source: OECD Science, Technology and Industry Scoreboard 2001.

36 Copyright 2002 © Professor Michael E. PorterCAON Australia 07-30-02 CK.ppt
Australia’s Economic Agenda 2002
• Continue upgrading the microeconomic business environment
• Strengthen innovative capacity
• Mount a broad-based program of cluster development
• Upgrade company strategies
• Pursue stronger economic coordination with neighboring countries
• Articulate a new national economic vision

37 Copyright 2002 © Professor Michael E. PorterCAON Australia 07-30-02 CK.ppt
Related and Supporting Industries
Related and Supporting Industries
Related and Supporting IndustriesAustralia’s Relative Position
Competitive Advantages Relative to GDP per Capita
Competitive Disadvantages Relative to GDP per Capita
Country Ranking
Local Availability of Process Machinery 39
Local Availability of Components and 31Parts
Extent of Product and Process 20Collaboration
Local Supplier Quality 20
State of Cluster Development 16
Local Supplier Quantity 13
Note: Rank by countries; overall Australia ranks 9th (7th on Quality of the National Business Environment; 11th on GDP per Capita) Source: Global Competitiveness Report 2001

38 Copyright 2002 © Professor Michael E. PorterCAON Australia 07-30-02 CK.ppt
Australian Export Performance by Broad Cluster
0%
5%
10%
15%
20%
25%
30%
35%
-7% -6% -5% -4% -3% -2% -1% 0% 1% 2% 3%
Materials/Metals
Food/Beverages*
Textiles/ApparelTransportation Equipment
Health Care
Oil/ChemicalsMultiple
Business
Share of Australian Exports, 2000
Change in Share of Australian Exports, 1995-2000
Note: Wine export growth accounts for >45% of the increase in the export share of food/beveragesSource: UN Trade Statistics

39 Copyright 2002 © Professor Michael E. PorterCAON Australia 07-30-02 CK.ppt
The Australian Wine ClusterTrade Performance
$0
$100
$200
$300
$400
$500
$600
$700
$800
$900
$1,000
1995 1996 1997 1998 1999 20000%
1%
2%
3%
4%
5%
6%
7%
8%
ValueMarket Share
Australian Wine Exports in million US Dollars
Australian Wine World Export Market Share
Source: UN Trade Statistics

40 Copyright 2002 © Professor Michael E. PorterCAON Australia 07-30-02 CK.ppt
Western Australia
South Australia
New South Wales
Victoria
Queensland
Northern Territory
TasmaniaNote: Colored areas indicate wine growing regionsSource: Australian Wine & Brandy Corporation
The Australian Wine ClusterLocations

41 Copyright 2002 © Professor Michael E. PorterCAON Australia 07-30-02 CK.ppt
The Australian Wine ClusterHistory
1955
Australian Wine Research Institute founded
1970
Winemaking school at Charles Sturt University founded
1965
Australian Wine Bureau established
1930
First oenology course at Roseworthy Agricultural College 1990
Winemaker’s Federation of Australia established
1991 to 1998
New organizations created for education, research, market information, and export promotion
1980
Australian Wine and Brandy Corporation established
1980s
Creation of large number of new wineries
1990s
Surge in exports and international acquisitions
1950s
Import of European winery technology
1960s
Recruiting of experienced foreign investors, e.g. Wolf Bass
1970s
Continued inflow of foreign capital and management
Source: Michael E. Porter and Örjan Sölvell, The Australian Wine Cluster – Supplement, Harvard Business School Case Study, 2002

42 Copyright 2002 © Professor Michael E. PorterCAON Australia 07-30-02 CK.ppt
The Australian Wine ClusterRecently founded Institutions for Collaboration
Winemakers’ Federation of AustraliaWinemakers’ Federation of Australia
Established in 1990
Focus: Public policy representation of companies in the wine cluster
Funding: Member companies
Established in 1990
Focus: Public policy representation of companies in the wine cluster
Funding: Member companies
Cooperative Centre for ViticultureCooperative Centre for Viticulture
Established in 1991
Focus: Coordination of research and education policy in viticulture
Funding: other cluster organizations
Established in 1991
Focus: Coordination of research and education policy in viticulture
Funding: other cluster organizations
Australian Wine Export CouncilAustralian Wine Export Council
Established in 1992
Focus: Wine export promotion through international offices in London and San Francisco
Funding: Government; cluster organizations
Established in 1992
Focus: Wine export promotion through international offices in London and San Francisco
Funding: Government; cluster organizations
Grape and Wine R&D CorporationGrape and Wine R&D Corporation
Established in 1991 as statutory body
Focus: Funding of research and development activities
Funding: Government; statutory levy
Established in 1991 as statutory body
Focus: Funding of research and development activities
Funding: Government; statutory levy
Wine Industry Information ServiceWine Industry Information Service
Established in 1998
Focus: Information collection, organization, and dissemination
Funding: Cluster organizations
Established in 1998
Focus: Information collection, organization, and dissemination
Funding: Cluster organizations
Wine Industry National Education and Training Council
Wine Industry National Education and Training Council
Established in 1995
Focus: Coordination, integration, and standard maintenance for vocational training and education
Funding: Government; other cluster organizations
Established in 1995
Focus: Coordination, integration, and standard maintenance for vocational training and education
Funding: Government; other cluster organizations
Source: Michael E. Porter and Örjan Sölvell, The Australian Wine Cluster – Supplement, Harvard Business School Case Study, 2002

43 Copyright 2002 © Professor Michael E. PorterCAON Australia 07-30-02 CK.ppt
Australia’s Economic Agenda 2002
• Continue upgrading the microeconomic business environment
• Strengthen innovative capacity
• Mount a broad-based program of cluster development
• Upgrade company strategies
• Pursue stronger economic coordination with neighboring countries
• Articulate a new national economic vision

44 Copyright 2002 © Professor Michael E. PorterCAON Australia 07-30-02 CK.ppt
Current Competitiveness IndexAustralia’s Position over Time
Rank
1
Current Competitivenss Rank National BusinessEnvironment Rank
Company Operation &Strategy Rank
1998199920002001
5
10
15
20
25
30
Source: Global Competitiveness Report 2001
45 Copyright 2002 © Professor Michael E. PorterCAON Australia 07-30-02 CK.ppt
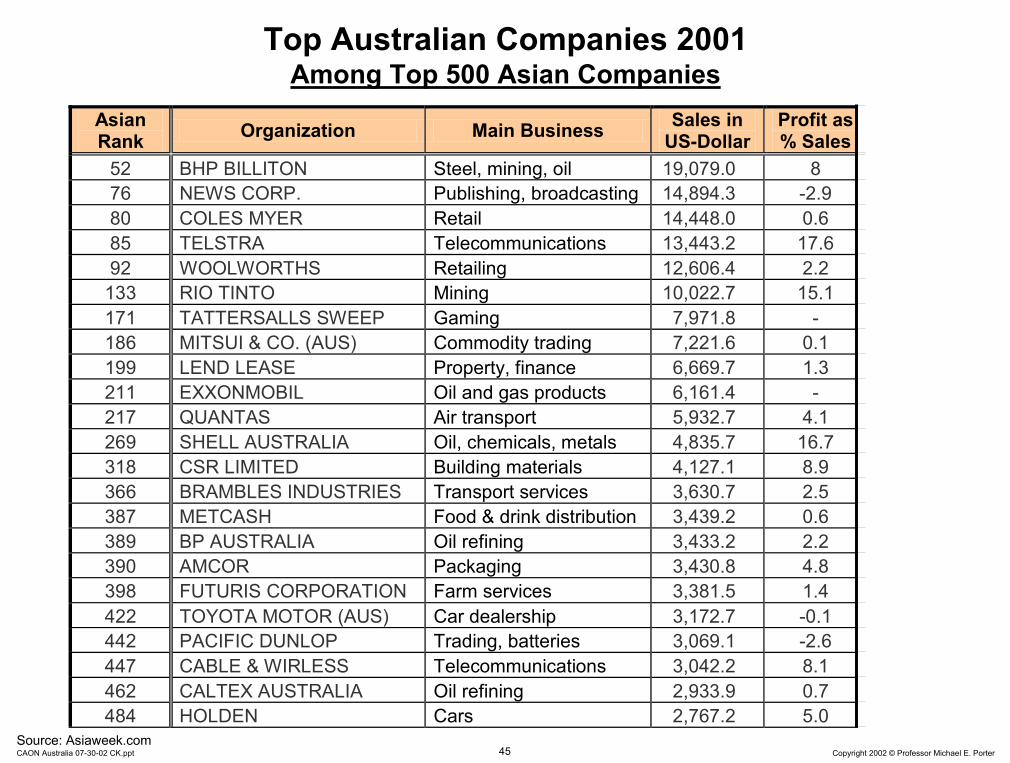
Top Australian Companies 2001Among Top 500 Asian Companies
Asian Rank Organization Main Business Sales in
US-Dollar Profit as % Sales
52 BHP BILLITON Steel, mining, oil 19,079.0 8 76 NEWS CORP. Publishing, broadcasting 14,894.3 -2.9 80 COLES MYER Retail 14,448.0 0.6 85 TELSTRA Telecommunications 13,443.2 17.6 92 WOOLWORTHS Retailing 12,606.4 2.2
133 RIO TINTO Mining 10,022.7 15.1 171 TATTERSALLS SWEEP Gaming 7,971.8 - 186 MITSUI & CO. (AUS) Commodity trading 7,221.6 0.1 199 LEND LEASE Property, finance 6,669.7 1.3 211 EXXONMOBIL Oil and gas products 6,161.4 - 217 QUANTAS Air transport 5,932.7 4.1 269 SHELL AUSTRALIA Oil, chemicals, metals 4,835.7 16.7 318 CSR LIMITED Building materials 4,127.1 8.9 366 BRAMBLES INDUSTRIES Transport services 3,630.7 2.5 387 METCASH Food & drink distribution 3,439.2 0.6 389 BP AUSTRALIA Oil refining 3,433.2 2.2 390 AMCOR Packaging 3,430.8 4.8 398 FUTURIS CORPORATION Farm services 3,381.5 1.4 422 TOYOTA MOTOR (AUS) Car dealership 3,172.7 -0.1 442 PACIFIC DUNLOP Trading, batteries 3,069.1 -2.6 447 CABLE & WIRLESS Telecommunications 3,042.2 8.1 462 CALTEX AUSTRALIA Oil refining 2,933.9 0.7 484 HOLDEN Cars 2,767.2 5.0
Source: Asiaweek.com

46 Copyright 2002 © Professor Michael E. PorterCAON Australia 07-30-02 CK.ppt
Asian Top 1000Companies per 1 million
population
Average Sales per Company, $-US bn
Company Size and Country SizeAsian Top 1000 Companies, 2000
0
2
4
6
8
10
2 3 4 5 6 7 8
AUSTRALIA
PR ChinaIndonesia
Japan
South KoreaNew Zealand
Singapore
Taiwan
Hong Kong
IndiaMalaysiaThailand
= 100 Companies
Source: Asiaweek (2001), EIU (2002), author calculations

47 Copyright 2002 © Professor Michael E. PorterCAON Australia 07-30-02 CK.ppt
-2
-1
0
1
2
3
4
5
Hon
g K
ong
Mal
aysi
a
Chi
na
Indi
a
Taiw
an
Aus
tralia
Sin
gapo
re
New
Zea
land
Japa
n
Indo
nesi
a
Thai
land
S K
orea
Net Profit/Company average: $91 milSales/Company average: $5.4bnAssets/Company average: $6.3bn
Asian Top 1000
Company average 2000 = 1
13.1
Source: Asiaweek.com
Australian Companies in ComparisonAsian Top 1000 Companies, 2000

48 Copyright 2002 © Professor Michael E. PorterCAON Australia 07-30-02 CK.ppt
Company Operations and StrategyAustralia’s Relative Position
Degree of Customer Orientation 2
Reliance on Professional Management 5
Willingness to Delegate Authority 6
Competitive Advantages Relative to GDP per Capita
Country Ranking
Company Spending on R&D 46
Value Chain Presence 40
Control of International Distribution 36
Breadth of International Markets 35
Capacity for Innovation 28
Extent of Branding 25
Nature of Competitive Advantage 25
Uniqueness of Product Designs 22
Production Process Sophistication 17
Extent of Marketing 15
Extent of Incentive Compensation 11
Extent of Staff Training 11
Competitive Disadvantages Relative to GDP per Capita
Country Ranking
Note: Rank by countries; overall Australia ranks 9 (24 on Company Operations and Strategy)Source: Global Competitiveness Report 2001

49 Copyright 2002 © Professor Michael E. PorterCAON Australia 07-30-02 CK.ppt
Company Spending on R&DRelative to GDP, 1989 - 1999
0
0.5
1
1.5
2
2.5
3
-4% -2% 0% 2% 4% 6% 8% 10% 12% 14%
AUSTRALIA
UK
Sweden
Spain
NLNorway
Germany
Italy
France
Finland
New Zealand
USA
Canada
Company R&D Spending as Share of GDP,
1999 or latest
Company R&D Spending as Share of GDP, CAGR, 1989 – 1999 or latest
Japan
Source: OECD Science, Technology and Industry Scoreboard 2001.

50 Copyright 2002 © Professor Michael E. PorterCAON Australia 07-30-02 CK.ppt
Australia’s Economic Agenda 2002
• Continue upgrading the microeconomic business environment
• Strengthen innovative capacity
• Mount a broad-based program of cluster development
• Upgrade company strategies
• Pursue stronger economic coordination with neighboring countries
• Articulate a new national economic vision

51 Copyright 2002 © Professor Michael E. PorterCAON Australia 07-30-02 CK.ppt
The Mutual Dependence of Nations and Regions
• A nation’s economic growth and prosperity can be greatly enhanced by healthy neighboring economies- Larger, accessible markets for exports and foreign investment- Nations become more attractive as places to invest- Nations can focus on their unique strengths
• A nation will inevitably suffer if it is amid countries that are not prospering
• A nation’s productivity can be enhanced by regional coordination

52 Copyright 2002 © Professor Michael E. PorterCAON Australia 07-30-02 CK.ppt
Regional Strategy and CompetitivenessTraditional Views• Regions as free trade zones; regions as economic unions (e.g. European Union)
New View• A regional strategy as a powerful tool to enhance competitiveness in autonomous countries:
– Company Operations and Strategy• Increasing internal trade and investment • Enhancing the competitive capability of firms• Expanding trade in non-traditional export industries
– Business Environment• Policy coordination enhance the quality of the business environment
– Cluster Development• Cross-border cluster specialization and integration
– Economic Policy Process• Improving economic policy formulation and implementation at the national level
– Attracting Foreign Investment• Enhancing interest and investment in the region by the international community
• Competitiveness is often more readily achieved and sustained in moderately sized, competing economic units

53 Copyright 2002 © Professor Michael E. PorterCAON Australia 07-30-02 CK.ppt
Levels of Regional Economic Cooperation
• A regional agenda for Oceania can support deeper integration at the microeconomic level
• APEC can offer a level playing field for trade and investment
• Coordinate efforts to enhance the microeconomic business environment
• Cross-border cluster integration anddevelopment
• Proximity enables countries to achieve much deeper integration and enhance the attractiveness of the region to the outside world
• Regional institutions and governance are required to steer this process
Groups of Proximate Neighboring Nations,
e.g. Oceania
Groups of Proximate Neighboring Nations,
e.g. Oceania
Broad Economic Areas,
e.g. APEC
Broad Economic Areas,
e.g. APEC
• Remove barriers to trade, investment, and factor movement
• Establish common minimum standards and coordinate investments in joint physical infrastructure

54 Copyright 2002 © Professor Michael E. PorterCAON Australia 07-30-02 CK.ppt
Australia’s Economic Agenda 2002
• Continue upgrading the microeconomic business environment
• Strengthen innovative capacity
• Mount a broad-based program of cluster development
• Upgrade company strategies
• Pursue stronger economic coordination with neighboring countries
• Articulate a new national economic vision

55 Copyright 2002 © Professor Michael E. PorterCAON Australia 07-30-02 CK.ppt
Country Size and Competitiveness• Large country size is still considered to be an important asset for
competitiveness– Large domestic markets are seen as necessary for companies to exploit
economies of scale in production– Size is seen as giving clout in international economic policy negotiations
• An advantage of size for competitiveness is not substantiated by the evidence
– Many small countries have been exceptionally successful in improving their economic performance
– Companies from small countries like Estonia, Finland, Singapore, Switzerland, and Taiwan have been among the leaders in competing successfully in world markets
• Small country size offers advantages that are often overlooked– Small countries tend to be more open for trade and investment because there is
no pretext of self-sufficiency and protectionist policies inflict higher costs – Small domestic markets push companies to meet international competition early,
and to internationalize based on an understanding of sophisticated customers– Small countries can find it easier to create consensus on the need for economic
upgrading, and be quicker in implementing change– The disadvantages of small countries are readily overcome by specialization,
internationalization of markets, and outsourcing

56 Copyright 2002 © Professor Michael E. PorterCAON Australia 07-30-02 CK.ppt
Economic Performance and Country SizeSelected OECD Countries
0
20
40
60
80
100
120
140
0% 1% 2% 3% 4% 5% 6% 7%
Canada
Germany
South Korea
New Zealand SingaporeSweden
Taiwan
US (275)
AUSTRALIA
Japan
UK
Finland Ireland*
Compound annual growth rate of real GDP per capita, 1990-2000
Population Size in Million,
2000
Portugal
Spain
Note: Irish GNP per capita is about 20% lower than the reported GDP per capita figure due to large dividend outflows to foreign investors. We use GNP per capita for Ireland because it is more representative. For other countries GDP and GNP are very similar.
Source: WEO

57 Copyright 2002 © Professor Michael E. PorterCAON Australia 07-30-02 CK.ppt
Competitiveness Upgrading and Prosperity ImprovementTime Lags Between Policy Change and Outcome
• Changing policies– Competitiveness initiatives require concerted policy action on
many different levels that take time to coordinate– Individual policies and initiatives require years to develop
• Changing behavior– It takes time for new rules and incentives to influence behavior
and investment patterns
• Changing outcomes– Upgrading of innovative capacity and changing patterns of
company behavior take time to show up in outputs
• Improving competitiveness is a marathon, not a sprint• Success depends on maintaining found momentum, not just having
a quick start

58 Copyright 2002 © Professor Michael E. PorterCAON Australia 07-30-02 CK.ppt
Backup

59 Copyright 2002 © Professor Michael E. PorterCAON Australia 07-30-02 CK.ppt
Web resources
• Institute for Strategy and Competitiveness www.isc.hbs.edu
• ISC Cluster Mapping Data (US) data.isc.hbs.edu/isc/index.jsp
• Cluster of Innovation Initiative– Council on Competitiveness www.compete.org– Monitor Company www.monitor.com
• Global Competitiveness Report www.weforum.org

60 Copyright 2002 © Professor Michael E. PorterCAON Australia 07-30-02 CK.ppt
Australia’s Unique Advantages
• Endowments– Natural-resources as a base to develop clusters
• Opportunities to become export in managing natural-resource businesses around the world
• But need to identify missing activities for such clusters• History
– Cultural bridge between Asia, North America, and Europe• Opportunities to play bridging role in education, media, and other
areas• But need to embrace all three cultures
• Geography– Large distances inside and to other parts of the region
• Opportunities to service sophisticated demand related to remoteness
• But need companies and research institutions to explore potential
• Australia needs to leverage its uniqueness as a basis for competitive advantage