
Portfolio Valuation in Early Drug Development: A ...
67
1 Portfolio Valuation in Early Drug Development: A Systematic Accounting of Utility by Benjamin T. Burley B.S. Molecular Biology Reed College, 1999 SUBMITTED TO THE DEPARTMENT OF SYSTEM DESIGN AND MANAGEMENT IN PARTIAL FULFILLMENT OF THE REQUIREMENTS FOR THE DEGREE OF MASTER OF SCIENCE IN ENGINEERING AND MANAGEMENT AT THE MASSACHUSETTS INSTITUTE OF TECHNOLOGY JUNE 2016 ©2016 Benjamin T Burley. All rights reserved. The author hereby grants to MIT permission to reproduce and to distribute publicly paper and electronic copies of this thesis document in whole or in part in any medium now known or hereafter created. Signature of Author: ______________________________________________________ Department of System Design and Management May 18, 16 Certified by: ____________________________________________________________ Bruce Cameron Lecturer of Engineering Systems Thesis Supervisor Accepted by: ___________________________________________________________ Patrick Hale Senior Lecturer of Engineering Systems Director, System Design and Management Program
Transcript of Portfolio Valuation in Early Drug Development: A ...

1
Portfolio Valuation in Early Drug Development:
A Systematic Accounting of Utility
by
Benjamin T. Burley
B.S. Molecular Biology Reed College, 1999
SUBMITTED TO THE DEPARTMENT OF SYSTEM DESIGN AND MANAGEMENT IN PARTIAL FULFILLMENT OF THE REQUIREMENTS FOR THE DEGREE OF
MASTER OF SCIENCE IN ENGINEERING AND MANAGEMENT
AT THE MASSACHUSETTS INSTITUTE OF TECHNOLOGY
JUNE 2016
©2016 Benjamin T Burley. All rights reserved.
The author hereby grants to MIT permission to reproduce and to distribute publicly paper and electronic
copies of this thesis document in whole or in part in any medium now known or hereafter created.
Signature of Author: ______________________________________________________
Department of System Design and Management May 18, 16
Certified by: ____________________________________________________________
Bruce Cameron Lecturer of Engineering Systems
Thesis Supervisor Accepted by: ___________________________________________________________
Patrick Hale Senior Lecturer of Engineering Systems
Director, System Design and Management Program

2
This page intentionally left blank.

3
Portfolio Valuation in Early Drug Development:
A Systematic Accounting of Utility
by
Benjamin T Burley
Submitted to the Department of System Design and Management
on May, 16 in Partial Fulfillment of the Requirements for the Degree of Master of Science in
Engineering and Management
Pharmaceutical drug development is exhibiting a consistent trend of increased R&D
investment required per successful therapy brought to market. Simultaneously, cultural and political sentiment is increasingly putting downward pricing pressure on new therapies. In this difficult environment it is clear increases in efficiency, as far upstream in this development process as possible, are critical. One aspect of efficiency in this industry is the accuracy with which drugs in early development are valued; this valuation is performed in consideration of multiplied criteria with significant ambiguity and extensive uncertainty, and typically in the context of multiple drugs in the development pipeline. This thesis develops an approach to this drug portfolio valuation process that is intended to reduce human bias in the decision process, and increase the consistency of multi-criteria consideration.
This valuation model for drugs in early development considers monetary and utility values in conjunction with a rules based expert system to estimate the value of a portfolio of drugs. This model takes categorical and continuous inputs about drugs in development and maps this to value to the relevant company or investment group. Specifically, the model utilizes scorings for individual drugs along many criteria and a formal representation of the relevant company’s structure and strategic goals as input. Applying value functions that use non-linear relationships between input capability and the resulting value to the company, an amalgamated utility value is estimated for the drug portfolio in the context of a given company and / or investment strategy. This value mapping allows for the inclusion of expert knowledge and judgement to a systematic and consistent assessment of multiple criteria.
The outputs of the system allow for visual and quantitative comparisons of potential groups of drugs for development. The model produces an amalgamated utility valuation for the portfolios under consideration, with the capability to analyze a set of portfolios with multiple strategic scenarios, and produces visual comparisons of these multiple scenarios. In addition, the model estimates an adjusted net present value for the portfolios with weighted input from the various assessment criteria. Initial results from this modelling are not predictive at this stage, but illustrate the capability of this model to reduce decision bias and improve the capacity for consideration of many relevant criteria. Thesis Supervisor: Bruce Cameron Title: Lecturer of Engineering Systems

4
This page intentionally left blank.

5
This thesis has only been possible with the endless support from my wife Briney, and the
kind understanding of my two kids Sam and Dillon. I love you guys endlessly. I am so grateful to them and all of my family and friends for their help over the last two years.
I am indebted to Dr. Bruce Cameron for his patient understanding and thorough feedback
during the development of this work. Further I am very grateful to Pat Hale and everyone who makes SDM such an incredible program.
This work is dedicated to our most dear dog Lola, my most faithful supporter. I would not
be where I am without the quiet relentless companionship she gave me every day. I am always indebted to her.

6
This page intentionally left blank.

7
Table of Contents Abstract ........................................................................................................................................... 3
Acknowledgements ......................................................................................................................... 5
List of Figures ................................................................................................................................. 9
List of Tables ................................................................................................................................ 10
Chapter 1 : Introduction ................................................................................................................ 11
I. Motivations ........................................................................................................................ 11
II. Objective ........................................................................................................................ 11
III. Background .................................................................................................................... 12
IV. Specific objective ........................................................................................................... 15
V. Overview ........................................................................................................................ 15
Chapter 2: Drug Development Landscape and Portfolio Management ........................................ 16
I. Overview of drug development process: ........................................................................... 16
II. Early drug development: valuation ................................................................................ 19
III. Fundamentals of portfolio valuation .............................................................................. 23
IV. Expert systems and rules based systems: ....................................................................... 24
V. Human psychology in decision making ......................................................................... 26
Chapter 3: Pharmaceutical Early Development - Decision Making, Valuation and Portfolios.... 27
Current drug and portfolio management in practice .......................................................... 27
II. Case studies in drug portfolio decision making: ............................................................ 33
Merck – Serono ..................................................................................................................... 33
Smithkline – Beecham .......................................................................................................... 34
III. Literature review: improvements in portfolio decision making ..................................... 35
IV. Summary of industry input and consideration of current process .................................. 40
Chapter 4: Proposal for improvement to value assessment .......................................................... 42
A note on data for modelling: ............................................................................................... 43
An expert system for early development portfolio valuation ............................................ 43
II. User inputs to model: ..................................................................................................... 44
Input: Individual drug valuations: ......................................................................................... 44
Input: Corporate strategy and structure: ............................................................................... 46
Input: Alternative scenarios .................................................................................................. 47
Input: criteria priority (weighting) ........................................................................................ 48
Input: drugs in development ................................................................................................. 48
Input: Value functions and model parameters ...................................................................... 48
8
III. Model valuation process: ............................................................................................... 49
Portfolio generation: ............................................................................................................. 49
Translation of input capability to stakeholder requirements – value functions: ................... 49
Rationale and explanation of each value function: ............................................................... 52
Rules for value functions and relevant model parameters: ................................................... 53
Synthesis of individual criteria valuations: ........................................................................... 54
Interface, practical use and data: ........................................................................................... 56
Chapter 5: Output and Discussion ................................................................................................ 57
Value of individual outputs: ............................................................................................... 57
II. Aggregate portfolio value outputs .................................................................................. 60
III. Discussion of model outputs and applications: .............................................................. 62
Chapter 6: Conclusion................................................................................................................... 63
Contributions to Early Drug Portfolio Assessment ........................................................... 63
II. Criticisms and future work ............................................................................................. 63
Bibliography ................................................................................................................................. 64

9
Figure 1 – BMI Research pharmaceutical sales projections ......................................................... 13
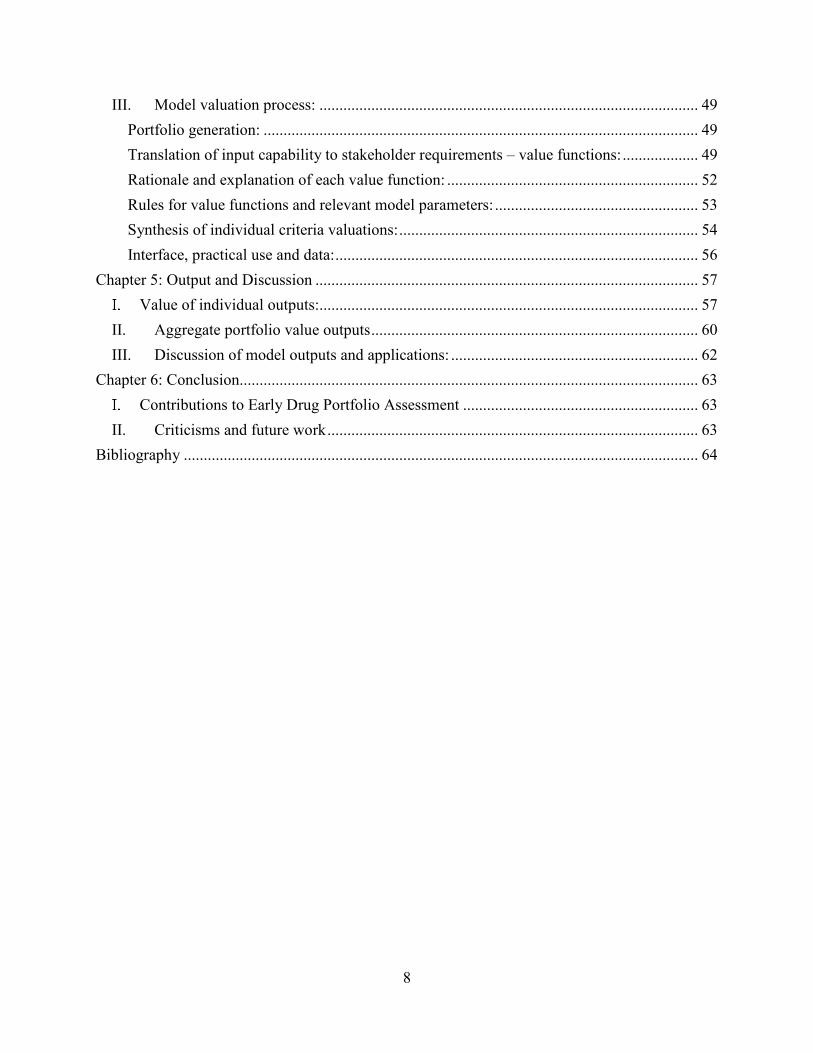
Figure 2 – Rates of product failure through clinical phases (Pammolli et al. 2011) .................... 14
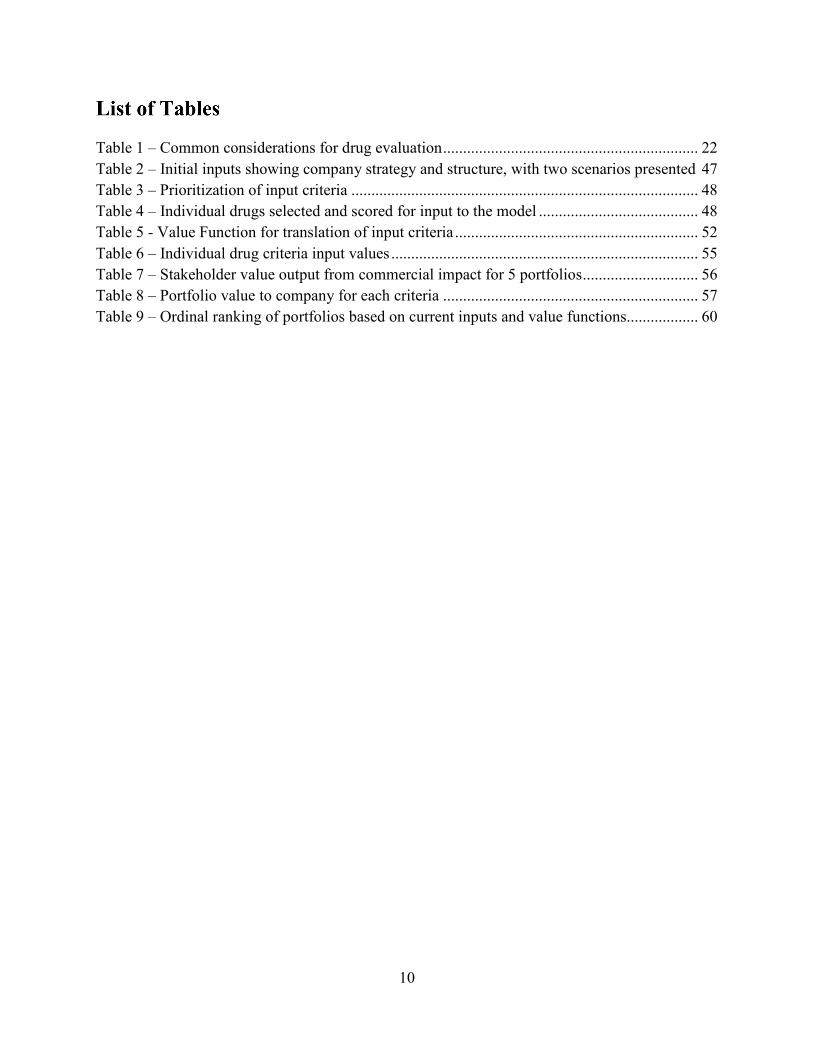
Figure 3 – healthaffairs.org presentation of healthcare costs vs. GDP (1960 – 2012) ................. 14
Figure 4 - Typical Drug Discovery and Development Process .................................................... 16
Figure 5 – Detailed review of target and compound assessment (including hit to lead) .............. 18
Figure 6 - Expected cash flow for NPV calculation ..................................................................... 20
Figure 7 – Bayer’s development decision structure with “stop-or-go” points (Gassmann et al) . 22
Figure 8 – Blau et al. (2004), example of bubble chart ................................................................ 31
Figure 9 – 3D analysis from Betz (2011)...................................................................................... 32
Figure 10 – Aurentz et al. (2011) revision of portfolio management at Merck ............................ 34
Figure 11 – Day (2007) Risk matrix ............................................................................................. 39
Figure 12 – Bode-Gruel and Nickisch (2008) Portfolio management process ............................. 40
Figure 13- Overview of Valuation Model .................................................................................... 44
Figure 14 – Initial filtering of portfolios on budget and revenue goal .......................................... 50
Figure 15 – Representation of value function tuning with exponential graph .............................. 54
Figure 16 - Criteria valuation for 5 drug portfolios. NPV shown in black ................................... 58
Figure 17 – Box plot of ordinal ranking of portfolios. Red and blue show valuation for 2
scenarios ........................................................................................................................................ 59
Figure 18 – Conditional NPV for 2 strategies (scenario A = squares, scenario B = circles) ........ 61
10
Table 1 – Common considerations for drug evaluation ................................................................ 22
Table 2 – Initial inputs showing company strategy and structure, with two scenarios presented 47
Table 3 – Prioritization of input criteria ....................................................................................... 48
Table 4 – Individual drugs selected and scored for input to the model ........................................ 48
Table 5 - Value Function for translation of input criteria ............................................................. 52
Table 6 – Individual drug criteria input values ............................................................................. 55
Table 7 – Stakeholder value output from commercial impact for 5 portfolios ............................. 56
Table 8 – Portfolio value to company for each criteria ................................................................ 57
Table 9 – Ordinal ranking of portfolios based on current inputs and value functions.................. 60

11
Motivations
Product portfolio decision making in a technical field such as pharmaceutical development is a complex interaction between scientific development, financial analysis, and human capabilities for judgement and information synthesis. These decision are made early in the long development cycle and therefore occur amidst high uncertainty, yet these decisions are extremely influential for both the company’s financial success as well as healthcare costs overall. Furthermore, pharmaceutical development is exhibiting a consistent trend of increased R&D investment required per successful therapy brought to market. Since 2004, worldwide pharmaceutical spending has increased over 60%, yet FDA approvals have at best flat lined and average approval in the 2000’s were almost 25% lower than in the 1990’s (Hay et al. 2014). Simultaneously, cultural and political sentiment is increasing critical of current medicine pricing. In its extreme, this is embodied by recent US Senate hearings over Valeant Pharmaceuticals prices increases of up to 812% on recently acquired drugs. More generally, pharmaceutical companies have been substituting cost increases of existing drugs for new product revenue, exacerbating government pressure for better value and cost justification (Thomas 2016). In this environment it is clear that increases in accuracy of value estimates, as far upstream in the development process as possible, are critical to reduce corporate costs and improve efficiency.
Therapy portfolio (pipeline) development requires assessment of technological and
competitive environments, regulatory impacts, intellectual property issues, and the conditions of corporate strategy and structure. Current practice relies heavily on qualitative discussion of these factors for budgetary approval of individual compounds, with a shift in later development to an explicit monetary valuation, typically using a discounted cash flow analysis. Despite this being common industry practice, discounted cash flows as the quantitative method for value estimation is considered an insufficient predictor of eventual product value. Furthermore, as seen in other complex industries, effective project/portfolio management is an exceedingly challenging decision process when multiple variables and stakeholder needs must be considered at a given time. Finally, this product development depends on a thorough scientific understanding of the underlying biological dynamics with only a small amount of empirical support. In summary this process faces three primary challenges:
1. Large scientific uncertainty 2. Limitation of human decision making with many criteria for assessment 3. Lack of appropriate quantitative methods to support value estimates
Based on the above trend of decreased productivity, and the corporate and societal need for effective new medical therapies, this work is focused on supporting and improving assessment of early development drug portfolios.
Objective
The objective of this work is to assess current practices in pharmaceutical drug development, and propose improvements in the management of drug development decisions by bolstering two of the three challenges mentioned above: human decision making challenges, and quantitative analysis of value in early development. In particular, this work addresses the decisions to select

12
from a group of potential products early in their development; these decisions are considered in the context of current products on market or in development, overarching corporate strategy goals, and the structure of the deciding organization.
Although the early development phase of pharmaceuticals is often thought of as a scientific
process, prior to the ‘business’ of drug development, decisions in this phase determine the products main characteristics critically influence a drugs success. In reality the phase of development represent the initial synthesis of scientific understanding, market assessment, and considerations of the company’s larger situation. The scientific understanding of the relevant disease and mechanisms for affecting its course dominate the value and success rate of a given drug. Initial discovery is followed by various scientific validation, as well as initial product analysis (potential market, alignment with business, etc.). As discussed subsequently, this work will focus on decision making for a portfolio of products in early development, when a number of therapies are in development but the large expense of a clinical trial has not begun.
Notably, this work will focus on drug development in the United States, although it is
primarily applicable to many countries. To support the decision process, and in accordance with current practice in the industry, this thesis will consider estimations of monetary value, as well as: risk, product maturity and other risk factors, alignment with larger strategic goals and current organizational strengths and weaknesses. The intent of the system developed here is to leverage current knowledge in the industry in conjunction with expert judgment and experience in drug development, while reducing bias and limits of assessment found in human decision making.
Background Developing therapies for human disease is a research intensive, highly regulated, and
expensive process, while providing a product improving human lives in fundamental ways. In fact in recent years, the average development costs for a single compound have been easily in excess of $ 1B US, with development time from 12-15 years, depending on the disease area and novelty of the treatment (Hughes et al. 2011). Countering these costs are a huge market with 10 year US sales projections for the industry exceeding $450B (Figure 11) according to BMI Research.

13
Figure 1 – BMI Research pharmaceutical sales projections
Early in the history of drug development, a compound’s efficacy was determined through circumstance or even pure chance, with very little know about how or why a compound improved symptoms or causes of disease. For instance, aspirin was first synthesized in 1897, but its biological function in pain reduction was not determined until John Robert Vane identified its capacity to reduce the production of prostaglandins in 1971 (Mekaj, Daci, and Mekaj 2015).
Despite incredible advances in biological understanding of disease and dysfunction, in
addition to ever expanding technologies for modification of physiological functioning, there are still large gaps in scientific understanding for the analysis and development of new therapies. This uncertainty drives research and development costs as well as the extensive regulatory system that surrounds the development and human treatment with new treatments. In the US, the FDA is the regulatory body that control the testing and review required prior to marketing and sale of pharmaceuticals. Obviously great caution is warranted prior to treating a human with a novel chemical intended to have biological effect.
Due to a combination of this scientific uncertainty, company strategy, and other potential
factors, the success of a given compound to proceed from discovery to market ranges from 1% - 11% (Pammolli, Magazzini, and Riccaboni 2011). Once a product has proceeded through early development, the drug is typically tested in three phases of clinical trials. As seen in Figure 22, success through these stages of validation are trending downward in recent years; this loss of productivity is unsustainable and of great concern.
The causes of reduced output in the industry is a highly debated; a common cause noted is
that the ‘low hanging fruit’ has been picked, both in regards to easily developed compounds and easily affected conditions. More complex regulation, corporate focus on short term revenue, and the need for more collaborative development models are other causes frequently considered (Kola and Landis 2004).
14
Figure 2 – Rates of product failure through clinical phases (Pammolli et al. 2011)
In summary, the pharmaceutical industry has incredible potential both financially and for
collective good, but it is experiencing unsustainable trends of reduced R&D productivity. This dynamic is considered in the context of increasing health care costs and elevation of the prevalence of relatively underserved diseases such as cancer, diabetes, and Alzheimer’s. Although pharmaceuticals only represent around 10% of health care costs, these increasing costs relative to GDP are concerning (see Figure 33); in addition effective pharmaceutical treatments are a path to reducing these overall costs.
With productivity trending down and cost quickly increasing, improvements in the industry
are critical for individual companies as well as our collective financial stability. Therefore, this work will address one area for potential improvement: the management and financial analysis that drives decisions on compounds in early development.
Figure 3 – healthaffairs.org presentation of healthcare costs vs. GDP (1960 – 2012)
15
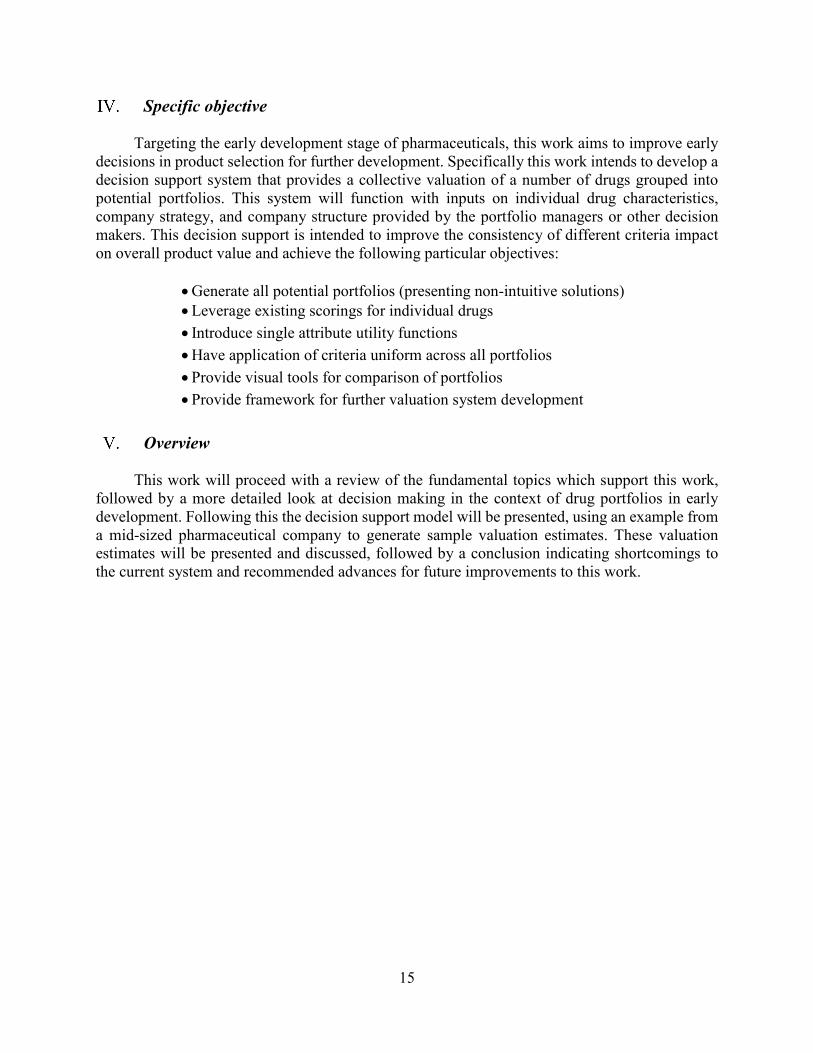
Specific objective Targeting the early development stage of pharmaceuticals, this work aims to improve early
decisions in product selection for further development. Specifically this work intends to develop a decision support system that provides a collective valuation of a number of drugs grouped into potential portfolios. This system will function with inputs on individual drug characteristics, company strategy, and company structure provided by the portfolio managers or other decision makers. This decision support is intended to improve the consistency of different criteria impact on overall product value and achieve the following particular objectives:
• Generate all potential portfolios (presenting non-intuitive solutions)
• Leverage existing scorings for individual drugs
• Introduce single attribute utility functions
• Have application of criteria uniform across all portfolios
• Provide visual tools for comparison of portfolios
• Provide framework for further valuation system development
Overview This work will proceed with a review of the fundamental topics which support this work,
followed by a more detailed look at decision making in the context of drug portfolios in early development. Following this the decision support model will be presented, using an example from a mid-sized pharmaceutical company to generate sample valuation estimates. These valuation estimates will be presented and discussed, followed by a conclusion indicating shortcomings to the current system and recommended advances for future improvements to this work.

16
Overview of drug development process:
Human pharmaceuticals represents one of the most stringent and challenging products to develop – not only does the product need to modulate the complex system of multi-cellular biological interactions, regulations and societal concern about the efficacy and safety of these compounds results in a dense regulatory approval process. Contemporary discovery and development of pharmaceutical therapies begins with the scientific process of target and drug identification; these therapies are then optimized in regards to physiological factors as well as the enterprise, strategy, and marketing considerations of the responsible company. Given the ethical and financial cost of human trails, only thoroughly vetted therapies proceed to human clinical trials to make a full in-vivo human assessment of efficacy and safety where, upon FDA approval (US markets only), they may be marketed and prescribed. This discovery and development process can vary considerably and each step noted is the source of active research in itself; for this work, a general process review will suffice.
As seen in Figure 44, the process begins with identification of innate targets that should
modulate disease behavior and/or progression. These are the proteins or other extant chemicals in the human body that can be modified or regulated to effect desirable symptomatic change in a patient.
Figure 4 - Typical Drug Discovery and Development Process
Once identified, targets are investigated to validate their potential to act on the biological
system of interest. Indications of a target’s role in a disease state are easily inferred from academic research on similar pathways or in different animals models, but a great deal of additional testing is required to confirm this potential in the appropriate human system. Although the goal is to identify tangible changes in humans, at this early stage various preliminary validation is required.
Examples of this process include in-vitro assays that exhibit protein modifications
downstream of the target, or in-vivo verification such as gene knock-outs. As reviewed by Hughes

17
et al.( 2011), not only should the target effect biological functioning, it should also be “druggable”, with reasonable expectation that available compounds / therapies can act on the target. The scale of human therapy targets is vast, as Benjamin (2015) notes there are over 8,200 potential macromolecular targets suitable for traditional drug therapies. This range of targets expands considerably as genetic and other modern experimental treatments are considered. Regardless of the specific approach, critically this step should confirm target value prior to assessment of affecting compounds or other therapies.
Contemporary drug development can focus on various therapies such as ‘traditional’ small
molecules, or antibodies, RNA technologies, gene therapies or gene modulators collectively known as biologics (as reviewed by Espiritu et al., 2014). Small molecules are the most common treatments in current use. These are chemicals of various molecular make up that can be synthesized through standard organic chemistry processes and typically act on a protein or proteins in the body to the desired effect. Typically these compounds fit in binding sites of the target protein, and modulate its behavior. For instance statins (e.g. Lipitor), which reduce cholesterol, function by binding to and reducing the activity of an enzyme used by cells to synthesize cholesterol(Martin et al. 2001). More recently biologically engineered antibodies and other protein products, and various genetic based therapies are being developed to effect human disease targets. A well-known example is Herceptin, a popular monoclonal antibody (Trastuzumab, developed by Genetech) that binds to a cell surface protein and effects downstream intra-cellular signaling through a highly specific protein-protein interaction. Unlike small molecules, these are biologically derived compounds, frequently involving the modification of cells for production and subsequent extraction of the product of interest.
Regardless of the chemical nature of the therapy, possible compounds need to be screened
to find initial interaction with the intended target – a process called Hit Identification. Paul Ehrlich first developed a large scale chemical screen to find a treatment for syphilis, testing hundreds of related compounds to find selective activity on bacteria that remained relatively non-toxic to human cells. This notion of testing related compounds to find the necessary collection of treatment characteristics remains a mainstay of drug development, and has been expanded to encompass dozens of screening approaches, from simple bonding assays to more complex identification of desired effect (Benjamin 2015). Vertex pharmaceuticals developed the first effective treatments for cystic fibrosis through the development of a uniquely effective screening technology. Cystic fibrosis is a disease of the lungs and digestive tract caused by dysfunctional cell surface sodium channels, which regulate inter- and intracellular sodium levels. Through development of an effective process to use live cells supplied by cystic fibrosis patients, and automated sodium visualization method, thousands of compounds were screened that could improve the activity of these channels, resulting in the currently approved medications for this disease (O’Reilly and Elphick 2013)
Once a target is selected, therapies need to be further analyzed for efficacy and safety - the
Hit to Lead process. For small molecule candidates, additional screening assay may be used to exclude common deleterious side effects; analogous assays are developed for biologics, although scale and methods will vary. In effect this is a process to determine specificity: the drug needs to effect changes on the desired target, while not causing changes in other pathways of biological behavior. The ‘hits’ identified in this process will be down selected, through assays for ideal

18
pharmacokinetics (testing dispersion and metabolism in the body) and pharmacodynamics (primarily concerned with toxicology). See Figure 55 for illustration of the process (Hughes et al. 2011):
Figure 5 – Detailed review of target and compound assessment (including hit to lead)
Issues of safety, and compound delivery are further assessed that this point, as well as
refinement of the drugs specificity in regards to potential side-effects (‘Lead Optimization’). Once screened and optimized, individual therapies will be further refined for biological/ physiological factors, and strategic and market analysis may begin in conjunction.
In general, this early development stage includes initial therapy valuation (market potential),
analysis of alignment with relevant organization, valuation in context of the current or proposed portfolio of therapies, and review of the current biological validation. Notably, this stage of development overlaps significantly with scientific optimization and validation and should function as a point of synthesis between biological, strategic, and market criteria. Currently, this early development process functions much as Product Development Processes (PDP) do in other industries. Commonly a stage gate approach is used, where increasing validation of desired drug characteristics is analyzed and confirmed at each stage for the company to continue the drug’s development. As review by Nickisch, Greuel, and Bode-Greuel (2009), many organizations do not believe a more quantitative or systemic process appropriate at this stage; in particular it is assumed that monetary valuations of compounds at this stage are of limited value. Therefore decision makers qualitatively consider potential market for the drug, internal strategic intent, and the scientific consensus for the therapy. Drugs are typically assessed in a ‘go / no-go’ fashion at this stage, with recent emphasis on quick identification of undesirable lead compounds prior to significant cost expenditures. Decision processes at this step in drug development are the focus of this thesis and further discussion and critique follows in Chapter 3.
Finally, if the organization has decided to pursue the therapy, three stages of clinical trials
will be designed and completed; development of trial conditions occur in conjunction with the FDA, which will make a final decision on the efficacy and safety of the therapy that allows market and sale (in the US, with similar processes in other countries). Similar interaction and potential market approval occur in most other developed countries (e.g. EMA in Europe and Pmda in Japan). Given the scale and overall caution and supervision called for in human drug trials, this represents

19
the most expensive and frequently longest phase of drug development. Phase I trials are primarily safety trials performed on a small group of volunteers. Depending on the treatment and therapeutic intent, these trials may be performed with healthy volunteers that are carefully monitored for any toxicity or other symptomatic issues. Phase II trials are performed on a small group of patience with the disease of condition to be treated. These trials should indicate initial efficacy of the therapy, ideally with reduction in primary disease phenotypes, as well as with relevant biomarkers or other diagnostic indication of desired physiological change. Phase III trials (the largest and most expensive trial) should supply a statistically significant inference of efficacy and potential side effects on a larger, more representative sample of the population. This is typically the longest and most expensive trial undertaken. Conditions that have complex symptoms and/or slow progression, such as Alzheimer’s disease, can be incredibly challenging to deduce efficacy in a significant population. At the conclusion of these trials, the therapy is submitted to the FDA for review and potential approval for the US market.
Upon FDA approval for certain markets and indications, companies can finally execute on
manufacturing and marketing plans to maximize sales. FDA approval is dependent on many factors, but all compounds must be proven to have a robust safety profile for long term human use. If a drug is the first to treat a condition, treating in an area of high unmet need, the additional conditions for approval are that the drug provides significant improvement for patients compared to no treatment. If however the compound is entering a competitive area of treatment, the compound must also show improvement over current treatments options. This lower acceptance criteria for pioneering treatments creates an incentive for product development for such unmet medical needs. It also indicates the challenges of competition in this field. If a competing therapy gets approval during a drug’s development, the criteria and requirements for its approval will change.
This drives huge uncertainty into the product development, given the 12-15 year
development cycles common. As this is a long and highly regulated development process, significant product exclusivity is supplied in most countries, to sufficiently incentivize interest in drug development. This may be in the form of the original patent protection, or simply a conferring of market exclusivity. Given this long and uncertain process, and its associated costs, the capacity for effective upstream decision making is key to success in drug development. Following is a review of valuation methods that provide the background for analysis in drug product assessment.
Early drug development: valuation
This work focuses on the early development stage of pharmaceuticals, in particular by optimizing potential therapy portfolios. Given the long development time and high associated costs, the question arises: how can these products be accurately valued, and how early in their development is valuation feasible? As will be discussed in greater detail in Chapter 3, current decision making for drug development involves estimation of a preliminary monetary value for a drug, followed by qualitative consideration of certainty surrounding the scientific validity, likelihood of approval, alignment with corporate strategy, and potential external competition. What follows is an explanation of the common elements which typically make up an estimate of individual and portfolio value of therapies, as well as a brief summary of decision making with

20
multiple criteria under consideration. Finally an introduction to the challenges of decision making from the perspective of human psychology is given.
How is a product years from market approval and actual revenues given a current day
valuation? Expected value for a product can be estimated through various methods, but typical financial approaches include some projection of future earnings minus costs, as well as a consideration of the time-value of money and the opportunity costs of the investment. A common method for this type of valuation is to perform a discounted cash flow analysis, typically an estimation of the net present value (NPV) of the product.
This method requires a time horizon for assessment, a projection of net cash flows per year,
C, for this period, and some discount rate, r. As seen here (Malenko 2016):
where: CT = net cash flow over period T C0 = Net initial costs T = time of investment r = discount rate (time value of money) (Keegan 2008)
In early development, the timescale of a project is typically determined by the patent protection period or other regulation of market exclusivity. Net annual cash flows are typically derived from a pro-forma balance sheet or other projection of cost and expected revenue. For medical therapies, development costs are estimated, and revenue is projected from: the potential market size, expected sale price per patient (reimbursement), time to market, time of peak sales and/or patent exclusivity. With this simple assumption of temporary market exclusivity and success in development and approval, revenues can be projected, as seen in Figure 66.
Figure 6 - Expected cash flow for NPV calculation
0%
20%
40%
60%
80%
100%
120%
1 2 3 4 5 6 7 8 9 10 11 12
Expected (max) Cash flow

21
With this net cash flow and valuation period estimated, the NPV can be calculated based on the discount rate, r. This discount rate takes into account the time value of money, and potentially the uncertainty of future revenues and the cost of capital for the project. For more thorough project valuations, discount rate may be determined using the weighted average costs of capital (WACC), typically later in development, or by embedding more sophisticated risk assessments. These approaches account for the effects of capital structures for the project as well as more effectively capturing other risks to value. Commonly in early drug valuations, and for this work, a simple time value of money derived rate is used uniformly over all monetary valuations.
Although this gives an indication of potential cash flow, both the uncertainty of actual market
capture and the huge uncertainty around the final FDA approved product indications can limit the accuracy of this NPV valuation method. In summary uncertainty for drugs in early development can come from:
• Uncertainty of underlying scientific validity of therapeutic target and therapies systemic efficacy and safety
• Uncertainty regarding competition – long development cycle and uncertainty of competitors success
• Uncertainty regarding regulation – product approval via FDA – despite validation work, late stage (Ph III) failures are still common
• Uncertainty regarding pricing – cost control via Medicare or other government oversight ‘under threat’
Various approaches are taken to effectively quantify these uncertainties for better
estimations of current monetary value. Separating out different risk factors to better account for their collective effect is a common approach; this is exemplified by Espinoza’s method of decoupling the time value of money from the project risk to allow for better estimation of each component (Espinoza 2014). In another response to this uncertainty, financial analysts may consider real options analysis (ROA) or a combination of NPV and decision trees analysis to provide improved monetary estimations. Real options, first proposed in 1984 by Myers, propose that the value of an early stage product are the option to continue pursuit in the future, valued similarly to financial options (Hartmann and Hassan 2006). As Hartman and Hassan discuss, ROA can be employed on the conceptual level, where each stage of the project is considered and risk is quantified for each of these steps. This is also analogous to the more common approach of combining staged NPV calculations with a decision tree, to determine best decision paths. Further, Loch and Bode‐Greuel (2001) show that decision trees using NPV calculations provides equivalent valuation to options modelling in many relevant circumstances. In both cases this process, though useful, is limited to a small number of decision points before development of the tree or individual consideration of future conditionals becomes infeasible. More formal real options pricing is also possible (typically with Black/Scholes equation), but given the complexity of the calculation is infrequently used in this application.
Given these valuation challenges for early drug development, utilizing NPV as the sole or
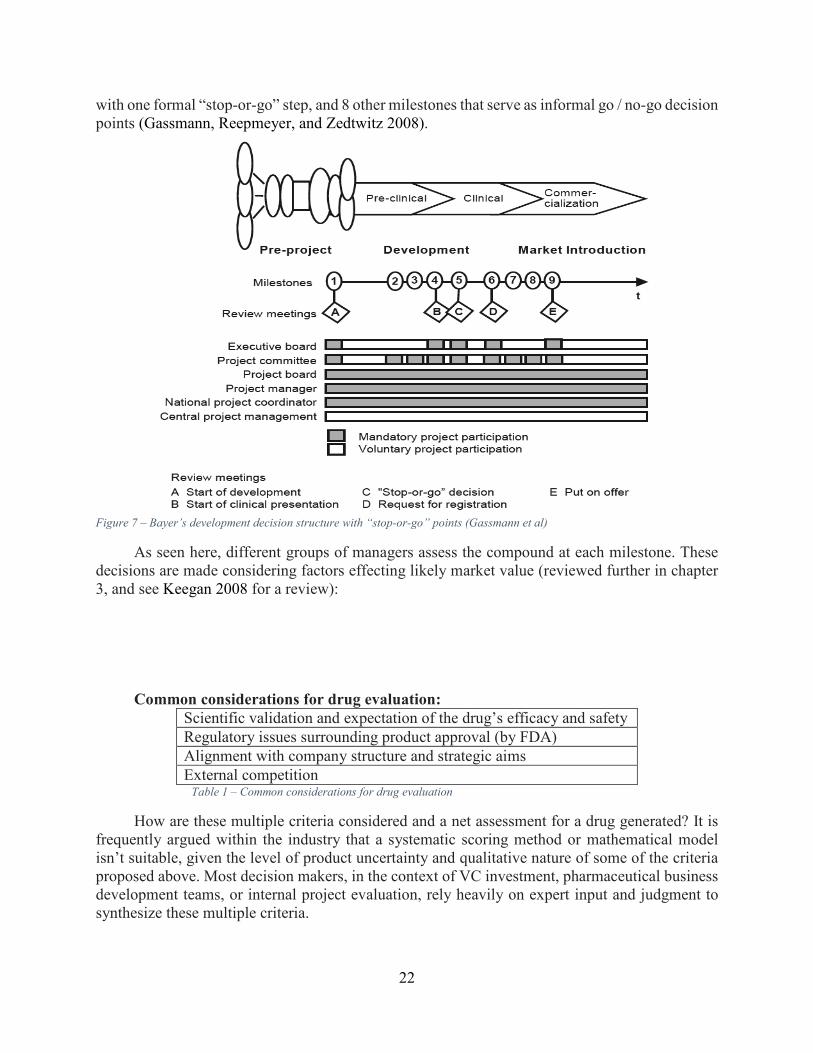
primary metric for analysis is likely to result in poor outcomes. Therefore, within the industry various other criteria are frequently considered to improve portfolio analysis and ‘go / no-go’ decisions for drugs in early development. For example, Figure 77 shows Bayer’s development path
22
with one formal “stop-or-go” step, and 8 other milestones that serve as informal go / no-go decision points (Gassmann, Reepmeyer, and Zedtwitz 2008).
Figure 7 – Bayer’s development decision structure with “stop-or-go” points (Gassmann et al)
As seen here, different groups of managers assess the compound at each milestone. These decisions are made considering factors effecting likely market value (reviewed further in chapter 3, and see Keegan 2008 for a review):
Common considerations for drug evaluation:
Scientific validation and expectation of the drug’s efficacy and safety
Regulatory issues surrounding product approval (by FDA)
Alignment with company structure and strategic aims
External competition Table 1 – Common considerations for drug evaluation
How are these multiple criteria considered and a net assessment for a drug generated? It is frequently argued within the industry that a systematic scoring method or mathematical model isn’t suitable, given the level of product uncertainty and qualitative nature of some of the criteria proposed above. Most decision makers, in the context of VC investment, pharmaceutical business development teams, or internal project evaluation, rely heavily on expert input and judgment to synthesize these multiple criteria.

23
Notably, there are quantitative approaches that could be applicable for this process, although they are not common in current practice. For example early drug portfolio analysis is amenable to the application of utility theory, whereby consumer preference for an attribute or set of attributes is considered an effective method for ranking said products. This provides ordinal ranking, and informally and formally serves in this capacity to allocate preference among drug attributes (a review of current thinking on this topic is found in Utility Theories: Measurements and
Applications, edited by W. Edwards). This process and reconciliation with systemic / quantitative approaches will be further reviewed in chapter 3, but a review of methods for portfolio optimization and this type of multi-attribute decisions making follows here.
Fundamentals of portfolio valuation Modern financial portfolio management is based in the notion that portfolios should
maximize returns for a given risk level, as proposed by Markowitz, 1952. For a given variance for the entire portfolio, V, the most efficient is that which provides the great expected return, E, resulting in a set of efficient portfolios (E,V). Alternately these efficient sets are referred to as the Pareto frontier or non-dominated sets. In the drug development context, estimations for expected returns, E are a summation of the valuation discussed earlier. The variance, V, of the portfolio is a function of the expected variance of individual members, plus a factor indicating if the member’s variance is correlated to other members in a the set. For example, a basic method for this variation is the Pearson correlation coefficient:
For the covariance (ρ) of x and y:
(http://flylib.com/books/en/3.195.1.90/1/)
It can be seen that the synchronized variance of x and y from expected values increases the
covariance, serving as a reliable indication of association between members of the set. To retain the highest return from a given set, variance that relates to loss in a single element’s value should not coincide with loss in many other elements’ value. To achieve an efficient set, the variance of both the individuals and the correlation between them is minimized to achieve a diversified and hence lower risk portfolio, while maintaining a given expected return. In pharmaceutical development, an instance of covariance is found in companies that develop products based on a therapeutic platform. Moderna, for example, is a high profile start-up developing therapies to treat many diseases using modified messenger RNA (mmRNA). From the perspective of disease area, this company has a highly diverse portfolio with little expected covariance between their development projects. However, every therapy depends on validation of their novel mmRNA approach, exposing their portfolio to an important risk shared among all elements. Overall, for a well-defined set of investments with reasonable estimations of expected value and related risks, modern financial portfolio management is a proven successful approach, but many scenarios require alternative approaches for portfolio valuation.
Multiple value criteria, each assessed by one or more metrics, with some potential conflict
between these metrics, bring a level of complexity and challenge to this type of decision making.

24
In this larger field of multiple criteria decision making, the decision process applicable to this work is addressed in the study of multiple criteria optimization (as defined and surveyed by Ehrgott 2002). As explained by Crawley, Cameron, and Selva (2016) multiple criteria optimization problems that contain categorical and/or discrete criteria values, high uncertainty, and potential subjectivity (fuzziness), among other traits, are addressed with combinatorial optimization (or multi-objective combinatorial optimization, MOCO). This subset of multiple criteria optimization represent a particularly computationally intensive problem, potentially resulting in methodologies that do not provide exact solutions. Considerations on how to down select the full set of potential solutions, as well as amalgamate considered objectives are also important. A description of the general MOCO problem formulation, as well as detail on common methodologies is given by Ehrgott and Gandibleaux (2000). For this work the general optimization process as described by Crawley, Cameron, and Selva (2016) in the context of system architecture decisions, suffices.
For a set of decisions (or portfolio criteria) A = {d1,……dj},
and a set of objectives ( or value metrics) M = {m1,….mp}
Some value function V(•) will value the set of criteria, A’, based on the set of metrics, M
This method utilizes two steps for estimating collective valuation as represented by V(•) : an
individual utility value function to translate individual capability to output value, then a function to amalgamate valuation to identify the highest value from the combination of criteria.
From this general process, methods for solving for all or many non-dominated sets can
proceed based on the specifics of the number of potential solution sets. When computationally feasible it is preferable to generate all possible sets A, which are evaluated by the metrics, M, identifying all non-dominated sets; a final utility function, or expert input, is utilized to select among this group of efficient sets. When this full factorial enumeration is not possible, various algorithms are used to search for members of A that are non-dominated. As previously noted, in the context of categorical criteria (d1 �dj), this is computationally challenging. A common approach is to utilize meta-heuristics such as genetic algorithms that uses search heuristics adapted from genetic variation to explore A for efficient sets (summarized in details by Crawley et al., 2000). This represents one example among many methods described in Ehrgott and Gandibleaux’s survey. This current work will operate in scenarios where the set, A, can be fully enumerated and directly evaluated; this brief summary of more capable methods serves to indicate important directions in an expansion of this process, that would require larger sets of criteria and metrics.
Regardless of the size of the potential solutions, some method need be employed to make an
assessment of the portfolio or set of criteria. As noted in these multi-criteria optimization approaches, a notable subset of approaches in this field is that of expert systems (ES), in particular rules based systems (RBS).
Expert systems and rules based systems:
Expert systems are part of the original field of artificial intelligence: developed in the 1960’s, these systems utilize various methods to transfer human expertise to a computer to allow for computer based analysis with characteristics of human decision making (Shu-Hsien Liao 2005). This transfer of human knowledge and decision processes is intended to augment the capacity for

25
unassisted computer decision making; given this bold intent, success of this approach has been dependent on the field, and generally concentrated on well-defined, contained decisions.
Rules based expert systems (RBS) transfer human knowledge in the form of rules, typically
in the form of if-then statements, which are utilized in conjunction with a priori and emerging facts to make decisions. A well-known early example of this is the MYCIN system that determined bacterial infections and recommended appropriate antibiotics for medical patients. MYCIN was developed at Stanford University in the early 1970’s utilizing the programming language LISP. The system operated as a fairly simple inference engine that used about 600 pre-programmed rules to deduce a likely cause and appropriate medication from a given set of symptoms (Yu et al. 1979). As is typical of these systems, the benefit was to comprehensively consider supplied relevant facts in consideration of a large set of relevant knowledge about typical human infections. Analysis of performance indicated the MYCIN program correctly identified appropriate medication 65% of the time, improving on human performance as tested (42.5 – 62.5% depending on practitioner).
Although this is a remarkable result, it also illustrates that ES success has historically been
found in clearly demarked decision processes with clearly definable criteria. In this regard, it has been argued that expert systems attempt to ‘quantify the unquantifiable’ (as noted by Selva, Cameron, and Crawley 2014) in more ambiguous and open-ended decision processes. However, utilization of ES as a decision aid, used to expand the capacity for criteria under consistent consideration and reduce bias, appears of particular value to the topic of this work. As seen with decisions in early drug development, these many criteria, some qualitative and uncertain, are inevitably considered and synthesized for a final decision, regardless of the methods or decision aids employed. Therefore, application of expert systems such as an RBS appears well suited to reduce bias and improve consistency when considering many portfolio characteristics.
Liao (2004) notes a number of ES methodologies, including object-oriented approaches, neural nets, and intelligent agents (IA) that are now personified by Siri and OS interface tools. Most relevant to this thesis are rules based methods, as utilized in the MYCIN system above. A RBS typically has three components: a knowledge base, a collection of rules, and an algorithm or inference engine to determine triggering of rules on given information. The knowledge base contains all the domain specific facts about the system or field under consideration. Many of these facts represent the capabilities of aspects of the set under consideration. Rules are typically in the form of if-then statements and represent actions or processing that should occur under appropriate conditions.
For example, one rule encoded in this portfolio valuation system is, ‘if the average
development time of the drugs exceed x years, then the portfolio represents a higher cost set.' Typically these are forward looking rules, meaning that when the ‘if’ (or left hand) statement is satisfied, the ‘then’ (or right hand) action or process is performed, although contemporary rules-based engines allow for backward looking rules that seek to satisfy the if-statement when its criteria have not yet been met. Finally the inference engine manages the application of the rules to the knowledge base to make decisions. A successful contemporary rules based engine is the JESS language developed by Ernest Friedman-Hill at Sandia National Laboratories (Friedman-Hill 2003). In contrast to typical imperative programming, JESS utilizes declarative programming, whereby conditions for processing through the program mare set without an explicit sequence of
26
events being defined. Jess works with the Rete algorithm, which prioritizes and matches rules to the knowledge base and proceeds through the rules to completion, via efficient pattern matching (Forgy 1982).
Human psychology in decision making
In parallel to the extensive development of computational methods to improve decision making, fields from psychology to operations research study the strengths and weakness of the human mind as a decision making tool. This represents another large and active field of research; for this work some brief examples of human bias and limits of capacity will be given here in addition to relevant sources of additional information. Especially relevant to this review of product portfolio valuation is research regarding people’s capacity for symmetric weighting of losses and gains. As shown by Tversky and Kahneman (1974), our decision making process is simplified by the use of a limited group of heuristics. Frequently this represents an efficient simplification, but can of course be subject to bias and misjudgment.
Additional research by Tversky and Kahneman developed the related notion of loss aversion,
among other decision bias. In this case, the example is given of a choice between a guaranteed loss of $800 vs an 85% chance of a loss of $1000. In this second scenario the probability indicates an expected outcome of a loss of $850, but despite this rational inferiority, this choice is more frequently chosen over the guaranteed loss of $800. This risk-seeking behavior due to a bias towards aversion to loss is one example of many inherent bias in our decision process (Thinking Fast and Slow by Kahneman (2011), surveys this and other characteristics of the psychology of decision making). In the context of our short term memory capacity limitation, Miller’s Law notes a coincidence between judgment and the limits of our ‘immediate’ memory (Miller 1956), with an upper limit around 7 items (+ / - 2). This is seen in the context of set of specific involving, for instance, discerning different tones, but this notion has found resonance in many areas and has been broadened on practical observation and additional experimentation. The ‘Magical Number 7’ exposes a challenging limitation to our internal judgement capacity, especially as seen in the context of decision making with many a characteristics and metrics for value. With this research as indication, it is clear human decision making can be hindered by bias and limitations in managing complex scenarios; the process improvements discussed in the next chapter are intended to manage these limitations to improve outcomes.
This chapter has reviewed fundamentals of portfolio valuation including: individual product valuations, additional considerations for portfolio valuation, assessment of multiple criteria, and challenges in human decision making. From this review it is apparent that success with early drug portfolio decision making depends on a broad set of considerations to provide accurate value estimates. For a successful synthesis of these considerations, more detail is required on the particular requirements and challenges posed by pharmaceutical development. Therefore, chapter 3 supplies a review of the practices and particular concerns of current practice in this industry.

27
With the preceding chapter as a conceptual basis for decision making challenges and methodologies, a more in depth review of current practices in drug development portfolio decision making is given here. This summary is based on the development process for a mid to large sized pharmaceutical company, but the criteria discussed and the various metrics for valuation apply to VC and other investors in drug development. After this general review, two explicit cases will be explored, followed by a literature review surveying proposals for improvement in the portfolio decision process.
It is difficult to pinpoint the causes of failure or success in a given case of early drug
development valuation, and many blockbuster products rely on effective underlying biological targets that are not well understood till after commercialization (which is a prominent driver of eventual revenue). However the huge impact of product valuations can be seen in recent history. In 2011, Vertex Pharmaceutical launched a pioneering hepatitis-C drug, Incivek, which produced $1B in sales faster than any other drug launch up to that time (Silverman 2014). During the first year of this product’s launch, Vertex rejected the option to acquire a competitor’s early stage hepatitis-c therapy in development by Pharmasset – this drug was intended to offer higher efficacy and an all-oral administration (both improvements compared to Vertex’s Incivek). Presumably, considering development costs and uncertainty of Pharmasset’s drug’s success, Vertex valued their competitor below an acceptable purchase price. In contrast, Gilead Sciences made a different valuation of this product (the primary drug in development at Pharmasset), and purchased the company for $11B in late 2011 (Krauskopf and Basu 2011). As noted by Silverman (2014), within 3 years of launch, Vertex discontinued its drug Incivek due to competition from Gilead, and exited from the hepatitis-C treatment area in general. Gilead however, since the December 2013 launch of Solvadi, the drug acquired from Pharmasset, saw their revenues increase by 222% within one year (Yahoo Finance, n.d.). Many factors are involved in these companies’ outcomes, nonetheless early stage valuations, in consideration of the overall portfolio, can have significant impact on a company performance.
Current drug and portfolio management in practice
Bode-Greuel and Nickisch (2008) review two major activities in portfolio management:
• The evaluation of a given drug using various methods to determine its merits (or score) along certain criteria
• A corporate process whereby these individual drug valuations are considered in the context of the company’s overall strategy and strengths (see also Betz (2011) and Jekunen (2014)
This section will follow these topics, reviewing the initial development of a drugs intended characteristics, followed by a discussion of the criteria by which a drug is assessed and how said drug is ‘scored’ for these criteria. Finally, an assessment of the drug’s alignment to the company’s structure and strategies is reviewed.

28
At the beginning of an individual drug development process, frequently a target product profile (TPP) is defined to serve as a list of product requirements. This is analogous to other industries, in effect answering the question, ‘what does this product need to do for it to be successful?’ This details the target market, expected efficacy and safety, as well as likely properties for regulatory and clinical success. Given the intensive FDA regulation of this process, the TPP has become a common tool for communication with the administration regarding product intent and required clinical verification, resulting in an FDA TPP template, with selected details seen here (FDA, 2007):
“Typical key sections from which a sponsor can choose, depending on the nature of the meeting, include (partial listing):
Indications and Usage Dosage and Administration Dosage Forms and Strengths Contraindications Warnings and Precautions Adverse Reactions Clinical Pharmacology Nonclinical Toxicology Clinical Studies…”
From the perspective of product assessment, decision makers can utilize these target product
attributes to estimate potential market size and aspects of a drug which may impact the sales rate and patient responses (from potential side effects, or from ease of dosing, for example). Additionally, development of clinical trial requirements as well as other biochemical verifications help estimates for total development costs and associated risks.
Utilizing the TPP, a commercial analysis and sales forecast is developed, indicating potential
future cash flow, time to market, and the competitive landscape. This starts with an assessment of the unhindered potential market, resulting in a cash flow analysis as indicated in chapter 2 (Figure 66). This base forecast considers the target patient population, based on disease incidence and natural history. Using comparable drug pricing and an assessment of trends in reimbursement amounts, an annual drug price per patient is determined (typically this is based on the retail market and implicit compensation for development cost of other failed products, not cost plus margin). Timelines for pre-clinical drug development, in addition to the clinical trials required, indicate expected time to market (and expected development costs). Finally based on the drug’s target characteristics noted in the TPP, in conjunction with potential competition at launch, an uptake rate can be estimated. Therefore, with annual patient population x drug price, annual revenue is generated and fit to the development schedule. Development costs are then subtracted from these revenues, creating the annual cash flow which will be used in subsequent drug and portfolio optimization, as well as directly into an NPV estimate.
It is important to note, by this time in a drug’s development an initial development timeline
and related budget have been estimated by the project team. With the primary focus of the organization on verifying the efficacy and safety of a drug, it is understood in the industry that the development schedule is highly uncertain. Dunson (2010), in his review of project management in pharmaceuticals, notes that typically only the next phase of a project (attaining the next pre-clinical

29
milestone or clinical phase) is scheduled in detail, while further work is only outlined. Given the significant scientific uncertainty in this product development this is not surprising, but clearly this adds uncertainty to NPV estimates and presents challenges to overall company R&D budgets. In this context, companies typically develop a fixed budget for R&D projects - which sets the limit for overall spending, requiring inter-project competition within the company. Commercialization (developing the drugs through clinical trials) typically draws from a separate budget (Dunson 2010).
Analysis of drug product risk is complex and will typically be broken out into risk from
various areas of the development. Bode-Greuel and Nickisch (2008) distinguish risk from the following area:
• The drug being developed is ineffective, toxic, difficult to manufacture, etc.
• The mechanism of action (drug target) does not successfully modulate or improve disease traits.
• The drug fails to meet specific traits as defined in TPP (not addressing sufficient share of intended market).
• Risk from new high performing external competition, or the drug is failing to distinguish efficacy from those currently available (which can result in FDA rejection).
Basic NPV values are derived from the cash flow and expected discount rate as previously
reviewed, but given the high risk and uncertainty for these products, various additional steps are commonly considered to refine estimates of the drug’s monetary value. Frequently individual valuations are reviewed in the context of a decision tree analysis, whereby value is assessed at subsequent milestones. Typically, these trees are set up with a chance nodes at each milestone (see Figure 77 for Bayer’s milestones), and /or at each clinical stage. This decision tree analysis can be used as an aid in the overall development process to help with go / no-go decisions. A decision tree is also a useful tool for analyzing probability of success at various decision points; joining these probabilities with value estimates allows for both a risk-adjusted current value, as well as viewing the product as a series of options. Real options analysis (ROA) formalizes this notion, although it is slow to gain credibility in the pharmaceutical industry as an alternative valuation method.
Given the long development time and uncertainty associated with these monetary valuations,
many other criteria are used to assess an individual drug’s utility at this development stage, as introduced in Table 11 in chapter 2. As noted by Keegan (2008), criteria for additional value consideration include:
• Company cost: R&D expenditure, clinical trial cost, commercialization expenditure
• Timing: Time to revenue, time of patent protection
• Strategic fit: alignment with larger portfolio strategy
• Competitive landscape
• High unmet need (defined by a lack of current therapies for a given condition)
• Intra - portfolio properties: redundancy of disease area targets, molecular pathway targets
Others, including Betz (2011),note the common inclusion of additional criteria including degree of scientific validation, manufacturability, and safety (short and long term). Finally the TPP
30
in itself provides a reasonable list of criteria to use to score a drugs value (for a more complete discussion of criteria selection, see Wehling (2009). With a set of assessment criteria established, how is a drug’s performance, or capabilities, judged and ‘scored’? How is one drug determined to have a better strategic fit than another, and how is this relative performance recorded for further analysis? Betz (2001) reviews three common approaches to develop relevant criteria scores: criteria-based methods (questionnaires), ‘expert black box’ approaches, and open surveys. All approaches result in a score for individual drugs, although this may represent scores for each selected assessment criteria, or in the case of black box approaches, result in a single comprehensive score for a given drug. The first approach, criteria-based questionnaires, generate specific answers about a drug performance in specific areas, and are considered fairly objective but limited by being too general, to allow for comparison across many drugs. Expert ‘black box’ analysis is likely the most common approach and has no explicit basis for scoring. Program managers and involved R&D leads assess each product as they see fit and determine a score. Betz notes that this approach, “gives tribute to the complexity of the drug discovery process,” in that experts consider all experience and knowledge they deem relevant to a drug’s review, but notes this can also lead to greater bias in scoring. Finally, open surveys are actual surveys sent out to a larger group of employees (who have general knowledge of the drug or field), where drugs are scored on all or a subset of assessment criteria. These surveys are intended to capture the collective wisdom of an organization, and there have been efforts to further develop these into prediction markets (both internal to the company or with external online ‘markets’), where virtual shares of development drugs can be ‘purchased’, with some reward for selection of successful drugs. In summary, this process has three aspects: development of assessment criteria for a single drug, selection of a method for assessing each drug along these criteria (scoring), and assessment of the drug based on these scores. It is important to note that the scores developed for the drug’s performance on a given assessment criteria can function within the context of utility theory as introduced in chapter 2 (and reviewed by Edwards 1992). Although it is not common in current practice, for this work these are considered utility scores, and in chapter 4 will be treated as such for analysis. Also of note, throughout the scoring process the drug’s performance is considered not just in isolation, but in the context of the organization that will develop the compound. As noted in the previous review of common assessment criteria, this includes strategic goals such as intended market area to pursue, the company’s revenue and budget targets (including the time period to achieve these), etc. Related to this are aspects of the company’s structure that are relevant to drug production, such as areas of R&D expertise and capacity in research and commercial departments. In this case departmental capacity refers to the ability to perform additional work, and is driven by personnel. More generally, all drug development decision are made in the context of a set research and development budgets determined by upper management, typically in conjunction with a corporate finance team. In summary then, each drug has been scored (in the context of the company’s strategy and structure) along a set of criteria, and these scores now need to be amalgamated to develop a single company valuation. How are these scores synthesized into a collective assessment of a given drug under development? As discussed by Cioffe (2011), the predominant method revolves around a series

31
of consensus driven discussions where the whole value of a drug is discussed in relation to its scoring on individual criteria. This is a qualitative process meant to leverage individuals’ knowledge and expertise to synthesize all the individual criteria assessment made previously. As seen in Figure 77 (chapter 2) showing Bayer’s development process and the management groups involved, each milestone represents a meeting for review of the drug in question, where its value is considered in the context of its scores. This is a primary function of portfolio and program managers in large pharmaceutical companies; Day (2007), among others, reviews approaches to managing these discussions and synthesize the impact of all the assessment criteria scores. Individual organizations utilize various tools to support this deduction; bubble charts and 3D analysis are two common approaches. Both tools function as decision support by synthesizing various criteria in a clear visual tool to reduce the discrete information an individual needs to retain to assess said compound. A bubble chart shows drug performance on two criteria shown on the 2 axes; in addition the size of the circle, or bubble, representing the drug indicates a third criteria, and the shading or color of the bubble indicates a fourth. Figure 7 shows an example from Blau et al. (2000)showing various drugs values for probability of success and risk (adjusted for expected reward), with the bubble size showing capital development costs, and shading showing disease targeted.
Figure 8 – Blau et al. (2004), example of bubble chart
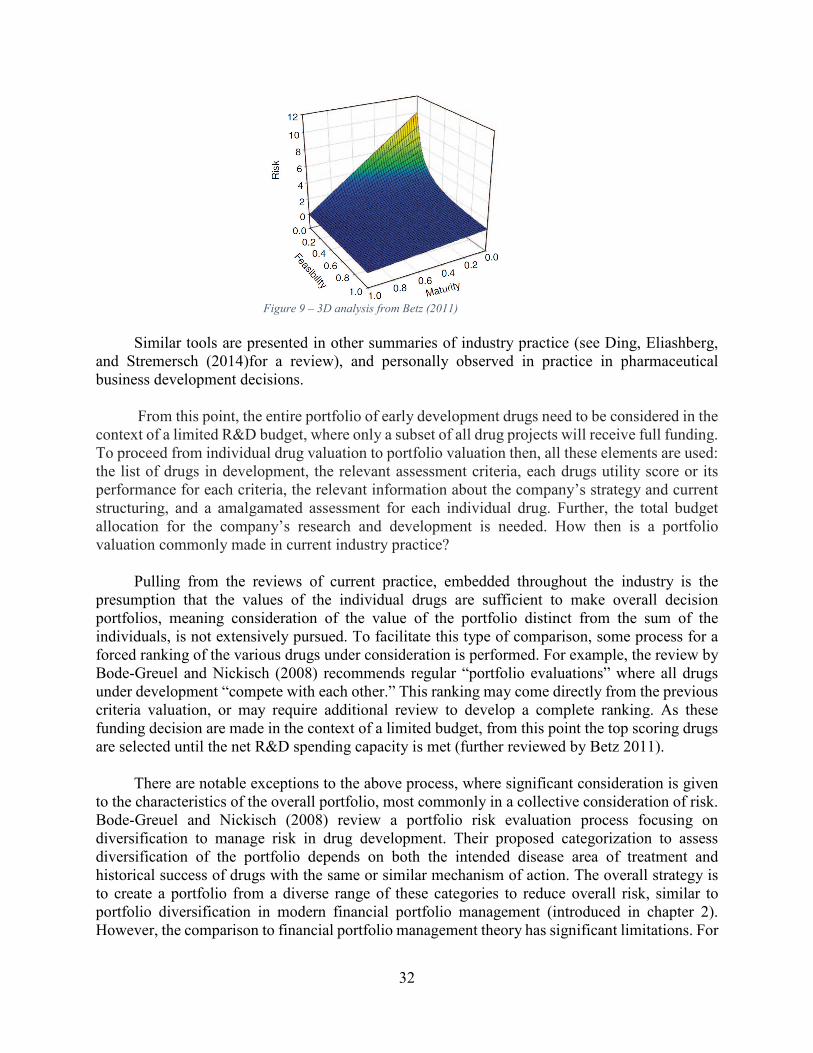
3D analysis, presented by Betz (2011)offers an alternative tool to visualize multiple drug criteria performance. Unsurprisingly, this approach takes three criteria and plot a drugs performance on each axes, showing an expanded set of relationships between these criteria, as seen in Figure 99, showing a generic example of a drug assessed for risk, maturity, and feasibility:
32
Figure 9 – 3D analysis from Betz (2011)
Similar tools are presented in other summaries of industry practice (see Ding, Eliashberg,
and Stremersch (2014)for a review), and personally observed in practice in pharmaceutical business development decisions.
From this point, the entire portfolio of early development drugs need to be considered in the context of a limited R&D budget, where only a subset of all drug projects will receive full funding. To proceed from individual drug valuation to portfolio valuation then, all these elements are used: the list of drugs in development, the relevant assessment criteria, each drugs utility score or its performance for each criteria, the relevant information about the company’s strategy and current structuring, and a amalgamated assessment for each individual drug. Further, the total budget allocation for the company’s research and development is needed. How then is a portfolio valuation commonly made in current industry practice?
Pulling from the reviews of current practice, embedded throughout the industry is the
presumption that the values of the individual drugs are sufficient to make overall decision portfolios, meaning consideration of the value of the portfolio distinct from the sum of the individuals, is not extensively pursued. To facilitate this type of comparison, some process for a forced ranking of the various drugs under consideration is performed. For example, the review by Bode-Greuel and Nickisch (2008) recommends regular “portfolio evaluations” where all drugs under development “compete with each other.” This ranking may come directly from the previous criteria valuation, or may require additional review to develop a complete ranking. As these funding decision are made in the context of a limited budget, from this point the top scoring drugs are selected until the net R&D spending capacity is met (further reviewed by Betz 2011).
There are notable exceptions to the above process, where significant consideration is given
to the characteristics of the overall portfolio, most commonly in a collective consideration of risk. Bode-Greuel and Nickisch (2008) review a portfolio risk evaluation process focusing on diversification to manage risk in drug development. Their proposed categorization to assess diversification of the portfolio depends on both the intended disease area of treatment and historical success of drugs with the same or similar mechanism of action. The overall strategy is to create a portfolio from a diverse range of these categories to reduce overall risk, similar to portfolio diversification in modern financial portfolio management (introduced in chapter 2). However, the comparison to financial portfolio management theory has significant limitations. For

33
example, if a company sees a strategic advantage developing Alzheimer’s drugs, then diversification beyond this field has negative value; diversification in this instance should come from targeting different pathways or endogenous molecules that are indicated in the disease mechanism. This example illustrates the challenges in drug portfolio valuation, as the value impact of individual drug’s criteria conditionally depends on the whole portfolio and the strategic intent of the company. This ambiguity exemplifies the need for a valuation system that can account for the conditional impact of individual aspects of the portfolio, as further discussed in chapter 4.
In general, the process for portfolio decision reflects the underlying uncertainty and ambiguity of the drug development process itself. For instance, company strategic goals are considered in the scoring of individual drugs along selected assessment criteria, and considered again when reviewing the individual drug overall and in the forced ranking of all drugs under development. This allows for potential ‘double counting’ of a strategic goal when scoring a drug. The safeguard against such errors are the portfolio managers shepherding the decision process. Taking into account the large number of considerations, potential for ambiguity of their impact on value, and potential for ‘double counting’, this represents a huge challenge for decision makers managing these portfolios.
Case studies in drug portfolio decision making:
Merck – Serono
Beyond the literature that has reviewed common practices, a couple of published case studies on the improvement process in the portfolio decision process illustrate the key challenges in this area. After the 2006 merger of Merck with Serono, upper management sought to become industry leaders in their management of early development portfolio management with the following goals (as described in Aurentz, Kirschbaum, and Thunecke (2011):
Create a better balance between risk and potential return by basing decisions on clearly
identified strengths and weaknesses of the current development portfolio; and
Create a best-in-class approach to portfolio management covering the entire R & D
portfolio.
Prior to their merger, portfolio management in their organizations was not well directed nor integrated into the overall organization. Once there was executive level support to revise their system, the team tasked with this challenge exposed a number of shortcoming in their current situation. The existing process was ineffective, which led the team itself to ‘pull back’ and focus primarily on record keeping and data analysis. Project teams that interfaced with portfolio management saw the process solely as a bureaucratic burden with no value added to their work. Responsible upper level managers simply made portfolio decisions using their own intuition and judgement. Skrepnek and Sarnowski (2007) surveyed CFOs and program managers and found “past experience / intuition / human judgement” was used in project evaluation more than any other tools (85%); hence Merck’s behavior by upper level managers is quite common. The Merck team determined a significant cause of the ineffectiveness of portfolio management stemmed from: a poor process for risk assessment, poor tools for (monetary) valuation, and little communication between relevant stakeholders.

34
Merck’s response was to integrate more formal requirements for decisions, expanded the decision making process to integrate more stakeholders, and considering alternative strategies to the baseline expectation, as seen in step 1, Figure 1010. For risk assessment, they moved from a qualitative discussion of high or low risk, to an expert system (from Catenion) that utilized 7 years of product outcomes with a weighting scheme to generate a risk portfolio based on various product criteria (including drug type and stage of development). Stages 3 and 4, as seen below systematically address the market place, competition, and a range of potential financial outcomes. This final step included a thorough analysis of risk versus reward in risk matrix similar to that presented by Day (2007)discussed below.
Figure 10 – Aurentz et al. (2011) revision of portfolio management at Merck
In short, Aurentz and his group focused on an integrated, empowered decision process that
systematically reviewed risk and reward in regards to a number of criteria, with an emphasis on strong communication. The outcomes were positive, incentivizing teams to better understand their projects, reduce uncertainty earlier when possible, and having clarity in purpose between the various groups involved in early drug development. In regards to this thesis, the shift towards a more systematic approach, consistency over projects, and an emphasis on consideration of many criteria are most relevant. Also, the fact that there was some cultural pushback at stages is expected. Whether a process is effective or not, there is inevitable resistance to change. Although inevitable, this resistance should be expected and managed as new decision processes are instigated.
Smithkline – Beecham
Sharpe and Keelin (1998) discuss another portfolio decision challenge at Smithkline Beecham in the late 1990’s. Although their focus was later stage development projects, their organizational concerns speak directly to the challenges addressed in the valuation system developed here in chapter 4. Smithkline Beecham had many development projects that were straining heir R&D budget. Their decision process had the following, likely common, shortcomings: project value and risk was being sourced from the highly invested project leaders who knew they were in direct competition with other teams. A discussion-based decision process can be driven by the charismatic leaders whether they support the best project or not; a concern that a top down decision process (executive driven) would lack the technical understanding and area expertise needed to assess projects.

35
In the past Smithkline Beecham had tried more quantitative approaches, such as a comprehensive scoring system and in depth NPV valuations developed by a finance team. These quantitative methods left project teams confused and skeptical of final decisions. As Sharpe and Keelin stated, they needed a technologically sound solution that accounted for the complexity and risk of these technical developments while at the same time a system that was transparent and credible to the organization as a whole.
Smithkline’s solution was a three-phased dialogue between project leaders and portfolio
decision makers. First, project leaders, with a facilitator, would develop 4 project plans in lieu of the one plan (budget) typically proposed. Not only did this add flexibility to the decision process it immediately forced the project teams to review the project goals and needs, and consideration of alternatives occasionally led to higher value projects that would have been otherwise undiscovered. In the second phase all project plans were valued using decision tree analysis in conjunction with uniform project information supplied by the teams. All valuation was done by a neutral group with a period of discussion between decision makers and project leaders regarding the valuations. The emphasis through this phase is clear communication and repeated affirmation from relevant parties that the process and valuation appeared valid. Finally in phase three the ideal portfolio of projects was considered. This was a qualitative discussion process using the base valuations as set figures. A neutral group considered various groupings of projects in light of corporate strategy, robustness to different scenarios, balance among disease areas and other considerations.
For Smithkline Beecham this represented a large change in their portfolio funding, with 16
or 20 projects receiving a different funding level (10 increased in funding and 6 decreased in funding). Written by the champion of this new process may have resulted in some positive bias of the process and outcome, but Smithkline did experience improved revenue in the years following these changes, and as noted in the literature, projections for portfolio value increased by 30% without an increase in funding. Most relevant for the challenges in portfolio decisions, Smithkline Beecham had been faced with bias and personal opinion driving initial valuation, with limited communication and agreement through the decision process, with poor outcomes and poor morale from the teams involved. Their focus on, “…information quality, credibility, and trust…” through the process had clearly positive results.
These two cases exemplify some of the challenges in the decision process for early drug
development, namely:
• Decision are frequently made based on individual experience / judgement
• Relevant information for decisions is not always well organized, allowing for some decisions to be made with a partial set of inputs
• Individual bias is likely and difficult to separate from the decision process These two organizations improved their portfolio management in regards to these challenges,
and in chapter 4 this work proposes a method intended to address the issues noted here as well.
Literature review: improvements in portfolio decision making
According to publicly available data and personal experience, the vast majority of pharmaceutical companies manage their portfolios based on individual product assessment

36
supplemented by forced rankings, and qualitative alignment with company strategy and structure. This thesis proposes a model that considers individual drug valuations as well as the characteristics of the overall portfolio, as discussed in chapter 4. It is clear that independent valuations are a large driver in portfolios, and current practice puts less emphasis on the characteristic of the development portfolio as a whole. In fact, the majority of literature on this topic focuses on individual (drug) project assessment. The most relevant of this work is noted here, followed by additional approaches for early development drug assessment, including approaches for valuation of the overall portfolio.
Maximizing the use of available information regarding expected return and cost is a
reasonable direction for improvement. Within this industry there are frequent debates regarding the efficacy of different methods to estimate net future returns. NPV methods and ROA have been discussed, in chapter 2. These common methods are frequently supplemented by decision tree analysis, when the set of possibilities is of a manageable scope; alternately, Monte Carlo simulation reviewed by Myerson (2005) incorporates variation among the input values to produce a range out NPV values, partially accounting for uncertainty.
Talias (2007) attempts to improve estimates of expected returns and costs using a Bayesian framework to refine a (Pearson) profitability index at each stage of a product’s development; each stage of development to date informs the conditional probability of the current likelihood of success for said return. The system then allows for a summation of criteria estimates to estimate the product value. Bayesian statistics here support the continued revision of the probability of returns based on previous outcomes. This model was originally developed by Pearson (1972), and Talias provides theoretical justification for its use in pharmaceutical applications and compare its efficacy to other approaches. This can be seen as an analogous approach to decision tree analysis, except the Pearson index is backward looking, using the events prior to the current state to generate a conditional probability for achieving expected returns. Beyond the relative mathematical complexity of this approach, the process and characteristics of the estimate are foreign to most decision makers in pharmaceutical development. Additionally it appears suited to a more developed drug (potentially once in clinic trials). Taken as an example of computationally intensive approaches to improve monetary estimates, this is deemed inappropriate for this early stage product assessment. More generally improving NPV estimates with Monte Carlo sensitivity analysis, or pursuing ROA to improve valuation of managerial flexibility is encouraged and easily operates in conjunction with the system proposed here.
To consider the whole development portfolio, full multiobjective approaches have been
proposed that consider the value impact of many different product criteria (cash flow, sales, risk, etc). Carazo et al. (2010) propose a multiobjective model that accounts for multiple project objectives as well as organizational resource constraints to prioritize drug portfolios. Objectives and constraints are assessed for a given portfolios, using a metahueristic algorithm to seek optimal solutions among the large set of potential portfolios enumerated. Fundamentally, for a set of drug development projects through the forecast time period and among various constraints, a search algorithm is used to locate efficient sets among the huge set of potential portfolios. Perez-Escobedo, Azzaro-Pantel, and Pibouleau (2012) have developed another multiobjective approach which doesn’t consider the resource constraints in addressed inCarazo et al. Perez-Escobedo et al. instead estimate outcome uncertainty using Monte-Carlo simulations.
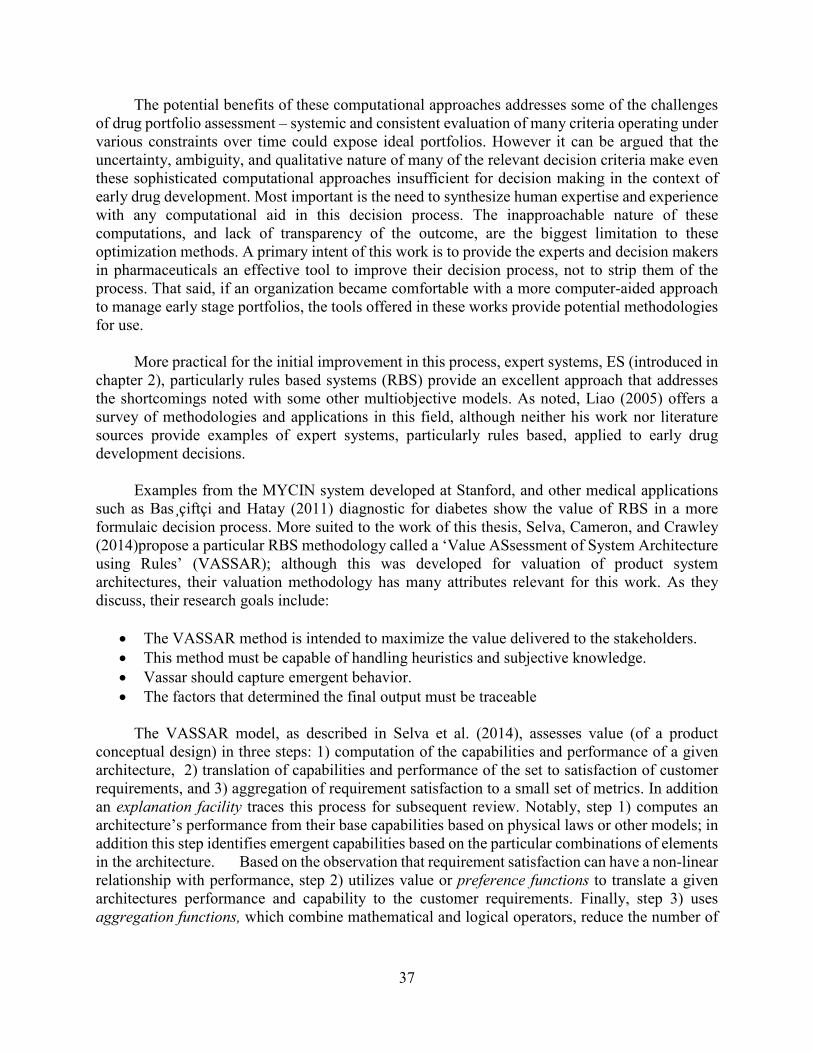
37
The potential benefits of these computational approaches addresses some of the challenges of drug portfolio assessment – systemic and consistent evaluation of many criteria operating under various constraints over time could expose ideal portfolios. However it can be argued that the uncertainty, ambiguity, and qualitative nature of many of the relevant decision criteria make even these sophisticated computational approaches insufficient for decision making in the context of early drug development. Most important is the need to synthesize human expertise and experience with any computational aid in this decision process. The inapproachable nature of these computations, and lack of transparency of the outcome, are the biggest limitation to these optimization methods. A primary intent of this work is to provide the experts and decision makers in pharmaceuticals an effective tool to improve their decision process, not to strip them of the process. That said, if an organization became comfortable with a more computer-aided approach to manage early stage portfolios, the tools offered in these works provide potential methodologies for use.
More practical for the initial improvement in this process, expert systems, ES (introduced in
chapter 2), particularly rules based systems (RBS) provide an excellent approach that addresses the shortcomings noted with some other multiobjective models. As noted, Liao (2005) offers a survey of methodologies and applications in this field, although neither his work nor literature sources provide examples of expert systems, particularly rules based, applied to early drug development decisions.
Examples from the MYCIN system developed at Stanford, and other medical applications
such as Bas¸çiftçi and Hatay (2011) diagnostic for diabetes show the value of RBS in a more formulaic decision process. More suited to the work of this thesis, Selva, Cameron, and Crawley (2014)propose a particular RBS methodology called a ‘Value ASsessment of System Architecture using Rules’ (VASSAR); although this was developed for valuation of product system architectures, their valuation methodology has many attributes relevant for this work. As they discuss, their research goals include:
• The VASSAR method is intended to maximize the value delivered to the stakeholders.
• This method must be capable of handling heuristics and subjective knowledge.
• Vassar should capture emergent behavior.
• The factors that determined the final output must be traceable The VASSAR model, as described in Selva et al. (2014), assesses value (of a product
conceptual design) in three steps: 1) computation of the capabilities and performance of a given architecture, 2) translation of capabilities and performance of the set to satisfaction of customer requirements, and 3) aggregation of requirement satisfaction to a small set of metrics. In addition an explanation facility traces this process for subsequent review. Notably, step 1) computes an architecture’s performance from their base capabilities based on physical laws or other models; in addition this step identifies emergent capabilities based on the particular combinations of elements in the architecture. Based on the observation that requirement satisfaction can have a non-linear relationship with performance, step 2) utilizes value or preference functions to translate a given architectures performance and capability to the customer requirements. Finally, step 3) uses aggregation functions, which combine mathematical and logical operators, reduce the number of

38
customer satisfaction criteria to one or at most a few scores for customer satisfaction. In the simplest scenario the aggregation function can be a weighted average.
Although the mechanism of valuation developed in the VASSAR method exceeds the
valuation process in this work, this approach appears to successfully manage many of the challenges in early drug portfolio valuation. Primarily, this system captures the value of expert input, and allows for iterative interaction of the decision makers with the model to tune output and build confidence in predictions. The rules used for analysis serve as an intuitive input for the model, especially as can be presented in normal language immediately understood by stakeholders. Finally, the capacity of the system to manage more qualitative input is suitable to the various criteria to be represented in these portfolio.
As noted above, the evaluation process of the VASSAR model is more complex, and also
utilizes the RETE algorithm to operate a declarative program that controls the enacting of rules on the knowledge base. Although rules and the capacity to evaluate more qualitative values are critical for early drug portfolio valuation, this system would be challenging to instigate immediately given the intensive development process to capture facts, rules, and develop the required programming.
An alternative, and easily applicable approach was developed by Thurston (1992)who
proposes a system that includes allowance for non-linear relationships between the input capability and the output value to stakeholders. Also developed in the context of product development, Thurston notes the shortcomings of evaluation methods that use a simple weighted average of product capability to generate a utility value for the set of criteria. His response is to add a step of translation from input capability to output value (termed non-linear merit, NLM). Thurston’s valuation process subsequently includes a multiattribute utility function, which calculates the worth of the set as a combination of performance attributes (using the multiplicative multiattribute utility function from Keeney and Raiffa (1976).
This NLM translation of input capability to value to the designer (or stakeholder, as
characterized by Selva et al.), offers an approachable and effective tool for collective value estimation, and is utilized in this thesis as described in chapter 4. Further literature review and a check of citations of Thurston (on ‘Web of Science’) shows no application of this type to the area of drug portfolio assessment. Regardless it is considered a viable and effective initial process in early drug development decisions.
A more qualitative strategic approach addresses the rationale around the portfolio make-up in regards to the marketing intent of the portfolio drugs. Beyond the selection of disease areas in connection to corporate strategy, Nickisch, Greuel, and Bode-Greuel (2009) discuss the best balance of high risk blockbuster products, specialty (high unmet need) products, and incremental improvement products. These can be seen as basically representing: high risk high yield, medium risk medium yield, and low risk low yield investments, respectively. Nickisch et al. then compare the value of these portfolios for different company structures, namely larger pharmaceutical and biotech companies. The primary difference they explore in these company scenarios is the cost of capital, which translated to a discount rate of 10% for larger pharma and 20% for biotech companies. They conclude larger pharmaceutical companies are likely to achieve targets revenues through mix of blockbuster and incremental products, with a large bias toward blockbuster drugs. Likewise, biotechnology companies, with limited capital and high capital costs from venture

39
capital investors are equally drawn to the large returns of blockbuster products. Day (2007) offers an analogous strategy, making a comparison between largely innovation products versus smaller (or incremental) innovation products as applied to many technologically intensive industries. Day proposes a well-managed approach to distributing the risk of larger innovations through a company’s portfolio. This is achieved using a risk matrix, plotting familiarity with the market on the x-axis, and expertise with the given product on the y-axis, as seen here (Figure 1111):
Figure 11 – Day (2007) Risk matrix
To supplement this risk analysis, Day utilizes the real, win, worth it screen (R-W-W), or
Schrello screen, to break out the aspects of the product that contain risk and/or validate the value in pursuing its development. ‘Real’ questions address the actual market size and ability/willingness of consumer to purchase the product; ‘Win’ topics address the capacity of the product and the company to be competitive once in market; finally, ‘Worth it’ questions address the expected returns and strategic fit with larger company strategy. Overall, these papers present excellent topics for consideration of a product, both independently and as a portfolio member. Further, these market and strategy questions are powerful in that they can be reasonably addressed early in the development process. Given the focus of this portfolio valuation on early stage development, these represent excellent tools that are recommended for use in conjunction with following portfolio valuation system.
In conjunction with well-structured consideration of market and risk structures, effective
organizational structure is frequently addressed as critical to success in portfolio selection. Practically all reviews of early drug development management address the need for structure processes for decision making, an iterative decision process to coordinate all perspectives, and some methods to reduce bias and favoritism. For a fully integrated (larger) pharmaceutical company, Bode-Gruel and Nickisch propose a generalized process shown in Figure 1212. The primary elements of such a process are to successfully capture the input of scientific and project expertise, while applying a less biased assessment of the range of projects. In addition, serial iteration from upper management to project and department level teams, should incorporate larger strategic goals and company capacity into the final portfolio selection.
40
Figure 12 – Bode-Gruel and Nickisch (2008) Portfolio management process
Lechler and Thomas (2015) focus on the role of executive advocacy in the decision process
and effective tools to manage their influence. Their work is considered in the context of new product termination, but of course this is an implicit aspect of overall portfolio optimization and is found to apply here. Lechler and Thomas was able to a compare the quality of 150 termination decisions from a number of German pharmaceutical companies, using survey responses from executive responsible for overall R&D management at their organization. The surveys were intended to compare rates of ‘good’ decisions in the context of predefined formal decision criteria as well as a decision committee. Immediately there is concern over the results of these self-reporting type surveys, but optimistically one can presume the responding executive was sufficiently separated from the process to supply sufficient objectivity. That said, only the more general conclusions of this work are considered here. Primarily, they found a significant correlation between well-defined decision criteria and committee or group decision making. Logically this can reduce the impact of individual bias and preference. Further Lechler and Thomas note these organizational structures are not sufficient to eradicate decision bias. This voice from industry experience is well supported by personal experience of human limitation in general decision making, and it is concluded in conjunction with this work that many measures, from company decision process on to the valuation system proposed here should be employed.
In conclusion, there is limited literature explicitly representing effective tools to manage
decision-making in early pharmaceutical development, especially with a focus on synthesizing expert input with a system review of multiple decision criteria. The work in ES and rules based approaches hold the most promise for this application, and an initial version of this is presented here.
Summary of industry input and consideration of current process
Beyond the academic literature on this topic, it is also the opinion of the practitioners of this process that is driving the development of this work. The primary critique of computational optimization is that it fails to capture the complexity of the situation, in large part due to a failure to leverage the expertise and experience of scientist and decision makers. Further it leaves decision makers ‘out of the loop’ and fails to persuade stakeholders. However, it is also frequently

41
commented that the process as it stands is prone to bias and inherent limits of human consideration (as in Sharpe and Keelin’s review of Smithkline Beecham). From the literature reviewed here, both RBS approaches as well as Thurston’s NLM step to product valuation address many of the concerns explored to this point. As mentioned above, this thesis incorporates Thurston’s initial step to valuation. Through an iterative model development process it further seeks to include the expertise and judgement of decisions makers, translating heuristics and other stakeholder ‘rules’ to train the model to deliver expected and trusted outcomes.

42
As noted, currently portfolios are assessed and selected by individual and groups of experts,
using supplied information and some discussion based decision process. Although this captures the experience and knowledge of accomplished professionals, this process is prone to the errors of bias and computational limitation faced in human decision making. Alternately, some decision makers are critical of quantitative modelling approaches as they are rigid, lack the value of intuition and past experience, and can become meaningless as they attempt to ‘quantify the unquantifiable’.
Given the current state of decision making in early drug development, this work proposes a
valuation method that utilizes expert knowledge and allows for more qualitative input while delivering a higher level of uniformity and reduced bias. As noted, drug portfolio valuations in early development should consider not just early monetary estimates, but many criteria that can predict ultimate value for the organization. These assessment criteria include considerations of the drug and drug target’s scientific validation (a primary aspect of risk and development time), the fulfillment of larger strategic goals, and identifying alignment with company structure, as noted in Table 11 (chapter 2). These various criteria include quantitative values, categorical values, and qualitative stakeholder input. In addition, these criteria are being estimated at an early stage in development and are subject to significant ambiguity and uncertainty.
In this context the initial development of an expert system is proposed here that utilizes
expert input while reducing bias and improving the capacity for multiple criteria consideration. Based on decision maker skepticism of quantitative systems and the explicit need to offer a system that is accessibly to these stakeholders, a model that generates a non-linear relationship between portfolio criteria input and value delivered to stakeholders is initially recommended here (as seen in part of Thurston’s 1992 product valuation). Importantly, these non-linear relationships can also be formulated as rules for a more intuitive development process, as will be described later in this chapter. Amalgamation of these stakeholder values will be performed with a weighted average and additionally provide a conditional NPV value.
This valuation system is intended to serve as a mechanism to coordinate early information
about potential drug portfolios; in this regard the scoring of the elements and the value they provide to the whole can be indicated by preliminary costs estimates etc. but may also be considered as empirically derived or based on heuristics from the industry. At this basic level, the valuation system can be seen as a book-keeping of the decision-makers collective knowledge about the drugs under consideration, and hence the translation from inputs to aggregated portfolio value will gain efficacy through a process of parameter and value function tuning. This critical step in the model development will, like the training of statistical models, need to deliver a balance of providing reasonable prediction without being ‘over fit’ to the data used to tune the model. This work will discuss this step and take some initial steps toward tuning, but for the real world efficacy this model would require iterative processing of input data with known outcomes, with modifications shepherded by the expert stakeholders involved in the process.

43
A note on data for modelling:
This work was originally developed in communication with a mid-sized pharmaceutical company that has anonymously provided data on both potential drug acquisitions, and details on corporate strategy and their departmental capacity and current utilization. Due to concerns about competitor knowledge of internal discussions, this organization remains anonymous, but it is notable that the initial inputs represent a real world example, and development of this system may continue with their input. In this thesis, the inputs are derived from preliminary assessments from this company; their data represents scoring of three individual drugs, in additional to information on company structure and strategy. Criteria have been selected to cover the main characteristics of the portfolio, including financial, development requirements, and areas of treatment. These serve to develop the system, with the recognition that additional criteria could be included in future versions.
An expert system for early development portfolio valuation
As seen in Figure 1313, the proposed system takes in three sets of information as inputs from the user: individual drug characteristics, a formalization of current corporate strategy, and a formalization of the current company structure.

44
Figure 13- Overview of Valuation Model
As noted in chapter 3, current best practices in life science include various approaches to
developing both a preliminary NPV for drugs in development, as well as scoring along other criteria. A subset of all considerations of risk, including scientific validation, formulation, competition, and regulatory concerns in addition to fulfillment of strategy and company alignment are considered here. These sets of inputs will be discussed followed by an explanation of the process to translate this information to a final absolute or relative valuation.
User inputs to model:
Input: Individual drug valuations:
NPV: Continuous variable estimating current monetary value of the drug. This is considered here as representative of potential market size, expected reimbursement, and base cost of development, as well as relevant operating and manufacturing cost. Cost of capital is a standard baseline percentage that is used across all drugs analyzed.
Development costs: Continuous variable estimating ‘standard’ development costs that do not account for unused capacity within the organization or impact from the drug’s development environment. Although these costs are considered in the base NPV, this is used as an initial

45
portfolio screen to exclude sets that will exceed a preordained budget amount. For instance, a portfolio represent a large number of drugs that cumulatively represent a high NPV. However if the drugs represent a number of drugs with large revenues and high cost, this portfolio could exceed the company’s development budget. This criteria is considered only in the initial screening of the portfolios, using this value exclude such sets that are not feasible for development. Time to revenue (TTR): Development time before revenues would be expected (units = years). Although the discount rate for and NPV, partially accounts for this time, there are two issues that require additional consideration of this criteria. From the investor’s perspective, beyond net income, many portfolios are intended to create revenue within a certain time frame. For instance a pharmaceutical company that will have one or more patents on current products expire will have a specific time frame to generate new revenue that is not indicated by the products NPV (see Jimenez (2012) on Novartis rebuilding after a loss of many patents). In addition, a limitation of an NPV (excluding some risk adjusted versions) is that the certainty of projected revenues is considered equal whether cash flows are predicted one year ahead or 10 years, which is not always a fair assumption. In this regard the TTR can be utilized in conjunction with other risk factors to better estimate the portfolio value. Commercial requirement: A categorical variable (from 1-5, with 1 being highest value) representing the relative commercial cost of said drug. Commercial costs include marketing, outreach to doctors and potential patients, as well as regulatory agencies and insurance providers. This is also an indirect indication of whether the drug is targeting a condition in an area of high unmet need, which is a more common target area for many pharmaceutical companies and other investors. In this regard low commercial costs represent not only a lower departmental budget requirement, but a lower bar of market entry (FDA only requires a baseline efficacy, not an improvement over current medications). In addition marketing requirements are very low as patients are more likely to seek out the sole treatment for a given disease than to try a competitor to existing medications (these dynamics are represented in the value function for this criteria as discussed below). Research and Development requirement: A categorical variable (from 1-5, with 1 being highest value) indicating the likely research cost required for a given compound. This is typically reflective of the level of maturity of the product and the amount of scientific validation that has been achieved. A mature drug is on that targets a well know target and / or has a well characterized mechanism of action. Additionally if more validation of the drugs activity in various biological models has occurred this requirement is lower. Unlike the development cost criteria listed above, this is utilized later in the valuation modelling. Disease area: Categorical variable indicating whether the drug targets the same disease area as drugs a company currently has on the market. This initial criteria is used to indicate the diversity of the portfolio targets, and could eventually consider more similarities among drugs in the portfolio (disease area, drug target, drug mechanism of action, etc.).
Risk: Categorical variable indicating an aggregate risk represented by the product. For this initial development, this variable represents the summation for risk from such factors as: scientific
46
validation, competition, and regulatory oversight. For this model a scale of 1-3 is used, but integer inputs are not required.
Input: Corporate strategy and structure: In addition to individual drug scores, this model takes formalized representations of the
company’s business strategy and current structure as initial inputs. This information allows the model to capture the value of these drugs in the context of the goals of the company, and give a uniform consideration to areas of synergy, for example. In some cases these inputs are directly linked to certain assessment criteria for the drug scoring. For example, the maximum R&D budget input as part of the corporate strategy sets a monetary limit that is used to initially filter out portfolios that will exceed the company’s budget. As currently structured, the model considers seven aspects of corporate strategy and structure:
• Company budget and revenue targets: o Minimum revenue goal o Maximum total R&D budget
• Company structure: o Commercial department capacity o R&D department capacity
• Business strategy: o Time to revenue o Risk ‘limit’ o Portfolio diversity goal
Company budget and revenue targets:
Minimum revenue goal: A monetary value for the net revenue targeted for the company over the time period under consideration. As companies project revenue from current products, they frequently develop explicit revenue goals for their development portfolio. This is used here to assess portfolios for net expected revenue. Maximum R&D budget: A monetary value for the total R&D budget, meaning the maximum cost allowable for the entire development portfolio. Company Structure:
Commercial capacity: A measurement of the current commercial infrastructure at the relevant company. Depending on their current products, organizations have large variation in the relative size and capability of commercial department (represented here as a 10 point categorical variable).
R&D capacity: Categorical variable that measures the current state of the company’s R&D capacity. Depending on current work and pipeline development R&D facilities can have a large range of utilization relative to maximum capacity. Business Strategy:
Time to revenue (threshold): This variable represents a target time period when the company plans to being receiving revenue from their drugs in development. As noted above, the organization may need to ‘fill’ future revenues as current products lose patent or face new competition (a common and uniquely extreme phenomenon in the pharmaceutical industry). This target is compared to the
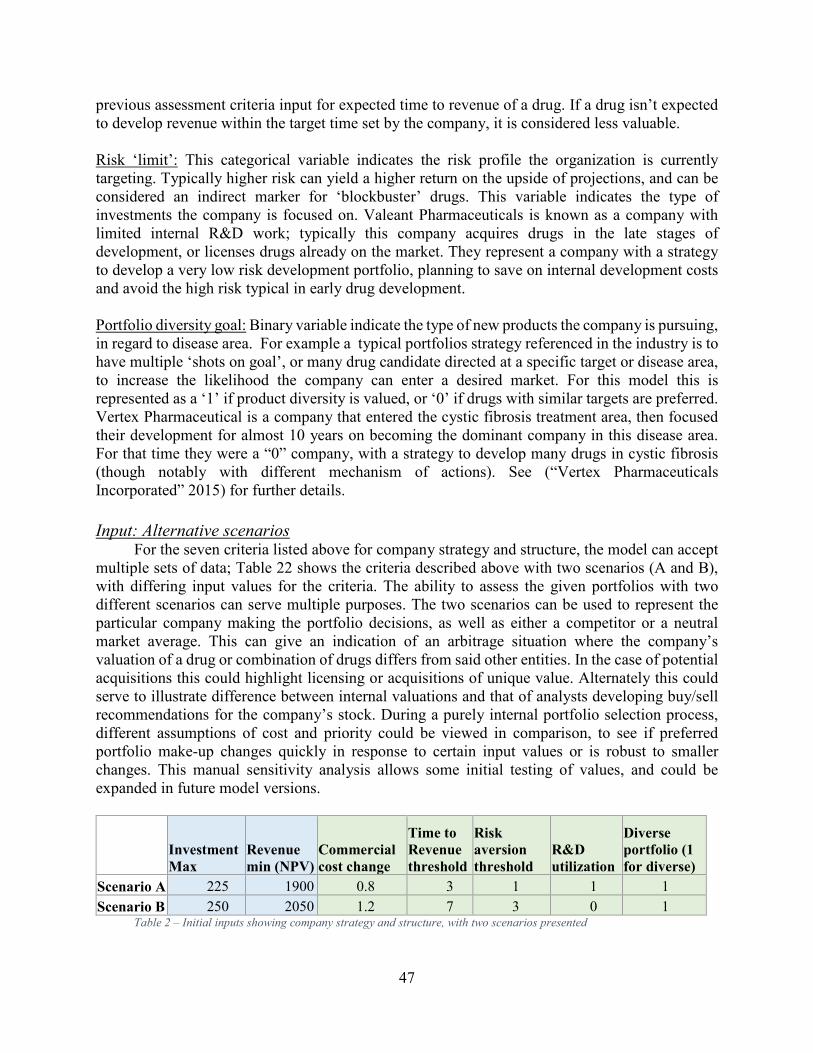
47
previous assessment criteria input for expected time to revenue of a drug. If a drug isn’t expected to develop revenue within the target time set by the company, it is considered less valuable.
Risk ‘limit’: This categorical variable indicates the risk profile the organization is currently targeting. Typically higher risk can yield a higher return on the upside of projections, and can be considered an indirect marker for ‘blockbuster’ drugs. This variable indicates the type of investments the company is focused on. Valeant Pharmaceuticals is known as a company with limited internal R&D work; typically this company acquires drugs in the late stages of development, or licenses drugs already on the market. They represent a company with a strategy to develop a very low risk development portfolio, planning to save on internal development costs and avoid the high risk typical in early drug development. Portfolio diversity goal: Binary variable indicate the type of new products the company is pursuing, in regard to disease area. For example a typical portfolios strategy referenced in the industry is to have multiple ‘shots on goal’, or many drug candidate directed at a specific target or disease area, to increase the likelihood the company can enter a desired market. For this model this is represented as a ‘1’ if product diversity is valued, or ‘0’ if drugs with similar targets are preferred. Vertex Pharmaceutical is a company that entered the cystic fibrosis treatment area, then focused their development for almost 10 years on becoming the dominant company in this disease area. For that time they were a “0” company, with a strategy to develop many drugs in cystic fibrosis (though notably with different mechanism of actions). See (“Vertex Pharmaceuticals Incorporated” 2015) for further details.
Input: Alternative scenarios For the seven criteria listed above for company strategy and structure, the model can accept
multiple sets of data; Table 22 shows the criteria described above with two scenarios (A and B), with differing input values for the criteria. The ability to assess the given portfolios with two different scenarios can serve multiple purposes. The two scenarios can be used to represent the particular company making the portfolio decisions, as well as either a competitor or a neutral market average. This can give an indication of an arbitrage situation where the company’s valuation of a drug or combination of drugs differs from said other entities. In the case of potential acquisitions this could highlight licensing or acquisitions of unique value. Alternately this could serve to illustrate difference between internal valuations and that of analysts developing buy/sell recommendations for the company’s stock. During a purely internal portfolio selection process, different assumptions of cost and priority could be viewed in comparison, to see if preferred portfolio make-up changes quickly in response to certain input values or is robust to smaller changes. This manual sensitivity analysis allows some initial testing of values, and could be expanded in future model versions.
Investment
Max
Revenue
min (NPV)
Commercial
cost change
Time to
Revenue
threshold
Risk
aversion
threshold
R&D
utilization
Diverse
portfolio (1
for diverse)
Scenario A 225 1900 0.8 3 1 1 1
Scenario B 250 2050 1.2 7 3 0 1 Table 2 – Initial inputs showing company strategy and structure, with two scenarios presented

48
Input: criteria priority (weighting) In addition to these formalizations of company strategy and structure, the priorities of these
criteria is supplied by the decision makers. For a final ranking of the portfolios based on the utility value for each criteria, the importance of the criteria relative to each other is necessary. The manager of the model can adjust these weights to tune the model output, but for this initial model set-up the 7 criteria are ranked from highest to lowest, evenly spaced from 0-1 (0 being highest priority). In this ranking it is expected that estimates of NPV and costs will have highest priority, with subsequent ranking based on discussion of corporate interests and concerns. See Table 33
Scenario:
NPV
Priority
Cost
Priority
Time to
Revenues
Priority
Commercial
Priority
R&D
alignment
Priority
Disease
area
Priority
Risk
Priority
A 0.333 0.000 0.167 0.667 0.833 0.500 1.000
B 0.000 0.333 1.000 0.833 1.000 0.167 0.667 Table 3 – Prioritization of input criteria
Input: drugs in development The current group of drugs in development is listed with scorings for each criteria. For this
work, three drugs were considered in addition the drugs the company currently has on market (treated as a single entity in this model). See Table 44:
scoring: 1 is
highest value
NPV Cost Time to
Revenues
Commercial
Requirement
R&D
alignment
Disease
area Risk
Development
drug 1 325 75 5 4 3 1 3
Development
drug 2 600 80 4 5 2 2 2
Development
drug 2 250 75 2 3 1 3 2
Current
Drugs 1500 0 0 3 1 1 1 Table 4 – Individual drugs selected and scored for input to the model
Input: Value functions and model parameters The details for each value function are explained in conjunction with the model process discussed in the following section, but these functions map the input criteria listed above to the value to the overall portfolio. Therefore there is a value function for each input criteria:
• NPV
• Development cost
49
• Time to revenue
• Commercial capacity
• R&D capacity
• Disease area
• Risk
Model valuation process:
Portfolio generation: From the input list of drugs, the possible combination of drugs into all possible portfolios is
generated. As noted, given the relatively small number of compounds under consideration here, all combinations of drugs can be considered, creating portfolios of varying sizes to represent all combinations (in this instance this corresponds to portfolio sizes of 1 – 4 drugs). This automated generation of portfolios is important to value even non-intuitive combinations of drugs. For the input list of drugs used in this model the final ‘drug’ represents the products this company already has on the market. Therefore this input (‘Current drugs’ shown in the last row of Table 44) is included in every portfolio analyzed in this model. With only 3 drugs to be combined, there are only 7 potential portfolios:
o Drug 1 o Drug 2 o Drug 3 o Drug 1, Drug 2 o Drug 1, Drug 3 o Drug 2, Drug 3 o Drug 1, Drug 2, Drug 3
Obviously larger sets could be assessed using this model, but this selection is sufficient to elucidate the valuation process. As noted in chapter 2, larger set of criteria and more potential products can generate an unmanageably large set of initial portfolios. In this case alternative approaches would be required to develop a set of portfolios for initial assessment.
Translation of input capability to stakeholder requirements – value functions: Once a portfolio is generated and the inputs for the various criteria are collected the question
can be asked: what value does this portfolio represent to the company? This model answers this question by translating the individual drug scores to an estimate of total portfolio value using the specifics of a given company, as described below.
For this model, an initial cost and revenue filter is performed. This initial filter is applied to
the portfolios’ ‘NPV’ and ‘development cost’ criteria to determine if the portfolio fulfills strategic budgetary goals, as seen in Figure 1414:

50
Figure 14 – Initial filtering of portfolios on budget and revenue goal
First, all the values for a given criteria are summed, then a NPV minimum value and a
development cost maximum filter exclude inappropriate portfolios; min and max values are set by the decision makers based on strategic goals. This initial down-selection of potential portfolios speeds up subsequent analysis, as well as excluding portfolios that may present high value but not represent the monetary investments and budget limits intended by the organization. After this, further assessment of each remaining portfolio is performed.
As noted by Thurston (1991) and others, there is frequently a non-linear relationship between
the capabilities (performance) of the set and the satisfaction this supplies to the stakeholders. Expression of this relationship is achieved using value functions to map capabilities to requirements (as described by Selva et al. 2014). For example, consider Vertex Pharmaceutical, a company that doesn’t have a large commercial department to manage the marketing and patient/ doctor support to a product in a competitive area such as cholesterol medicines. Their current infrastructure could manage some additional commercial development demand, but above some level this cost to the company will begin to grow quite quickly as structural and organizational costs become necessary. This indicates a non-linear relationship between the input of drug assessment criteria, and the output utility value to the company. At first, the relationship is somewhat linear, but then the output value begins to increase quickly for a small increase in additional input value.
The nature of the relationship of the company’s utility value to the drug input assessment
criteria is estimated with input from department heads and product managers. Graphically this relationship can be represented by an exponential function, where the utility cost to the organization begins to increase rapidly after a certain point of a portfolio’s commercial requirements. By contrast, a company like Pfizer with a more developed commercial department that would have incremental increases in commercial cost for a greater percent of portfolio’s commercial demand. The value function of this relationship would still be an exponential relationship but the point at which the portfolio’s collective commercial requirement would result in a quickly increasing cost to the company would occur at a higher input level. From this we can see that graphical relationships can capture the qualitative input from experts, but these mathematical representations will need to be tuned and ‘trained’ to successfully represent a company’s expectation.
NPV ($
thousand)
Cost ($
thousand)
NPV ($
thousand)
Cost ($
thousand)
Portfolio 1 $1,825 $75 Portfolio 1 $1,825 $75
Portfolio 2 $2,100 $80 Portfolio 3 $1,750 $75
Portfolio 3 $1,750 $75
Portfolio 4 $2,425 $155
Portfolio 5 $2,075 $150
Filters:
Minimum
revenue
goal:
$2100
Maximum
R&D
budget:
$125

51
As exhibited in Table 552, this model utilizes various mathematical relationships to generate these value functions (as seen in Thurston 1991), in conjunction with if-then statements to determine exactly which function will approximate the value from a given capability. These functions can alternately be expressed as rules, and it is the intent of this system that these two are reasonable approximations of each other. Functionally, the valuation process proceeds as follows: for a given criteria, the values for each drug are summed for all elements in a given portfolio. For NPV and development costs these functions are simply 1:1 relationships, and are referred to as identity functions. Once all values for a criteria are summed, translation from input capability to value occurs via the functions noted in Table 552. In most functions the translation from input capability to output value is performed on an average of the criteria values, but in other cases binning or other functions serve as a basis.
These function represent an additional input to the system, but this input is considered fixed
for this thesis. In general the nature of the relationship between value to company and input capabilities will require tuning and refinement using historical inputs with known actual costs.
Criteria Value Function Description
NPV Identity Function Net present value, not risk adjusted
Development Cost Identity Function Projected development cost (nominal value)
Time to Revenue
Sooner return is lower output value. Value rises linearly up to stakeholder threshold, then jumps to max value.
Commercial Impact
Lower commercial costs for drug are lower output value. Exponential relationship between capability and value to stakeholder – output value rises quickly relative to capability
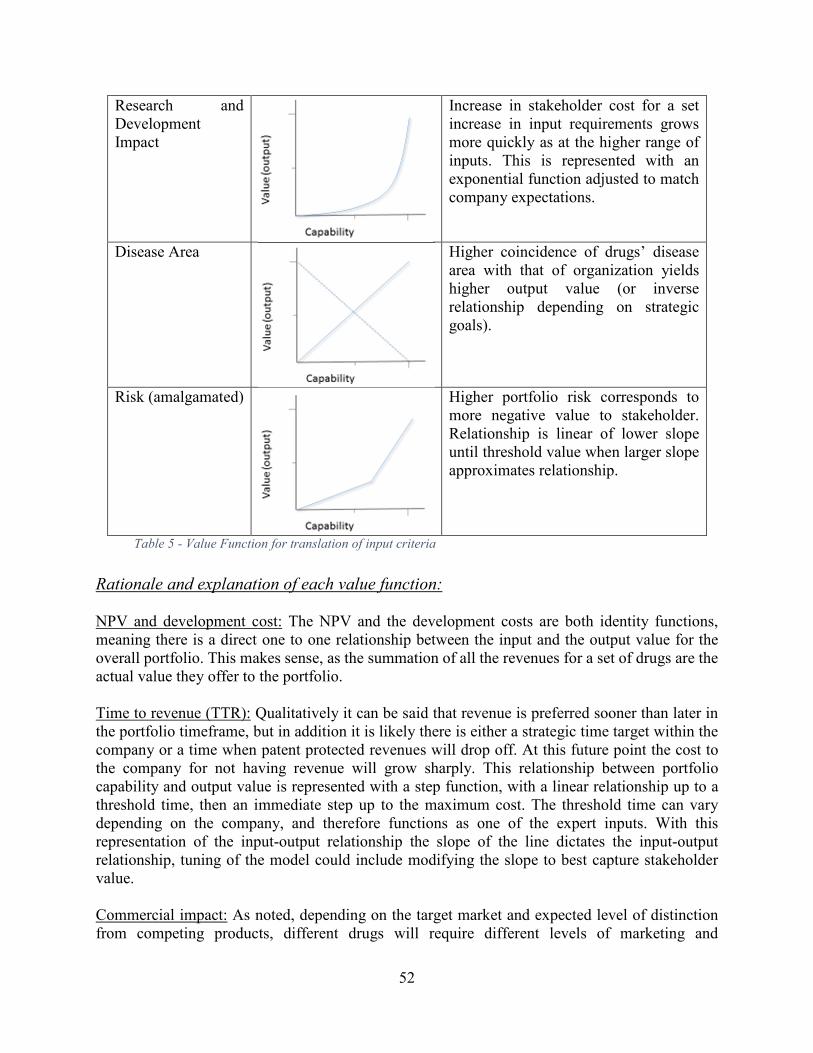
52
Research and Development Impact
Increase in stakeholder cost for a set increase in input requirements grows more quickly as at the higher range of inputs. This is represented with an exponential function adjusted to match company expectations.
Disease Area
Higher coincidence of drugs’ disease area with that of organization yields higher output value (or inverse relationship depending on strategic goals).
Risk (amalgamated)
Higher portfolio risk corresponds to more negative value to stakeholder. Relationship is linear of lower slope until threshold value when larger slope approximates relationship.
Table 5 - Value Function for translation of input criteria
Rationale and explanation of each value function:
NPV and development cost: The NPV and the development costs are both identity functions, meaning there is a direct one to one relationship between the input and the output value for the overall portfolio. This makes sense, as the summation of all the revenues for a set of drugs are the actual value they offer to the portfolio.
Time to revenue (TTR): Qualitatively it can be said that revenue is preferred sooner than later in the portfolio timeframe, but in addition it is likely there is either a strategic time target within the company or a time when patent protected revenues will drop off. At this future point the cost to the company for not having revenue will grow sharply. This relationship between portfolio capability and output value is represented with a step function, with a linear relationship up to a threshold time, then an immediate step up to the maximum cost. The threshold time can vary depending on the company, and therefore functions as one of the expert inputs. With this representation of the input-output relationship the slope of the line dictates the input-output relationship, tuning of the model could include modifying the slope to best capture stakeholder value.
Commercial impact: As noted, depending on the target market and expected level of distinction from competing products, different drugs will require different levels of marketing and

53
patient/doctor support for their success. The example of a new statin drug competing in the cholesterol lowering space (high commercial requirement) versus a drug in a high unmet need area like cystic fibrosis or other ‘orphan diseases’ was introduced earlier. In this context, and from feedback from industry professionals, it is observed that a small increase in a company’s commercial demand is accommodated with improved efficiencies and minor increase in headcount. At some point though, significant restructuring and associated organizational shifts and higher level staff are required, resulting in a higher organizational cost. To model this relationship an exponential function can be utilized to approximate the above dynamic. The tuning of this function is of particular importance, as the function is a fair representation of this stakeholder cost at the right range, but as the function approaches its limit it is no longer indicative of stakeholder cost.
R&D impact: Individual drugs have differing levels of validation, and this scientific work can become very extensive if the underlying biology of the products action is not well understood. This mushrooming of research and development results from a need for more fundamental research to clarify the systems structure as well as verification that validations tests are reliable. Therefore the stakeholder value (output) for this criteria begins to grow very quickly at lower levels of drugs’ maturity and validation; an exponential function effectively approximates this relationship. As noted for the commercial value function, the exponential function can be tuned to represent this rate in increase between input requirement and stakeholder value.
Disease area: the relationship of input to stakeholder (output) value is dependent on the strategy of the company – when diversification into new areas is valued the less similar the new drugs are to the company’s current products the portfolio represents a higher value. If the company is looking to bolster its position in their current product field, then this relationship is inverted. This scenario can be represented graphically with a linear relationship between input and output values, but the slope of the line (negative or positive) will depend on company strategic intent.
Risk: Pharmaceutical companies are exposed to large risk from multiple sources in early development and therefore a precise representation of the portfolio value based on individual risk criteria is difficult. Professionals in the field appear to commonly consider risk more categorically. Therefore the net risk for the portfolio is graphically represented as a linear relationship, but as the risk gets higher the rate of increased cost to the portfolio increases. As seen in Table 552, this is captured by a point above which the linear relationship has a higher slope. The point of rate increase can be modified by the decision makers as an indicator of risk aversion for the current strategic goals.
Rules for value functions and relevant model parameters:
There are various inputs and possible adjustments to the single utility value functions that can modify the output of the system to account for: different company strategies and different organizational structure, as well as tuning and training of the model as it is brought into use in a professional setting. The decision makers are responsible for the two sets of inputs, firstly the scoring of individual drugs on various criteria (which already an analysis that typically occurs in the industry). Secondly the decision makers provide a formalized representation of business

54
strategy and current company structure. The manager of this model would be responsible for managing the details that will modify and tune the model. These items are summarized here:
Time to revenue has a threshold value that represents the target time period to begin to
receive revenue from the portfolio. This input comes from the decision makers – the manager of the model should explain the intent of this threshold, and in addition can tune this criteria’s value function using the slop of the line leading up to the threshold to adjust for the company’s focus on shorter term revenue
Commercial impact, and R&D impact, can output differing stakeholder values given a set input, depending on the precise exponential used and the section of the exponential graph selected. Examples of the adjustments possible are shown in Figure 1515; the red and blue lines represent different tunings of the commercial impact value function. To translate the affirmation from the company’s experience that the commercial costs would increase dramatically for the upper end of the input range, the blue line is more accurate. If the commercial burden increase rate increases relative to the input, but less severely, the red line is more representative. The model will be tuned in this way to develop output behavior that aligns with expectations of the experts and corresponds to past outcomes.
Figure 15 – Representation of value function tuning with exponential graph
Disease area behavior is primarily controlled by the strategic goals of the company as
represented in the decision makers’ formal strategy inputs. Portfolios with a diverse holding of products will provide a higher stakeholder value if the company strategy is to diversify, and the inverse will hold if the goals are to bolster their position for treatment within a given disease area. Additionally the model manager could tune the model output using the slope of the line representing the value relationship.
Synthesis of individual criteria valuations:
At this juncture the valuation model has collected the individual input scores and translated each criteria for a given portfolio into a utility value for the stakeholders. For this work two approaches are now taken to give estimations of the comparative value of the portfolios. First, all single utility output values are normalized and amalgamated with a weighted mean, with weighting provided as initial inputs from decision makers. The current inputs for the weighting rank the 7 criteria from highest to lowest, evenly spaced from 0 – 1 (as seen in Table 11). This priority
Stakeholder Value
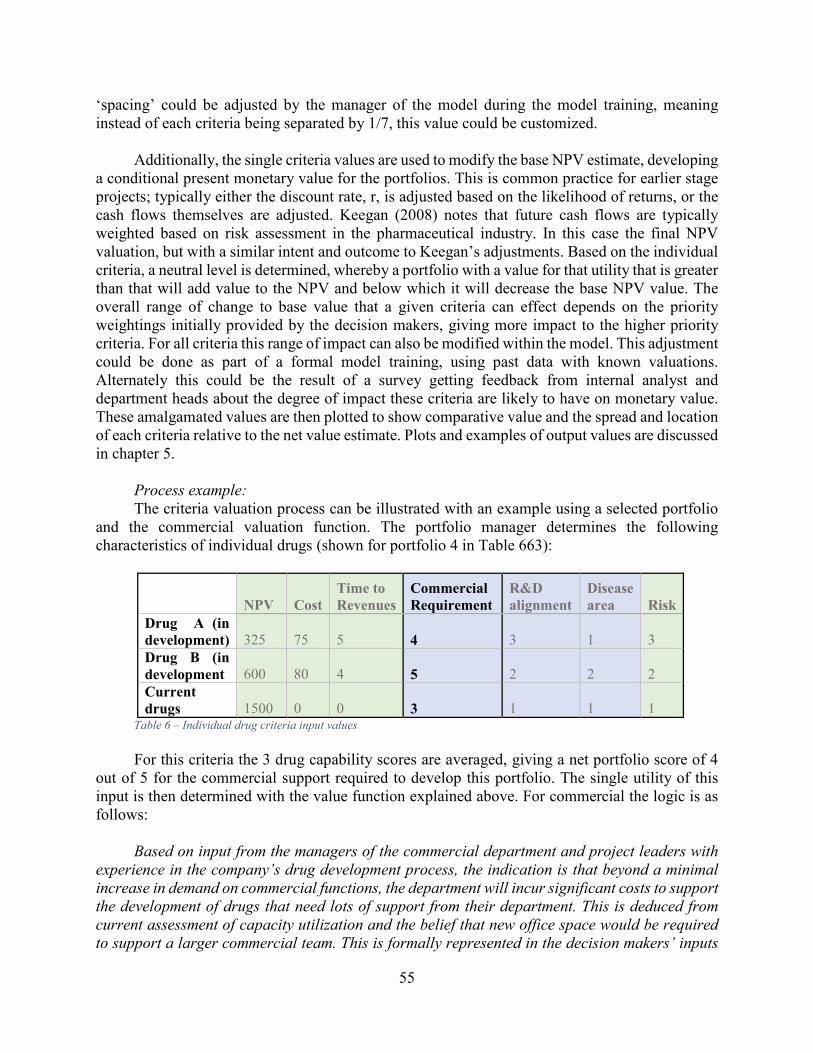
55
‘spacing’ could be adjusted by the manager of the model during the model training, meaning instead of each criteria being separated by 1/7, this value could be customized.
Additionally, the single criteria values are used to modify the base NPV estimate, developing
a conditional present monetary value for the portfolios. This is common practice for earlier stage projects; typically either the discount rate, r, is adjusted based on the likelihood of returns, or the cash flows themselves are adjusted. Keegan (2008) notes that future cash flows are typically weighted based on risk assessment in the pharmaceutical industry. In this case the final NPV valuation, but with a similar intent and outcome to Keegan’s adjustments. Based on the individual criteria, a neutral level is determined, whereby a portfolio with a value for that utility that is greater than that will add value to the NPV and below which it will decrease the base NPV value. The overall range of change to base value that a given criteria can effect depends on the priority weightings initially provided by the decision makers, giving more impact to the higher priority criteria. For all criteria this range of impact can also be modified within the model. This adjustment could be done as part of a formal model training, using past data with known valuations. Alternately this could be the result of a survey getting feedback from internal analyst and department heads about the degree of impact these criteria are likely to have on monetary value. These amalgamated values are then plotted to show comparative value and the spread and location of each criteria relative to the net value estimate. Plots and examples of output values are discussed in chapter 5.
Process example:
The criteria valuation process can be illustrated with an example using a selected portfolio and the commercial valuation function. The portfolio manager determines the following characteristics of individual drugs (shown for portfolio 4 in Table 663):
NPV Cost
Time to
Revenues
Commercial
Requirement
R&D
alignment
Disease
area Risk
Drug A (in
development) 325 75 5 4 3 1 3
Drug B (in
development 600 80 4 5 2 2 2
Current
drugs 1500 0 0 3 1 1 1 Table 6 – Individual drug criteria input values
For this criteria the 3 drug capability scores are averaged, giving a net portfolio score of 4
out of 5 for the commercial support required to develop this portfolio. The single utility of this input is then determined with the value function explained above. For commercial the logic is as follows:
Based on input from the managers of the commercial department and project leaders with
experience in the company’s drug development process, the indication is that beyond a minimal
increase in demand on commercial functions, the department will incur significant costs to support
the development of drugs that need lots of support from their department. This is deduced from
current assessment of capacity utilization and the belief that new office space would be required
to support a larger commercial team. This is formally represented in the decision makers’ inputs

56
under company strategy, resulting in a value function similar to the red lined plot shown in Figure
1515.
As the individual drug requirements are on the high end of the range, it is expected that the criteria output value will be quite high, which matches the model output, as seen in Table 774. In summary, the model has taken the decision makers’ input on the individual drugs, and internal assessment of the commercial department’s capacity and the dynamics of increased usage. From this an amalgamated individual utility score is output that represents the impact of the commercial requirements of the portfolio on the particular company making the consideration.
Stakeholder Value:
Commercial
impact
Portfolio 1 0
Portfolio 2 0.44
Portfolio 3 0.13
Portfolio 4 0.78
Portfolio 5 0.19
Table 7 – Stakeholder value output from commercial impact for 5 portfolios
Interface, practical use and data:
It should briefly be noted that this system is intended to function in conjunction with the decision making process and is intended to be very accessible to all decision makers involved in the process. Although this model is processed in MatLab, all input details are encoded in Excel models for drug criteria and formalization of strategy and alignment characteristics. This allows for the use of a familiar interface, with more technical coding only required as the model is initially tuned to match decision makers past experience and current expectations. Therefore in practice the portfolio managers or other relevant decision makers will operate within the familiar confines of Excel spreadsheet, and only the manager of the model while training the model and will work in a specialized programming language (Matlab, or possibly others in future model iterations).
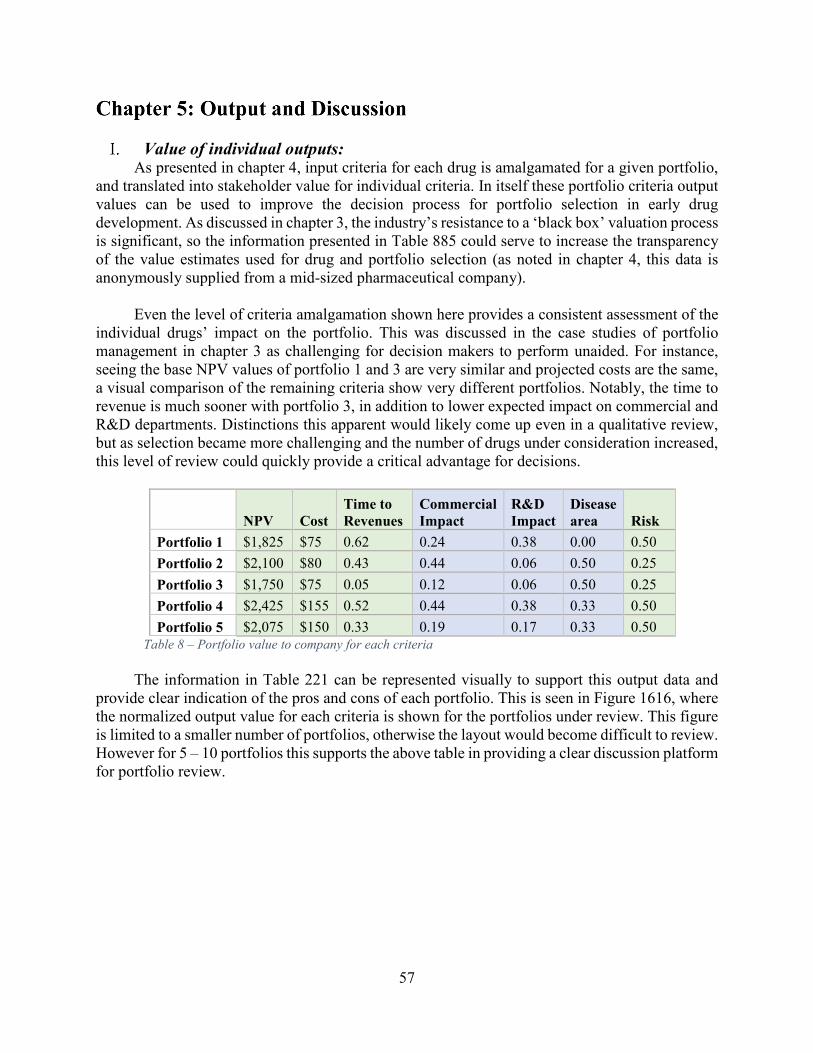
57
Value of individual outputs: As presented in chapter 4, input criteria for each drug is amalgamated for a given portfolio,
and translated into stakeholder value for individual criteria. In itself these portfolio criteria output values can be used to improve the decision process for portfolio selection in early drug development. As discussed in chapter 3, the industry’s resistance to a ‘black box’ valuation process is significant, so the information presented in Table 885 could serve to increase the transparency of the value estimates used for drug and portfolio selection (as noted in chapter 4, this data is anonymously supplied from a mid-sized pharmaceutical company).
Even the level of criteria amalgamation shown here provides a consistent assessment of the
individual drugs’ impact on the portfolio. This was discussed in the case studies of portfolio management in chapter 3 as challenging for decision makers to perform unaided. For instance, seeing the base NPV values of portfolio 1 and 3 are very similar and projected costs are the same, a visual comparison of the remaining criteria show very different portfolios. Notably, the time to revenue is much sooner with portfolio 3, in addition to lower expected impact on commercial and R&D departments. Distinctions this apparent would likely come up even in a qualitative review, but as selection became more challenging and the number of drugs under consideration increased, this level of review could quickly provide a critical advantage for decisions.
NPV Cost
Time to
Revenues
Commercial
Impact
R&D
Impact
Disease
area Risk
Portfolio 1 $1,825 $75 0.62 0.24 0.38 0.00 0.50
Portfolio 2 $2,100 $80 0.43 0.44 0.06 0.50 0.25
Portfolio 3 $1,750 $75 0.05 0.12 0.06 0.50 0.25
Portfolio 4 $2,425 $155 0.52 0.44 0.38 0.33 0.50
Portfolio 5 $2,075 $150 0.33 0.19 0.17 0.33 0.50 Table 8 – Portfolio value to company for each criteria
The information in Table 221 can be represented visually to support this output data and
provide clear indication of the pros and cons of each portfolio. This is seen in Figure 1616, where the normalized output value for each criteria is shown for the portfolios under review. This figure is limited to a smaller number of portfolios, otherwise the layout would become difficult to review. However for 5 – 10 portfolios this supports the above table in providing a clear discussion platform for portfolio review.
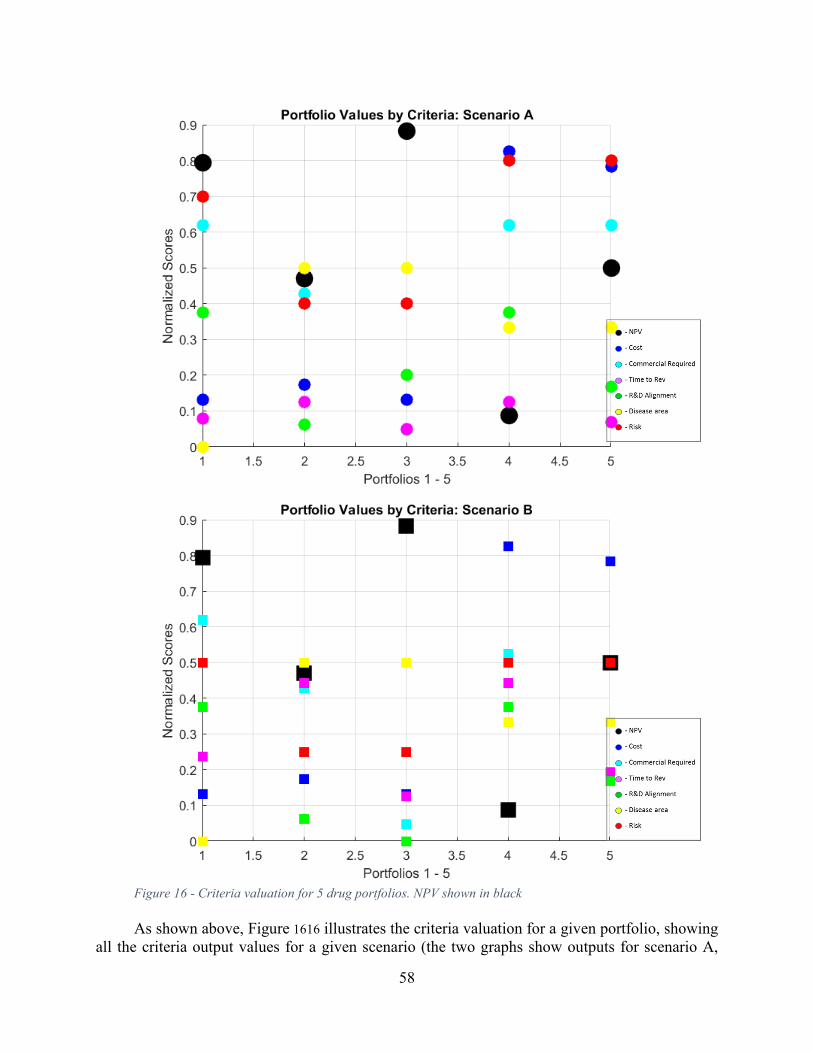
58
Figure 16 - Criteria valuation for 5 drug portfolios. NPV shown in black
As shown above, Figure 1616 illustrates the criteria valuation for a given portfolio, showing
all the criteria output values for a given scenario (the two graphs show outputs for scenario A,

59
followed by scenario B). For a direct comparison of the two scenarios, a boxplot effectively shows the mean utility and the range of values for each scenario, exhibited here in Figure 1717. Again these are utility values (with 0 = higher value); in this sense these output provide value relative to the portfolios considered and not in any independent scale.
To assess the portfolios, the spread and relative values within each criteria can be
qualitatively compared. For example in Figure 1616 in portfolio 3, although the NPV is less favorable than the other portfolios, the other criteria are rather favorable. Depending on the priorities set by the company, the net value of portfolio 3 could be very similar to portfolio 5; this inference would not be likely if the NPV numbers were simply compared side by side with a discussion of these other criteria.
Figure 17 – Box plot of ordinal ranking of portfolios. Red and blue show valuation for 2 scenarios
Figure 1717 indicates the same range of criteria values, but overlays the output values for
each portfolio based on the strategy scenarios previously reviewed (see
Investment
Max
Revenue
min (NPV)
Commercial
cost change
Time to
Revenue
threshold
Risk
'aversion'
threshold
R&D
uUtilizatio
n
Diverse
portfolio (1
for diverse)
Scenario A 225 1900 0.8 3 1 1 1
Scenario B 250 2050 1.2 7 3 0 1
Table 221). As discussed, this can illustrate the sensitivity of portfolios to strategy input values, it can also show where the company recognizes more or less value than external sources. The current two scenarios are intended to compare the portfolio value based on companies with
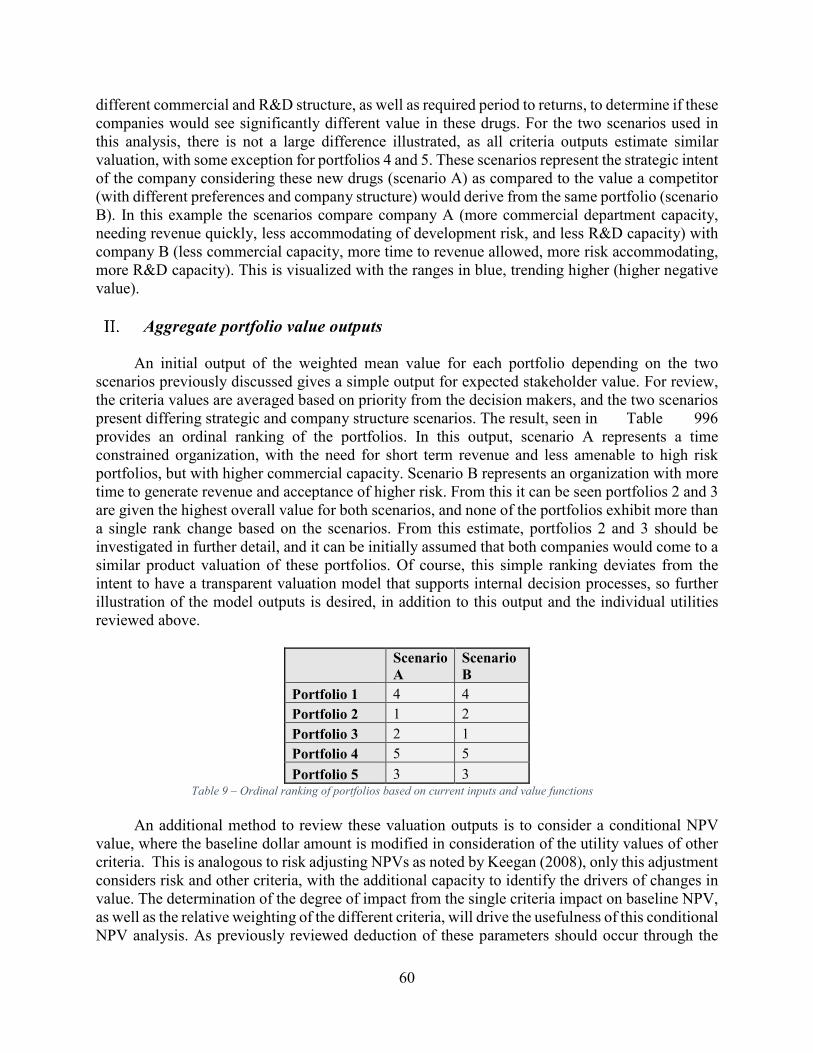
60
different commercial and R&D structure, as well as required period to returns, to determine if these companies would see significantly different value in these drugs. For the two scenarios used in this analysis, there is not a large difference illustrated, as all criteria outputs estimate similar valuation, with some exception for portfolios 4 and 5. These scenarios represent the strategic intent of the company considering these new drugs (scenario A) as compared to the value a competitor (with different preferences and company structure) would derive from the same portfolio (scenario B). In this example the scenarios compare company A (more commercial department capacity, needing revenue quickly, less accommodating of development risk, and less R&D capacity) with company B (less commercial capacity, more time to revenue allowed, more risk accommodating, more R&D capacity). This is visualized with the ranges in blue, trending higher (higher negative value).
Aggregate portfolio value outputs
An initial output of the weighted mean value for each portfolio depending on the two scenarios previously discussed gives a simple output for expected stakeholder value. For review, the criteria values are averaged based on priority from the decision makers, and the two scenarios present differing strategic and company structure scenarios. The result, seen in Table 996 provides an ordinal ranking of the portfolios. In this output, scenario A represents a time constrained organization, with the need for short term revenue and less amenable to high risk portfolios, but with higher commercial capacity. Scenario B represents an organization with more time to generate revenue and acceptance of higher risk. From this it can be seen portfolios 2 and 3 are given the highest overall value for both scenarios, and none of the portfolios exhibit more than a single rank change based on the scenarios. From this estimate, portfolios 2 and 3 should be investigated in further detail, and it can be initially assumed that both companies would come to a similar product valuation of these portfolios. Of course, this simple ranking deviates from the intent to have a transparent valuation model that supports internal decision processes, so further illustration of the model outputs is desired, in addition to this output and the individual utilities reviewed above.
Scenario
A
Scenario
B
Portfolio 1 4 4
Portfolio 2 1 2
Portfolio 3 2 1
Portfolio 4 5 5
Portfolio 5 3 3 Table 9 – Ordinal ranking of portfolios based on current inputs and value functions
An additional method to review these valuation outputs is to consider a conditional NPV
value, where the baseline dollar amount is modified in consideration of the utility values of other criteria. This is analogous to risk adjusting NPVs as noted by Keegan (2008), only this adjustment considers risk and other criteria, with the additional capacity to identify the drivers of changes in value. The determination of the degree of impact from the single criteria impact on baseline NPV, as well as the relative weighting of the different criteria, will drive the usefulness of this conditional NPV analysis. As previously reviewed deduction of these parameters should occur through the
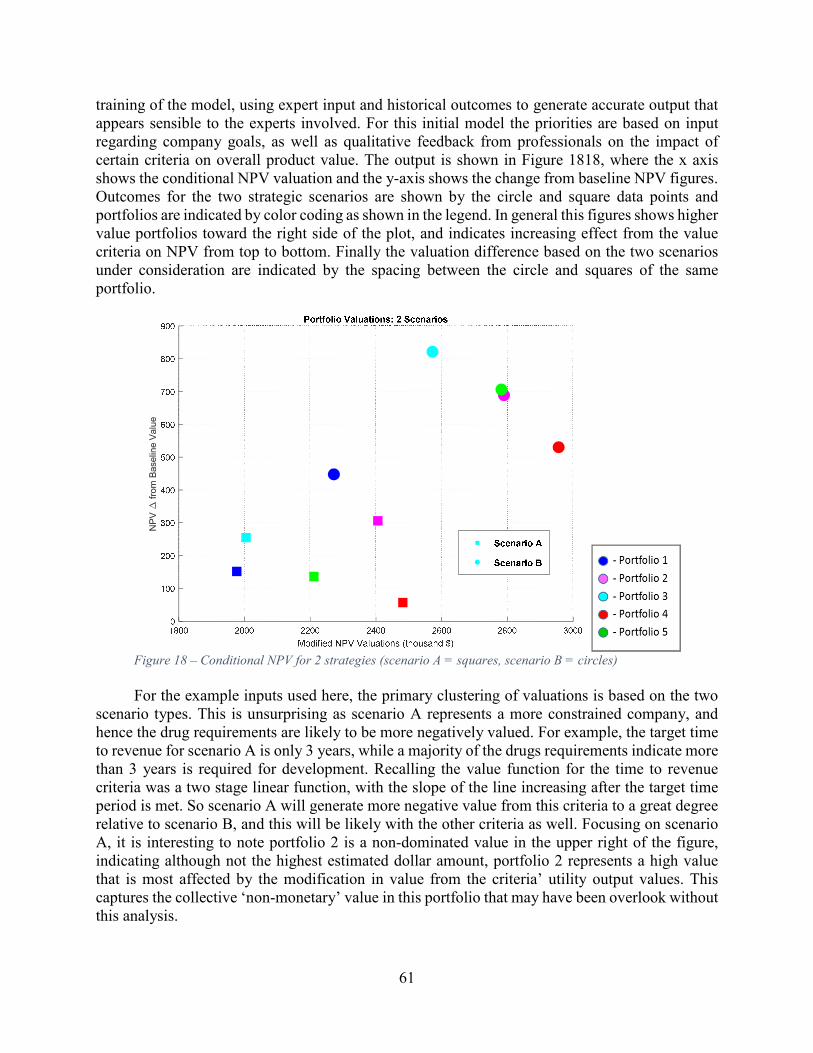
61
training of the model, using expert input and historical outcomes to generate accurate output that appears sensible to the experts involved. For this initial model the priorities are based on input regarding company goals, as well as qualitative feedback from professionals on the impact of certain criteria on overall product value. The output is shown in Figure 1818, where the x axis shows the conditional NPV valuation and the y-axis shows the change from baseline NPV figures. Outcomes for the two strategic scenarios are shown by the circle and square data points and portfolios are indicated by color coding as shown in the legend. In general this figures shows higher value portfolios toward the right side of the plot, and indicates increasing effect from the value criteria on NPV from top to bottom. Finally the valuation difference based on the two scenarios under consideration are indicated by the spacing between the circle and squares of the same portfolio.
Figure 18 – Conditional NPV for 2 strategies (scenario A = squares, scenario B = circles)
For the example inputs used here, the primary clustering of valuations is based on the two
scenario types. This is unsurprising as scenario A represents a more constrained company, and hence the drug requirements are likely to be more negatively valued. For example, the target time to revenue for scenario A is only 3 years, while a majority of the drugs requirements indicate more than 3 years is required for development. Recalling the value function for the time to revenue criteria was a two stage linear function, with the slope of the line increasing after the target time period is met. So scenario A will generate more negative value from this criteria to a great degree relative to scenario B, and this will be likely with the other criteria as well. Focusing on scenario A, it is interesting to note portfolio 2 is a non-dominated value in the upper right of the figure, indicating although not the highest estimated dollar amount, portfolio 2 represents a high value that is most affected by the modification in value from the criteria’ utility output values. This captures the collective ‘non-monetary’ value in this portfolio that may have been overlook without this analysis.
NPV from Baseline Value
62
Discussion of model outputs and applications:
Even with the relatively small number of drugs and company scenarios under consideration, analysis of multiple drug criteria with many potential combinations of drug portfolios, and non-simple relationships between input capability and stakeholder value is a daunting process without some process support. Within that context these model outputs appear to achieve the fundamental objectives of the system. Specifically, from the intended objectives, the outputs above support the items in bold:
• Generate all portfolios for non-intuitive solutions
• Leverage existing scorings for individual drugs
• Introduce single attribute utility functions
• Application of criteria uniform across all portfolios
• Provide visual tools for comparison of portfolios
• Provide framework for further valuation system development
More generally, the outputs shown above supply the decision makers with a coherent and
consistent view of the impact of their initial inputs. The details for how these outputs could function in the decision process depends on the details of the company’s overall process but two aspects of their use was supported by business development teams at Vertex. The first is as a test of assumptions and an iterative interface to explore individual drug utility scoring. The multiple company scenarios have been previously discussed in this type of application, and the value of this model in part rely on a similar process for the individual drug scoring. Once an initial group of experts and managers feel confident in these outputs and their assumptions and estimates for system inputs, the final value estimations and figures above provide an effective tool for discussion and presentation to upper management for more formal assessment.
The use of this portfolio valuation has been presented as a decision tool in the context of
medium to large size pharmaceutical companies, but this system should have significant value in other context as well. Given the intended process of identifying significant difference in value based on company structure, this system could be useful for any organization competing with or considering acquisition or licensing with a pharmaceutical company. Although a venture capital firm or a small biotechnology company won’t have the same perspective on the value structure of a compound or group of compounds, this allows them to forecast their partners perspective.

63
Contributions to Early Drug Portfolio Assessment
Pharmaceutical product development is a complex process that depends on successful scientific understanding of disease, as well as the management of: product uncertainty, company strategy, company structure, and ambiguity of stakeholder needs. In this sprawling challenge, this work is intended to retain the judgment and expert knowledge of the decision makers, while improving the consistency and reducing the bias of valuation for drugs I nearly development. Within the industry, there are concerns that individuals exhibit preferences and other biases that impact decision making; furthermore, a review of the number of relevant value criteria in addition to the size of potential products for development indicate consistent evaluation exceeds unaided human consideration. Countering this are valid concerns by decision makers that common quantitative valuation methods are too formulaic, don’t sufficiently consider past experience and judgment, and in the worst case become meaningless quantifications of the unquantifiable. In this context, this makes initial steps two achieve two important goals: retaining the input and judgment from experts, while reducing the bias and limits of human consideration. References other objectives of this system, it does perform the initial task of developing potential portfolios, which will support consideration of non-intuitive combinations of therapies. In addition, the model is organized to utilize current individual drug scoring, and if instigated would provide a platform for more sophisticated amalgamation of criteria values. This model is seen as an initial step though, and its current format is in need of significant improvement.
Criticisms and future work
First, this model attains the value of industry experts and decision makers only through significant input and model tuning, and output from the model is not valuable without this ‘training’. Hence the work here is mostly illustrative and not predictive. This is a weakness in that the model requires an input of company resources and time, and its value cannot be immediately viewed to support its adoption. Once a model had been refined in a given application this could be shown to other organizations as indication of value, but this development requirement will remain. More specifically to this work, this model training means the current outputs are of limited value, and the question of the ultimate predictive capacity of this type of model remain undetermined. This work utilizes initial values indicated by professionals in a mid-sized pharmaceutical, but actual training of the model (iterative testing and refinements with expert input and past outcomes) was not performed. It is reasonable to presume that in some context this model could be a helpful tool as a ‘book keeping’ system for early drug considerations, but the ultimate ability to capture expert input to effectively predict value remains to be significantly shown.
In regard to the model function, a primary limitation in its current configuration is the methods for amalgamating individual utility output values. As Thurston (1992) notes, a weighted average approach to combine the impact of multiple criteria is often an oversimplification, as the ideal set (or portfolio here) will find not a ranking of criteria but, “…overall value improvements as each performance attribute changes in isolation for the others.” This work posits some value to the current weighted average as performed here, and notes the end-user concerns of relatively ‘incomprehensible’ valuation processes. Nonetheless it is clear that a critical next step in the development of this valuation system would incorporate a multiattribute utility analysis as seen in

64
Thurston’s work or similar. Furthermore, the utility criteria selected for this analysis could be expanded and/or revised to supply better discrimination between portfolios, and better represent relevant drivers of value. This is evident with the risk criteria, which at this point is an amalgamation of scientific risk and competitive risk. These two factors surely have unique characteristics that would result in different value functions and modification based on company strategy and structure. Finally, a model that considered risk and cost structures in a time series would add a great deal of precision to support this decision process. For example, development costs are shown as a single value with a maximum filter excluding portfolios that exceed budget allowance. This representation will miss situations where the annual costs for the pipeline of drugs will exceed the annual budget, even if their collective multi-year sum doesn’t exceed average company budget allocation.
Overall, it is hoped that this system serves as a valid entry point to improving the qualitative discussion that dominate current industry decision practices. Whether this system developed into a full RBS model or integrated more sophisticated amalgamation of criteria output, this straightforward decision aid could pave the way for improvements in this critical decision juncture.
Aurentz, Vincent, Bernhard Kirschbaum, and Markus Thunecke. 2011. “Revitalizing Portfolio Decision-
Making at Merck Serono S.A. - Geneva.” Journal of Commercial Biotechnology 17 (1): 24–36. doi:10.1057/jcb.2010.26.
Bas¸çiftçi, F., and O.f. Hatay. 2011. “Reduced-Rule Based Expert System by the Simplification of Logic Functions for the Diagnosis of Diabetes.” Computers in Biology and Medicine 41 (6): 350–56. doi:10.1016/j.compbiomed.2011.03.012.
Benjamin, Blass. 2015. Basic Principles of Drug Discovery and Development. Amsterdam, [Netherlands] : Academic Press, 2015. http://libproxy.mit.edu/login?url=https://search.ebscohost.com/login.aspx?direct=true&AuthType=cookie,sso,ip,uid&db=cat00916a&AN=mit.002384483&site=eds-live.
Betz, Ulrich A. K. 2011. “Portfolio Management in Early Stage Drug Discovery - a Traveler’s Guide through Uncharted Territory.” Drug Discovery Today 16 (13-14): 609–18. doi:10.1016/j.drudis.2011.04.012.
Blau, G., B. Mehta, S. Bose, J. Pekny, G. Sinclair, K. Keunker, and P. Bunch. 2000. “Risk Management in the Development of New Products in Highly Regulated Industries.” In Computers & Chemical
Engineering, 24:659–64. Elsevier. Bode-Greuel, Kerstin M, and Klaus J Nickisch. 2008. “Value-Driven Project and Portfolio Management in
the Pharmaceutical Industry: Drug Discovery versus Drug Development – Commonalities and Differences in Portfolio Management Practice.” Journal of Commercial Biotechnology 14 (4): 307–25. doi:10.1057/jcb.2008.6.
Carazo, Ana F., Trinidad Gómez, Julián Molina, Alfredo G. Hernández-Díaz, Flor M. Guerrero, and Rafael Caballero. 2010. “Solving a Comprehensive Model for Multiobjective Project Portfolio Selection.” Computers & Operations Research 37 (4): 630–39. doi:10.1016/j.cor.2009.06.012.
Cioffe, C. 2011. “Portfolio Selection and Management in Pharmaceutical Research and Development: Issues and Challenges.” Clinical Pharmacology And Therapeutics 89 (2): 300–303. doi:10.1038/clpt.2010.289.
Crawley, Edward, Bruce Cameron, and Daniel Selva. 2016. System Architecture : Strategy and Product
Development for Complex Systems. Hoboken, NJ : Pearson Higher Education, Inc., [2016]. Day, G.s. 2007. “Is It Real? Can We Win? Is It Worth Doing? [innovation Risk Management].” Harvard
Business Review 85 (12): 110–20.

65
Ding, Min, Jehoshua Eliashberg, and Stefan Stremersch. 2014. Innovation and Marketing in the
Pharmaceutical Industry : Emerging Practices, Research, and Policies. New York : Springer, 2014.
Dunson, Thomas R. 2010. “A Review of Project Management in Life Science Industry Sectors.” In Portfolio, Program, and Project Management in the Pharmaceutical and Biotechnology Industries, edited by Pete Harpum, 3–19. John Wiley & Sons, Inc. http://onlinelibrary.wiley.com/doi/10.1002/9780470603789.ch1/summary.
Edwards, Ward. 1992. Utility Theories : Measurements and Applications. Studies in Risk and Uncertainty. New York : Springer Science+Business Media, LLC, [1992].
Ehrgott, M. 2002. “The Balance Space Approach to Multicriteria Decision Making---Involving the Decision Maker.” Edited by Albert N. Voronin. Computers & Mathematics with Applications. An
International Journal 44 (7): 909. Espinoza, R. David. 2014. “Separating Project Risk from the Time Value of Money: A Step toward
Integration of Risk Management and Valuation of Infrastructure Investments.” International
Journal of Project Management 32 (August): 1056–72. doi:10.1016/j.ijproman.2013.12.006. Forgy, C.l. 1982. “Rete: A Fast Algorithm for the Many Pattern/many Object Pattern Match Problem.”
Artificial Intelligence 19 (1): 17–37. Gassmann, Oliver, Gerrit Reepmeyer, and Maximilian von Zedtwitz. 2008. Leading Pharmaceutical
Innovation : Trends and Drivers for Growth in the Pharmaceutical Industry. Berlin : Springer, c2008.
Hartmann, Marcus, and Ali Hassan. 2006. “Application of Real Options Analysis for Pharmaceutical R&D Project valuation—Empirical Results from a Survey.” Research Policy 35 (January): 343–54. doi:10.1016/j.respol.2005.12.005.
Hay, Michael, David W Thomas, John L Craighead, Celia Economides, and Jesse Rosenthal. 2014. “Clinical Development Success Rates for Investigational Drugs.” Nature Biotechnology 32 (1): 40–51. doi:10.1038/nbt.2786.
Hughes, JP, S Rees, SB Kalindjian, and KL Philpott. 2011. “Principles of Early Drug Discovery.” British
Journal of Pharmacology 162 (6): 1239–49. doi:10.1111/j.1476-5381.2010.01127.x. Jekunen, Antti. 2014. “Decision-Making in Product Portfolios of Pharmaceutical Research and
Development - Managing Streams of Innovation in Highly Regulated Markets.” Drug Design,
Development & Therapy 8 (October): 2009. Jimenez, Joseph. 2012. “The CEO of Novartis On Growing After A Patent Cliff.” Harvard Business Review
90 (12): 39–42. Kahneman, Daniel. 2011. Thinking, Fast and Slow. New York : Farrar, Straus and Giroux, 2011. Keegan, Karl D. 2008. Biotechnology Valuation: An Introductory Guide. Wiley Finance. Chichester,
England ; Hoboken, NJ: John Wiley & Sons. Keeney, Ralph L., and Howard Raiffa. 1976. “Decisions with Multiple Objectives.” Kola, Ismail, and John Landis. 2004. “Can the Pharmaceutical Industry Reduce Attrition Rates?” Nature
Reviews. Drug Discovery 3 (8): 711–15. Krauskopf, Lewis, and Anand Basu. 2011. “Gilead Bets $11 Billion on Hepatitis in Pharmasset Deal.”
Reuters.com, November 21. http://www.reuters.com/article/us-gilead-pharmasset-idUSTRE7AK0XU20111121.
Lechler, Thomas G., and Janice L. Thomas. 2015. “Examining New Product Development Project Termination Decision Quality at the Portfolio Level: Consequences of Dysfunctional Executive Advocacy.” International Journal of Project Management 33 (October): 1452–63. doi:10.1016/j.ijproman.2015.04.001.
Loch, Christoph H., and Kerstin Bode‐Greuel. 2001. “Evaluating Growth Options as Sources of Value for Pharmaceutical Research Projects.” R&D Management 31 (2). http://libproxy.mit.edu/login?url=https://search.ebscohost.com/login.aspx?direct=true&AuthType=cookie,sso,ip,uid&db=bth&AN=4518637&site=eds-live.
Malenko, Andrey. 2016. “Sloan 15.402: Valuation Lecture I.”

66
Martin, Geneviève, Hélène Duez, Christophe Blanquart, Vincent Berezowski, Philippe Poulain, Jean-Charles Fruchart, Jamila Najib-Fruchart, Corine Glineur, and Bart Staels. 2001. “Statin-Induced Inhibition of the Rho-Signaling Pathway Activates PPARα and Induces HDL apoA-I.” Journal of
Clinical Investigation 107 (11): 1423–32. Mekaj, Ymer H., Fetije T. Daci, and Agon Y. Mekaj. 2015. “New Insights into the Mechanisms of Action
of Aspirin and Its Use in the Prevention and Treatment of Arterial and Venous Thromboembolism.” Therapeutics & Clinical Risk Management 11 (September): 1449–56. doi:10.2147/TCRM.S92222.
Miller, G A. 1956. “The Magical Number Seven plus or Minus Two: Some Limits on Our Capacity for Processing Information.” Psychological Review 63 (2): 81–97.
Myerson, R. B. 2005. Probability Models for Economic Decisions. Thomson/Brooke/Cole. https://books.google.com/books?id=xKOFQgAACAAJ.
Nickisch, Klaus J., Joachim M. Greuel, and Kerstin M. Bode-Greuel. 2009. “How Can Pharmaceutical and Biotechnology Companies Maintain a High Profitability?” Journal of Commercial Biotechnology 15 (4): 309–23. doi:10.1057/jcb.2009.3.
O’Reilly, Ruth, and Heather E Elphick. 2013. “Development, Clinical Utility, and Place of Ivacaftor in the Treatment of Cystic Fibrosis.” Drug Design, Development And Therapy 7 (August): 929–37. doi:10.2147/DDDT.S30345.
Pammolli, Fabio, Laura Magazzini, and Massimo Riccaboni. 2011. “The Productivity Crisis in Pharmaceutical R&D.” Nature Reviews Drug Discovery 10 (6): 428.
Pearson, A. W. 1972. “The Use of Ranking Formulae in R & D Projects.” R&D Management 2 (2): 69. Perez-Escobedo, José L., Catherine Azzaro-Pantel, and Luc Pibouleau. 2012. “Multiobjective Strategies
for New Product Development in the Pharmaceutical Industry.” Computers and Chemical
Engineering 37 (January): 278–96. doi:10.1016/j.compchemeng.2011.10.004. Selva, Daniel, Bruce Cameron, and Edward Crawley. 2014. “A Rule-Based Method for Scalable and
Traceable Evaluation of System Architectures.” Research in Engineering Design 25 (4): 325–49. doi:10.1007/s00163-014-0180-x.
Sharpe, Paul, and Tom Keelin. 1998. “How Smithkline Beecham Makes Better Resource-Allocation Decisions.” Harvard Business Review 76 (2): 45–57.
Shu-Hsien Liao. 2005. “Expert System Methodologies and Applications—a Decade Review from 1995 to 2004.” Expert Systems With Applications 28 (January): 93–103. doi:10.1016/j.eswa.2004.08.003.
Silverman, Ed. 2014. “From Riches to Rags: Vertex Discontinues Incivek as Sales Evaporate.” Wall Street
Journal, August 12, online edition. http://blogs.wsj.com/pharmalot/2014/08/12/from-riches-to-rags-vertex-discontinues-incivek-as-sales-evaporate/.
Skrepnek, Grant H., and Jeff J. Sarnowski. 2007. “Decision-Making Associated with Drug Candidates in the Biotechnology Research and Development (R&D) Pipeline.” Journal of Commercial
Biotechnology 13 (2): 99–110. doi:10.1057/palgrave.jcb.3050040. Talias, M.a. 2007. “Optimal Decision Indices for R&D Project Evaluation in the Pharmaceutical Industry:
Pearson Index versus Gittins Index.” European Journal of Operational Research 177 (2): 1105–12. doi:10.1016/j.ejor.2006.01.011.
Thomas, Katie. 2016. “Drug Prices Keep Rising Despite Intense Criticism.” New York Times, April 26, sec. Business Day. http://www.nytimes.com/2016/04/27/business/drug-prices-keep-rising-despite-intense-criticism.html.
Thurston, Deborah. 1992. “A Formal Method for Subjective Design Evaluation with Multiple Attributes.” Research in Engineering Design 3 (2): 105.
Tversky, Amos, and Daniel Kahneman. 1974. “Judgment under Uncertainty: Heuristics and Biases.” Science 185 (September): 1124–31.
“Vertex Pharmaceuticals Incorporated.” 2015. MarketLine, a Progressive Digital Media business. http://libproxy.mit.edu/login?url=https://search.ebscohost.com/login.aspx?direct=true&AuthType=cookie,sso,ip,uid&db=bth&AN=109301830&site=eds-live.
Wehling, Martin. 2009. “Assessing the Translatability of Drug Projects: What Needs to Be Scored to Predict Success?” Nature Reviews Drug Discovery 8 (7): 541–46. doi:10.1038/nrd2898.

67
Yahoo Finance. n.d. “Income Statement, Gilead Sciences (GILD).” http://finance.yahoo.com/q/is?s=GILD&annual.
Yu, Victor L., Lawrence M. Fagan, Sharon M. Wraith, William J. Clancey, A. Carlisle Scott, John Hannigan, Robert L. Blum, Bruce G. Buchanan, and Stanley N. Cohen. 1979. “Antimicrobial Selection by a Computer: A Blinded Evaluation by Infectious Diseases Experts.” JAMA: Journal
of the American Medical Association 242 (12): 1279.