Portfolio Tutorial
119
FACULTY OF ENGINEERING AND SCIENCE UKFF3283 PORTFOLIO MANAGEMENT == Tutorial 1 == 1. Objective: This unit aims to present the issues and strategies needed to function in complex global markets. This includes the investment terms and concepts as well as being able to understand and apply many of the techniques used in analyzing and managing investments. It aims at understanding the steps necessary to group different financial assets into a portfolio to solve the asset allocation problem faced by investors, and portfolio performance evaluation. 2. Learning Outcomes: Topic Learning outcomes Content Topic 1: Introduction to investing Explain the principles of investment and differentiate the different types of investments. Explain the transactions in money markets and capital markets. Describe the investment process and types of investors. Explain the investment process and types of investors. Explain the steps in investing, investing Investments and the investment process Investment vehicles Making investment plans Meeting liquidity needs: Investing in short tem vehicles - 1 -
Transcript of Portfolio Tutorial
FACULTY OF ENGINEERING AND SCIENCEUKFF3283 PORTFOLIO MANAGEMENT
== Tutorial 1 ==
1. Objective:
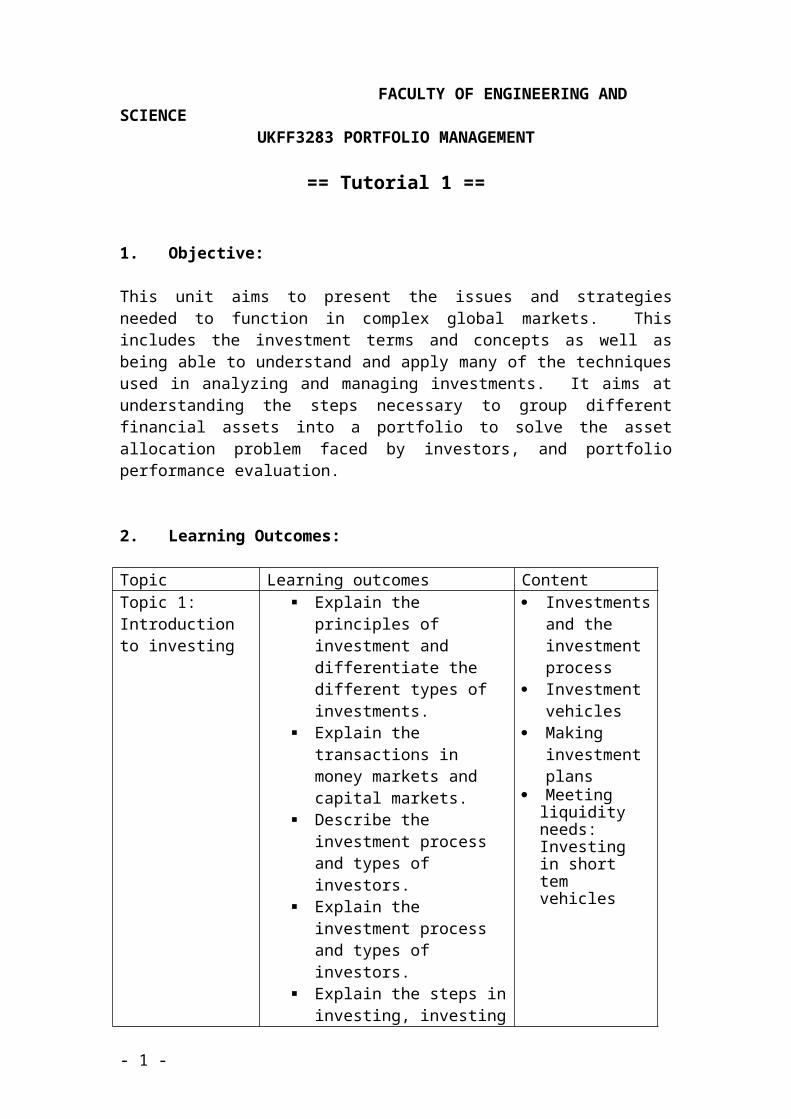
This unit aims to present the issues and strategies needed to function in complex global markets. This includes the investment terms and concepts as well as being able to understand and apply many of the techniques used in analyzing and managing investments. It aims at understanding the steps necessary to group different financial assets into a portfolio to solve the asset allocation problem faced by investors, and portfolio performance evaluation.
2. Learning Outcomes:
Topic Learning outcomes Content Topic 1: Introduction to investing
Explain the principles of investment and differentiate the different types of investments.
Explain the transactions in money markets and capital markets.
Describe the investment process and types of investors.
Explain the investment process and types of investors.
Explain the steps in investing, investing over the life cycle and in different economic environments.
Investments and the investment process
Investment vehicles
Making investment plans
Meeting liquidity needs: Investing in short tem vehicles
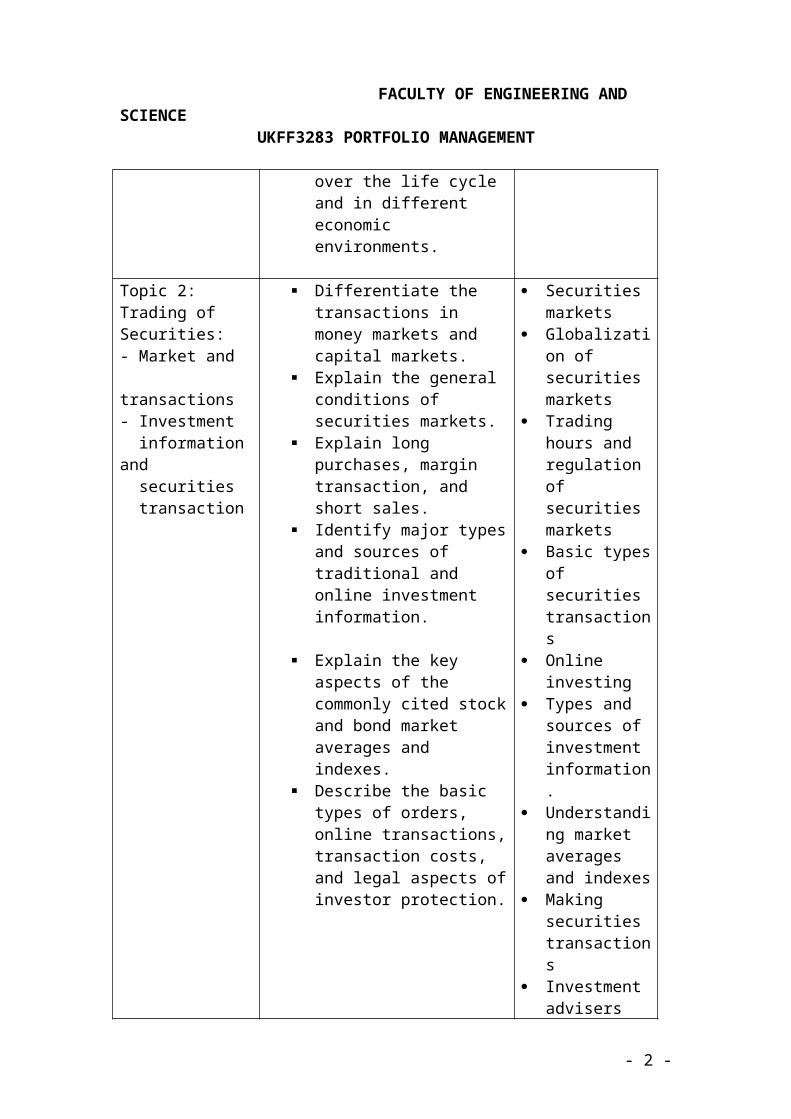
Topic 2: Trading of Securities: - Market and transactions- Investment information and securities transaction
Differentiate the transactions in money markets and capital markets.
Explain the general conditions of securities markets.
Explain long purchases, margin transaction, and short sales.
Identify major types and sources of traditional and online investment information.
Securities markets
Globalization of securities markets
Trading hours and regulation of securities markets
Basic types of securities transactions
Online investing
- 1 -
FACULTY OF ENGINEERING AND SCIENCEUKFF3283 PORTFOLIO MANAGEMENT
Explain the key aspects of the commonly cited stock and bond market averages and indexes.
Describe the basic types of orders, online transactions, transaction costs, and legal aspects of investor protection.
Types and sources of investment information.
Understanding market averages and indexes
Making securities transactions
Investment advisers and investment clubs
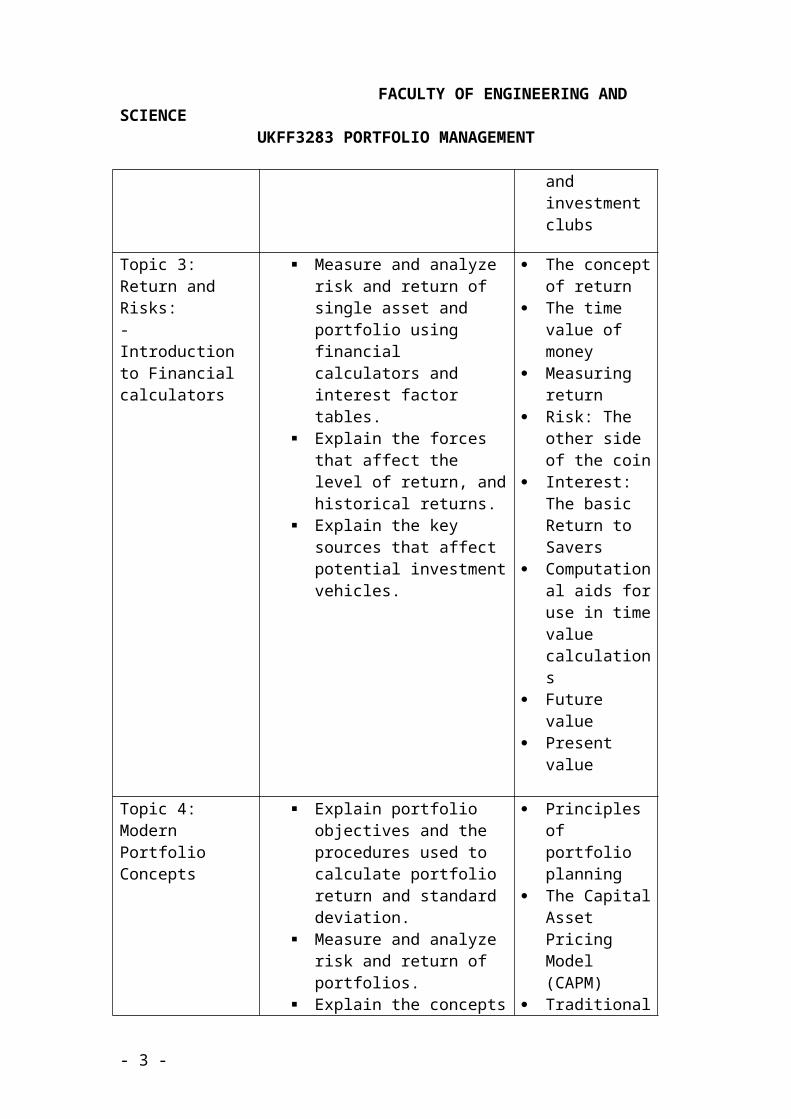
Topic 3: Return and Risks: - Introduction to Financial calculators
Measure and analyze risk and return of single asset and portfolio using financial calculators and interest factor tables.
Explain the forces that affect the level of return, and historical returns.
Explain the key sources that affect potential investment vehicles.
The concept of return
The time value of money
Measuring return
Risk: The other side of the coin
Interest: The basic Return to Savers
Computational aids for use in time value calculations
Future value Present value
Topic 4: Modern Portfolio Concepts
Explain portfolio objectives and the procedures used to calculate portfolio return and standard deviation.
Measure and analyze risk and return of portfolios.
Explain the concepts of correlation and diversification.
Explain and measure required rate of return using capital asset pricing model.
Compare traditional portfolio management with modern portfolio theory.
Principles of portfolio planning
The Capital Asset Pricing Model (CAPM)
Traditional versus modern portfolio management
Constructing a portfolio using asset allocation scheme
- 2 -
FACULTY OF ENGINEERING AND SCIENCEUKFF3283 PORTFOLIO MANAGEMENT
Explain; measure and analyze portfolio betas and the risk-return tradeoff.
Topic 5: Mutual Fund: Professionally Managed Portfolios
Explain the basic features of mutual funds and how diversification and professional management are the cornerstones of the industry.
Explain and differentiate the types of funds available and the variety of investment objectives these funds seek to fulfill.
Analyze the factors to consider when assessing and selecting funds for investment purposes.
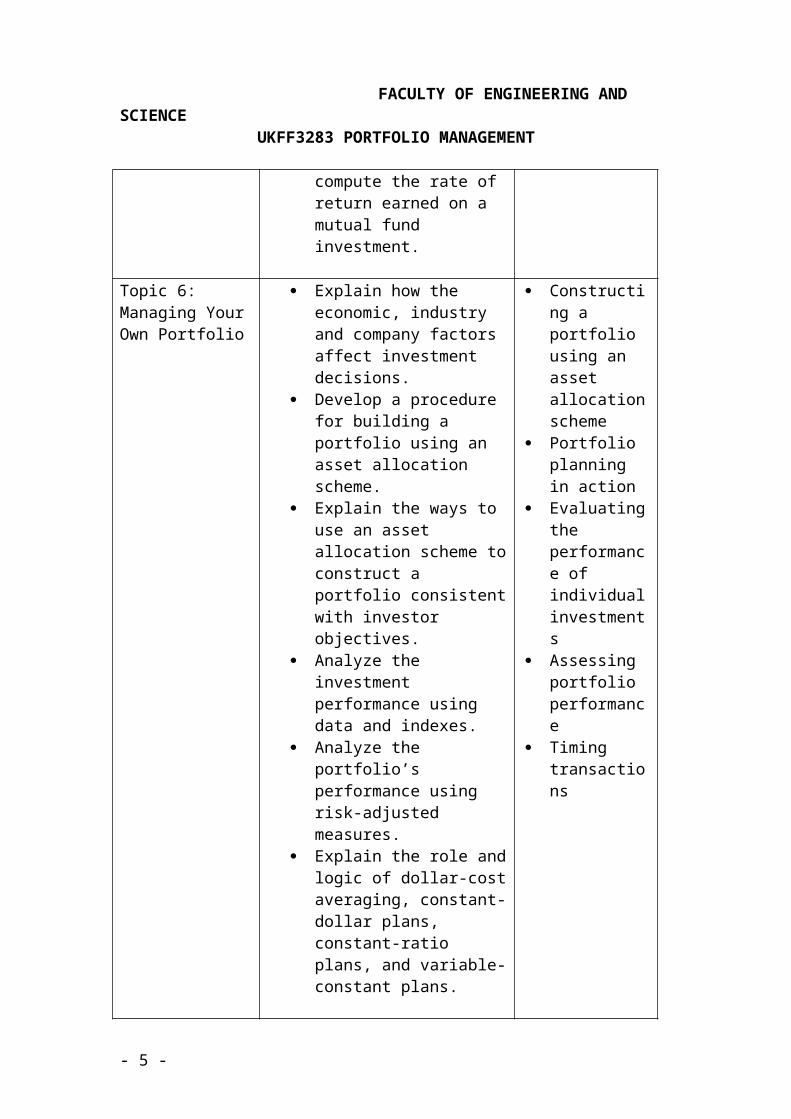
Explain the sources of return and compute the rate of return earned on a mutual fund investment.
The mutual fund concept and phenomenon
Types of funds and services
Investing in mutual funds
Investment company performance
Topic 6: Managing Your Own Portfolio
Explain how the economic, industry and company factors affect investment decisions.
Develop a procedure for building a portfolio using an asset allocation scheme.
Explain the ways to use an asset allocation scheme to construct a portfolio consistent with investor objectives.
Analyze the investment performance using data and indexes.
Analyze the portfolio’s performance using risk-adjusted measures.
Explain the role and logic of dollar-cost averaging, constant-dollar plans, constant-ratio plans, and variable-constant plans.
Constructing a portfolio using an asset allocation scheme
Portfolio planning in action
Evaluating the performance of individual investments
Assessing portfolio performance
Timing transactions
- 3 -

FACULTY OF ENGINEERING AND SCIENCEUKFF3283 PORTFOLIO MANAGEMENT
Topic 7: Investing Common Stock
Explain the basic features of common stocks.
Differentiate the different kinds of common stock values.
Explain common stock dividends; differentiate types of dividends and dividends reinvestment plans.
Compare and contrast various types of common stocks.
Analyze and apply the theories surrounding investment, and be able to make investment decisions.
Explain the security analysis. Ensure financial ratios to
gauge the financial vitality of a company.
What stocks have to offer?
Basic characteristics of common stock
Common stock dividends
Types and uses of common stock
Analyzing and managing common stocks
Security analysis
Economic analysis
Industry analysis
Fundamental analysis
Topic 8: Stock valuation
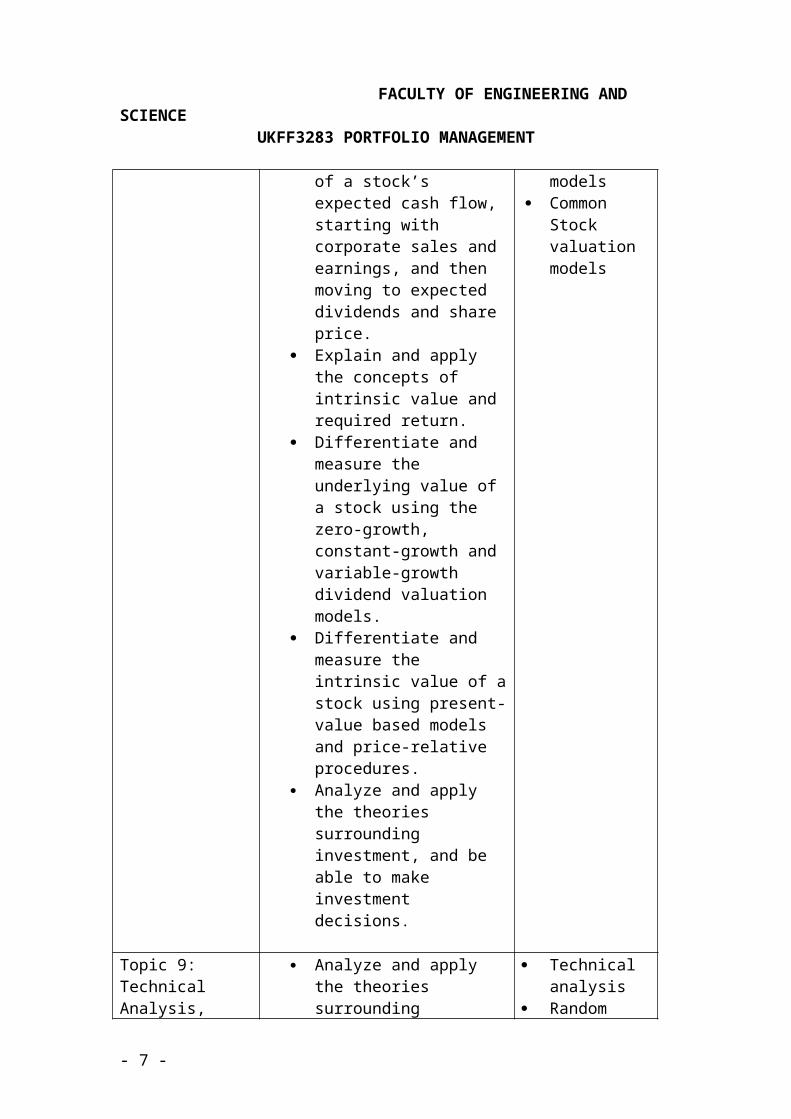
Explain the role that a company’s future plays in the stock valuation process and use various models to value equity instruments.
Develop a forecast of a stock’s expected cash flow, starting with corporate sales and earnings, and then moving to expected dividends and share price.
Explain and apply the concepts of intrinsic value and required return.
Differentiate and measure the underlying value of a stock using the zero-growth, constant-growth and variable-growth dividend valuation models.
Differentiate and measure the intrinsic value of a stock using present-value based models and price-relative procedures.
Analyze and apply the
Valuation: Obtaining a standard of performance
Preferred Stock valuation models
Common Stock valuation models
- 4 -
FACULTY OF ENGINEERING AND SCIENCEUKFF3283 PORTFOLIO MANAGEMENT
theories surrounding investment, and be able to make investment decisions.
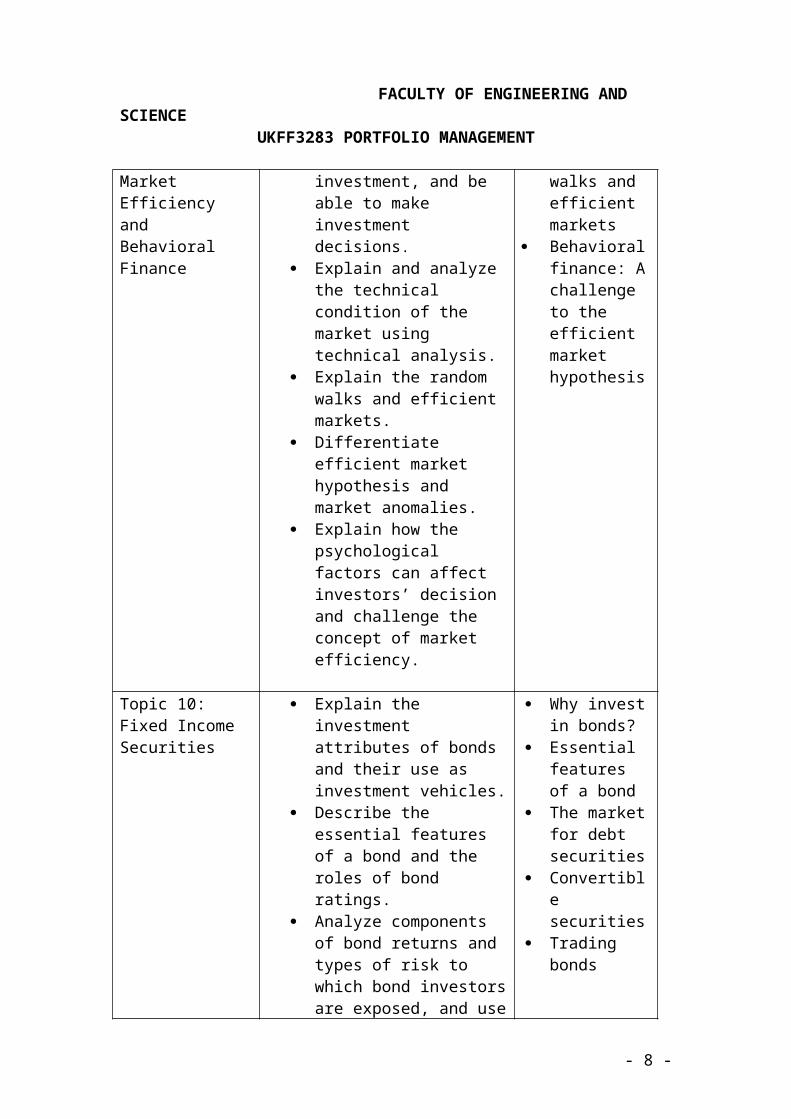
Topic 9: Technical Analysis, Market Efficiency and Behavioral Finance
Analyze and apply the theories surrounding investment, and be able to make investment decisions.
Explain and analyze the technical condition of the market using technical analysis.
Explain the random walks and efficient markets.
Differentiate efficient market hypothesis and market anomalies.
Explain how the psychological factors can affect investors’ decision and challenge the concept of market efficiency.
Technical analysis
Random walks and efficient markets
Behavioral finance: A challenge to the efficient market hypothesis
Topic 10: Fixed Income Securities
Explain the investment attributes of bonds and their use as investment vehicles.
Describe the essential features of a bond and the roles of bond ratings.
Analyze components of bond returns and types of risk to which bond investors are exposed, and use various models to value debt instruments.
Explain how bonds are priced in the market and analyze the volatility of bonds.
Differentiate the types of bonds and kinds of investment objectives these securities can fulfill.
Why invest in bonds?
Essential features of a bond
The market for debt securities
Convertible securities
Trading bonds
Topic 11: Bond Valuation
Explain the behavior of market interest rates, and
The behavior of market
- 5 -

FACULTY OF ENGINEERING AND SCIENCEUKFF3283 PORTFOLIO MANAGEMENT
identify the forces that cause interest rate to change.
Describe the term structure of interest rates, and how yield curves can be used by investors.
Analyze components of bond returns and types of risk to which bond investors are exposed, and use various models to value debt instruments.
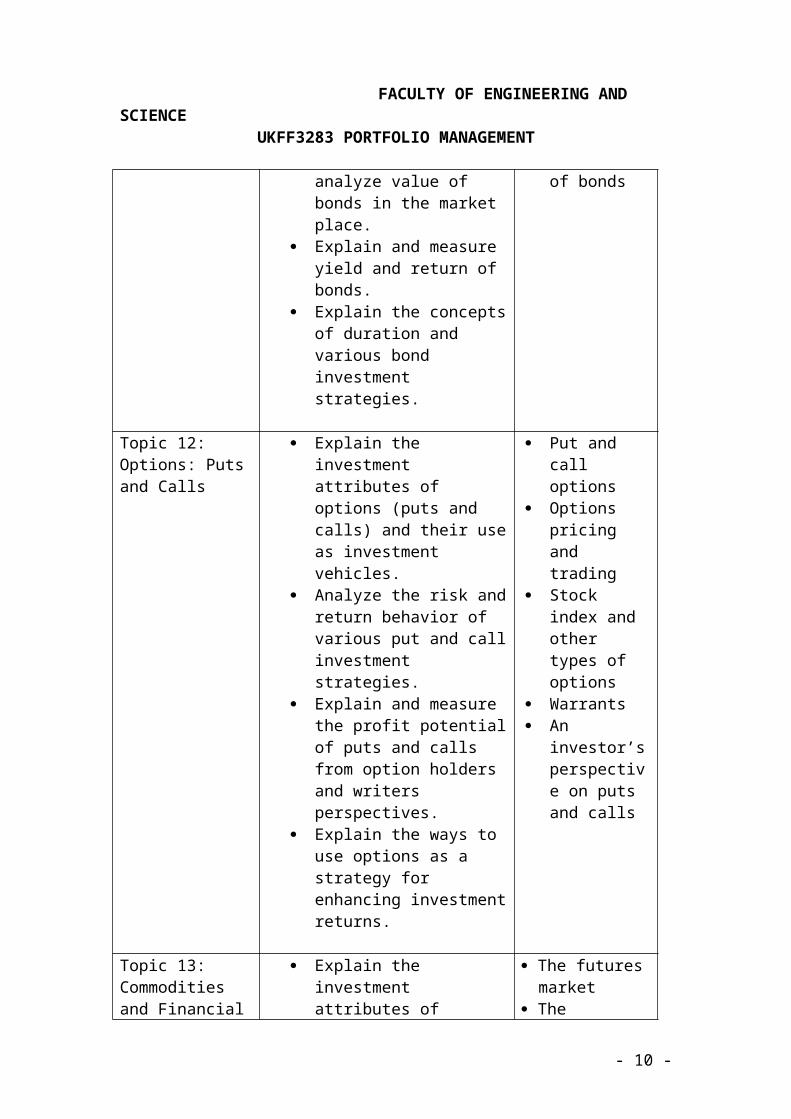
Calculate and analyze value of bonds in the market place.
Explain and measure yield and return of bonds.
Explain the concepts of duration and various bond investment strategies.
interest rates The pricing of
bonds Measures of
yield and return Duration and
immunization Bond
investment strategies
Analysis and management of bonds
Topic 12: Options: Puts and Calls
Explain the investment attributes of options (puts and calls) and their use as investment vehicles.
Analyze the risk and return behavior of various put and call investment strategies.
Explain and measure the profit potential of puts and calls from option holders and writers perspectives.
Explain the ways to use options as a strategy for enhancing investment returns.
Put and call options
Options pricing and trading
Stock index and other types of options
Warrants An investor’s
perspective on puts and calls
Topic 13: Commodities and Financial Futures
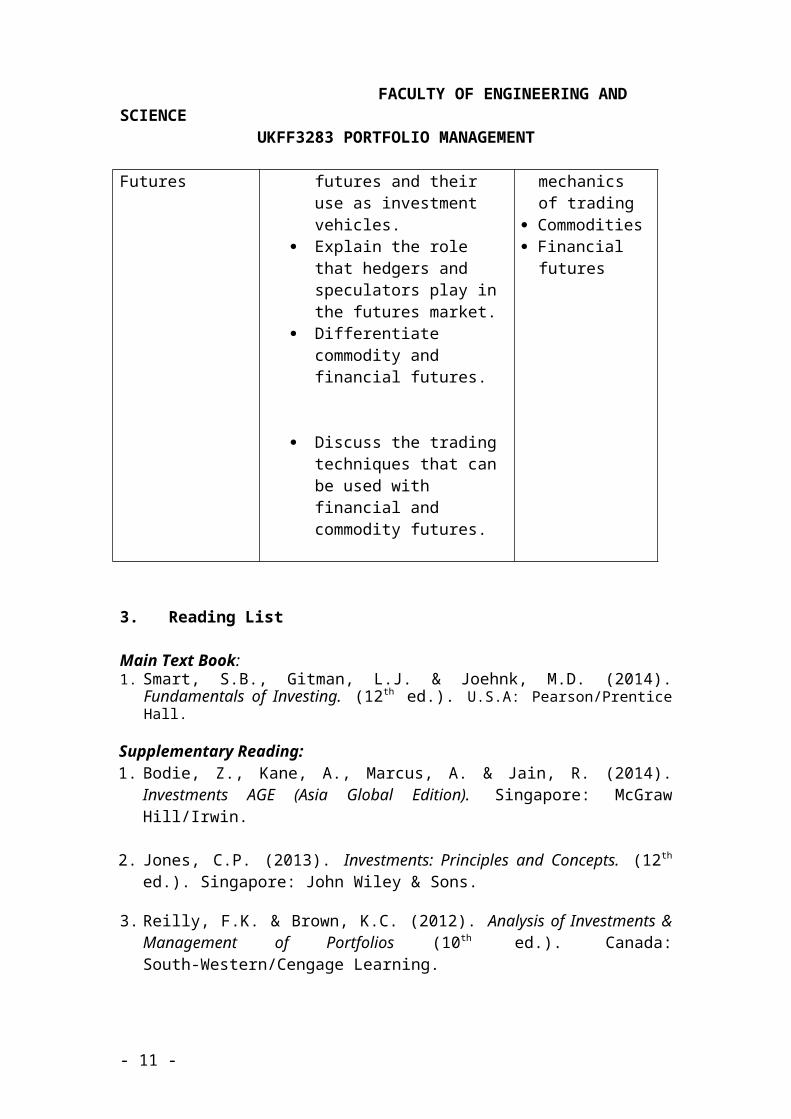
Explain the investment attributes of futures and their use as investment vehicles.
Explain the role that hedgers and speculators play in the futures market.
Differentiate commodity and financial futures.
Discuss the trading techniques that can be used with financial and commodity
The futures market
The mechanics of trading
Commodities Financial futures
- 6 -
FACULTY OF ENGINEERING AND SCIENCEUKFF3283 PORTFOLIO MANAGEMENT
futures.
3. Reading List
Main Text Book:1. Smart, S.B., Gitman, L.J. & Joehnk, M.D. (2014). Fundamentals of Investing.
(12th ed.). U.S.A: Pearson/Prentice Hall.
Supplementary Reading:1. Bodie, Z., Kane, A., Marcus, A. & Jain, R. (2014). Investments AGE (Asia Global
Edition). Singapore: McGraw Hill/Irwin.
2. Jones, C.P. (2013). Investments: Principles and Concepts. (12th ed.). Singapore: John Wiley & Sons.
3. Reilly, F.K. & Brown, K.C. (2012). Analysis of Investments & Management of Portfolios (10th ed.). Canada: South-Western/Cengage Learning.
4. Method of Assessment
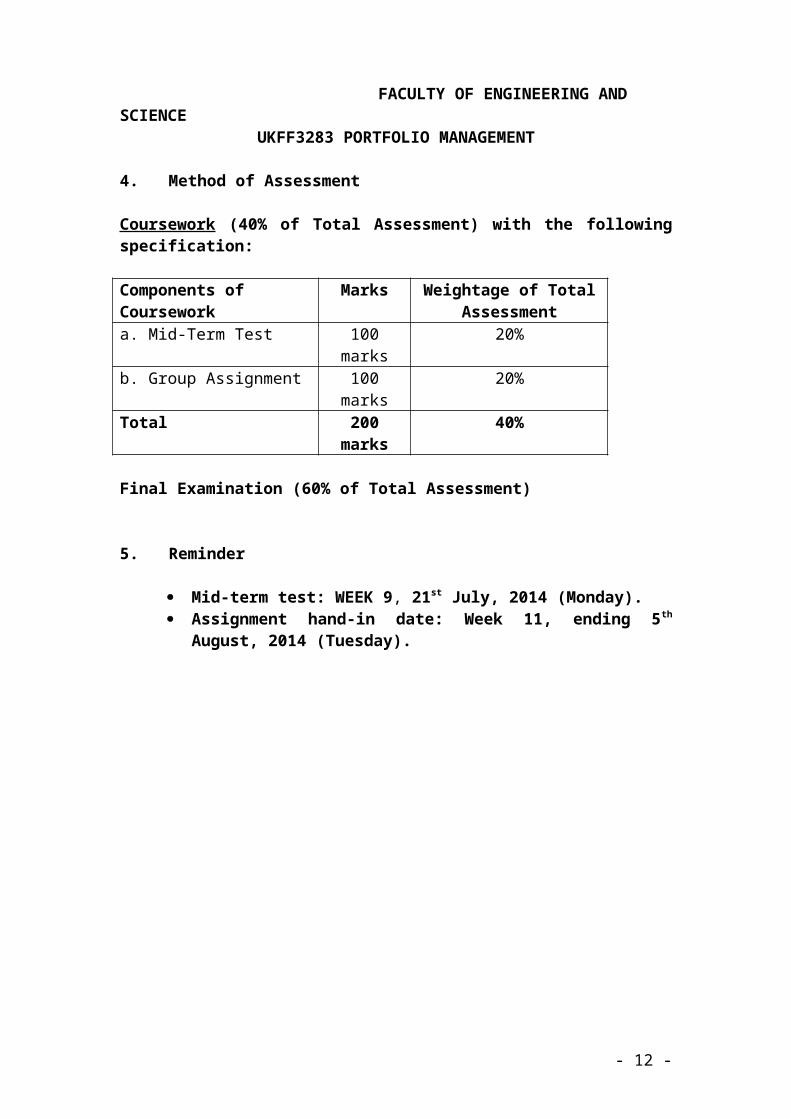
Coursework (40% of Total Assessment) with the following specification:
Components of Coursework
Marks Weightage of Total Assessment
a. Mid-Term Test 100 marks 20%b. Group Assignment 100 marks 20%Total 200 marks 40%
Final Examination (60% of Total Assessment)
5. Reminder
Mid-term test: WEEK 9, 21st July, 2014 (Monday). Assignment hand-in date: Week 11, ending 5th August, 2014
(Tuesday).
- 7 -
FACULTY OF ENGINEERING AND SCIENCEUKFF3283 PORTFOLIO MANAGEMENT
== Tutorial 2 (Topic 1) ==
Learning Outcome: Explain the meaning of investment1.1 Define the term investment, and explain why individuals invest.
Any vehicle into which funds can be placed with the expectation that it will generate positive income and/or that its value will be preserved or increased
Learning Outcome: Identify the factors used to differentiate types of investments
1.2 Differentiate among the following types of investments, and cite an example of each: (a) securities and property investments; (b) direct and indirect investments; (c) debt, equity, and derivative securities; and (d) short-term and long-term investments.a) Securities are stocks, bonds and options, real property are land buildings,
tangible personal property are gold, artwork and antiquesb) Direct means investor directly acquire a claim, eg: stock market, indirect
means investors owns and interest in a professionally managed collection of securities or properties, eg: mutual fund
c) Debt means investor lends funds in exchange for interest income and repayment of loan in future (bonds), equity represents ongoing ownership in a business or property (common stocks), derivative securities is neither debt nor equity, derive value from an underlying asset (options)
d) Short term means mature within one year (money market), long term means maturities of longer than one year ( capital market)
Learning Outcome: Describe the investment process1.5 Describe the structure of the overall investment process. Explain the role
played by financial institutions and financial markets. Suppliers of funds (individuals) deposit money to financial market and financial institution and the money is then borrowed to demanders of funds (government, business)
Learning Outcome: Describe types of investors1.6 Classify the role of (a) government, (b) business, and (c) individuals as net
suppliers or net demanders of funds.a) Demanders of funds, federal, state and local projects & operationsb) Demanders of funds, investments in production of goods and servicesc) Suppliers of funds, some need for loans
Learning Outcome: Describe types of investors1.7 Differentiate between individual investors and institutional investors.
Individual investors: invest for personal finance goalInstitutional investors: paid to manage other people’s money, trade large volume of securities, include banks, life insurance companies, mutual funds and pension funds
Learning Outcome: Describe the steps in investing
- 8 -

FACULTY OF ENGINEERING AND SCIENCEUKFF3283 PORTFOLIO MANAGEMENT
1.11 What should an investor first establish before developing and executing an investment program? Briefly describe each of the seven steps involved in investing.1) Meeting Investment prerequisites2) Establishing investment goals3) Adopting an investment plan4) Evaluating investment vehicles5) Selecting suitable investments6) Constructing a diversified portfolio7) Managing the portfolio
Learning Outcome: Describe the steps in investing1.12 What are four common investment goals?
1) accumulating retirement funds2) enhancing current income3) Saving for major expenditures4) Sheltering income from taxes
Learning Outcome: Discuss investing over the life cycle1.14 Describe the differing investment philosophies typically applied during
each of the following stages of an investor’s life cycle.a) Youth (ages 20 to 45)
Growth-oriented investment, higher potential growth; higher potential risk, stress capital gains over current income. Common stocks, options or futures
b) Middle age (ages 45 to 60)Family demands & responsibilities become important (edu expenses, retirement savings), move towards less risky investments to preserve capital, transition to higher-quality securities with lower risk. Low-risk growth and income stocks, preferred stocks, convertible stocks, high grade bonds
c) Retirement years (age 60 on)Preservation of capital becomes primary goal, highly conservative investment portfolio, current income needed to supplement retirement income. Low-risk income stocks and mutual funds, government bonds, quality corporate bonds, bank certificates of deposit
Learning Outcome: Identify the short-term investment vehicles1.16 What makes an asset liquid? Why hold liquid assets? Would 100 shares of
IBM stock be considered a liquid investment? Explain.The ability of the asset to be converted into cash quickly with little or no loss in value. For emergency cash reserve or to save for a specific short-term financial goal. No, because it might take time to be sold on the stock market and its value is not stable, depending on market
- 9 -
FACULTY OF ENGINEERING AND SCIENCEUKFF3283 PORTFOLIO MANAGEMENT
Learning Outcome: Discuss investing over the life cycleQ1.1 Assume that you are 35 years old, are married with two young children,
are renting a condo, and have an annual income of $90,000. Use the following questions to guide your preparation of a rough investment plan consistent with these facts.a) What are your key investment goals?b) How might your stage in the life cycle affect the types of risk you
might take?
Case Problem 1.1 Investments or Golf?
Judd Read and Judi Todd, senior accounting majors at a large Midwestern university, have been good friends since high school. Each has already found a job that will begin after graduation. Judd has accepted a position as an internal auditor in a medium-sized manufacturing firm. Judi will be working for one of the major public accounting firms. Each is looking forward to the challenge of a new career and to the prospect of achieving success both professionally and financially.
Judd and Judi are preparing to register for their final semester. Each has one free elective to select. Judd is considering taking a golf course offered by the physical education department, which he says will help him socialize in his business career. Judi is planning to take a basic investments course. Judi has been trying to convince Judd to take investments instead of golf. Judd believes he doesn’t need to take investments, because he already knows what common stock is. He believes that whenever he has accumulated excess funds, he can invest in the stock of a company that is doing well. Judi argues that there is much more to it than simply choosing common stock. She feels that exposure to the field of investments would be more beneficial than learning how to play golf.
QuestionsLearning Outcome: Describe the investment process
a. Explain to Judd the structure of the investment process and the economic importance of investing
Learning Outcome: Discuss the principal types of investment vehiclesb. List and discuss the other types of investment vehicles with which Judd is
apparently unfamiliar.Learning Outcome: Discuss the meaning of investment
c. Assuming that Judd already gets plenty of exercise, what arguments would you give to convince Judd to take investments rather than golf?
- 10 -
FACULTY OF ENGINEERING AND SCIENCEUKFF3283 PORTFOLIO MANAGEMENT
== Tutorial 3 (Topic 2) ==
Learning Outcome: Differentiate different securities markets2.1 Differentiate between each of the following pairs of terms
a) Money market and capital marketShort-term securities are traded in the money market (T-bills and bankers’ acceptance)Long-term securities are traded in capital markets. (stocks & bonds)
b) Primary market and secondary marketA new security is issued in the primary market (IPO)After it has been issued, it is sell and buy in the secondary market. (BURSA)
Learning Outcome: Explain long purchases, margin transaction, and short sales.
2.11 What is a long purchase? What expectation underlies such a purchase? What is margin trading, and what is the key reason why investors sometimes use it as part of a long purchase?When an investor purchases a security in the hope that it can be sold later for a profit, the investor is making a long purchase. The long purchase, is the difference between the purchase price and the sale price. (to get current income and capital gain)Margin trading involves buying securities in part with borrowed funds. Therefore, investors can use margin to reduce their money and use borrowed money to make a long purchase. When the investment gain money, they will use the profit to pay off the loan.
Learning Outcome: Explain long purchases, margin transaction, and short sales.
2.12 How does margin trading magnify profits and losses? What are the key advantages and disadvantages of margin trading?When buying on margin, the investor puts up part of the required capital. The investor’s broker then lends the rest of the money required to make the transaction. Financial leverage is created when the investor purchases stocks or other securities on margin.Through leverage, an investor can increase the size of his or her total investment, or purchase the same investment with less of his or her own funds. Either way, the investor increases the potential rate or return. Both profits and losses are magnified using leverage.
Advantages: Margin trading provides the investor leverage and the ability to magnify potential profits. It can also be used to improve current.Disadvantages: Greater leverage comes greater risk. High interest rates on the debit balance, which mean that return is lower
Learning Outcome: Explain long purchases, margin transaction, and short sales.
- 11 -
FACULTY OF ENGINEERING AND SCIENCEUKFF3283 PORTFOLIO MANAGEMENT
2.14 What is the primary motive for short selling? Describe the basic short-sale procedure. Why must the short seller make an initial equity deposit? An investor attempting to profit by selling short intends to “sell high and buy low”. The investor borrows shares and sell them, hoping to buy them back later and return to the lender. Short sales are regulated by the SEC and can be executed only after a transaction where the price of the security rises. Equity capital must be put up by a short seller; the amount is defined by an initial margin requirement that designates the amount of cash the investor must deposit with a broker. The margin and proceeds of the short sale provide the broker with assurance that the securities can be repurchased at a later date, even if their price increases.
Learning Outcome: Explain long purchases, margin transaction, and short sales.
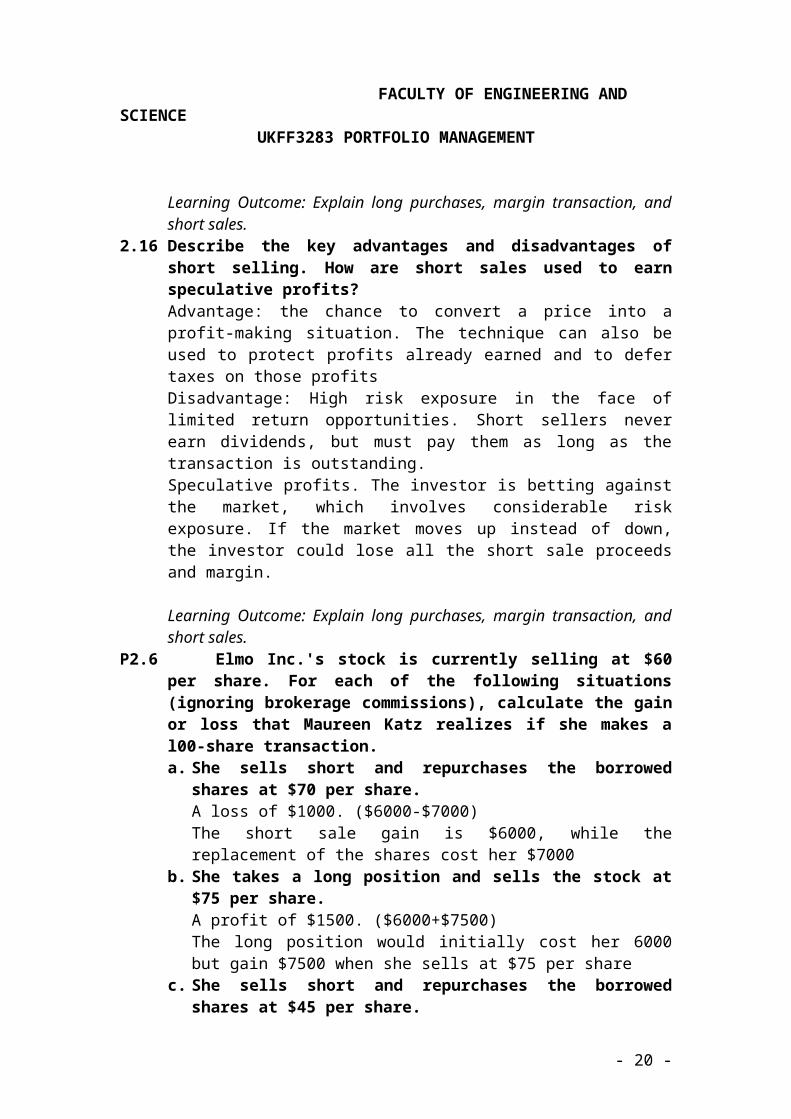
2.16 Describe the key advantages and disadvantages of short selling. How are short sales used to earn speculative profits?Advantage: the chance to convert a price into a profit-making situation. The technique can also be used to protect profits already earned and to defer taxes on those profitsDisadvantage: High risk exposure in the face of limited return opportunities. Short sellers never earn dividends, but must pay them as long as the transaction is outstanding.Speculative profits. The investor is betting against the market, which involves considerable risk exposure. If the market moves up instead of down, the investor could lose all the short sale proceeds and margin.
Learning Outcome: Explain long purchases, margin transaction, and short sales.
P2.6 Elmo Inc.'s stock is currently selling at $60 per share. For each of the following situations (ignoring brokerage commissions), calculate the gain or loss that Maureen Katz realizes if she makes a l00-share transaction.a. She sells short and repurchases the borrowed shares at $70 per share.
A loss of $1000. ($6000-$7000)The short sale gain is $6000, while the replacement of the shares cost her $7000
b. She takes a long position and sells the stock at $75 per share.A profit of $1500. ($6000+$7500)The long position would initially cost her 6000 but gain $7500 when she sells at $75 per share
c. She sells short and repurchases the borrowed shares at $45 per share.A profit of $1500. ($6000-$4500)The short sale brings in $6000, while return of the shares to the owner costs only $4500
d. She takes a long position and sells the stock at $60 per share.A breakeven situation. The long position costs $6000 and the sale of the stock brings in $6000, thereby providing neither a profit nor a loss
- 12 -
FACULTY OF ENGINEERING AND SCIENCEUKFF3283 PORTFOLIO MANAGEMENT
Learning Outcome: Explain long purchases, margin transaction, and short sales.
P2.10 James purchased 100 shares of Can’tWin.com for $50 per share, using as little of his own money as he could. His broker has a 50% initial margin requirement and 30% maintenance margin requirement. This price of the stock falls to $30 per share. What does James need to do?
James needs to cover a margin call.
Margin = (value of securities – debit balance)/value of securities
Debit balance = amount borrowed in the transaction
= value of securities – (margin x value of securities)
His new margin is 16.7% = ($3000-$2500)/$3000, below the 30% maintenance requirement
Value of securities = $30 x 100 = $3000
Old debit balance = $5000 – (0.5x$5000) = $2500
New debit balance = $3000 – (0.3x$3000) = $2100
In order to get back to the maintenance margin requirement of 30%, James must top up the difference between the old and new debit balance which is $400
Learning Outcome: Explain long purchases, margin transaction, and short sales.
P2.17 An investor short sells 100 shares of a stock for $20 per share. The initial margin is 50%, and the maintenance margin is 30%. The price of the stock falls to $12 per share. What is the margin, and will there be a margin call?Margin = (value of securities – debit balance / value of securities
= Account equity / calue of securities at purchaseValue of securities at purchase = $1200Value of securities at sale = $2000
Account equity = margin deposit of $1000 + net proceeds from the short sale= $1000 + ($2000-$1200)= $1800
The new margin 1800/1200 = 150%Since the margin of 150% is far above the maintenance margin of 30%, there is no
margin call.
Learning Outcome: Explain long purchases, margin transaction, and short sales.Case Problem 2.1 Dara’s Dilemma: What to Buy?
Dara Simmons, a 40-year-old financial analyst and divorced mother of two teenage children, considers herself a savvy investor. She has increased her investment portfolio considerably over the past 5 years. Although she has been
- 13 -

FACULTY OF ENGINEERING AND SCIENCEUKFF3283 PORTFOLIO MANAGEMENT
fairly conservative with her investments, she now feels more confident in her investment knowledge and would like to branch out into some new areas that could bring higher returns. She has between $20,000 and $25,000 to invest.
Attracted to the hot market for technology stocks, Dara was interested in purchasing a tech IPO stock and identified "NewestHighTech.com," a company that make sophisticated computer chips for wireless Internet connections, as a likely prospect. The 1-year-old company had received some favorable press when it got early-stage financing and again when its chip was accepted by a major cell phone manufacturer.
Dara also was considering an investment in 400 shares of Casinos International common stock, currently selling for $54 per share. After a discussion with a friend who is an economist with a major commercial bank, Dara believes that the long-running bull market is due to cool off and that economic activity will slow down. With the aid of he stockbroker, Dara researches Casinos International's current financial situation and finds that the future success of the company may hinge on the outcome of pending court proceedings on the firm's application to open a new floating casino on a nearby river. If the permit is granted, it seems likely that the firm's stock will experience a rapid increase (in value, regardless of economic conditions. On the other hand, if the company fails to get the permit, the falling stock price will make it a good candidate for a short sale.
Dara felt that the following alternatives were open to her:Alternative 1: Invest $20,000 in NewestHighTech.com when it goes public.Alternative 2: Buy Casinos International now at $54 per share and follow the company closely.Alternative 3: Sell Casinos short at $54 in anticipation that the company's fortunes will change for the worse.Alternative 4: Wait to see what happens with the casino permit and then decide whether to buy or short the Casinos International stock.
Questions
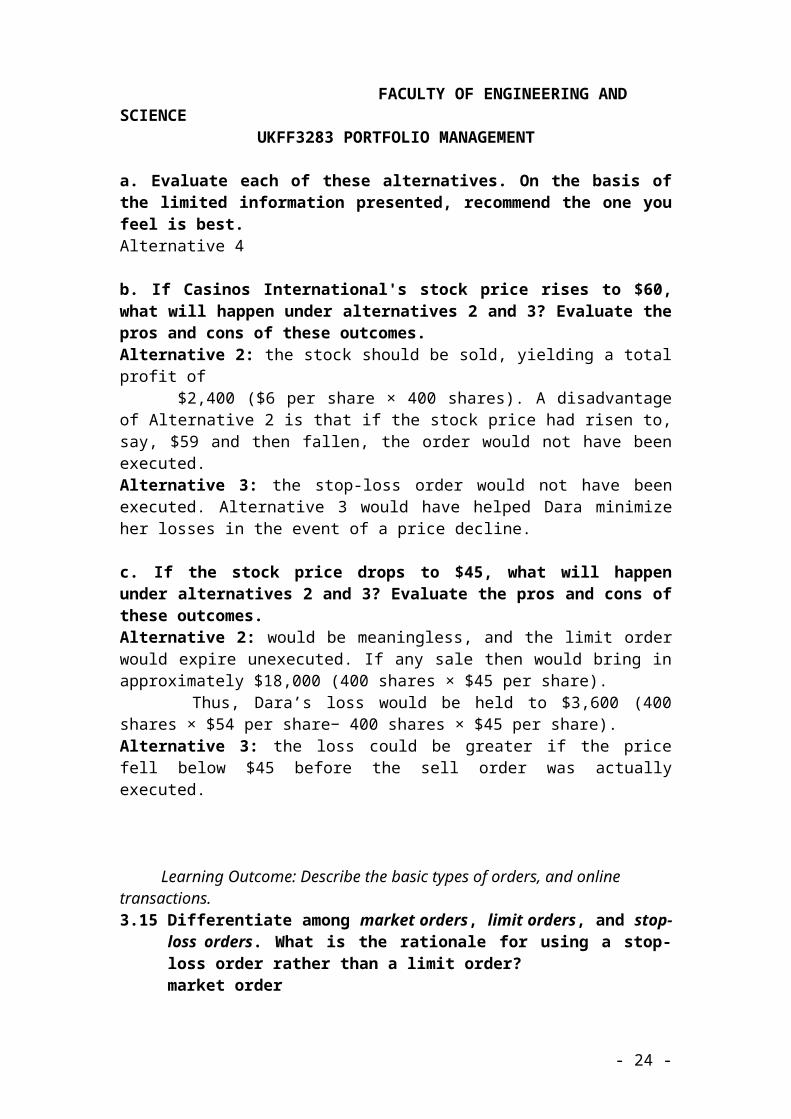
a. Evaluate each of these alternatives. On the basis of the limited information presented, recommend the one you feel is best.Alternative 4
b. If Casinos International's stock price rises to $60, what will happen under alternatives 2 and 3? Evaluate the pros and cons of these outcomes.Alternative 2: the stock should be sold, yielding a total profit of $2,400 ($6 per share × 400 shares). A disadvantage of Alternative 2 is that if the stock price had risen to, say, $59 and then fallen, the order would not have been executed.
- 14 -

FACULTY OF ENGINEERING AND SCIENCEUKFF3283 PORTFOLIO MANAGEMENT
Alternative 3: the stop-loss order would not have been executed. Alternative 3 would have helped Dara minimize her losses in the event of a price decline.
c. If the stock price drops to $45, what will happen under alternatives 2 and 3? Evaluate the pros and cons of these outcomes.Alternative 2: would be meaningless, and the limit order would expire unexecuted. If any sale then would bring in approximately $18,000 (400 shares × $45 per share). Thus, Dara’s loss would be held to $3,600 (400 shares × $54 per share− 400 shares × $45 per share). Alternative 3: the loss could be greater if the price fell below $45 before the sell order was actually executed.
Learning Outcome: Describe the basic types of orders, and online transactions.3.15 Differentiate among market orders, limit orders, and stop-loss orders. What
is the rationale for using a stop-loss order rather than a limit order?market order
an order to buy or sell a security at the best price available when order is placed
fastest way to make transactions. limit order
an order to buy stock at or below or to sell stock at or above a specified price If price limits are not met, order will not be executed
stop-loss order “Suspended” order is placed to sell a stock if price reaches or falls below a
specific level used to protect investors from stock price decline Once activated, becomes a market order The stop-loss order gives them the opportunity to sell the stock when
the price declines to the stop price, thereby reducing their potential losses
Learning Outcome: Describe the basic types of orders, and online transactions.3.16 What is day trading, and why is it risky? How can you avoid problems as
an online trader?Day Trader:an investor who buys and sells stocks quickly throughout the day in hopes of making quick profits, it is risky because it often used with margin trading and high brokerage commissions due to frequent tradingslide 2-32
• Know how to place and confirm orders• Verify stock ticker symbols• Use limit orders• Check and recheck orders—you pay for typos• Don’t get carried away
• Follow a strategy• Don’t churn
- 15 -

FACULTY OF ENGINEERING AND SCIENCEUKFF3283 PORTFOLIO MANAGEMENT
• Avoid or limit margin orders• Open accounts with two brokers• Double-check orders for accuracy after completion
Learning Outcome: Describe the basic types of orders, and online transactions.P3.6 Imagine that you have placed a limit order to buy 100 shares of Sallisaw
Tool at a price of $38, though the stock is currently selling for $41. Discuss the consequences, if any, of each of the following.a. The stock price drops to $39 per share 2 months before cancellation of
the limit order.The limit order will be executed only if the stock price falls to $38 or less than $38, thus, the order will not be executed.
b. The stock price drops to $38 per share.The order will be executed, your broker will buy 100 shares of Sallisaw Tool stock with $38 per share, total costs is $3800
c. The minimum stock price achieved before cancellation of the limit order was $38.50. When the limit order was canceled, the stock was selling for $47.50 per share.Since the stock price is more than $38, the order will not be executed. If you buy the stock at $41 per share instead of placing the order limit, you can now sell it at $47.50 per share, earning $6.5 per share with total profit of $650
Learning Outcome: Describe the basic types of orders, and online transactions.P3.7 If you place a stop-loss order to sell at $23 on a stock currently selling for
$26.50 per share, what is likely to be the minimum loss you will experience on 50 shares if the stock price rapidly declines to $20.50 per share? Explain. What if you had placed a stop-limit order to sell at $23, and the stock price tumbled to $20.50?Minimum loss = $3.5/share, total minimum loss = $175 ($3.5*50)When the stock price falls to $23, the stop-loss order is converted to market order to sell at best price available at that time. For stop limit order, if the stock price drop to $20.50, the loss would be $6 per share or in total $300.
Learning Outcome: Describe the basic types of orders, and online transactions.P3.8 You sell 100 shares of a stock short for $40 per share. You want to limit
your loss on this transaction to no more than $500. What order should you place?Stop-loss order to buy shares at $45/share. (limit your loss not more than $5/share)
- 16 -

FACULTY OF ENGINEERING AND SCIENCEUKFF3283 PORTFOLIO MANAGEMENT
Learning Outcome: Describe the basic types of orders, and online transactions.P3.9 You have been researching a stock that you like, which is currently
trading at $50 per share. You would like to buy the stock if it were a little less expensive - say, $47 per share. You believe that the stock price will go to $70 by year-end, and then level off or decline. You decide to place a limit order to buy 100 shares of the stock at $47, and a limit order to sell it at $70. It turns out that you were right about the direction of the stock price, and it goes straight to $75. What is your current position? Since the stock did not fall to the limit order buy price, so it will not be executed, you are not buying it. However, you sold it at $70 per share. Since the stock is currently selling for $75, you loss $5/share, total loss = $500
- 17 -
FACULTY OF ENGINEERING AND SCIENCEUKFF3283 PORTFOLIO MANAGEMENT
== Tutorial 4 (Topic 3) ==
Learning Outcome: Review the concept of return and its components.4.1 Explain what is meant by the return on an investment. Differentiate
between the two components of return – current income and capital gains (or losses).Return is the level of profit from an investment or the reward of investing. Total return is the sum of the current income and the capital gain (or loss) earned on an investment over a specified period of time.Current income is cash or near cash that is received as a result of owning an investment.Capital gains is the difference between the proceeds from the sale of an investment and its original purchase price
Learning Outcome: Define a satisfactory investment.4.3 What is a satisfactory investment? When the present value of benefits
exceeds the cost of an investment, what is true of the rate of return earned by the investor relative to the discount rate?Satisfactory investment is one for which the present value of benefits equals or exceed the present value of its costs. When PV inflow > PV outflow, net PV is positive.This IRR > discount rateHence acceptable (satisfactory) investment.
Learning Outcome: Explain the concept of yield.4.6 Define yield (internal rate of return). When is it appropriate to use yield
rather than the HPR to measure the return on an investment?IRR determines the compound annual rate of return earned on an investment held for longer than one year. For long term investment.
Learning Outcome: Discuss the key sources of risk.4.9 Define risk. Explain what we mean by the risk-return tradeoff. What
happens to the required return as risk increases? Explain.Risk is the chance that the actual return from an investment may differ from what is expected. Risk-return tradeoff is the relationship between risk and return, in which investments with more risk should provide higher return and vice versa. Return should be higher as risk increases.
Learning Outcome: Discuss the key sources of risk.4.10 Define and briefly discuss each of the following sources of risk.
a) Business riskDegree of uncertainty associated with an investment’s earnings and the investment’s ability to pay the returns owed to investors. Types of investments affected are common stocks and preferred stocks. Examples: decline in company profits or market share
b) Financial riskDegree of uncertainty of payment resulting from a firm’s mix of debt and equity; the larger the proportion of debt financing, the greater the risk.
- 18 -
FACULTY OF ENGINEERING AND SCIENCEUKFF3283 PORTFOLIO MANAGEMENT
Types of investments affected are common stocks and corporate bonds. Example: company can’t get additional loans for growth or to fund operations
c) Purchasing power riskChance that changing price levels (inflation or deflation) will adversely affect investment returns. Types of investments affected are bonds (fixed income) and fixed deposits. Example: Movie that was RM8 last year is RM9 this year
d) Interest rate riskChance that changes in interest rates will adversely affect a security’s value. Types of investments affected are bonds(fixed income) and preferred stocks. Example: market value of existing bonds decreases as market interest rates increase.
e) Liquidity riskRisk of not being able to liquidate an investment conveniently and at a reasonable price. Affects all types of investments. Example: Decrease in value of insurance company stock after a major hurricane.
f) Market riskRisk of decline in investment returns because of market factors independent of the given investment. Affects all types of investments. Example: changes in economic conditions.
g) Event riskUnexpected event that has a significant and unusually immediate effect on the underlying value of an investment. Affects all types of investments. Example: decrease in value of real estate after a major earthquake
Learning Outcome: Review the concept of return and its components.P4.4 Assume you purchased a bond for $9,500. The bond pays $300 interest
every 6 months. You sell the bond after 18 months for $10,000. Calculate the following:a. Current income.
$300x3 = $900b. Capital gain or loss.
$10000-$9500 = $500c. Total return in dollars and as a percentage of the original investment.
Total return in dollars = dividend income + capital gain / beginning investment= (900+500)/9500 = 14.74%
- 19 -
FACULTY OF ENGINEERING AND SCIENCEUKFF3283 PORTFOLIO MANAGEMENT
Learning Outcome: Calculation and application of holding period returnP4.10 You are considering two investment alternatives. The first is a stock that
pays quarterly dividends of $0.50 per share and is trading at $25 per share; you expect to sell the stock in 6 months for $27. The second is a stock that pays quarterly dividends of $0.60 per share and is trading at $27 per share; you expect to sell the stock in 1 year for $30. Which stock will provide the better annualized holding period return?Investment 1: Dividend = $0.50 * 2 = $1Capital gain = 27-25 = $2Holding period return = (1+2) / 25 = 0.12Annualized holding period return = 0.12 * 2 = 0.24 = 24%Investment 2:Dividend = $0.60 * 4 = $2.40Capital gain = 30-27 = $3Holding period return = (2.40+3) / 27 = 0.2Annualized holding period return = 0.2 * 1 = 0.20 = 20%
Therefore, the first option is better because it provides better annualized holding period return.
Learning Outcome: Calculation of yieldP4.14 Your friend asks you to invest $10,000 in a business venture. Based on
your estimates, you would receive nothing for 4 years, at the end of years 5 you would receive interest on the investment compounded annually at 8%, and at the end of year 6 you would receive $14,500. If your estimates are correct, what would be the yield on this investment?Interest = 10000 (1+0.08 - 10000 = 4693.28IRR = 12.02%
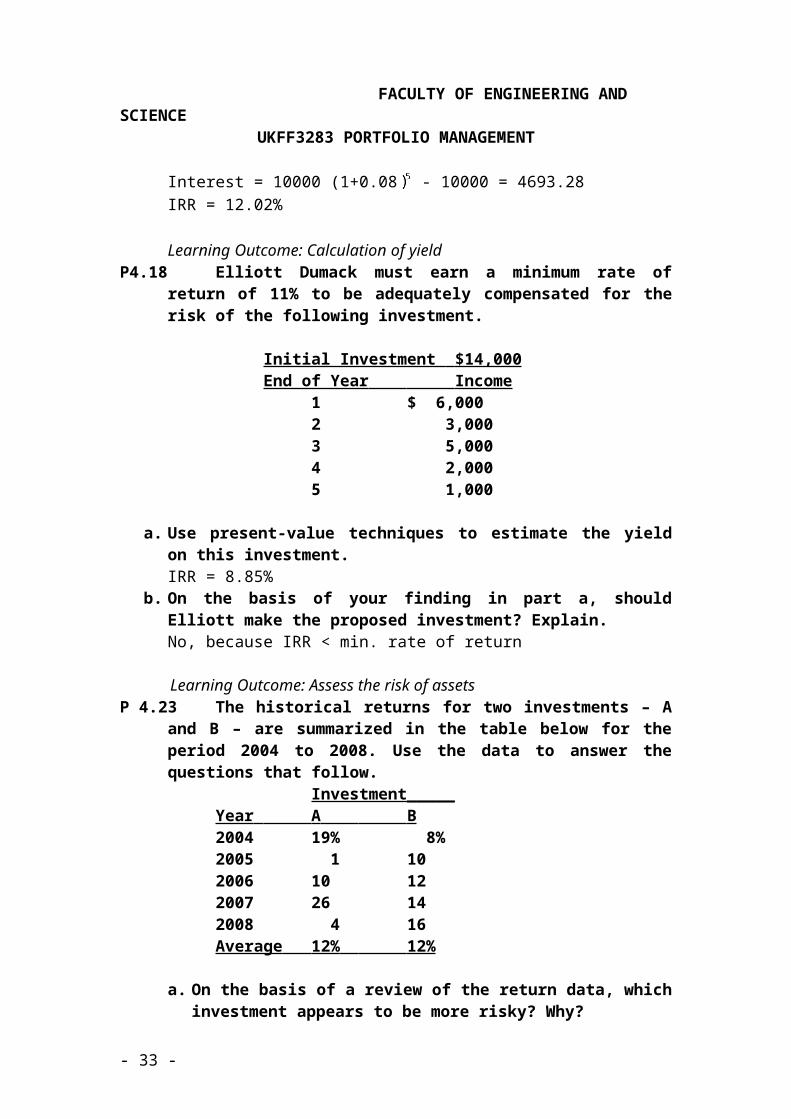
Learning Outcome: Calculation of yieldP4.18 Elliott Dumack must earn a minimum rate of return of 11% to be
adequately compensated for the risk of the following investment.
Initial Investment $14,000 End of Year Income
1 $ 6,0002 3,0003 5,0004 2,0005 1,000
a. Use present-value techniques to estimate the yield on this investment.IRR = 8.85%
b. On the basis of your finding in part a, should Elliott make the proposed investment? Explain.No, because IRR < min. rate of return
- 20 -

FACULTY OF ENGINEERING AND SCIENCEUKFF3283 PORTFOLIO MANAGEMENT
Learning Outcome: Assess the risk of assetsP 4.23 The historical returns for two investments – A and B – are summarized in
the table below for the period 2004 to 2008. Use the data to answer the questions that follow.
Investment_____Year A B 2004 19% 8%2005 1 102006 10 122007 26 142008 4 16Average 12% 12%
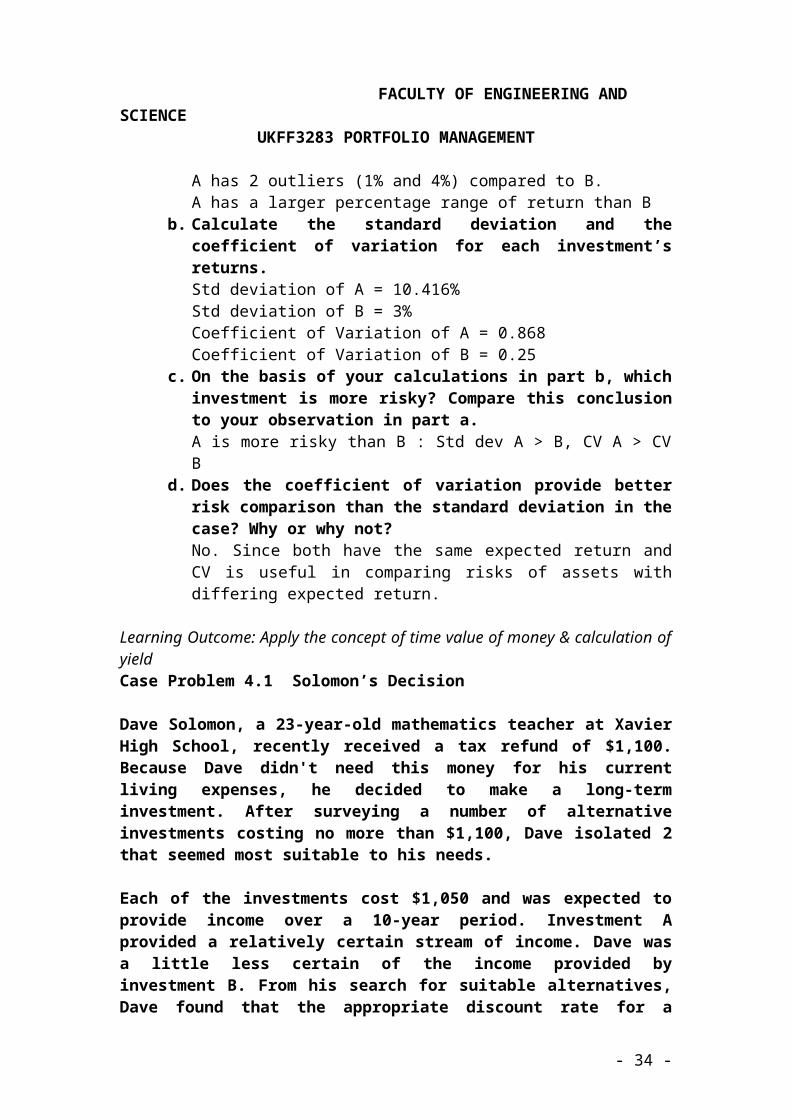
a. On the basis of a review of the return data, which investment appears to be more risky? Why?A has 2 outliers (1% and 4%) compared to B.A has a larger percentage range of return than B
b. Calculate the standard deviation and the coefficient of variation for each investment’s returns.Std deviation of A = 10.416%Std deviation of B = 3%Coefficient of Variation of A = 0.868Coefficient of Variation of B = 0.25
c. On the basis of your calculations in part b, which investment is more risky? Compare this conclusion to your observation in part a.A is more risky than B : Std dev A > B, CV A > CV B
d. Does the coefficient of variation provide better risk comparison than the standard deviation in the case? Why or why not?No. Since both have the same expected return and CV is useful in comparing risks of assets with differing expected return.
Learning Outcome: Apply the concept of time value of money & calculation of yieldCase Problem 4.1 Solomon’s Decision
Dave Solomon, a 23-year-old mathematics teacher at Xavier High School, recently received a tax refund of $1,100. Because Dave didn't need this money for his current living expenses, he decided to make a long-term investment. After surveying a number of alternative investments costing no more than $1,100, Dave isolated 2 that seemed most suitable to his needs.
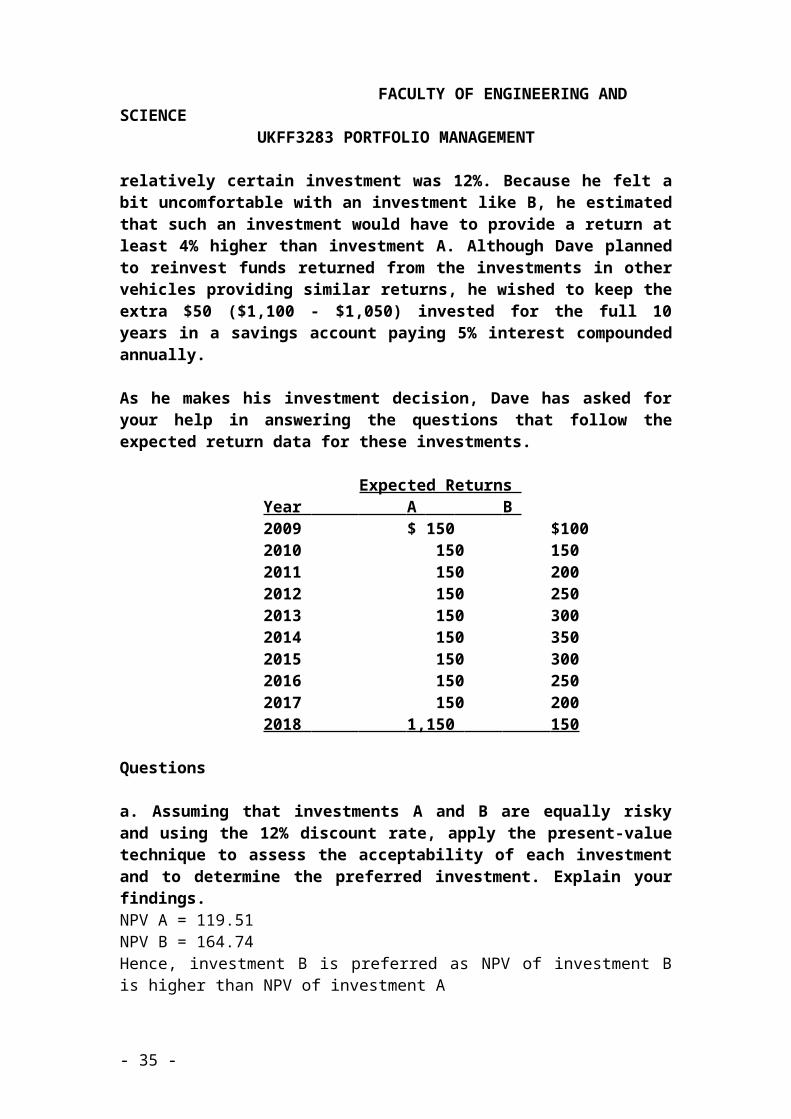
Each of the investments cost $1,050 and was expected to provide income over a 10-year period. Investment A provided a relatively certain stream of income. Dave was a little less certain of the income provided by investment B. From his search for suitable alternatives, Dave found that the appropriate discount rate for a relatively certain investment was 12%. Because he felt a bit uncomfortable with an investment like B, he estimated that such an investment would have to provide a return at least 4% higher than investment A. Although Dave planned to reinvest funds returned from the investments in other vehicles providing
- 21 -

FACULTY OF ENGINEERING AND SCIENCEUKFF3283 PORTFOLIO MANAGEMENT
similar returns, he wished to keep the extra $50 ($1,100 - $1,050) invested for the full 10 years in a savings account paying 5% interest compounded annually.
As he makes his investment decision, Dave has asked for your help in answering the questions that follow the expected return data for these investments.
Expected Returns Year A B 2009 $ 150 $100 2010 150 150 2011 150 200 2012 150 250 2013 150 300 2014 150 350 2015 150 300 2016 150 250 2017 150 200 2018 1,150 150
Questions
a. Assuming that investments A and B are equally risky and using the 12% discount rate, apply the present-value technique to assess the acceptability of each investment and to determine the preferred investment. Explain your findings.NPV A = 119.51NPV B = 164.74Hence, investment B is preferred as NPV of investment B is higher than NPV of investment Ab. Recognizing that investment B is more risky than investment A, reassess the 2 alternatives, adding the 4% risk premium to the 12% discount rate for investment A and therefore applying a 16% discount rate to investment B. Compare your findings relative to acceptability and preference to those found for question a.NPV A = -98.33NPV B = -30.63Hence, both investments are not acceptable, never invest in projects which has negative NPV.
c. From your findings in questions a and b, indicate whether the yield for investment A is above or below 12% and whether that for investment B is above or below 16%.Explain.Since the investment A is acceptable at 12%, its yield should be above 12%. Since the investment B is acceptable at 12%, its yield should be above 12%.However, the yield of investment should be below 16% because the PV of benefit is less than the cost. Its yield should be at 15.31.
- 22 -

FACULTY OF ENGINEERING AND SCIENCEUKFF3283 PORTFOLIO MANAGEMENT
d. Use the present-value technique to estimate the yield on each investment. Compare your findings and contrast them with your response to question c.Investment A = 14.04Investment B = 15.31For A, yield > 12% = 14.04%For B, yield < 16% = 15.31%
e. From the information given, which, if either, of the two investments would you recommend that Dave make? Explain your answer.Investment A. This is because the IRR of investment is 14.04 which is higher than the expected 12% rate.
f. Indicate to Dave how much money the extra $50 will have grown to by the end of 2018, assuming he makes no withdrawals from the savings account.
- 23 -
=
FACULTY OF ENGINEERING AND SCIENCEUKFF3283 PORTFOLIO MANAGEMENT
== Tutorial 5 (Topic 4) ==
Learning Outcome: Discuss the concepts of correlation and diversification5.3 What is correlation, and why is it important with respect to asset returns?
Describe the characteristics of returns that are (a) positively correlated, (b) negatively correlated, and (c) uncorrelated. Differentiate between perfect positive correlation and perfect negative correlation.Correlation is a statistical measure of the relationship between two series of numbers representing data. It combines two assets to reduce overall risk in our portfolio.a) Positively correlated – both assets returns move in same directionb) Negatively correlated – both assets returns move in opposite directionc) Uncorrelated – two series that lack any relationship and have a correlation
coefficient of nearly zero
Perfect positive correlation – two positively correlated series having a correlation coefficient of +1
Perfect negative correlation – two negatively correlated series having a correlation coefficient of -1
Learning Outcome: Discuss the concepts of correlation and diversification5.4 What is diversification? How does the diversification of risk affect the
risk of the portfolio compared to the risk of the individual assets it contains?Diversification is a process of risk reduction achieved by including in the
portfolio a variety of vehicles having returns that are less than perfectly positive correlated with each other. The goal is to reduce overall risk in a portfolio.It allows investor to reduce the risk by combining negatively correlated assets so that the risk of the portfolio is less than the risk of the individual assets.
Learning Outcome: Describe the components of risk and the use of beta to measure risk
5.7 Briefly define and give examples of each of the following components of total risk. Which is the relevant risk, and why?(a) Diversifiable risk (b) Nondiversifiable riska) Diversifiable risk is the results from uncontrollable or random events that are firm-specific. It can be eliminated through diversification. Examples are labor strikes and lawsuits.b) Nondiversifiable risk is also known as relevant risk/market risk. It is attributable to forces that affect all similar investments. It cannot be eliminated through diversification. Examples are war, inflation, political events. It is considered the only relevant risk because diversifiable (unsystematic) risk can be removed by creating a portfolio of assets which are not perfectly positively correlated or through diversification.
Learning Outcome: Describe the components of risk and the use of beta to measure risk
- 24 -

FACULTY OF ENGINEERING AND SCIENCEUKFF3283 PORTFOLIO MANAGEMENT
5.8 Explain what is meant by beta. What is the relevant risk measured by beta? What is the market return? How is the interpretation of beta related to the market return?Beta is a measure of systematic risk. It indicates how the price of a security responds to market forces and compares historical return of an investment to the market return. The higher the beta, the riskier the security. The relevant risk measured by beta is the nondiversifiable risk of an investment since the investor can eliminate the unsystematic risk by holding a diversified portfolio of securities.Market return is measured by the average return of all stocks.Beta for the overall market is the benchmark beta and is 1.0. The positive or negative sign on a beta indicates whether the stock’s return changes in the same direction as the general market or opposite direction. Stocks with betas greater than 1.0 are more risky than the overall market and vice versa.
Learning Outcome: Review the traditional & modern approaches to portfolio management
5.12 Describe traditional portfolio management. Give three reasons why traditional portfolio managers like to invest in well-established companies.Traditional portfolio management emphasizes “balancing” the portfolio using a wide variety of stocks or bonds. The three reasons are:-a) perceived as less riskyb) stocks are more liquid and available in large quantitiesc) familiarity provides higher “comfort” levels for investors
Learning Outcome: Review the traditional & modern approaches to portfolio management
5.13 What is modern portfolio theory (MPT)? What is the feasible or attainable set of all possible portfolios? How is it derived for a given group of investment vehicles?MPT emphasizes statistical measures to develop a portfolio plan. It focuses on expected returns, standard deviation of returns and correlation between returns. It combines securities with negative or low positive correlation to reduce risk through diversification.The feasible or attainable set of all possible portfolios refers to the risk-return combinations achieved with all possible portfolios. It is derived by calculating the return and risk of all possible portfolios and then plotting them on a set of risk-return axes.
- 25 -

FACULTY OF ENGINEERING AND SCIENCEUKFF3283 PORTFOLIO MANAGEMENT
Learning Outcome: Describe risk-return tradeoff of portfolio5.14 What is efficient frontier? How is it related to the attainable set of all
possible portfolios? How can it be used with an investor’s utility function to find the optimal portfolio?Efficient frontier is the site of all efficient portfolios (with the best risk-return tradeoff). All portfolios on the efficient frontier are preferable to the others in the feasible or attainable set. Investor’s utility function is plotted on the graph with the feasible or attainable set of portfolios – indicate the investor’s optimal portfolio (curve meets the efficient frontier). This represents the highest level of satisfaction for that investor
Learning Outcome: Calculate portfolio return and standard deviation, correlation
P5.3 Assume you are considering a portfolio containing two assets, Land M. Asset L will represent 40% of the dollar value of the portfolio, and asset M will account for the other 60%. The expected returns over the next 6 years, 2009-2014, for each of these assets are summarized in the following table.
Expected Return (%) Year Asset L Asset M 2009 14 20 2010 14 18 2011 16 16 2012 17 14 2013 17 12 2014 19 10
- 26 -

FACULTY OF ENGINEERING AND SCIENCEUKFF3283 PORTFOLIO MANAGEMENT
a. Calculate the expected portfolio return, rp, for each of the 6 years.
Expected Return (%) Portfolio return calculation Expected portfolio return (r
Year Asset L Asset M
2009 14 20 (0.4x14%)+(0.6x20%)= 17.6%
2010 14 18 (0.4x14%)+(0.6x18%)= 16.4%
2011 16 16 (0.4x16%)+(0.6x16%)= 16%
2012 17 14 (0.4x17%)+(0.6x14%)= 15.2%
2013 17 12 (0.4x17%)+(0.6x12%)= 14%
2014 19 10 (0.4x19%)+(0.6x10%)= 13.6%
b. Calculate the average expected portfolio return, rp, over the 6-year period.
The average expected portfolio return, over the 6-year period
= = 15.47%
c. Calculate the standard deviation of expected portfolio returns, sp over the 6-year period.
d. How would you characterize the correlation of returns of the two assets L and M? Expected Return (%)Year Asset L Asset M Asset L Asset M Asset L * Asset M
( )( )
2009 14 20 -2.17 5.0 -10.85
- 27 -
=
=
=1.51%

FACULTY OF ENGINEERING AND SCIENCEUKFF3283 PORTFOLIO MANAGEMENT
2010 14 18 -2.17 3.0 -6.512011 16 16 -0.17 1.0 -0.172012 17 14 0.83 -1.0 -0.832013 17 12 0.83 -3.0 -2.492014 19 10 2.83 -5.0 -14.15Mean 16.17 15.0 Sum = -35
Year Asset L Asset M
( (
2009 -2.17 4.71 5.0 25.02010 -2.17 4.71 3.0 9.02011 -0.17 0.03 1.0 1.02012 0.83 0.69 -1.0 1.02013 0.83 0.69 -3.0 9.02014 2.83 8.01 -5.0 25.0
Sum=18.84 Sum=70.0
The correlation of returns of the two assets L and M are negatively correlated.
e. Discuss any benefits of diversification achieved through creation of the portfolio.By combining two assets L and M that have a negative correlation will be reducing overall risk more effectively compare invest in high positive correlation.
- 28 -
=
=
= 3.74
Correlation, =
=
= 3.74
Correlation, =

FACULTY OF ENGINEERING AND SCIENCEUKFF3283 PORTFOLIO MANAGEMENT
Learning Outcome: Use of beta to measure riskP5.9 Imagine you wish to estimate the betas for 2 investments, A and B. You
have gathered the following return data for the market and for each of the investments over the past 10 years, 1999-2008.
Historical Returns Investment Year Market A B 1999 6% 11% 16% 2000 2 8 11 2001 -13 - 4 -10 2002 - 4 3 3 2003 - 8 0 - 3 2004 16 19 30 2005 10 14 22 2006 15 18 29 2007 8 12 19 2008 13 17 26
a. On a set of market return (x-axis)-investment return (y-axis) axes, use the data to draw the characteristic lines for investments A and B on the same set of axes.
b. Use the characteristic lines from part a to estimate the betas for investments A and B.
c. Use the betas found in part b to comment on the relative risks of investments A and B.Investment B is more risky than A because of higher beta value. For example, when the market went down 10%, a stock with beta of A will decrease only 7.9% but a stock with beta B will decrease by 13.8%
- 29 -
FACULTY OF ENGINEERING AND SCIENCEUKFF3283 PORTFOLIO MANAGEMENT
Learning Outcome: Use of beta to measure riskP5.10 You are evaluating 2 possible stock investments, Buyme Co. and Getit
Corp. Buyme Co. has an expected return of 14%, and a beta of 1. Getit Corp. has an expected return of 14%, and a beta of 1.2. Based only on this data, which stock should you buy and why?I would buy the stock of Byeme Co., because it has same expected return as Getit Corp. but with lesser risk.
Learning Outcome: Use of beta to measure riskP5.12 A security has a beta of 1.20. Is this security more or less risky than the
market? Explain. Assess the impact on the required return of this security in each of the following cases.The security is more risky than the market because it has a beta of 1.20 which is higher than the beta of market which is 1.00a. The market return increases by 15%.Change in security return = Beta X change in market return1.20 * 15% = 18% increaseb. The market return decreases by 8%.1.20 * (-8%) = -9.6% decreasec. The market return remains unchanged.1.20 * 0% = 0% no change
Learning Outcome: Use of beta to measure riskP5.13 Assume the betas for securities A, B, and C are as shown here.
Security Beta A 1.40 B 0.80C -0.90
a. Calculate the change in return for each security if the market experiences an increase in its rate of return of 13.2 % over the next period.Security A return = 1.40 * 13.2% = 18.48%Security B return = 0.80 * 13.2% = 10.56%Security C return = -0.90 * 13.2% = -11.88%b. Calculate the change in return for each security if the market experiences a decrease in its rate of return of 10.8% over the next period.Security A return = 1.40 * (-10.8%) = -15.12%Security B return = 0.80 * (-10.8%) = -8.64%Security C return = -0.90 * (-10.8%) = 9.72%
- 30 -

FACULTY OF ENGINEERING AND SCIENCEUKFF3283 PORTFOLIO MANAGEMENT
c. Rank and discuss the relative risk of each security on the basis of your findings. Which security might perform best during an economic downturn? Explain.Through the beta values and changes of security A’s return in the market return, it shows that security A is most risky of all. Security C moves in the opposite direction from the market in a defensive manner. While security B is the least responsive in the market which makes it in the category of least risky.The market can probably be assumed that the market return will decrease during the economic downturn. In this situation, Security C will outperform others. If security C did not perform as expected, the least responsive will be the best which is security B.
Learning Outcome: Calculate portfolio betasP5.23 Rose Berry is attempting to evaluate 2 possible portfolios consisting of the
same 5 asset but held in different proportions. She is particularly interested in using beta to compare the risk of the portfolios and, in this regard, has gathered the following data:
Portfolio Weights (%) Asset Asset Beta Portfolio A Portfolio B 1 1.30 10 30 2 0.70 30 10 3 1.25 10 20 4 1.10 10 20 5 0.90 40 20
Total 100 100
a. Calculate the betas for portfolios A and B.Beta of portfolio A = 1.30(0.1) + 0.70(0.3) + 1.25(0.1) + 1.10(0.1) + 0.90(0.4) = 0.935Beta of portfolio B = 1.30(0.3) + 0.70(0.1) + 1.25(0.2) + 1.10(0.2) + 0.90(0.2)= 1.11b. Compare the risk of each portfolio to the market as well as to each other. Which portfolio is more risky?The risk of Portfolio A is slightly less than the market while the risk of Portfolio B is more than the market. Therefore, Portfolio B is more risky
- 31 -
FACULTY OF ENGINEERING AND SCIENCEUKFF3283 PORTFOLIO MANAGEMENT
== Tutorial 6 (Topic 5) ==
Learning Outcome: Describe the basic features of mutual funds12.1 What is a mutual fund? Discuss the mutual fund concept, including the
importance of diversification and professional management.A mutual fund invests in a diversified portfolio of securities and issues shares in the portfolio to individual investors; mutual funds represent ownership in a managed portfolio of securities. The mutual fund concept, therefore, revolves around diversification. Diversification, which reduces the overall risk borne by the investor, is available through a mutual fund. This, coupled with the fact that mutual funds have professional management, which frees the individual investor from managing his own portfolio, makes mutual funds attractive to individuals.
Learning Outcome: Describe the basic features of mutual funds12.3 Briefly describe how a mutual fund is organized. Who are the key players
in a typical mutual fund organization?Mutual funds are frequently open-ended investment companies; investors in mutual funds are essentially buying a small piece of a large, well-diversified portfolio of securities. A mutual fund is a financial services organization that receives money from its shareholders and invests those funds in a portfolio of securities. The investors in a given mutual fund are all part-owners of that portfolio. Individual mutual funds are created by management companies, like Fidelity, Dreyfus, and Vanguard. They also run the funds’ daily operations and usually serve as the investment advisor. The investment advisor buys and sells securities and otherwise oversees the fund’s portfolio. This is normally carried out by: the money manager, who actually runs the portfolio; security analysts, who look for viable investment candidates; and traders, who attempt to trade large blocks of securities at the best possible price. In addition, there are fund distributors, who actually buy and sell the fund shares; custodians, who take physical possession of the fund’s securities and other assets; and the transfer agent, who keeps track of fund shareholders. (Note: All these participants are part of open-end mutual funds; however, closed-end investment companies do not require a distributor. Shares in these funds trade in the open markets.)
Learning Outcome: Discuss the various types investment companies12.4 Define each of the following:
a) Open-end investment companiesAn open-end investment company is a mutual fund in which investors actually buy their shares from and sell them back to the mutual fund itself. There is no limit on the number of shares an open-end fund can issue, and this is by far the most common type of mutual fund.
b) Closed-end investment companiesA closed-end investment company is a fund that operates with a fixed number of outstanding shares and does not regularly issue new shares of stock. These funds, which are few in number relative to open-end funds, operate with a fixed capital structure and trade in the stock market—most are listed on the NYSE
c) Exchange-traded fundsAn exchange-traded fund (ETF) is a type of open-end investment company that trades as a listed security on one of the stock exchanges.
- 32 -
FACULTY OF ENGINEERING AND SCIENCEUKFF3283 PORTFOLIO MANAGEMENT
d) Real estate investment trustsA real estate investment trust (REIT) is a type of closed-end investment company that invests money in mortgages and various types of real estate investments. REITs allow investors to receive both the capital appreciation and current income from real estate ownership without having to manage the property.
e) Hedge fundsLike mutual funds, hedge funds sell shares (or participation) units in a professionally managed portfolio of securities. However, hedge funds are private partnerships that tend to limit their clientele to rich individuals. The manager is a general partner, while the investors are limited partners. Hedge funds have very limited reporting requirements and are generally unregulated. Some hedge funds attempt to limit the downside risk through employment of options and futures, while others invest in any opportunity that has the potential of a positive return.
Learning Outcome: Discuss the various types of funds12.7 Briefly describe each of the following types of mutual funds:
a) Aggressive growth fundsAggressive growth funds are highly speculative funds that concentrate on obtaining large capital gains. These funds tend to be small and their portfolios consist of speculative common stocks. Returns on these funds generally move with the market, but in larger increments: when the market’s up, these funds do great, but when the market falls, they do really poorly.
b) Equity-income fundsEquity-income funds emphasize current income by investing primarily in high yielding common stocks. In addition to high-grade common stocks, these funds also invest in convertible securities, preferred stocks and even bonds. They like securities that provide high current yields, but also consider potential price appreciation over the longer haul. These funds are generally viewed as a fairly low risk way of investing in stocks.
c) Growth-and-income fundsGrowth-and-income funds seek a balanced return made up of both current income and long-term capital gains, with the greatest emphasis placed on growth of capital. Unlike balanced funds, growth and income funds have 80–90 percent of their capital in common stocks). They tend to invest in growth-oriented blue chips (for their capital gains) and high-yield common stocks (for their current income due to high dividends).
d) Bond fundsBond funds come in all shapes and colors (from government bond funds to high yield [junk] corporate bond funds) and they all have one thing in common: they invest principally (or exclusively) in some type(s) of fixed-income security. While current income is the primary objective of these funds, capital gains is not ignored altogether. Today, there’s a full range of bond funds, ranging from the very conservative to the very risky.
- 33 -
FACULTY OF ENGINEERING AND SCIENCEUKFF3283 PORTFOLIO MANAGEMENT
e) Sector fundsSector funds are mutual funds that concentrate their holdings in one or more industries that make up a target sector. For instance, a health care sector fund may hold drug companies, medical suppliers, biotech companies, and hospital management companies. They are not widely diversified and therefore are riskier than diversified funds.
f) Socially responsible fundsSocially responsible funds are mutual funds that actively and directly incorporate ethics and morality into the investment decision. These funds will consider only socially responsible companies for inclusion in their portfolios. For example, these funds generally will not invest in companies that derive revenues from tobacco, alcohol, or gambling; companies that are weapons contractors; or that operate nuclear power plants.
Learning Outcome: Discuss the various types of fundsQ12.3 For each pair of funds listed below, select the one that is likely to be the
less risky. Briefly explain your answer.
a) Growth versus growth-and-income fundsGrowth versus growth and income funds: Growth funds have more risk due to greater investment for capital gain and therefore newer growing companies.
b) Equity-income versus high-grade corporate bond fundsEquity-income versus high-grade corporate bond funds: Bonds are less risky since they are rated investment quality as compared to ordinary common stock dividends that are declared after interest income to bondholders is paid.
c) Balanced versus sector fundsBalanced versus sector funds: Sector funds lack diversification and therefore may contain higher nonsystematic risk than a balanced more diversified fund.
d) Global versus aggressive growth fundsGlobal versus aggressive growth funds: This depends on what type of global fund is used. Global funds may also have aggressive growth targets but have political risk not associated with domestic aggressive growth funds.
e) Intermediate-term bonds versus high-yield municipal bond fundsIntermediate-term bonds versus high-yield municipal bond funds: High-yield municipal bonds usually have less risk since they are associated with cities and municipalities. However, these governmental units can have high risk depending on their credit ratings.
Case Problem 12.1 Reverend Billy Bob Ponders Mutual Funds
Reverend Billy Bob is the minister of a church in the San Diego area. He is married, has one young child, and earns a "modest income." Because religious organizations are not notorious for their generous retirement programs, the reverend has decided he should do some investing on his own. He would like to set up a program that enables him to supplement the church's retirement program and at the same time provide some funds for his child's college education (which is still some 12 years away). He is not out to break any
- 34 -
FACULTY OF ENGINEERING AND SCIENCEUKFF3283 PORTFOLIO MANAGEMENT
investment records but wants some backup to provide for the long-run needs of his family.
Although he has a modest income, Billy Bob believes that with careful planning, he can probably invest about $250 a quarter (and, with luck, increase this amount over time). He currently has about $15,000 in a savings account that he would be willing to use to begin this program. In view of his investment objectives, he is not interested in taking a lot of risk. Because his knowledge of investments extends to savings accounts, Series EE savings bonds, and a little bit about mutual funds, he approaches you for some investment advice.
Questions
Learning Outcome: Discuss the variety of investment objectivesa. In light of Reverend Billy Bob's long-term investment goals, do you think mutual funds are an appropriate investment vehicle for him?Yes, since Reverend Billy Bob earns a modest amount of income, it should be sufficient to start investing in a mutual fund. Also, since he has little knowledge about investment, it would be wise to invest in mutual fund becayse investments are done by professional money managers.
Learning Outcome: Discuss the variety of investment objectivesb. Do you think he should use his $15,000 savings to start a mutual fund investment program?Yes, he should invest as soon as possible because generally the earlier you invest the more interests you will get by time to time
Learning Outcome: Assess and select funds for investment purposesc. What type of mutual fund investment program would you set up for the Reverend?Include in your answer some discussion of the types of funds you would consider, the investment objectives you would set, and any investment services (e.g., withdrawal plans) you would seek. Would taxes be an important consideration in your investment advice? Explain. Since Reverend Billy Bob goals are to supplement his retirement and college education for his child, it would be best to invest in a growth fund or growth-income fund. He can also invest in a retirement plan if he wants to defer the tax payment until he decides to withdraw the investment at retirement
Case Problem 12.2 Tom Lasnicka Seeks the Good Life
Tom Lasnicka is a widower who recently retired after a long career with a major Midwestern manufacturer. Beginning as a skilled craftsman, he worked his way up to the level of shop supervisor over a period of more than 30 years with the firm. Tom receives Social Security benefits and a generous company pension. Together, these two sources amount to over $4,500 per month (part of which is tax-free). The Lasnickas had no children, so he lives alone. Tom owns a two-
- 35 -

FACULTY OF ENGINEERING AND SCIENCEUKFF3283 PORTFOLIO MANAGEMENT
bedroom rental house that is next to his home, and the rental income from it covers the mortgage payments for both the rental house and his house.
Over the years, Tom and his late wife, Camille, always tried to put a little money aside each month. The results have been nothing short of phenomenal. The value of Tom's liquid investments (all held in bank CDs and savings accounts) runs well into the six figures. Up to now, Tom has just let his money grow and has not used any of his savings to supplement his Social Security, pension, and rental income. But things are about to change. Tom has decided, "What the heck, it's time I start living the good life!" Tom wants to travel and, in effect, start reaping the benefits of his labors. He has therefore decided to move $100,000 from one of his savings accounts to one or two high-yielding mutual funds. He would like to receive $1,000-$1,500 a month from the fund(s) for as long as possible, because he plans to be around for a long time.
QuestionsLearning Outcome: Assess and select funds for investment purposesa. Given Tom's financial resources and investment objectives, what kinds of mutual funds do you think he should consider?Given Tom’s existing financial condition, he can take on a certain amount of risk. Also, Tom wants to consume immediately. In that sense, an income fund seems attractive. He could obviously use the current income such a fund can provide. Although he seems financially capable of assuming increased risk to generate a higher return, he has also stated that he “intends to be around for a long time.” Therefore, preservation of capital would seem to be another of Tom’s objectives. As a result, he might also consider a money market fund, or perhaps an intermediate-term bond fund. The choice will boil down to Tom’s greatest need; or perhaps he can invest in both.
Learning Outcome: Discuss the variety of investment objectivesb. What factors in Tom's situation should be taken into consideration in the fund selection process? How might these affect Tom's course of action?The factors that must be taken into consideration are (1) Tom’s existing wealth level, (2) his ability to take on risk, (3) his demand for current income, and (4) his desire for capital preservation. These considerations will clearly dictate the kind of mutual fund Tom should select. His demand for current income and his desire for preservation of capital should be paramount in the selection process. He is financially well off; he has no children and is a widower, so he can afford to take some risk. But he is also in his retirement years, and he knows the importance of capital preservation. Taxes are not an issue, so he should avoid municipal bond funds and similar tax-sheltered funds.Some viable investment candidates could include one or more of the following: high-yield money funds for yield and capital preservation; corporate bond funds that invest heavily in A– and Baa–rated issues for high yield (note that extensive portfolio diversification would be essential to keep risk to a minimum); government bond funds with intermediate (three- to ten-year) maturities for safety, yield, and preservation of capital; or possibly even equity-income funds, which could provide not only current income but also some capital appreciation for the long-haul. However, Tom should
- 36 -

FACULTY OF ENGINEERING AND SCIENCEUKFF3283 PORTFOLIO MANAGEMENT
understand that this option could involve some periodic/short-term sacrifice of his capital preservation goal.
Learning Outcome: Discuss the investor services offered by mutual fundsc. What types of services do you think he should look for in a mutual fund?Tom is clearly not in need of any savings plan. He already has a considerable amount of savings and is able to manage things well on his own. What he needs is a withdrawal plan because Tom would like to receive the income periodically and at regular intervals. There are several popular variations of withdrawal plans, and he should pick the one that best suits his needs. Since Tom would like to receive $1,000–$1,500 monthly, he should initiate a fixed dollar amount withdrawal plan. A conversion privilege would also be a plus.
Learning Outcome: Identify the sources of return and compute the rate of returnd. Assume Tom invests in a mutual fund that earns about 10% annually from dividend income and capital gains. Given that Tom wants to receive $1,000 to $1,500 a month from his mutual fund, what would be the size of his investment account 5 years from now? How large would the account be if the fund earned 15% on average and everything else remained the same? How important is the fund's rate of return to Tom's investment situation? Explain. Fund earns 12 percent: Starting balance is $100,000. At the end of the first year, this would be worth $100,000 ´ 1.10 = $110,000. Let us assume (for ease of calculation) that Tom withdraws $15,000 per year at the end of each year and compute the value after he makes his fifth withdrawal:Year Initial Sum Ending
SumLess Annual Withdrawal
Balance
1 100000*1.10 = 110000 - 15000 = 950002 95000*1.10 = 104500 - 15000 = 895003 91400*1.10 = 98450 - 15000 = 834504 83450*1.10 = 91795 - 15000 = 767955 76795*1.10 = 84474 - 15000 = 69474Thus, at a 10% earning rate, the value of his $100,000 investment will steadily decline to $69,474 by the end of the 5th year. The reason for this is simple: he’s taking out more than he’s earning. This will eventually result in total capital consumption, something Tom would like to avoid. Obviously, the earning rate is important to the preservation of capital—in fact, the only way to avoid depletion of capital in this case is to invest in a fund earning at least 15 percent. Such a rate will yield $15,000 a year from a $100,000 investment. Short of this (i.e., finding a fund that yields 15%), Tom has three choices:(1) accept the fact that his capital will decline over time.(2) reduce the size of his withdrawals to something closer to the earning rate on the fund (e.g., to $10,000 per year from a fund that earns 10%); or(3) increase the size of the initial investment so the annual pay-off is closer to his needs—e.g., he would have to invest $150,000 to receive $15,000 per year from a fund that earns 10%.
- 37 -

FACULTY OF ENGINEERING AND SCIENCEUKFF3283 PORTFOLIO MANAGEMENT
== Tutorial 7 (Topic 6) ==
Learning Outcome: Explain what is asset allocation13.3 What is asset allocation? How does it differ from diversification? What
role does asset allocation play in constructing an investment portfolio?Asset allocation is the process of dividing a portfolio into various asset classes to preserve capital by protecting against negative developments while taking advantage of positive ones.It is based on the belief that the total return of a portfolio is influenced more by the way investments are allocated than by the actual investments.Asset allocation has a much greater impact on reducing total risk exposure than picking an investment vehicle in any single category (diversification)
For example, you may allocate 60% of your savings in common stock and 40% in bonds.
Learning Outcome: Explain Sharpe, Treynor, and Jensen measures13.17 Briefly describe each of the following return measures available for
assessing portfolio performance, and explain how they are used.
(a) Sharpe’s measure
(b) Treynor’s measure
(c) Jensen’s measure
- 38 -
FACULTY OF ENGINEERING AND SCIENCEUKFF3283 PORTFOLIO MANAGEMENT
Learning Outcome: Discuss portfolio revision13.19 Explain the role of portfolio revision in the process of managing a
portfolio.Portfolio revision is the process of selling securities in a portfolio and replacing them with the new one. It is important to revise the portfolio by reallocating and rebalancing it as economic conditions and personal goal change periodically.
Learning Outcome: To construct a portfolio consistent with investor objectivesP13.1 Refer to the table below:
Fund A Fund B Beta 1.8 1.1Investor A 20% 80%Investor B 80% 20%
As between Investor A and Investor B, which is more likely to represent a retired couple? Why?Investor A is more likely to represent the retired couple. It is because they would like to invest more in Fund B which has a lower risk with lower beta.
Learning Outcome: To construct a portfolio consistent with investor objectivesP13.2 Portfolio A and Portfolio B had the same holding period return last year.
Most of the returns from Portfolio A came from dividends, while most of the returns from Portfolio B came from capital gains. Which portfolio is owned by a single working person making a high salary, and which is owned by a retired couple? Why?Portfolio A is owned by the retired couple while portfolio B is owned by the single working person. It is because the retired couple has the main goal to gain a steady income and preserve capital gain. Hence they will look for low risk securities. Portfolio B is owned by the single working person who can afford to take risk. (Pay little or no dividend but high capital gain.)
Learning Outcome: Use the Sharpe, Treynor, and Jensen measures to compare a portfolio’s return
P13.16 The risk-free rate is currently 8.1 %. Use the data in the accompanying table for Fio family's portfolio and the market portfolio during the year just ended to answer the questions that follow.
Data Item Fios' Portfolio Market Portfolio Rate of return 12.8% 11.2%Standard deviation of return 13.5% 9.6%Beta 1.10 1.00
a. Calculate Sharpe's measure for the portfolio and the market. Compare the 2 measures, and assess the performance of the Fios' portfolio during the year just ended.
- 39 -

FACULTY OF ENGINEERING AND SCIENCEUKFF3283 PORTFOLIO MANAGEMENT
Sharpes’ measure (Fios) = (12.8-8.1)/13.5 = 0.348Sharpe’s measure (market) = (11.2-8.1)/9.6 = 0.323Fios portfolio outperformed the market on a risk/reward basis. Fios risk premium was higher relative to Fios risk taken than the market. This can be seen by the higher Sharpe's Measure for the Fios than for market portfolio.
b. Calculate Treynor's measure for the portfolio and the market. Compare the two, and assess the performance of the Fios' portfolio during the year just ended.Treynor’s measure (Fios) = (12.8-8.1)/1.10 = 4.273Treynor’s measure (market) = (11.2-8.1)/1.00 = 3.100Fios portfolio outperformed the market’s return/risk (reward to variability) ratio
c. Calculate Jensen's measure (Jensen's alpha). Use it to assess the performance of the Fios' portfolio during the year just ended.Jensen’s measure (Fios) = (12.8-8.1) – (1.10 x (11.2-8.1)) = 1.29The portfolio earned an excess return over the risk adjusted required rate of return of 1.29%A positive JM indicates that the actual return exceeds the required return.
d. On the basis of your findings in parts a, b, and c, assess the performance of the Fios' portfolio during the year just ended.The risk taken by Fios’ portfolio was treated well. He get a good return because the higher risk taken by Fios from market in Treynor’s measure. (High risk, high return). Jensen’s alpha guaranteed there was return for Fios’ portfolio because the positive figure of the measure. Fios’ portfolio brings a good return.
Learning Outcome: Apply the logic of different formula plansP13.18 Refer to the table below:
MM Mutual Time Period Stock Price Shares Fund NAV Shares 1 $20.00 1,000 $20.00 1,0002 $25.00 $21.00 _____
Assume you are using a constant-dollar plan with a rebalancing trigger of $1,500. The stock price represents your speculative portfolio, and the MM mutual fund represents your conservative portfolio. What action, if any, should you take in time period 2? Be specific.Without any action, (Period 2)Speculative’s portfolio worth = $25,000MM’s fund worth = $21,000
(-) $4,000The difference is more than rebalancing trigger ($1,500). Therefore, the portfolio should be rebalanced.
- 40 -

FACULTY OF ENGINEERING AND SCIENCEUKFF3283 PORTFOLIO MANAGEMENT
Since there is $4000 more in Speculative’s portfolio, you should move half of that sum to MM’s fund which is $4000/2 = $2000With this sum of $2000:$2000/$25 = 80 shares (sell)$2000/$21 = 95 shares (purchase)
Learning Outcome: Apply the logic of different formula plansP13.19 Refer to P13.18 above. Now assume you are using a constant-ratio plan
with a rebalance trigger of speculative-to-conservative of 1.25. What action, if any, should you take in time period 2? Be specific.
Since $25000/$21000 = 1.19The rebalance trigger of speculative-to-conservative is 1.25. Therefore, the trigger has not been hit.
Learning Outcome: Apply the logic of different formula plansP13.20 Refer to the table below:
MM Mutual Time Period Stock Price Shares Fund NAV Shares 1 $20.00 1,000 $20.00 1,0002 $30.00 1,000 $19.00 1,000
Assume you are using a variable-ratio plan. You have decided that when the speculative portfolio reaches 60% of the total, you will reduce its proportion to 45%, what action, if any, should you take in time period 2?
During the period 2, the total value is:
($30 X 1000) + ($19 X 1000) = $49000
Speculative portfolio : $30000/$49000 X 100% = 61%
The speculative portfolio has reached 61% thus we reduce its proportion to 45%:
(0.45 X $49000) = $22050
With this $22050, we should have :
$22050/$30 = 735 shares
Therefore, you should sell 1000-735 = 265
- 41 -
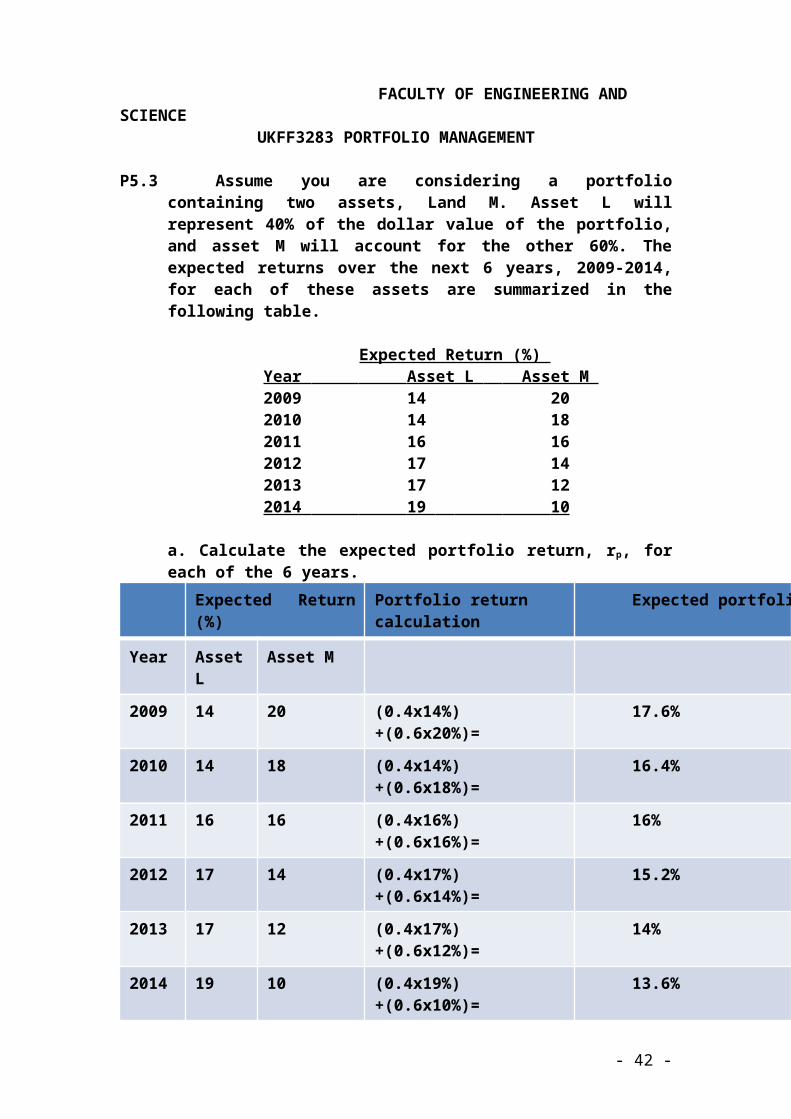
FACULTY OF ENGINEERING AND SCIENCEUKFF3283 PORTFOLIO MANAGEMENT
== Tutorial 8 (Topic 7) ==
Learning Outcome: Explain the investment appeal of common stocks6.1 What is a common stock? What is meant by the statement that holders of
common stock are the residual owners of the firm?A common stock is an equity investment that represents ownership in a corporate form of business. Each share represents a fractional ownership interest in the firm. The key attribute of this investment security is that it enables investors to participate in the profits of the firm. As residual owners of the company, common stockholders are entitled to dividend income and a prorated share of the firm’s earnings after all other obligations of the firm have been met. They have no guarantee they will ever receive any return on their investment.
Learning Outcome: Identify the sources of stock returns6.4 How important are dividends as a source of return to common stock?
What about capital gains? Which is more important to total return? Which causes wider swings in total return?While they don’t provide the “bang” that capital gains do, dividends are an important source of return to stockholders. Dividend returns are always positive, although the dividend yield has been under 2.5 percent during the past decade. There’s no question that capital gains provide the really big returns, though they also lead to wider swings in year-to-year yields. Dividends, in contrast, provide an element of stability and tend to shore up returns in off years.
Learning Outcome: Explain the investment appeal of common stocks6.5 What are some of the advantages and disadvantages of owning common
stock? What are the major types of risk to which stockholders are exposed?
7 The major advantage of common stock ownership is the returns it offers. Because stockholders are entitled to participate in the prosperity of a firm, there is almost no limit to a stock’s capital gains potential. In addition, many stocks provide regular current income in the form of annual dividends—and for most income-producing stocks, those dividends tend to grow over time, adding even more to the stockholder’s return. Common stocks are also highly liquid and easily transferable; their transaction costs are relatively low, market information is readily available, and unit price is nominal. The risky nature of common stocks is the most significant disadvantage of common stock ownership. As residual owners of the firm, no return is guaranteed. Furthermore, prices are subject to wide swings, making valuation difficult. Finally, the sacrifice in current income is a disadvantage relative to other investments (like bonds, for instance) that pay higher and more certain returns.
8 The principal risks to stockholders include: business and financial risk, purchasing power risk, and, of course, market risk. Business risk is related to the kind of business the company is in and deals with both sales volatility and the amount of variability in the firm’s earnings. Financial risk is associated with the mix of debt and equity financing. The more debt (financial leverage) the firm uses, the greater the likelihood that it will default on its principal and interest payments—which in turn will have a negative impact on the stock. Purchasing power risk refers to the possibility of price increases and the corresponding decline in the value of the dollars invested in common
- 42 -
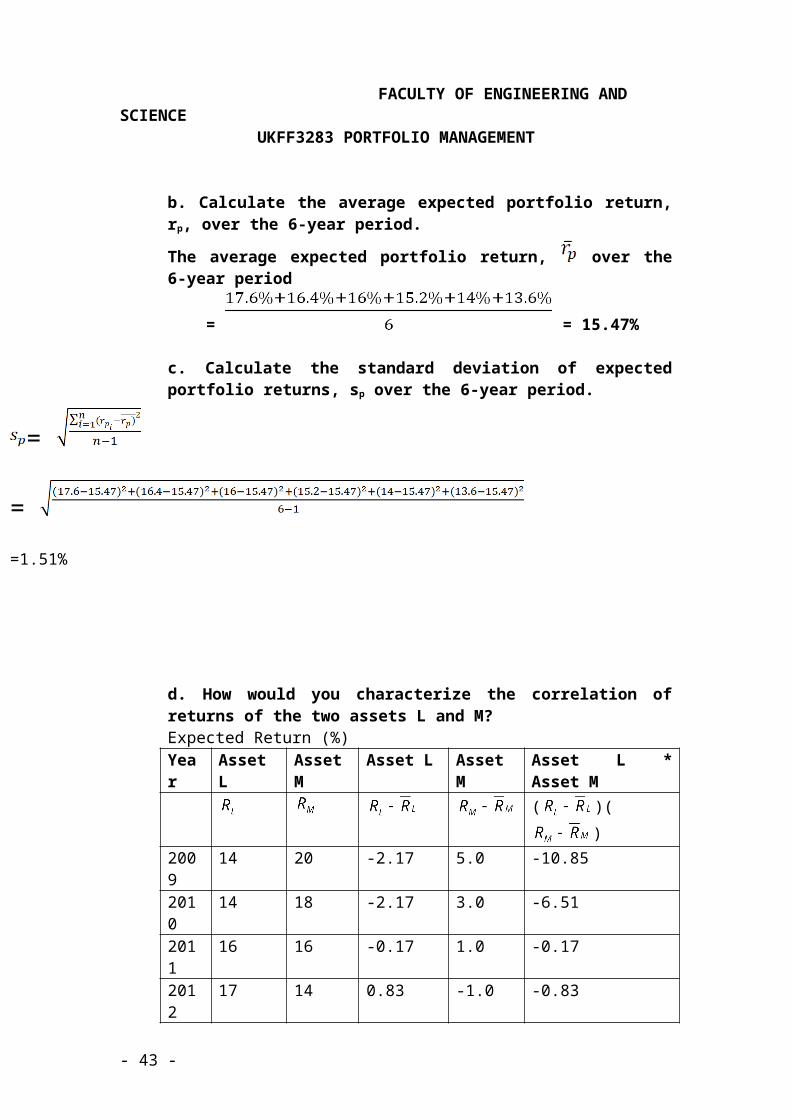
FACULTY OF ENGINEERING AND SCIENCEUKFF3283 PORTFOLIO MANAGEMENT
stock. Market risk is caused by factors independent of the firm that affect the return on the firm’s common stock. Such things as economic fluctuations, threat of war, and political factors affect market risk and therefore can have a bearing on the market price of a stock. The market itself has an impact on the price performance of a stock—which, of course, is what beta is all about (i.e., a stock’s beta is a measure of the extent to which the stock reacts to the market).
Learning Outcome: Discuss common stock dividends6.11 Why is the ex-dividend date important to stockholders? If a stock is sold
on the ex-dividend date, who receives the dividend – the buyer or the seller? Explain.The ex-dividend date (which occurs two business days prior to the date of record) determines who is eligible to receive the declared dividend when the stock is sold. If the stock is sold on or after the ex-dividend rate, the owner (seller) receives the dividend; if it is sold prior to the ex-dividend rate the new shareholder (buyer) receives the dividend. Thus, if the stock is sold on the ex-dividend date, the seller receives the dividend—going “ex-dividend” means the buyer is not entitled to the dividend since the stock is being sold “without” the dividend
Learning Outcome: Calculate the different kinds of common stock ratiosP6.7 Consider the following information about Truly Good Coffee, Inc.
Total assets $240 millionTotal debt $115 millionPreferred stock $25 millionCommon stockholders' equity $100 millionNet profits after taxes $22.5 millionNumber of preferred stock outstanding 1 million sharesNumber of common stock outstanding 10 million sharesPreferred dividends paid $2/shareCommon dividends paid $0.75/shareMarket price of the preferred stock $30.75/shareMarket price of the common stock $25.00/share
Use the information above to find the following.a. The company's book value.b. Its book value per share.c. The stock's earnings per share (EPS).d. The dividend payout ratio.e. The dividend yield on the common stock.f. The dividend yield on the preferred stock.
(a) Book value = Total assets – Total debt – Preferred stock For Truly Good Coffee: Book value = $240M – $115M – $25M = $100M which is equal to common stockholders’ equity(b) Book value per share = Book Value ÷ Number of shares of common stock outstanding = $100,000,000 ÷ 10,000,000 = $10 per share
- 43 -

FACULTY OF ENGINEERING AND SCIENCEUKFF3283 PORTFOLIO MANAGEMENT
c) Earnings per share (EPS) = (Net profits after taxes - Preferred dividends) ÷ Number of shares of common stock outstanding = ($22,500,000 $2,000,000) ÷ 10,000,000 shares = $2.05 per shared) Dividend payout ratio = Dividends per share ÷ Earning per share = $0.75 ÷ $2.05 = 36.59%e) Dividend yield on common stock = Cash dividends per share ÷ Market price per share = $0.75 ÷ $25.0 = 3.0%
(f) Dividend yield on preferred stock = Preferred dividends per share ÷ Market price of preferred share = $2.00 ÷ $30.75 = 6.5%
Learning Outcome: Discuss the security analysis process7.1 Identify the three major parts of security analysis, and explain why
security analysis is important to the stock selection process.The three major parts of security analysis are economic analysis, industry analysis, and fundamental analysis. Security analysis is important because it enables the investor to establish the expected return and risk for a stock and to evaluate its desirability in a logical, rational manner.
Learning Outcome: Discuss the security analysis process7.4 Would there be any need for security analysis if we operated in an
efficient market environment? Explain.If the stock market is efficient in the strongest form, then securities are never substantially mispriced and hence there would be no need for security analysis. But in reality, the financial markets are not perfectly efficient and pricing errors are inevitable. With thorough security analysis, individuals can profit whenever pricing errors occur. Paradoxically, financial market efficiency is achieved only due to the existence of traders who invest time and money in fundamental analysis to root out pricing errors. Security analysis is also useful in assessing an asset’s liquidity, current income, and risk and in verifying that these match investor criteria.
Learning Outcome: Explain the purpose and contributions of economic analysis
7.5 Describe the general concept of economic analysis. Is this type of analysis necessary, and can it really help the individual investor make a decision about a stock? Explain.Economic analysis involves studying the underlying nature of the economic environment in which a firm operates. Economic analysis also helps the investor form expectations about the future course of the economy. Such an analysis could be a detailed examination of the economy, sector by sector, or it may be done on a very informal basis. In any event, it deals with such aspects as production and unemployment statistics, inflation, fiscal and monetary policies, and their effects on security returns. This analysis is, indeed, essential to an investor’s decision-making framework. We live in an economy where firms are affected by general economic conditions; therefore, we cannot talk of security analysis without addressing economic analysis. There’s plenty of real world evidence to demonstrate the high correlation between the performance of stocks and general economic activity—i.e., when the economy starts improving, so do stock returns, all of which indicate the importance of economic analysis to the stock selection process.
- 44 -
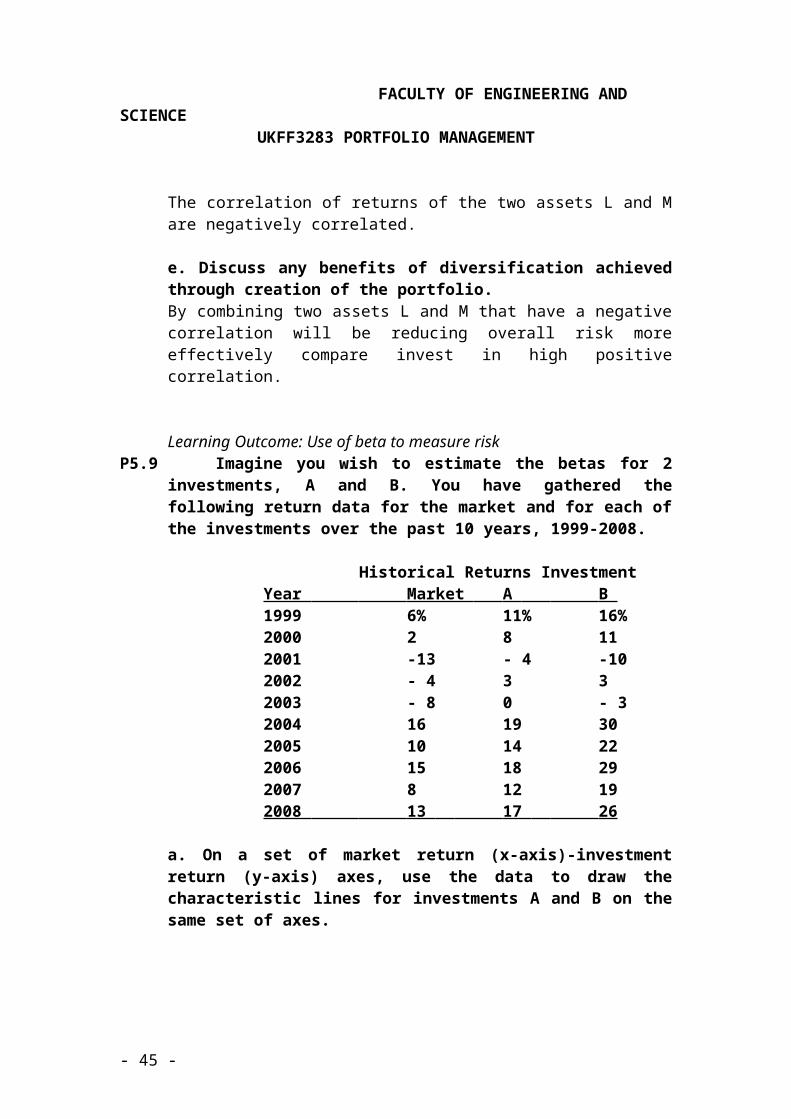
FACULTY OF ENGINEERING AND SCIENCEUKFF3283 PORTFOLIO MANAGEMENT
Learning Outcome: Describe industry analysis7.9 What is industry analysis, and why is it important?
Industry analysis is the part of the security analysis process involving the study of stocks in terms of their industry groupings. Industry analysis is important because stock prices are influenced, at least in part, by industry effects. Industry analysis can be used to establish the competitive position for a particular industry and to assess the nature of the opportunity the industry offers for the future. It also enables the investor to identify promising firms in an industry.
Learning Outcome: Describe industry analysis7.10 Identify and briefly discuss several aspects of an industry that are
important to its behavior and operating characteristics. Note especially how economic issues fit into industry analysis.Some important aspects of industry analysis include:
(a) The nature of the industry: whether it is monopolistic or competitive. (b) The extent of regulation: whether regulation is minimal or intense. (c) The role of big labor: the status of contract talks and general labor regulations. (d) Technological progress: are any technological breakthroughs likely?(e) Financial and operating characteristics: considerations involving labor, material, and capital.
Economic forces important to the industry include the demand for the industry’s goods and services and the correlation with key economic variables. To the extent that an industry is influenced by economic forces, we would want to determine the economic variables that are of primary importance to an industry; it might be GDP, or the level of interest rates, or the unemployment rate. Also, the future outlook for these variables would be important since they are likely to set the tone for future industry performance.
Learning Outcome: Explain fundamental analysis7.12 What is fundamental analysis? Does the performance of a company have
any bearing on the value of its stock? Explain.Fundamental analysis is the study of the financial affairs of a business. It is essential to the valuation process to the extent that the value of a stock is influenced by the performance of the company that issues the stock. An equivalent statement is that the value of a security depends not only on return, but also on risk—both of which are affected to a large extent by the operating characteristics and financial condition of the firm. Fundamental analysis helps to capture insights to these dimensions from financial statements and other information about a company and incorporates them in the valuation process.
Case Problem 7.1 Some Financial Ratios Are Real Eye-Openers
Jack Arnold is a resident of Lubbock, Texas, where he is a prosperous rancher and businessman. He has also built up a sizable portfolio of common stock, which, he believes, is due to the fact that he thoroughly evaluates each stock he invests in. As Jack says, "Y'all can't be too careful about these things! Anytime I'm fixin’ to invest in a stock, you can bet I'm gonna learn as much as I can about the company." Jack prefers to compute his own ratios even though he
- 45 -
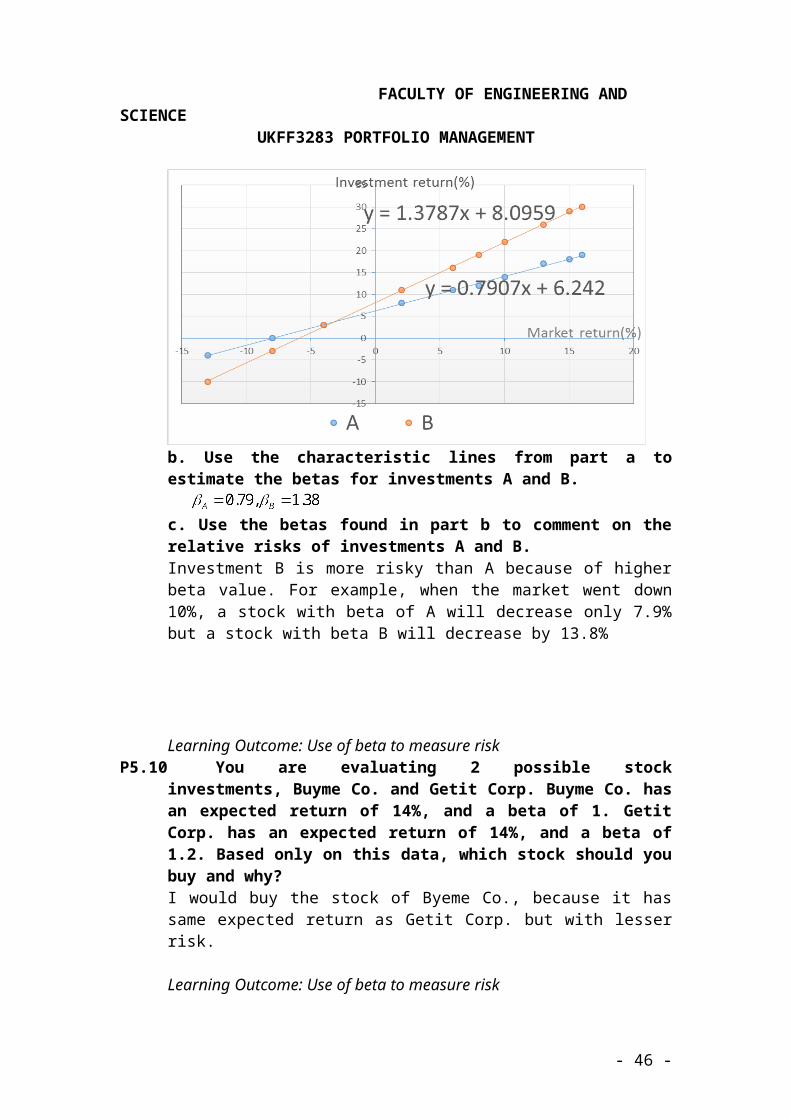
FACULTY OF ENGINEERING AND SCIENCEUKFF3283 PORTFOLIO MANAGEMENT
could easily obtain analytical reports from his broker at no cost. (In fact, Billy Bob Smith, his broker, has been volunteering such services for years.) Recently, Jack has been keeping an eye on a small chemical stock. The firm, South Plains Chemical Company, is big in the fertilizer business-which is something Jack knows a lot about. Not long ago, he received a copy of the firm's latest financial statements (summarized here) and decided to take a closer look at the company.
South Plains Chemical Company Balance Sheet($ Thousands)
__________________________________________________________________Cash $ 1,250Accounts receivable 8,000 Current liabilities $ 10,000Inventory 12,000 Long-term debt 8,000Current assets 21,250 Stockholders' equity 12,000 Fixed and other assets 8,750 Total liabilities and Total assets $30,000 stockholders' equity $ 30,000
Income Statement($ Thousands)
_________________________________________________________Sales $50,000Cost of goods sold 25,000Operating expenses 15,000Operating profit 10,000Interest expense 2,500Taxes 2,500Net profit $ 5,000
Dividends paid to common stockholders ($ in thousands) $1,250Number of common shares outstanding 5 millionRecent market price of the common stock $25
QuestionsLearning Outcome: Calculate financial ratiosa. Compute the following ratios, using the South Plains Chemical Company figures.
- 46 -
FACULTY OF ENGINEERING AND SCIENCEUKFF3283 PORTFOLIO MANAGEMENT
Latest Industry Latest Industry Averages Averages
Liquidity Profitabilitya. Net working capital N/A h. Net profit margin 8.5%b. Current ratio 1.95 i. Return on assets 22.5%
j. ROE 32.2%Activity c. Receivables turnover 5.95 Common Stock Ratiosd. Inventory turnover 4.50 k. Earnings per share $2.00e. Total asset turnover 2.65 l. Price/earnings ratio 20.0
m. Dividends per share $1.00Leverage n. Dividend yield 2.5%f. Debt-equity ratio 0.45 o. Payout ratio 50.0%g. Times interest earned 6.75 p. Book value per share $6.25
q. Price-to-book-value ratio 6.4(a) Net working capital
= Current assets – Current liabilities= $21,250 – $10,000 = $11,250
(b) Current ratio = Current assets /Current liabilities = $21,250 / $10,000 = 2.125
(c) Receivables turnover = Sales / Accounts receivable = $50,000 / $8,000 = 6.25
(d) Inventory turnover = Sales/Inventory = $50,000/$12,000 = 4.17
(e) Total asset turnover = Sales/Total assets = $50,000/$30,000 = 1.67
(f) Debt-equity ratio = Long-term debt / Stockholder’s equity = $8,000 / $12,000 = 0.67
(g) Times interest earned = Earnings before interest and taxes/ interest expense = $10,000 / $2,500 = 4.0
(h) Net profit margin = Net profits after taxes / Sales = $5,000/$50,000 = 0.1 or 10%
- 47 -
FACULTY OF ENGINEERING AND SCIENCEUKFF3283 PORTFOLIO MANAGEMENT
(i) Return on total assets = Net profits after taxes / Total assets = $5,000/$30,000 = 0.166 or 16.67%
(j) Return on equity = Net profits after taxes / Stockholders’ equity = $5,000/$12,000 = 0.4167 or 41.67%
(k) Earnings per share= (Net profits after taxes – Preferred dividends) /No. of shares of
common shares outstanding = ($5,000 – 0) / 5,000 = $1 /share
(l) Price/Earnings ratio= Market price of common stock / EPS = $25 / $1 = 25 times
(m) Dividends per share= Dividends paid to common stockholders / No. of common shares
outstanding = $1,250 / 5,000 = $0.25 /share
(n) Dividend yield= Dividends per share/Market price of common stock = $0.25/$25.00 = 0.01 or 1%
(o) Payout ratio= Dividends per share/EPS = $ 0.25 / $1.00 = 0.25 or 25%
(p) Book value per share= Stockholders’ equity/No. of common shares outstanding = $12 million/5 million = $2.40
(q) Price-to-book value= Market price of common stock/Book value per share = $25/$2.40 = 10.42
Learning Outcome: Compare financial ratios and assess company’s performancec. Compare the company ratios you prepared to the industry figures given
in part a. What are the company's strengths? What are its weaknesses?Company is more liquid than the industry. The efficiency ratio of the company is very weak here. The low ratios suggest poor utilization of assets. The deviation of account receivable and inventory are very close to the industry, it seems to come from the excess fixed assets.
- 48 -
FACULTY OF ENGINEERING AND SCIENCEUKFF3283 PORTFOLIO MANAGEMENT
• Company is using more debt to support its business than industry, and it has lower ability to cover interest compare to industry.
• Mixed profitability. The company has higher margin and ROE. The lower return on assets reflect the poor activity ratio mentioned above. But as a shareholder we concern more on ROE. The high ROE is due to the high leverage, the high debt financing. Shareholder prefers to take high risk to get high return.
• Low dividend, but P/E ratio is higher than industry. The market anticipates above average profitability and return in future. That’s why investor is willing to pay a high P/E ratio. P/E ratio is long term, while dividend is short term. So low dividend is acceptable for investor point of view.
• The price to book value is much higher than industry and provide further support that the market is anticipating good things from the company.
Learning Outcome: Assess company’s performancec. What is your overall assessment of South Plains Chemical? Do you think Jack should continue with his evaluation of the stock? Explain.The company seems to have a good prospect for attractive return, but in high risk. For Jack to continue with his evaluation of South Plains Chemical, he must feel the opportunities for the company are promising and commensurate with the risk involved.
- 49 -

FACULTY OF ENGINEERING AND SCIENCEUKFF3283 PORTFOLIO MANAGEMENT
== Tutorial 9 (Topic 8) ==
Learning Outcome: Discuss P/E multiple 8.3 Can the growth prospects of a company affect its price/earnings multiple?
Explain. How about the amount of debt a firm uses? Are there any other variables that affect the level of a firm’s P/E ratio?Both the growth prospects of a company and the amount of debt it uses can affect the P/E ratio. As the growth rate increases, a higher P/E ratio can be expected. Likewise, as the debt level decreases, the financial risk inherent in the firm decreases, and the P/E ratio can be expected to increase. Other factors that affect the P/E ratio are general market psychology (higher P/E ratios accompany optimistic markets) and the level of dividends (a higher P/E ratio can be expected with higher dividends, so long as the firm is also able to maintain a respectable rate of growth in earnings).
Learning Outcome: Discuss the concepts of intrinsic value and required rates of return
8.5 In the stock valuation framework, how can you tell whether a particular security is a worthwhile investment candidate? What roles does the required rate of return play in this process? Would you invest in a stock if all you could earn was a rate of return that just equaled your required return? Explain.If the computed rate of return equals or exceeds the yield the investor feels is warranted, based on the stock’s risk behavior, or if the justified price is equal to or greater than the current market price, the stock under consideration should be considered a worthwhile investment candidate. The required rate of return provides a standard so that an investor can determine if the expected return on a stock is satisfactory or not. The required rate of return is positively related to the underlying risk involved in an investment. The higher the risk, the higher the return the investor would expect the investment to generate. The investor who picks a stock whose return is less than the required rate of return has really invested in a stock that is overvalued at the current time. This is because the stock is not yielding returns commensurate with the risk exposure. Since the market will learn of such overvaluation in time, market forces will bid down the price of such a security. The investor will incur capital losses when the stock price drops below the purchase price.
Learning Outcome: Discuss expected return 8.8 How would you go about finding the expected return on a stock? Note
how such information would be used in the stock selection process.Expected return on a stock can be found by using the (present-value based) internal rate of return (IRR). The expected rate of return on a stock would be the discount rate that equates the future stream of benefits from the stock (i.e., the future annual dividends and future price of the stock) to its current market value. In order to accept a stock as an investment vehicle, its expected return (IRR) must at least equal its required rate of return (e.g. using CAPM). If the expected return on a stock is higher than its required rate of return, then it is certainly a good buy.
- 50 -

FACULTY OF ENGINEERING AND SCIENCEUKFF3283 PORTFOLIO MANAGEMENT
Learning Outcome: Calculate P/E ratio and EPS P8.1 An investor estimates that next year's sales for New World Products
should £mount to about $75 million. The company has 2.5 million shares outstanding, generates a net profit margin of about 5%, and has a payout ratio of 50%. All figures are expected to hold for next year. Given this information, compute the following.a. Estimated net earnings for next year.b. Next year's dividends per share.c. The expected price of the stock (assuming the PIE ratio is 24.5 times earnings).d. The expected holding period return (latest stock price: $25 per share).
(a) Estimated net earnings = Estimated sales × Expected net profit margin = $75,000,000 × 0.05 = $3,750,000(b) Estimated EPS = Estimated Net Earnings ÷ Expected Shares Outstanding = $3,750,000 ÷ 2,500,000 = $1.50(c) Expected price = Estimated EPS × Expected P/E ratio = $1.50 × 24.5 = $36.75(d) HPR = (Future dividend + Future sale price - Current stock price) ÷ Current stock price = ($0.75 $36.75 $25.00) ÷ $25.00 = 50%
Learning Outcome: Explain and calculate intrinsic value
P8.7 Charlene Lewis is thinking about buying some shares of Education, Inc., at $50 per share. She expects the price of the stock to rise to $75 over the next 3 years. During that time she also expects to receive annual dividends of $5 per share.a. What is the intrinsic worth of this stock, given a 10% required rate of return?b. What is its expected return?
(a) Intrinsic value = PV(dividends) + PV(future price) = $5(0.909)* + $5(0.826)* + ($75 + $5)(0.751)*= $68.76(b) $50. The rate of return which discounts future cash flows such that their sum equals the current stock price is 23%. Hence the expected return of the stock is 23%.
No matter how you look at it, Education, Inc. should be viewed as a viable investment candidate. It has a justified price ($68.76) that far exceeds the stock’s current price ($50), suggesting that the stock is “undervalued” (so long as Charlene’s expectations are right), and its yield (23%) is far above Charlene’s required rate of return (10%).
Learning Outcome: Apply dividend valuation model and PV-based models P8.10 Larry, Moe, and Curley are brothers. They're all serious investors, but
each has a different approach to valuing stocks. Larry, the oldest, likes to use a I-year holding period to value common shares. Mae, the middle brother, likes to use multiyear holding periods. Curley, the youngest of the three, prefers the dividend valuation model.
As it turns out, right now, all three of them are looking at the same stock American Home Care Products, Inc. (AHCP). The company has been listed on the NYSE for over 50 years, and is widely regarded as a mature,
- 51 -
FACULTY OF ENGINEERING AND SCIENCEUKFF3283 PORTFOLIO MANAGEMENT
rock-solid, dividend-paying stock. The brothers have gathered the following information about AHCP's stock:
Current dividend (Do) = $2.50/share Expected growth rate (g) = 9.0% Required rate of return (k) = 12.0%
All three of them agree that these variables are appropriate, and they will use them in valuing the stock. Larry and Moe intend to use the D&E approach; Curley is going to use the constant-growth DVM. Larry will use a 1-year holding period; he estimates that with a 9% growth rate, the price of the stock will increase to $98.80 by the end of the year. Mae will use a 3-year holding period; with the same 9% growth rate, he projects the future price of the stock will be $117.40 by the end of his investment horizon. Curley will use the constant-growth DVM, so his holding period isn't needed.a. Use the information provided above to value the stocks first for
Larry, then for Moe, then for Curley.b. Comment on your findings. Which approach seems to make the
most sense?a) Larry’s valuation (D&E approach, 1 year holding period) : PV of a share of stock = PV of future dividends + PV of price of stock at
date of sale
= = $ 90.65
b) Moe’s valuation (D&E approach, 3 year holding period) : PV of a share of stock = PV of future dividends + PV of price of stock at
date of sale
= + + +
= $90.67c) Curley’s valuation (constant growth Dividend Valuation Model) : Value of a stock =
= = $90.83b) The difference between maximum and minimum of share price is $0.18
cents which is less than 0.2. This inconsequential difference highlights the fact that AHCP’s value
is not dependent upon the holding period of the investor.
- 52 -
FACULTY OF ENGINEERING AND SCIENCEUKFF3283 PORTFOLIO MANAGEMENT
Learning Outcome: Apply dividend valuation model and PV-based models P8.12 Let's assume that you're thinking about buying stock in West Coast
Electronics. So far in your analysis, you've uncovered the following information: The stock pays annual dividends of $2.50 a share (and that's not expected to change within the next few years-nor are any of the other variables). It trades at a PIE of 18 times earnings and has a beta of 1.15. In addition, you plan on using a risk-free rate of 7% in the CAPM, along with a market return of 14%. You would like to hold the stock for 3 years, at the end of which time you think EPS will peak at about $7 a share. Given that the stock currently trades at $70, use the IRR approach to find this security's expected return. Now use the present-value (dividends-and-earnings) model to put a price on this stock. Does this look like a good investment to you? Explain.The expected future price of stock = Future EPS x multiple
= $7 x 18 = $126Expected return using IRR =($2.50 × PVIF1YR) + ($2.50 × PVIF2YRS) + ($2.50 × PVIF3YRS) + ($126 × PVIF3YRS) = $70 Required Return = Risk–free rate + [Stock’s beta × (Market return – Risk-free rate)] = 7 + [1.15 × (14.0 – 7.0)] = 7 + [1.15 × 7] = 7 + 8.05 = 15.05 The expected rate of return which discounts future cash flow = 24.63%.Required Return = Risk–free rate + [Stock’s beta × (Market return – Risk-free rate)] = 7 + [1.15 × (14.0 – 7.0)] = 7 + [1.15 × 7] = 7 + 8.05 = 15.05 The expected rate of return which discounts future cash flow = 24.63%.
Using 15% as the interest, we calculate the price of the stock.Present-value model = PV(dividends) + PV(future price of the stock) = ($2.50)(0.870)* + ($2.50)(0.756)* + (2.50 + $126.00)(0.658)* = $88.62 Since the justified price is higher than market price and the expected rate of return is greater than the required rate of return, this stock seems to be a good investment.
Learning Outcome: Apply dividend valuation model and PV-based models
- 53 -

FACULTY OF ENGINEERING AND SCIENCEUKFF3283 PORTFOLIO MANAGEMENT
P8.15 Assume there are three companies that in the past year paid exactly the same annual dividend of $2.25 a share. In addition, the future annual rate of growth in dividends for each of the three companies has been estimated as follows:
Buggies-Are-Us Steady Freddie. Inc. Gang Buster Group g=0 g= 6% Year 1 $2.53(i.e., dividends are (for the 2 $2.85expected to remain foreseeable future) 3 $3.20at $2.25/share) 4 $3.60 Year 5 and beyond: g = 6%
Assume also that as the result of a strange set of circumstances, these three companies all have the same required rate of return (k = 10%).a. Use the appropriate DVM to value each of these companies.Valuation using the DVM: Intrinsic value = D0 (1 + g) ÷ (k – g)Buggies-Are-Us: $2.25(1 + 0) ÷ (0.10 0.06) = $22.50Steady Freddie, Inc.: $2.25(1+.06) ÷ (0.10 - 0.06) = $59.63Gang Buster Group: Step 1: Present value of dividends using a required rate of return of 10 percent: Year Dividends × PVIF, 10% Present Value 1 $2.53 0.909 $2.30 2 2.85 0.826 2.35 3 3.20 0.751 2.40 4 3.60 0.683 2.46
Total $9.51Step 2: Price of stock at the end of year 4: P4 = D5 ÷ (k – g) = D4(1 + g) ÷ (k – g) = $3.60(1 + 0.06) ÷ (0.10 - 0.06) = $95.50Step 3: Present value of the stock price: PV $95.50 x PVIF10%, 4yrs = $95.50 x 0.683 = $65.23Step 4: Value of stock = $9.51 (Step 1) + $65.23 (Step 3) = $74.74
b. Comment briefly on the comparative values of these three companies. What is the major cause of the differences among these three valuations?The intrinsic value of Gang Busters is $74.74 which is higher than Buggies-Are-Us ($22.50) and Steady Freddie ($59.63). This is mainly due to the different growth rates of each company. As the growth rate of Buggies-Are-Us is 0, the company has low intrinsic value for its stock while the dividend of Steady Freddie is growing at a constant rate of 6% has higher intrinsic value of its stock. Gang Busters has a constant rate during the first four years and 6% from year 5 onwards. Due to the high growth rate of Gang Busters, its stock worth more than Steady Freddie company.
Learning Outcome: Calculate required rate of return and apply PV-based models
- 54 -

FACULTY OF ENGINEERING AND SCIENCEUKFF3283 PORTFOLIO MANAGEMENT
P8.18 Assume a major investment service has just given Oasis Electronics its highest investment rating, along with a strong buy recommendation. As a result, you decide to take a look for yourself and to place a value on the company's stock. Here's what you find: This year, Oasis paid its stockholders an annual dividend of $3 a share, but because of its high rate of growth in earnings, its dividends are expected to grow at the rate of 12 % a year for the next 4 years and then to level out at 9% a year. So far, you've learned that the stock has a beta of 1.80, the risk-free rate of return is 6%, and the expected return on the market is 11 %. Using the CAPM to find the required rate of return, put a value on this stock. CAPM:
Required rate of return = risk-free rate + stock’s beta × market return – risk-free rate = 6% + [1.80 (11% – 6%)] = 6% + 9% = 15% (ii) Value the stock using the variable growth dividend model: For the next 4 year, dividends growth rate is 12%.D1 = D0 (1 + g) = $3(1.12) = $3.36 D2 = D1 (1 + g) = $3.36(1.12) = $3.76 D3 = D2 (1 + g) = $3.76(1.12) = $4.21 D4 = D3 (1 + g) = $4.21(1.12) = $4.72
Value of stock = (D1 × PVIF1) + (D2 × PVIF2) + (D3 × PVIF3) + (D4 × PVIF4) + PVIF4 ×
= ($3.36 × PVIF 15%,1) + ($3.76 × PVIF 15%,2) + ($4.21 × PVIF 15%,3) + ($4.72 ×
PVIF 15%,4) + PVIF 4 × = 2.92 + 2.84 + 2.77 + 2.70 + 49.05 = $60.28 How to calculate each part for:($3.36 × PVIF 15%,1)
1) By financial calculator:• FV= dividend on time t= 3.36• I/Y= required return= 15 • N= no. of years= 1• Press CPT PV.
== Tutorial 10 (Topic 9) ==
- 55 -
FACULTY OF ENGINEERING AND SCIENCEUKFF3283 PORTFOLIO MANAGEMENT
Learning Outcome: Discuss the purpose of technical analysis 9.1 What is the purpose of technical analysis? Explain how and why it is used
by technicians; note how it can be helpful in timing investment decisions.Technical analysis involves the study of the various forces at work in the marketplace. Technical analysts argue that internal market factors, such as trading volume and price movements, often reveal the market’s future direction before the cause is evident in financial statistics. Thus, by revealing the market’s future direction, technical analysis provides insight that is supposed to be helpful to investors in timing their investment decisions. If technical analysis indicates the market is about to move up, it signals a good time to buy; if it indicates the market is about to turn down, it signals a good time to sell.
Learning Outcome: Discuss how market performance affects stock valuation9.2 Can the market really have a measurable effect on the price behavior of
individual securities? Explain.The market can definitely have an impact on the prices of individual securities, and a significant one at that. In fact, studies have indicated that between 20 and 50 percent of stock price behavior can be traced to market forces. When the market is bullish, stock prices rise in general. When market participants become bearish, most prices fall. This is because stock prices are simply the result of supply and demand forces in the market. Since the demand for and supply of securities depends on the general condition of the market, stock prices are affected by the general behavior of the marketplace
Learning Outcome: Describe some approaches to technical analysis 9.5 Briefly describe each of the following, and note how it is computed and
how it is used by technicians:a. Relative strength index.b. Moving averages.The relative strength index (RSI) is a measure of the average price change on up days to the average price change on down days. If the average price change is the same on up and down days, the RSI value will be 50. If the average price change is twice as high on up days as down days, the RSI value will be 67. High values actually suggest that there is more buying than the fundamentals will justify.Moving averages compare current share price to the average share price over a specified period. The period might, for instance, be 200 days. Every new day is added to the average and the oldest day is dropped from the average. When current share prices advance above their 200-day moving average, share prices are expected to continue to rise, whereas when stock prices drop below their moving average, they are expected to continue to decline.
Learning Outcome: Explain the idea of random walks and efficient markets
- 56 -
FACULTY OF ENGINEERING AND SCIENCEUKFF3283 PORTFOLIO MANAGEMENT
9.7 What is the random walk hypothesis, and how does it apply to stocks? What is an efficient market? How can a market be efficient if its prices behave in a random fashion? The random walk hypothesis claims that stock prices follow a random or erratic pattern. That is, people who believe in this theory claim that price movements are unpredictable and as a result, there’s little that you can do to predict future behavior. An efficient market is one in which the market price of the security always fully reflects all available information, so it is difficult, if not impossible to consistently outperform the market by picking undervalued stocks. It is argued that in an efficient market, random price movements simply reflect a highly competitive market where investors quickly use and digest any new information. This competition holds security prices close to their correct (justified) level; as new information becomes available (in a random manner), adjustments in price are random and quick to follow.
Learning Outcome: Explain the idea of efficient markets9.8 Explain why it is difficult, if not impossible, to consistently outperform an
efficient market.a. Does this mean that high rates of return are not available in the stock market?b. How can an investor earn a high rate of return in an efficient market?To outperform the market, one must consistently earn more than the required rate of return on securities. In other words, one must be able to consistently find stocks selling below their justified prices, and then realize the expected return on the security. In an efficient market, current prices reflect all information, therefore, current prices equal justified prices, and investors can expect to earn only the required (risk-adjusted) rate of return. (a) Efficient markets do not make high rates of return unavailable, but they make it (nearly) impossible to consistently earn returns higher than the rates of return required for the risk levels of the securities purchased. Hence a stock with high rates of return will also be more risky. (b) Investors can earn high rates of return through luck, or through accepting stocks with higher risks. They can also minimize transaction and tax expenses, along with unnecessary risk, to make their returns more satisfactory
Learning Outcome: Explain market anomalies
- 57 -

FACULTY OF ENGINEERING AND SCIENCEUKFF3283 PORTFOLIO MANAGEMENT
9.9 What are market anomalies and how do they come about? Do they support or refute the EMH? Briefly describe each of the following:a. The January effect.b. The PIE effect.c. The size effect.Market anomalies are deviations from what one would expect in an efficient market and hence refute the efficient market hypothesis. Most of these anomalies are empirical anomalies, suggesting that over a specified period certain information could have been used to earn abnormal, risk-adjusted returns. There is no guarantee that they will provide anomalous returns in the future. Some popular ones are: (a) The January effect is the term applied to the tendency for small stocks’ prices to go up during the month of January. (b) The P/E effect is the term applied to the tendency for low P/E stocks to outperform high P/E stocks. (c) The size effect is the term applied to the tendency for investments in the common stock of small firms to outperform investment in large firms.
Learning Outcome: Explain the challenges of random walks & efficient market theories
9.10 What are the implications of random walks and efficient markets for technical analysis? For fundamental analysis? Do random walks and efficient markets mean that technical analysis and fundamental analysis are useless? Explain.Random walks offer a serious challenge to technical analysis. If price fluctuations are purely random, charts of past behavior cannot produce significant trading profits. If the market is efficient, shifts in supply and demand occur so rapidly that technical measures simply measure the past and have no implications for the future. What’s more, in an efficient market, extreme competition among investors will keep security prices at or very close to their justified levels, so fundamental analysis will not lead to returns above those required by the amount of risk exposure. If markets are efficient, benefits from technical analysis are minimal. Fundamental analysis should still be utilized, however, to identify fundamentally strong (and weak) firms. So, even if firms are not undervalued, analysis can be directed to and used in the selection of fundamentally strong stocks.
Learning Outcome: Explain psychological factors that affect investors’ decisions9.12 Briefly explain how behavioral finance can affect each of the following:
a. The predictability of stock returns.b. Investor behavior.c. Analyst behavior.(a) Since investors tend to extrapolate past bad news into the future to an extent that would not be justified based on the information alone, one should sell firms that have done poor recently (say over the past 6 to 12 months) and buy firms that have done poorly over a longer period of time (say over the past 3 or 5 years). Also, investors tend to be overly optimistic about growth stocks, resulting in lower subsequent returns than earned on value stocks. (b) Investors who feel they have superior information tend to trade more, and consequently earn lower net returns due to higher transactions costs. Investors tend to
- 58 -

FACULTY OF ENGINEERING AND SCIENCEUKFF3283 PORTFOLIO MANAGEMENT
exhibit loss aversion, by hanging on to shares that have declined and selling those that have increased. (c) Analysts tend to exhibit “herding” behavior, by issuing similar recommendations or earnings forecasts for stocks. They also tend to be optimistic. Research has shown that hyped stocks tend to underperform the market.
Learning Outcome: Explain psychological factors that affect investors’ decisionsQ9.5 Briefly define each of the following terms, and describe how it can affect
investors’ decisions:a. Loss aversionb. Representativenessc. Narrow framingd. Overconfidencee. Biased self-attribution
Several of the key assumptions about investor behavior that serve as a basis for behavioral finance are given below. (a) Loss aversion is the tendency for individuals to dislike losses more than they like gains. As a consequence, investors hold on to losing stocks in hopes that they will bounce back. (b) Representativeness reflects an individual’s tendency to make strong conclusions from limited samples. A successful stock analyst over the past three years is not necessarily going to be correct again. Across the thousands of stock analysts, there are some that make good decisions by random chance. (c) Investors guilty of narrow framing analyze an investment on its own merits without considering how that security correlates with the other investments in their portfolio. They might end up with an undiversified portfolio. (d) Investors might become overconfident in their judgments. Three consequences are that they might underestimate the amount of risk, make unduly positive forecasts, and participate in excessive trading. (e) Investors guilty of biased self-attribution will take undue credit for good selections and blame others for bad decisions. If these investors pick an above-average mutual fund, it is to their supposed credit, but if the mutual fund does poorly these individuals will blame the portfolio manager for bad selection and/or timing. These individuals place more value on information that agrees with their selections
Learning Outcome: Compute moving average
- 59 -
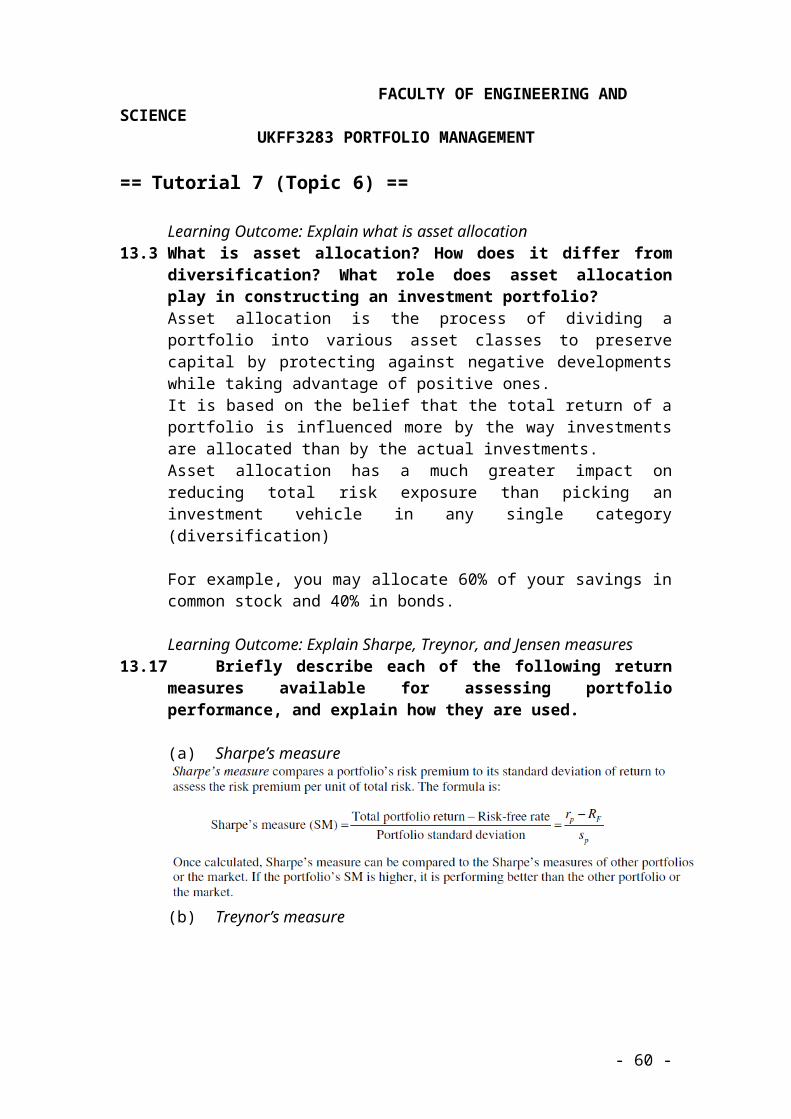
FACULTY OF ENGINEERING AND SCIENCEUKFF3283 PORTFOLIO MANAGEMENT
P9.10 You find the closing prices for a stock you own. You want to use a 10-day moving average to monitor the stock. Calculate the 10-day moving average for days 11 through 20. Based on the data in the table below, are there any signals you should act on? Explain.
Day Closing Price Day Closing Price 1 $25.25 11 $30.00 2 26.00 12 30.00 3 27.00 13 31.00 4 28.00 14 31.50 5 27.00 15 31.00 6 28.00 16 32.00 7 27.50 17 29.00 8 29.00 18 29.00 9 27.00 19 28.00 10 28.00 20 27.00
MA 11 = $ 27.75MA 12 = $ 28.15MA 13 = $ 28.55MA 14 = $ 28.90MA 15 = $ 29. 30MA 16 = $ 29.30MA 17 = $ 29.85 > closing price ( selling signal)MA 18 = $ 29.85MA 19 = $ 29.95MA 20 = $ 29.85If the closing price fell below the 10-day moving average, it indicates a selling signal. In this case, stock on 17th day should be sold.
- 60 -
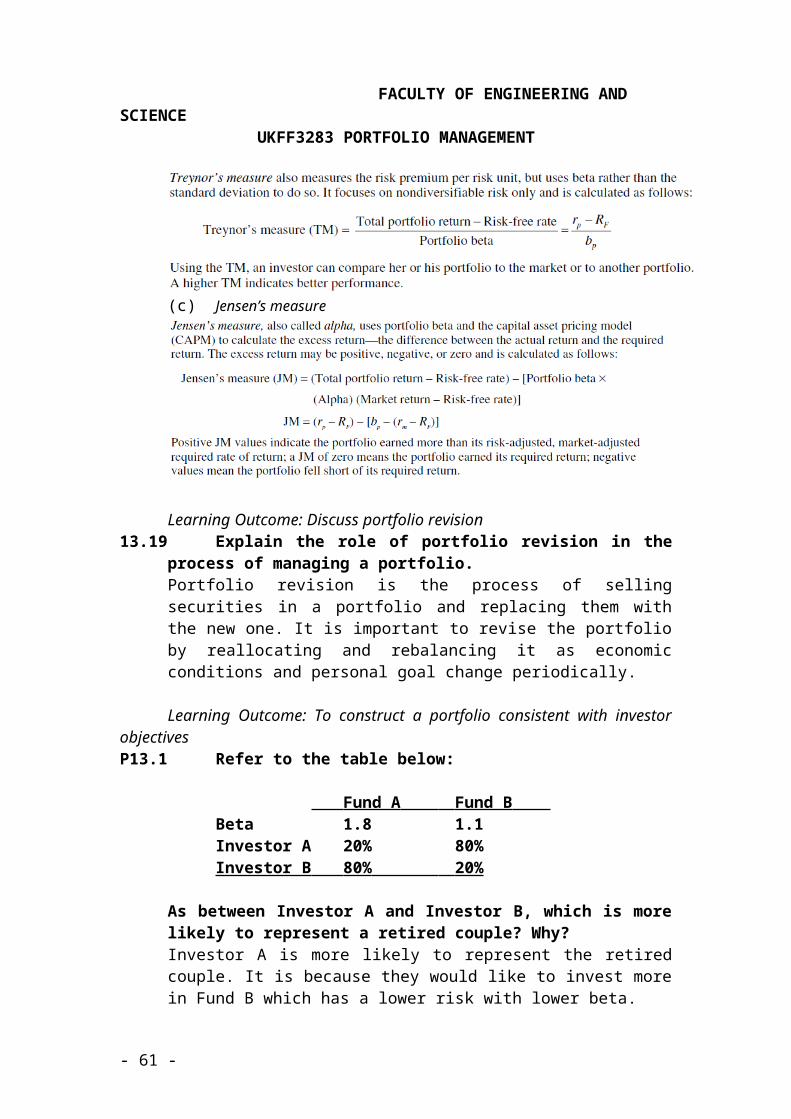
FACULTY OF ENGINEERING AND SCIENCEUKFF3283 PORTFOLIO MANAGEMENT
== Tutorial 11 (Topic 10) ==
Learning Outcome: Explain basic investment attributes of bonds 10.3 Identify and briefly describe the five types of risk to which bonds are
exposed. What is the most important source of risk for bonds in general? Explain.Bonds are exposed to the following five major types of risk: (1) Interest rate risk: This affects the market as a whole and therefore translates into market risk. When market interest rates rise, bond prices fall, and vice versa. (2) Purchasing power risk: This is the risk caused by inflation. When inflation heats up, bond yields lag behind inflation rates. A bond investor is locked into a fixed-coupon bond even though market yields are rising with inflation. (3) Business/financial risk: This refers to the risk that the issuer will default on interest and/or principal payments. Business risk is related to the quality and integrity of the issuer, whereas financial risk relates to the amount of the issuer’s leverage. Treasury securities are free of this risk, although it is an important consideration for corporate and municipal bonds. (4) Liquidity risk: This is the risk that a bond will be difficult to sell if the investor wishes to do so. The bond market is primarily over-the-counter in nature, and much of the activity occurs in the primary/new issue market. With the exception of the Treasury market and most of the agency market, there is not much of a secondary market for most bonds. (5) Call risk: This refers to the risk that a bond will be retired before its scheduled maturity date. When a bond is called, the bondholders are cashed out of their investment and must then find alternative investment outlets that may have lower yields. The most important source of risk for bonds in general is interest rate risk. It is the major cause of price volatility in the bond market. As interest rates become more volatile, so do bond prices.
Learning Outcome: Explain basic investment attributes of bonds
- 61 -

FACULTY OF ENGINEERING AND SCIENCEUKFF3283 PORTFOLIO MANAGEMENT
10.4 Can issue characteristics (such as coupon and call features) affect the yield and price behavior of bonds? Explain.Issue characteristics (such as call feature and coupon) do indeed affect the yield and price behavior of a bond. For example, high-coupon bonds have higher yields than low-coupon bonds; bonds that are freely callable provide higher yields than bonds that are non-callable; usually (although not always) long maturities yield more than short maturities. With respect to price volatility, bonds with lower coupons and/or longer maturities will respond more vigorously to changes in market interest rates and therefore have greater price volatility than short-maturity and/or high-coupon bonds.
Learning Outcome: Explain basic investment attributes of bonds 10.6 What is the difference between a premium bond and a discount bond?
What three attributes are most important in determining an issue’s price volatility?The difference between a premium and a discount bond illustrates the inverse relationship between bond prices and market interest rates. A premium bond sells for more than its par value, which occurs when market interest rates drop below the bond’s coupon rate. In contrast, a discount bond sells for less than par and is the result of market rates rising above the coupon rate. The factors that affect a bond’s price, volatility are interest rates, coupon and maturity of the issue. The greater the moves in interest rates, the greater the swings in bond prices. Bonds with lower coupons and/or longer maturities respond more vigorously to changes in market rates and therefore undergo sharper price swings.
Learning Outcome: Explain basic investment attributes of bonds 10.7 What are bond ratings, and how can they affect investor returns? What
are split ratings?
Bond ratings : letter grades that designate investment quality
Ratings basically point to the default risk of an issue. Higher ratings mean that issues are investment grade. Lower ratings mean that issues are in the junk category and more speculative. The higher the rating, the lower the default risk and, hence, the lower the yield of an obligation. A lower rating means that the investor must assume more of the default risk and has to be compensated with a higher yield. Further, investment grade securities are far more interest sensitive and tend to exhibit more uniform price behavior than junk bonds and other lower-rated issues.
Split ratings : a security which is given different ratings by two or more major rating agencies
Learning Outcome: Explain the behavior of market interest rates Q11.1 Briefly describe each of the following theories of the term structure of
interest rates.
- 62 -
FACULTY OF ENGINEERING AND SCIENCEUKFF3283 PORTFOLIO MANAGEMENT
a. Expectations hypothesisb. Liquidity preference theoryc. Market segmentation theory
According to these theories, what conditions would result in a downward-sloping yield curve? What conditions would result in an upward-sloping yield curve? Which theory do you think is most valid, and why?Expectations hypothesis: The yield curve reflects investor expectations above all else. Future behavior of interest rates with respect to the present is affected most by expectations regarding inflation. Higher expected inflation requires higher interest rates today. The result is an upward-sloping yield curve. To produce a downward-sloping yield curve under this hypothesis, the expected future inflation would be lower, but the current rates would remain higher. Liquidity preference theory: Long-term bond rates should be higher than shorter-term due to the condition there are more liquid market rates in the short term. Uncertainty increases over time causing the demand for a higher risk premium (bond interest rate). This theory expects upward-sloping yield curves. Downward-sloping curves would not occur in this theory since it would contradict the basic notion that uncertainty increases with time and the risk premium adjusts accordingly. Market Segmentation theory: The debt market is segmented according to length of maturity and preferences. An equilibrium exists in the short term between suppliers and demanders of funds. There are different inhabitants in each segment with different motivations. In the short term, banks predominate, but in the long term, life insurance and real estate firms determine the equilibriums. In this theory, yield curves may be either upward- or downward-sloping, as determined by the general relationship between rates in each market segment
Learning Outcome: Explain basic investment attributes of bonds P10.11 In early January 2001, you purchased $30,000 worth of some Baa-rated
corporate bonds. The bonds carried a coupon of 8 7/8% and mature in 2015. You paid 94.125 when you bought the bonds. Over the 5-year period from 2001 through 2005, the bonds were priced in the market as follows:
Quoted PricesBeginning of End of Year-End
Year the Year the Year Bond Yields 2001 94.125 100.625 8.82% 2002 100.625 102 8.70 2003 102 104.625 8.48 2004 104.625 110.125 8.05 2005 110.125 121.250 7.33
Coupon payments were made on schedule throughout the 5-year period.a. Find the annual holding period returns for 2001 through 2005. (See
Chapter 5 for the HPR formula.)
- 63 -

FACULTY OF ENGINEERING AND SCIENCEUKFF3283 PORTFOLIO MANAGEMENT
b. b. Use the return information in Table 10.1 to evaluate the investment performance of this bond. How do you think it stacks up against the market? Explain.
HPR = (Annual interest income + Capital gains) ÷ Price at beginning of year (a) (1) (2) (3)=(1)-(2) (4) (5)=(3)+(4) (6)=(5)÷(2)Year Ending price Beginning Price capital gain Annual income Total return HPR2001 $1,006.25 $941.25 $65 $88.75 $153.75 16.33%2002 1,020.00 1006.25 13.75 .88.75 102.50 10.19 2003 1,046.25 1020.00 26.25 88.75 115.00 11.28 2004 1,101.25 1,046.25 55.00 88.75 143.75 13.74 2005 1,212.50 1,101.25 111.25 88.75 200.00 18.16 (b) Evaluation of return performance:Annual HPR (%)Year A-rated corporate Bond market2001 16.33% 9.16% 2002 10.19 − 5.76 2003 11.28 9.18 2004 13.74 12.16 2005 18.16 11.95
Average 13.94 7.34 Looking at the average HPRs over the five-year period, we can conclude that the A-rated corporate bond has outperformed the market: 13.94 percent versus 7.34 percent. Also note that the A-rated corporate bond returns were less volatile(Minimum = 10.19% & Maximum = 18.16%) compared to the volatility of the bond market (Minimum = –5.76% & Maximum = 12.16%).
Learning Outcome: Identify different types of bondsP10.12 Rhett purchased a 13% zero-coupon bond with a l5-year maturity and a
$20,000 par value 15 years ago. The bond matures tomorrow. How much will Rhett receive in total from this investment, assuming all payments are made on these bonds as expected? ANS : $20,000. A zero-coupon bond trades at a discount to face value and pays no interest during its lifetime. At maturity, it pays par value.
Learning Outcome: Assess bond ratingsCase Problem 10.2 The Case of the Missing Bond Ratings
It's probably safe to say that there's nothing more important in determining a bond's rating than the underlying financial condition and operating results of the company issuing the bond. Just as financial ratios can be used in the analysis of common stocks, they can also be used in the analysis of bonds-a process we refer to as credit analysis. In credit analysis, attention is directed toward the basic liquidity and profitability of the firm, the extent to which the firm employs debt, and the ability of the firm to service its debt.
A Table of Financial Ratios(All ratios are real and pertain to real companies)
Company Company Company Company Company Company Financial Ratio 1 2 3 4 5 6_______ 1.Current ratio 1.13 x 1.39 x 1.78 x 1.32 x 1.03 x 1.41 x
- 64 -
FACULTY OF ENGINEERING AND SCIENCEUKFF3283 PORTFOLIO MANAGEMENT
2. Quick ratio 0.48 x 0.84 x 0.93 x 0.33 x 0.50 x 0.75 x 3. Net profit margin 4.6% 12.9% 14.5% 2.8% 5.9% 10.0% 4. Return on total 15.0% 25.9% 29.4% 11.5% 16.8% 28.4% capital5. Long-term debt 63.3% 52.7% 23.9% 97.0% 88.6% 42.1% to total capital6. Owners' equity 18.6% 18.9% 44.1% 1.5% 5.1% 21.2% ratio7. Pretax interest 2.3 x 4.5 x 8.9 x 1.7 x 2.4 x 6.4% coverage8. Cash flow to 34.7% 48.8% 71.2% 20.4% 30.2% 42.7% total debt__________________________________________________________
Notes:
Ratio (2)-Whereas the current ratio relates current assets to current liabilities, the quick ratio considers only the most liquid current assets (cash, short-term securities, and accounts receivable) and relates them to current liabilities.Ratio (4)-Relates pretax profit to the total capital structure (long-term debt + equity) of the firm.Ratio (6)-Shows the amount of stockholders' equity used to finance the firm (stockholders' equity + total assets).Ratio (8)-Looks at the amount of corporate cash flow (from net profits + depreciation) relative to the total (current + long-term) debt of the firm the other four ratios are as described in Chapter 6. The financial ratios shown on the previous page are often helpful in carrying out such analysis: (1) current ratio, (2) quick ratio, (3) net profit margin, (4) return on total capital, (5) long-term debt to total capital, (6) owners' equity ratio, (7) pretax interest coverage, and (8) cash flow to total debt. The first 2 ratios measure the liquidity of the firm, the next 2 its profitability, the following 2 the debt load, and the final 2 the ability of the firm to service its debt load. (For ratio 5, the lower the ratio, the better. For all the others, the higher the ratio, the better.) The following table lists each of these ratios for 6 different companies.
Questionsa. Three of these companies have bonds that carry investment-grade ratings. The other 3 companies carry junk-bond ratings. Judging by the information in the table, which 3 companies have the investment-grade bonds and which 3 have the junk bonds? Briefly explain your selections.
b. One of these 6 companies is a AAA-rated firm and one is B-rated. Identify those 2 companies. Briefly explain your selection.
c. Of the remaining 4 companies, 1 carries a AA rating, 1 carries an A rating, and 2 are BB-rated. Which companies are they?
- 65 -
FACULTY OF ENGINEERING AND SCIENCEUKFF3283 PORTFOLIO MANAGEMENT
== Tutorial 12 (Topic 11) ==
Learning Outcome: Explain the behavior of market interest rates 11.3 What is the term structure of interest rates, and how is it related to the
yield curve? What information is required to plot a yield curve? Describe an upward-sloping yield curve and explain what it has to say about the behavior of interest rates. Do the same for a flat yield curve.The term structure of interest rates is the relationship between the interest rate or yield and the time to maturity for any class of similar risk securities. The yield curve is just a graphic representation of the term structure of interest rates at a given point in time. To plot a yield curve, you need to know the yield to maturity for different maturities of similar risk bonds. As market conditions change, the yield curve’s shape and location also change. The upward-sloping yield curve indicates that yields tend to increase with longer maturities. The longer a bond has to go to maturity, the greater the potential for price volatility and the risk of loss. Thus, investors require higher yields on longer maturity bonds. Flat yield curves indicate that yields will be the same across maturities. Given that longer-term bonds have more default and maturity rate risk, a flat yield curve implies that inflation rates are expected to decline.
Learning Outcome: Explain the basic concept of duration 11.10 What does the term duration mean to bond investors, and how does the
duration of a bond differ from its maturity? What is modified duration, and how is it used?Duration is a measure of bond price volatility. It captures both price and reinvestment risks in a single measure and indicates how a bond’s price will react to different interest rate environments. It is the effective maturity of a fixed-income security. On the other hand, the bond’s actual maturity does not consider all of the bond’s cash flows nor does it consider the time value of money. Duration is a far superior measure of the effective timing of a bond’s cash flows, because it explicitly considers both the time value of money and the bond’s coupon and principal payments. When the market undergoes a big change in yield, duration will understate price appreciation when rates fall and overstate the price decline when rates increase. Modified duration is used to overcome this problem by linking interest rate changes to changes in bond price. First, you can compute the modified duration using the bond’s computed duration and the computed yield-to-maturity. Then, the change in bond price based upon a change in interest rates can be computed as follows: Percent change in bond price = –1 × Modified duration × Change in interest rates
Learning Outcome: Identify various bond investment strategies 11.13 What strategy would you expect an aggressive bond investor (someone
who’s looking for capital gains) to employ?An aggressive bond investor would employ the highly risky forecasted interest rate behavior strategy. The intent of this strategy is to take advantage of interest rate swings by timing the market. Usually these swings are short-lived, so aggressive bond traders will try to magnify their returns by trading on margin. These investors try to generate capital gains when interest rates are expected to decline and to preserve capital when an increase in interest rates is expected.
- 66 -

FACULTY OF ENGINEERING AND SCIENCEUKFF3283 PORTFOLIO MANAGEMENT
Learning Outcome: Calculate bond price and return P10.3 Zack buys a 10% corporate bond with a current yield of 6%. How much
did he pay for the bond?Interest = 0.1 × $1,000 = $100
$100/Price = 0.06 $100/0.06 = Price = $1,666.67
Learning Outcome: Calculate bond price and return P10.8 Which of the following three bonds offers the highest current yield?
a. A 9 ½ %, 20-year bond quoted at 97 ¾b. A 16%, 15-year bond quoted at 164 5/8.c. A 5 1/4 %, 18-year bond quoted at 54.
Learning Outcome: Calculate bond’s price P11.2 Using semiannual compounding, find the prices of the following bonds:
a. A 10.5%, 15-year bond priced to yield 8%.b. A 7%, 10-year bond priced to yield 8%.c. A 12%, 20-year bond priced at 10%.Repeat the problem using annual compounding. Then comment on the differences you found in the prices of the bonds.
- 67 -
FACULTY OF ENGINEERING AND SCIENCEUKFF3283 PORTFOLIO MANAGEMENT
• Overall, the difference between bond prices computed using either method are very small, ranging from 0.85 to 2.16.
• As the comparison demonstrates, if a bond sells at a premium its value is higher with semi-annual compounding.
• When it sells at a discount, its value is greater with annual compounding.
Learning Outcome: Apply various measures of yield and return P11.12 Assume that an investor is looking at 2 bonds: Bond A is a 20-year, 9% (semiannual pay) bond that is priced to yield 10.5%. Bond B is a 20-year, 8% (annual pay) bond that is priced to yield 7.5%. Both bonds carry 5-year call deferments and call prices (in 5 years) of $1,050.
a. Which bond has the higher current yield?b. Which bond has the higher YTM?c. Which bond has the higher YTC?Current Yield:
- 68 -

FACULTY OF ENGINEERING AND SCIENCEUKFF3283 PORTFOLIO MANAGEMENT
b) Bond A
Bond B
c)
- 69 -

FACULTY OF ENGINEERING AND SCIENCEUKFF3283 PORTFOLIO MANAGEMENT
Learning Outcome: Apply various measures of yield and return P11.17 Using annual compounding, find the yield-to-maturity for each of the
following bonds.a. A 9.5%, 20-year bond priced at $957.43.b. A 16%, 15-year bond priced at $1,684.76. c. A 5.5%, 18-year bond priced at $510.65.
Now assume that each of the above three bonds is callable as follows: Bond a is callable in 7 years at a call price of $1,095; bond b is callable in 5 years at $1,250; and bond c is callable in 3 years at $1,050. Use annual compounding to find the yield-to-call for each bond.a) Using financial calculator:-PMT = 95, FV = 1000, PV = -957.43, N = 20, CPT I/YYield to maturity = 10%Assume is callable:-PMT = 95, FV = 1095, PV = -957.43, N = 7, CPT I/YYield to call = 11.37%b) Using financial calculator:-PMT = 160, FV = 1000, PV = -1684.76, N = 15, CPT I/YYield to maturity = 8%Assume is callable:-PMT = 160, FV = 1250, PV = -1684.76, N = 5, CPT I/YYield to call = 4.8089%c) Using financial calculator:-PMT = 55, FV = 1000, PV = -510.65, N = 18, CPT I/YYield to maturity = 12.42%Assume is callable:-PMT = 55, FV = 1050, PV = -510.65, N = 3, CPT I/YYield to call = 35.89%
Learning Outcome: Apply the basic concept of duration P11.21 Find the Macaulay duration and the modified duration of a 20-year, 10%
corporate bond priced to yield 8%. According to the modified duration of this bond, how much of a price change would this bond incur if market yields rose to 9%? Using annual compounding, calculate the price of this bond in 1 year if rates do rise to 9%. How does this price change compare to that predicted by the modified duration? Explain the difference.
• To calculate the duration of the bond, first calculate the bond’s current market price:
• Bond terms: 10% coupon, 20 years, 8% YTM • Price = $100 × PVIFA8%,20 yrs. + $1,000 × PVIF8%,20 yrs. = $100 × 9.818 + $1,000
× 0.215 = $981.80 + $215 = $1,196.80
- 70 -
FACULTY OF ENGINEERING AND SCIENCEUKFF3283 PORTFOLIO MANAGEMENT
• Modified duration = Duration in years ÷ (1 + Yield to maturity) = 10.19 ÷ 1.08 = 9.44% change in bond price = –1 × Modified duration × change in interest rates = –1 × 9.44 × 1% = –9.44%
• If market yields rise 1 percent, the price of the bond will fall by 9.44 percent:
• Price in one year = $100 × PVIFA9%,19 yrs. + $1,000 × PVIF9%,19 yrs = $100 × 8,950 + $1,000 × 0.194= $1,089
• The change in bond price is –$107.80, or 9 percent of the purchase price. The change in price using the modified duration method is 9.44 percent, overstating the actual price change by 0.44 percent.
• Duration is therefore not a good predictor of price volatility if interest rates undergo a big swing. Since the price-yield relationship of a bond is convex in form—but duration is not—the duration measure will overstate the price decline as the market experiences a big increase in rates. Here, although better, the modified duration overstated the decline by almost 0.5 percent.
- 71 -

FACULTY OF ENGINEERING AND SCIENCEUKFF3283 PORTFOLIO MANAGEMENT
== Tutorial 13 (Topic 12) ==
Learning Outcome: Discuss the basic nature of options 14.1 Describe put and call options. Are they issued like other corporate
securities?
Learning Outcome: Discuss the basic nature of options 14.3 What are the main investment attractions of put and call options? What
are the risks?
Learning Outcome: Discuss the basic nature of options 14.5 What is a strike price? How does it differ from the market price of the
stock?
Learning Outcome: Discuss the basic nature of options 14.6 Why do put and call options have expiration dates? Is there a market for
options that have passed their expiration dates?
Learning Outcome: Describe the profit potential of puts and calls 14.7 Explain briefly how you would make money on (a) a call option and (b) a
put option. Do you have to exercise the option to capture the profit?
Learning Outcome: Describe the profit potential of puts and calls P14.6 You believe that oil prices will be rising more than expected, and that
rising prices will result in lower earnings for industrial companies that use a lot of petroleum related products in their operations. You also believe that the effects on this sector will be magnified because consumer demand will fall as oil prices rise. You locate an exchange traded fund, XLB, that represents a basket of industrial companies. You don't want to short the ETF because you don't have enough margin in your account. XLB is currently trading at $23. You decide to buy a put option (for 100 shares) with a strike price of $24, priced at $1.20. It turns out that you are correct. At expiration, XLB is trading at $20. Calculate your profit.
XLB: Materials-$23.00Calls Puts
Strike Expiration Price Strike Expiration Price $20 November $0.25 $20 November $1.55 $24 November $0.25 $24 November $1.20
- 72 -

FACULTY OF ENGINEERING AND SCIENCEUKFF3283 PORTFOLIO MANAGEMENT
Learning Outcome: Describe the profit potential of puts and calls P 14.7 Refer to the table for XLB in Problem 14.6. What happens if you are
wrong and the price of XLB increases to $25 on the expiration date?
Learning Outcome: Explain how put and call options are valuedLearning Outcome: Describe the profit potential of puts and calls Case Problem 14.1 The Franciscos’ Investment Options
Hector Francisco is a successful businessman in Atlanta. The box-manufacturing firm he and his wife, Judy, founded several years ago has prospered. Because he is self employed, Hector is building his own retirement fund. So far, he has accumulated a substantial sum in his investment account, mostly by following an aggressive investment posture. He does this because, as he puts it, "In this business, you never know when the bottom's gonna fall out." Hector has been following the stock of Rembrandt Paper Products (RPP), and after conducting extensive analysis, he feels the stock is about ready to move. Specifically, he believes that within the next 6 months, RPP could go to about $80 per share, from its current level of $57.50. The stock pays annual dividends of $2.40 per share. Hector figures he would receive two quarterly dividend payments over his 6-month investment horizon.
In studying RPP, Hector has learned that the company has 6-month call options (with $50 and $60 strike prices) listed on the CBOE. The CBOE calls are quoted at $8 for the options with $50 strike prices and at $5 for the $60 options.
Questions
a. How many alternative investment vehicles does Hector have if he wants to invest in RPP for no more than 6 months? What if he has a 2-year investment horizon?
b. Using a 6-month holding period and assuming the stock does indeed rise to $80 over this time frame:
1. Find the value of both calls, given that at the end of the holding period neither contains any investment premium.2. Determine the holding period return for each of the 3 investment alternatives open to Hector Francisco.
c. Which course of action would you recommend if Hector simply wants to maximize profit? Would your answer change if other factors (e.g., comparative risk exposure) were considered along with return? Explain.
- 73 -
FACULTY OF ENGINEERING AND SCIENCEUKFF3283 PORTFOLIO MANAGEMENT
Learning Outcome: Explain how put and call options are valuedLearning Outcome: Describe the profit potential of puts and calls Case Problem 14.2 Fred’s Quandary: To Hedge or Not to Hedge
A little more than 10 months ago, Fred Weaver, a mortgage banker in Phoenix, bought 300 shares of stock at $40 per share. Since then, the price of the stock has risen to $75 per share. It is now near the end of the year, and the market is starting to weaken. Fred feels there is still plenty of play left in the stock but is afraid the tone of the market will be detrimental to his position. His wife, Denise, is taking an adult education course on the stock market and has just learned about put and call hedges. She suggests that he use puts to hedge his position. Fred is intrigued by the idea, which he discusses with his broker, who advises him that the needed puts are indeed available on his stock.Specifically, he can buy 3-month puts, with $75 strike prices, at a cost of $550 each (quoted at 5.50).
Questions
a. Given the circumstances surrounding Fred's current investment position, what benefits could be derived from using the puts as a hedge device? What would be the major drawback?
b. What will Fred's minimum profit be if he buys 3 puts at the indicated option price? How much would he make if he did not hedge but instead sold his stock immediately at a price of $75 per share?
c. Assuming Fred uses 3 puts to hedge his position, indicate the amount of profit he will generate if the stock moves to $100 by the expiration date of the puts. What if the stock drops to $50 per share?
d. Should Fred use the puts as a hedge? Explain. Under what conditions would you urge him not to use the puts as a hedge?
- 74 -

FACULTY OF ENGINEERING AND SCIENCEUKFF3283 PORTFOLIO MANAGEMENT
== Tutorial 14 (Topic 13) ==Learning Outcome: Describe the essential features of a futures contract
15.1 What is a futures contract? Briefly explain how it is used as an investment vehicle.
Learning Outcome: Describe the essential features of a futures contract15.2 Discuss the difference between a cash market and futures market.
Learning Outcome: Describe futures contract’s income15.8 What is the one source of return on futures contracts? What measure is
used to calculate the return on a commodities contract?
Learning Outcome: Explain the difference between a physical commodity and a financial future
15.10 What is the difference between physical commodities and financial futures? What are their similarities?
Learning Outcome: Describe stock index futures
15.12 Discuss how stock-index futures can be used for speculation and for hedging. What advantages are there to speculating with stock-index futures rather than specific issues of common stock?
Learning Outcome: Calculate futures contract’s returnP15.1 Jeff Rink considers himself a shrewd commodities investor. Not long ago
he bought one July cotton contract at $0.54 a pound, and he recently sold it at $0.58 a pound. How much profit did he make? What was his return on invested capital if he had to put up a $1,260 initial deposit?
Learning Outcome: Explain the role and apply approaches to trade stock-index futuresCase Problem 15.2 Jim and Polly Pernelli Try Hedging with Stock-Index Futures
Jim Pernelli and his wife, Polly, live in Augusta, Georgia. Like many young couples, the Pernellis are a 2-income family. Jim and Polly are both college graduates and hold high paying jobs. Jim has been an avid investor in the stock market for a number of years and over time has built up a portfolio that is currently worth nearly $375,000. The Pernellis' portfolio is well diversified, although it is heavily weighted in high-quality, mid-cap growth stocks. The Pernellis reinvest all dividends and regularly add investment capital to their portfolio. Up to now, they have avoided short selling and do only a modest amount of margin trading.
Their portfolio has undergone a substantial amount of capital appreciation in the last 18 months or so, and Jim is eager to protect the profit they have earned. And that's the problem: Jim feels the market has pretty much run its course and is about to enter a period of decline. He has studied the market and economic news very carefully and does not believe the retreat will cover an especially long
- 75 -

FACULTY OF ENGINEERING AND SCIENCEUKFF3283 PORTFOLIO MANAGEMENT
period of time. He feels fairly certain, however, that most, if not all, of the stocks in his portfolio will be adversely affected by these market conditions-though some will drop more in price than others.Jim has been following stock-index futures for some time and believes he knows the ins and outs of these securities pretty well. After careful deliberation, Jim and Polly decide to use stock-index futures-in particular, the S&P MidCap 400 futures contract-as a way to protect (hedge) their portfolio of common stocks.
Questions
a. Explain why the Pernellis would want to use stock-index futures to hedge their stock portfolio, and how they would go about setting up such a hedge. Be specific.1. What alternatives do Jim and Polly have to protect the capital value of their portfolio?2. What are the benefits and risks of using stock-index futures as hedging vehicles?
b. Assume that S&P MidCap 400 futures contracts are currently being quoted at 769.40. How many contracts would the Pernellis have to buy (or sell) to set up the hedge?1. Say the value of the Pernelli portfolio dropped 12 % over the course of the market retreat. To what price must the stock-index futures contract move in order to cover that loss?2. Given that a $16,875 margin deposit is required to buy or sell a single S&P 400 futures contract, what would be the Pernellis' return on invested capital if the price of the futures contract changed by the amount computed in part b1, above?
c. Assume that the value of the Pernelli portfolio declined by $52,000, while the price of an S&P 400 futures contract moved from 769.40 to 691.40. (Assume that Jim and Polly short sold one futures contract to set up the hedge.) 1. Add the profit from the hedge transaction to the new (depreciated) value of the stock portfolio. How does this amount compare to the $375,000 portfolio that existed just before the market started its retreat?2. Why did the stock-index futures hedge fail to give complete protection to the Pernelli portfolio? Is it possible to obtain perfect (dollar-for-dollar) protection from these types of hedges? Explain.
- 76 -