Portfolio Formation with Illiquid Assets - Northfield · Portfolio Formation with Illiquid Assets...
24
www.northinfo.com Portfolio Formation with Illiquid Assets Dan diBartolomeo Asia Pacific Seminars October 2012
Transcript of Portfolio Formation with Illiquid Assets - Northfield · Portfolio Formation with Illiquid Assets...

www.northinfo.com
Portfolio Formation with Illiquid Assets
Dan diBartolomeo Asia Pacific Seminars
October 2012

www.northinfo.com
Introduction
• In recent years many long-term investors, particularly large university endowments, have shifted their asset allocations to include very large commitments to illiquid investments such as real estate and private equity • They are now dealing with two new risks • Inability to liquidate investment assets for consumption • Loss of the “option to rebalance” leading to sub-optimal allocations
• In many cases, these asset owners formally ignore the volatility and correlation of such asset classes as either irrelevant or unable to be reliably estimated, leading to sub-optimal asset allocations with arbitrary default weights (e.g. 5% for real estate and 5% for private equity)
• In almost all cases the underlying economic drivers between illiquid and traded asset classes are equally left unexplored.

www.northinfo.com
Goals for the Presentation • We will begin with a review of relevant research
• We will then propose a method to estimate exposures of illiquid investments to
factors typically used in risk models of marketable securities, allowing for a comprehensive estimation of return and risk across all asset classes.
• Empirical data on the economic linkages between real property and other asset classes will be presented.
• Finally, we will propose an approach to estimating the fair return premium to compensate investors for liquidity risk.
• Our proposed methods taken together allow for a robust and unified approach to asset allocation across all asset classes.

www.northinfo.com
The Basic Recipe • We will employ a traditional mean-variance asset allocation process • Risks and correlations across all asset classes, including illiquid assets will be
estimated from a unified factor model • Index returns are not used • For liquid asset classes asset class volatility and correlation estimates are done
from the security level upward, using the current constituents and weights of the representative market index
• For illiquid assets such as real estate and private equity, we will generate factor loadings from proxy portfolios of marketable securities with similar underlying economic drivers
• Expected returns for illiquid asset classes will be subject to several adjustments • Expected returns decline with investment (you do whatever you think are the
best deals first) • You lose the option to rebalance the portfolio when asset weights are off their
optimum levels
www.northinfo.com
A New Incentive in the Mix
• Many advocates of illiquid investments have argued that the lack of transparency in the valuation of illiquid assets is positive since it gives the asset owner the option to not recognize that the value of illiquid assets has declined unless the asset is actually sold • To my mind this is intentional denial of reality
• Effective November 15th, 2007 many entities are required to follow FASB Rule 157 which effectively requires a “mark to market” for all (including illiquid assets) assets where a fair value representation is required under GAAP • Many private equity partnerships are starting to report on a FASB 157
basis but other areas (real estate, timber farms) are moving more slowly
www.northinfo.com
An Important Caveat
• Our approach to estimating risk for illiquid assets that is the key component of this presentation can be labor intensive in terms of analyst time • Real estate is analyzed building by building • Private equity and venture capital are analyzed at the level of each end
investment, and aggregated to the partnership level
• Many asset owners participate in illiquid investments through partnership interests • Many general partners (asset manager) do not provide much detail about the
underlying investments of the partnership, some citing privacy concerns for the other limited partners
• Some large funds (e.g. Washington State) own all their real estate outright
www.northinfo.com
Literature Review – Illiquid Assets • Optimal rebalancing in the presence of trading costs
• Constantinides (1986), Dumas and Luciano (1991), Dixit (1991) and Leland (1996) • There is a “no trade” band around the target asset allocation in the presence of
trading costs • If you are outside the acceptable band, rebalance as little as possible to get inside
the band • Given the very high transaction costs of illiquid assets, the no trade band become
prohibitively large
• Illiquid assets have another problem, lack of divisibility • You can’t realistically sell one floor of an office building, it’s all or none • Addressed in Bey, Burgess, Cook (1990) and Gold (1995) • Both use bootstrap resampling method as distinct from parametric resampling in
Michaud (1998) • Optimal weights are expressed as ranges rather than point values, subject to the
limitation of summing to 100%
www.northinfo.com
Literature Review -- Illiquid Assets • Buchner (2010) re-derives CAPM assuming low liquidity
• In low liquidity circumstances, a return premium should be associated with idiosyncratic risk, not with systematic risk
• The option to rebalance has the most economic value when correlations across assets are low
• Ang and Bollen (2008) • Uses “real option” methods to value lockup periods
• Ang, Papanikolaou and Westerfield (2011) • Assume illiquid assets can be traded only at random moments when there is someone
keen to be other side • Asset allocation process distorts as investor risk aversion varies to compensate for
liquidity risk when illiquid assets are over-weighted • This effect can be large demanding as much as a 6% annual return premium for a ten
year expected interval between opportunities to transact illiquid assets
www.northinfo.com
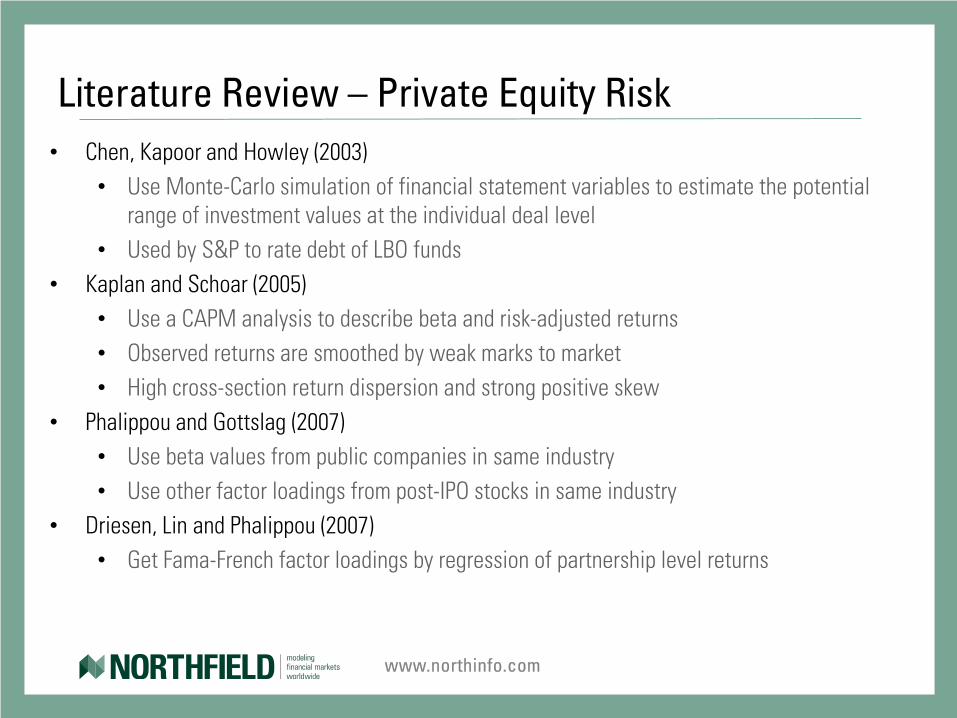
Literature Review – Private Equity Risk • Chen, Kapoor and Howley (2003)
• Use Monte-Carlo simulation of financial statement variables to estimate the potential range of investment values at the individual deal level
• Used by S&P to rate debt of LBO funds • Kaplan and Schoar (2005)
• Use a CAPM analysis to describe beta and risk-adjusted returns • Observed returns are smoothed by weak marks to market • High cross-section return dispersion and strong positive skew
• Phalippou and Gottslag (2007) • Use beta values from public companies in same industry • Use other factor loadings from post-IPO stocks in same industry
• Driesen, Lin and Phalippou (2007) • Get Fama-French factor loadings by regression of partnership level returns
www.northinfo.com
Literature Review Real Estate Risk
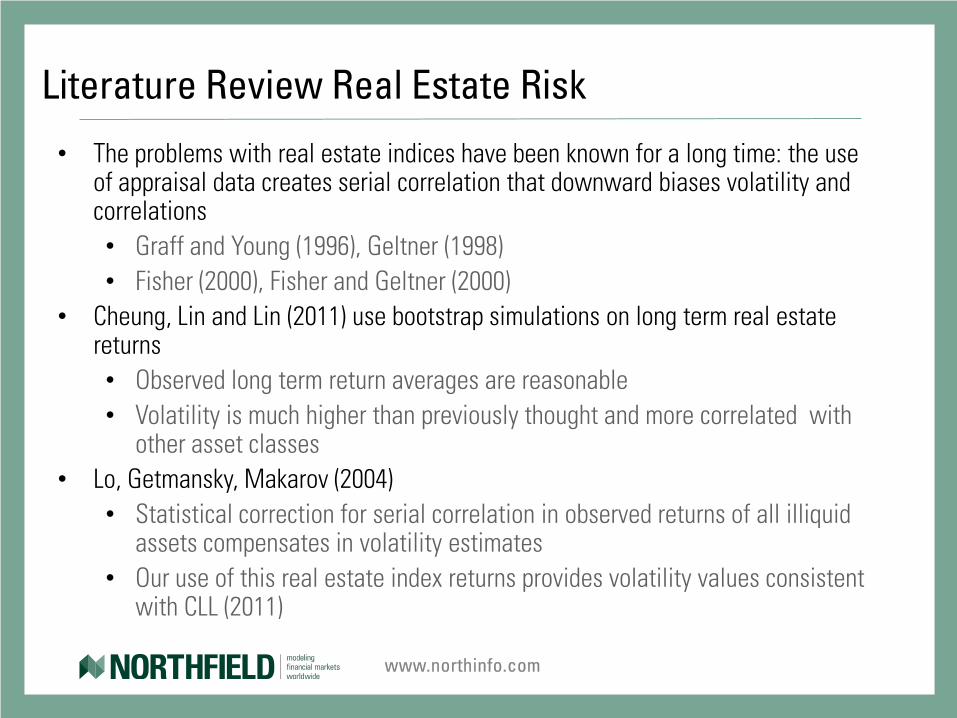
• The problems with real estate indices have been known for a long time: the use of appraisal data creates serial correlation that downward biases volatility and correlations • Graff and Young (1996), Geltner (1998) • Fisher (2000), Fisher and Geltner (2000)
• Cheung, Lin and Lin (2011) use bootstrap simulations on long term real estate returns • Observed long term return averages are reasonable • Volatility is much higher than previously thought and more correlated with
other asset classes • Lo, Getmansky, Makarov (2004)
• Statistical correction for serial correlation in observed returns of all illiquid assets compensates in volatility estimates
• Our use of this real estate index returns provides volatility values consistent with CLL (2011)
www.northinfo.com
The Key Idea
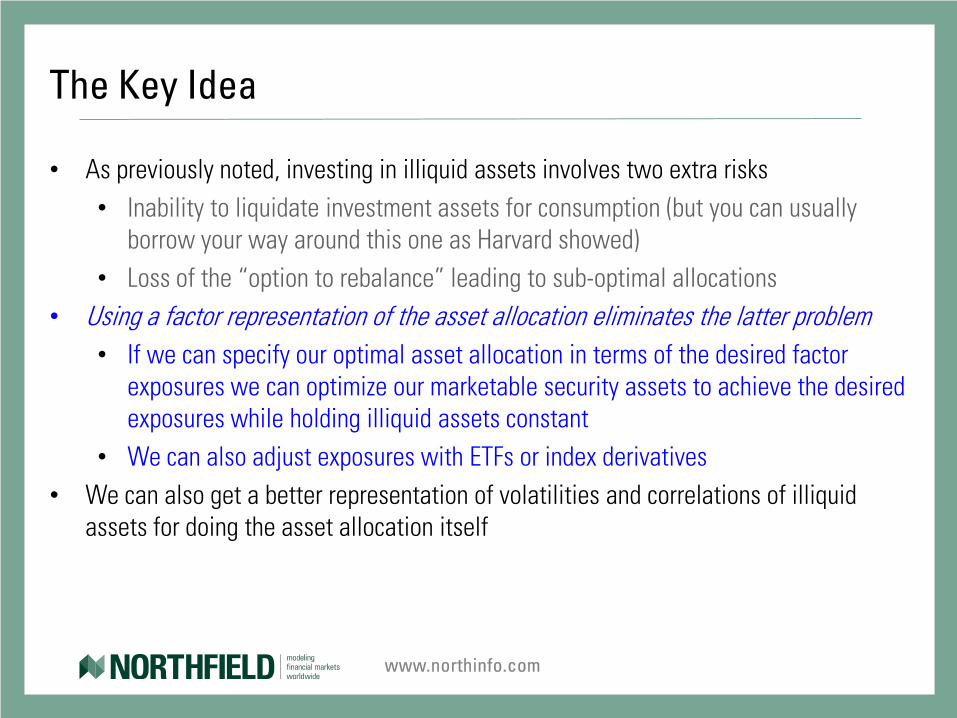
• As previously noted, investing in illiquid assets involves two extra risks • Inability to liquidate investment assets for consumption (but you can usually
borrow your way around this one as Harvard showed) • Loss of the “option to rebalance” leading to sub-optimal allocations
• Using a factor representation of the asset allocation eliminates the latter problem • If we can specify our optimal asset allocation in terms of the desired factor
exposures we can optimize our marketable security assets to achieve the desired exposures while holding illiquid assets constant
• We can also adjust exposures with ETFs or index derivatives • We can also get a better representation of volatilities and correlations of illiquid
assets for doing the asset allocation itself

www.northinfo.com
Factor Representation of Real Estate
• diBartolomeo, Belev, Gold and Baldwin (2004)
• A “bottom up” property-by-property approach
• Each property is treated as “composite asset”, a package of risk exposures to our model factors plus idiosyncratic risks
• The risk exposures of each property are of three basic types • Risks based on “steady-state” cash flow assumptions for existing and expected
leases • Risks based on volatility in inflationary influences on property value • Risks of future fluctuations in rents and occupancy • Risks related to mortgage financing

www.northinfo.com
Factor Representation of Real Estate
• Commercial property leases are treated like corporate bonds with extension options • We do detailed analysis of major tenant credit ratings, lease lengths, renewal rates,
times between rentals, and other “real estate” issues • Inflationary influence on rents and property value represented by inflation linked notes
• Volatility of rents and occupancy is related to the employment make up of the local economy • Demand for space is modeled as lagged function of cumulative stock market sector
returns • If you are Houston, Abu Dhabi or Calgary the health of the local economy has a lot to
do how the energy sector is doing • If you are in New York, London or Boston the finance sector dominates, while its
technology in Silicon Valley
www.northinfo.com
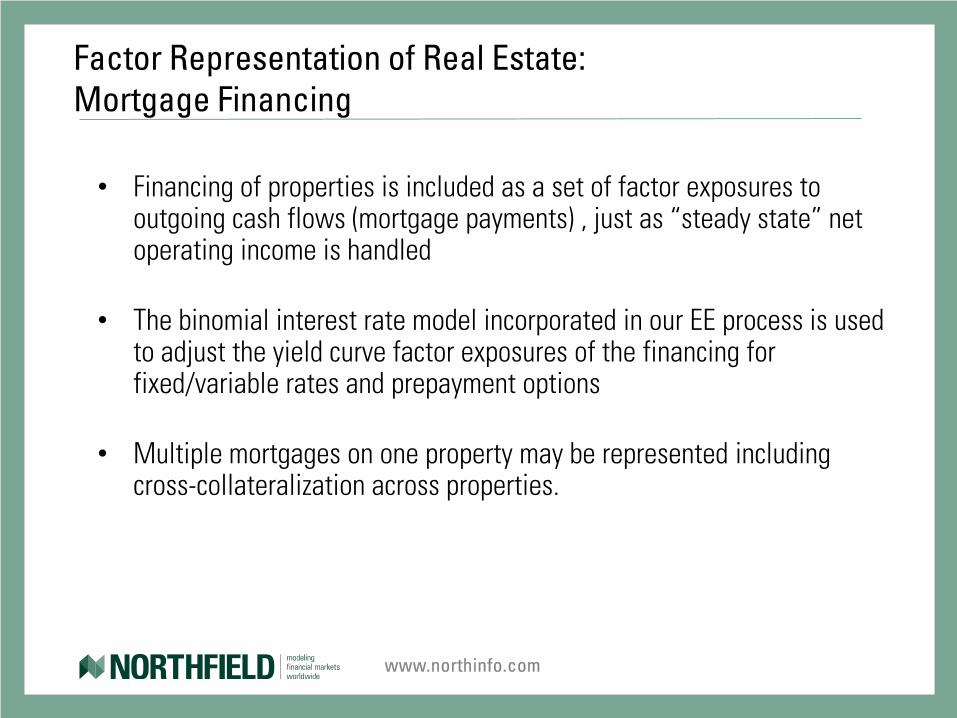
Factor Representation of Real Estate: Mortgage Financing • Financing of properties is included as a set of factor exposures to
outgoing cash flows (mortgage payments) , just as “steady state” net operating income is handled
• The binomial interest rate model incorporated in our EE process is used to adjust the yield curve factor exposures of the financing for fixed/variable rates and prepayment options
• Multiple mortgages on one property may be represented including cross-collateralization across properties.

www.northinfo.com
Factor Representation of Private Equity
• We look through to each underlying corporate investment made by a PE partnership
• For each firm in which an investment is made, a publicly traded proxy firm is selected • Matched on line of business, home country and size • Adjustments are made for the relative degree of balance sheet leverage
between the private and matching public firm
• Partnership level borrowing is accounted for a short position in a corporate bond portfolio
• “Lock up” and other liquidity restrictions are modeled as per Ang and Bollen (2008)

www.northinfo.com
Factor Representation of Other Illiquid Assets
Agricultural and timber land is modeled as a function of four components • A basket of agricultural commodity contracts • Timber commodity contract (forestry competes with agriculture land, and
residential development for land use) • A stock portfolio of traded agricultural and food processing firms • A portfolio of house builders (who buy most lumber and land to build)
Major infrastructure projects such as airports • A retail shopping mall in a given city as previously described • Gate leases (similar to airline corporate bonds or jet leasing notes) • A portfolio of the airline stocks that service a particular airport

www.northinfo.com
Factor Representation of Forward Funding Commitments
• Illiquid assets are often purchased over multiple years with explicit contractual commitments • For example, the investor will invest 50 Million GBP each year for four years to give the
partnership management time to consummate transactions • Such forward commitments represent a kind of leverage similar to futures contracts but
without the requirement to set the settlement price today • Future investments will usually be done at the then current market values so there is no
profit or loss in the interim • We also have a “term structure” of expected asset allocations as we may have to move
money from liquid to illiquid asset classes to fulfill deal requirements • A number of US universities ended up borrowing money to fund commitments during the
Global Financial Crisis
www.northinfo.com
An Empirical Illustration
• Many academic studies have tried to estimate unobservable real estate returns by hedging away the stock market influence on REIT returns and attributing the remainder as real estate return • Liang and Webb (1996), Chatrath(1999), Clayton and Mackinnon (2001) • Kim (2004) is the basis of the new FTSE property indices
• We will the following proxy portfolio to represent US direct real estate at each moment in time • 100% a portfolio of our cap weighted US REIT universe • 30% cash • -30% an S&P 500 ETF

www.northinfo.com
Teaching an Old Dog A New Trick
• For our model, we will use the original 1989 version of the Northfield US Macroeconomic seven factor model • Extension of Ross, Roll, Chen (1986) • Unexpected Inflation, Slope of Term Structure, Credit Risk Premium • Industrial Production, Housing Starts, Oil Prices, FX Rates/US$ • 60 month rolling sample period, slight exponential weight • Such models are often criticized as having too low an explanatory power to be
useful
• We’ll evaluate the ex-ante absolute volatility of the “proxy real estate portfolio using this model • We will do year end dates from 1996 through 2011
www.northinfo.com
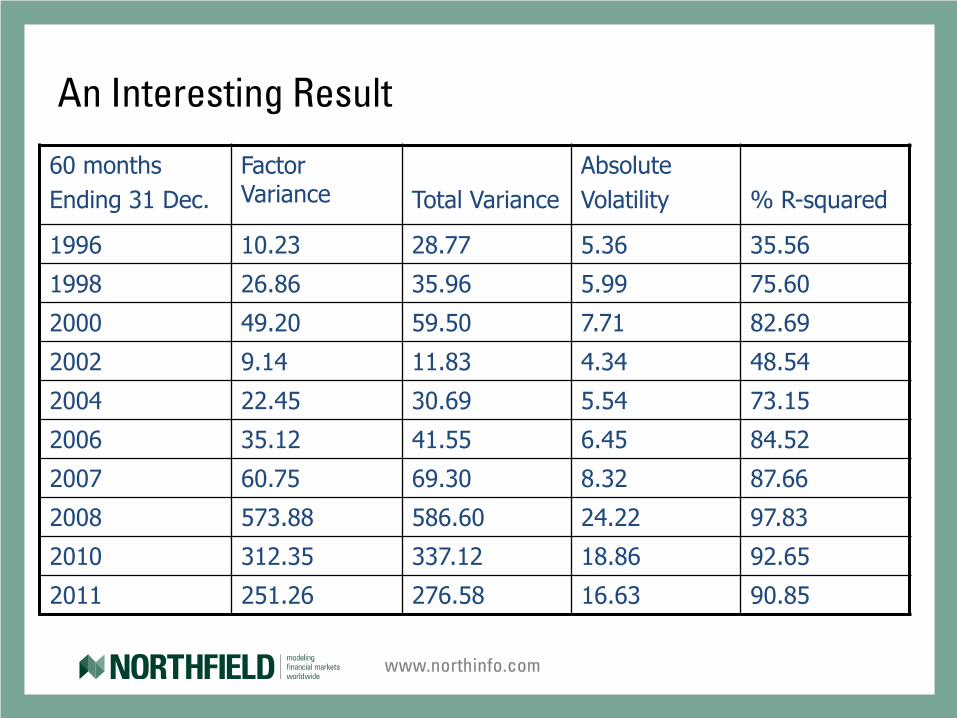
An Interesting Result
60 months Ending 31 Dec.
Factor Variance
Total Variance
Absolute Volatility
% R-squared
1996 10.23 28.77 5.36 35.56
1998 26.86 35.96 5.99 75.60
2000 49.20 59.50 7.71 82.69
2002 9.14 11.83 4.34 48.54
2004 22.45 30.69 5.54 73.15
2006 35.12 41.55 6.45 84.52
2007 60.75 69.30 8.32 87.66
2008 573.88 586.60 24.22 97.83
2010 312.35 337.12 18.86 92.65
2011 251.26 276.58 16.63 90.85
www.northinfo.com
Empirical Comments
• There is 71% correlation between the ex-ante volatility estimate and the factor R-squared of the Macroeconomic factor model
• During the 2004-2008 period leading to the GFC expected volatility rose to a very high level and the R-squared approaches 1, evidencing widespread belief that “top down” macro considerations totally dominated return behavior • Ex-ante R-squared has been consistently high since around 2005
• Given that the analytical model has been left untouched for twenty three years, it seems illustrative that real estate returns can be effectively modeled in common factor models that were originally intended for securities markets
www.northinfo.com
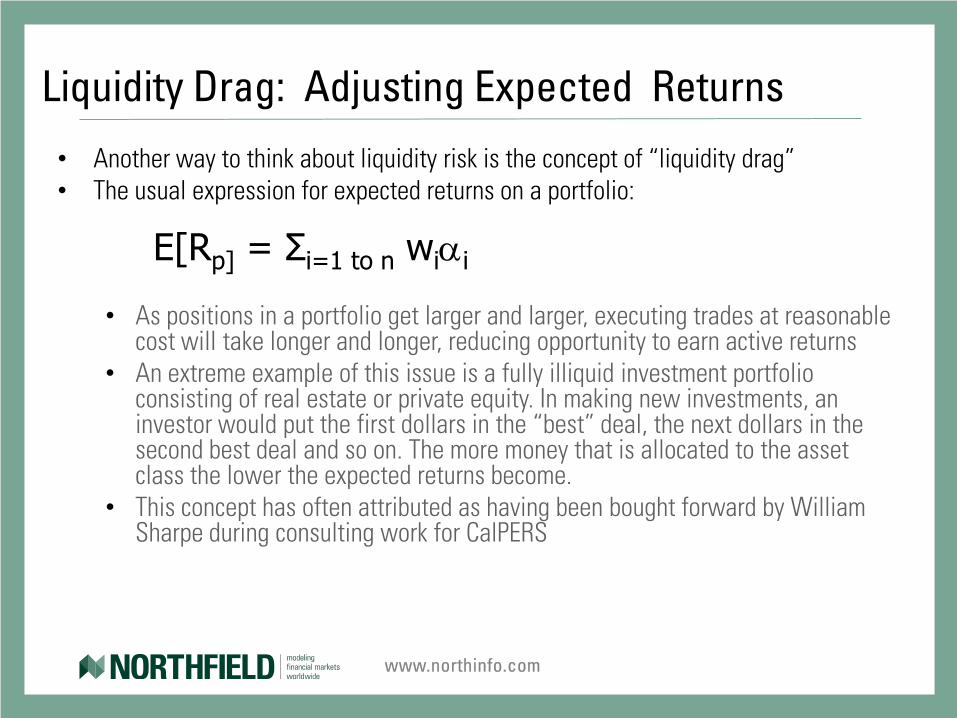
Liquidity Drag: Adjusting Expected Returns
• Another way to think about liquidity risk is the concept of “liquidity drag” • The usual expression for expected returns on a portfolio:
E[Rp] = Σi=1 to n wiαi • As positions in a portfolio get larger and larger, executing trades at reasonable
cost will take longer and longer, reducing opportunity to earn active returns • An extreme example of this issue is a fully illiquid investment portfolio
consisting of real estate or private equity. In making new investments, an investor would put the first dollars in the “best” deal, the next dollars in the second best deal and so on. The more money that is allocated to the asset class the lower the expected returns become.
• This concept has often attributed as having been bought forward by William Sharpe during consulting work for CalPERS
www.northinfo.com
More on Liquidity Drag
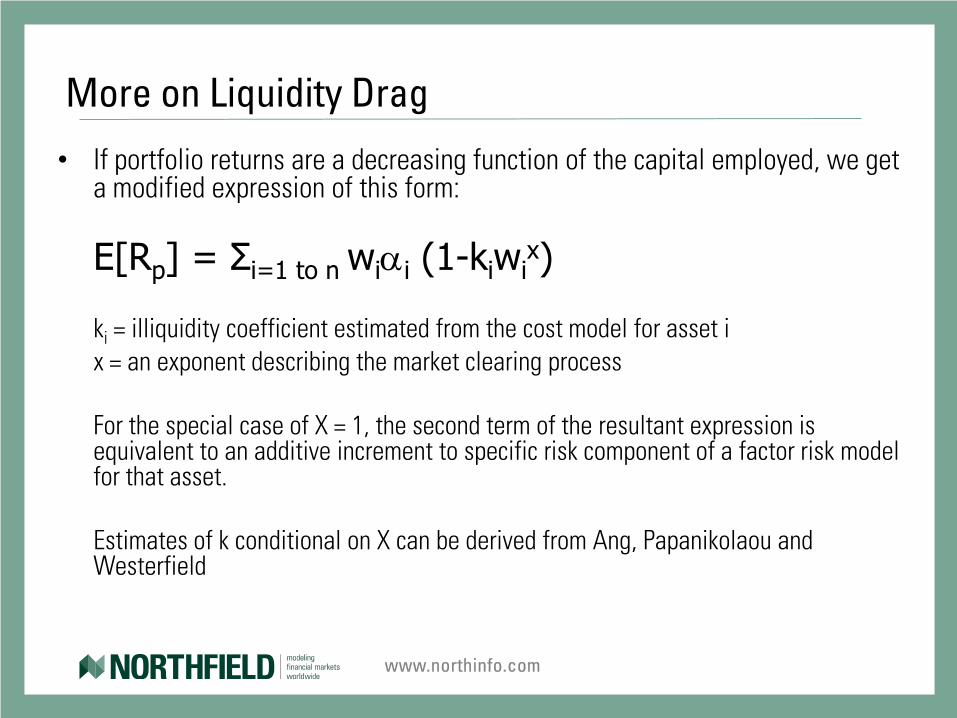
• If portfolio returns are a decreasing function of the capital employed, we get a modified expression of this form:
E[Rp] = Σi=1 to n wiαi (1-kiwix)
ki = illiquidity coefficient estimated from the cost model for asset i x = an exponent describing the market clearing process For the special case of X = 1, the second term of the resultant expression is
equivalent to an additive increment to specific risk component of a factor risk model for that asset.
Estimates of k conditional on X can be derived from Ang, Papanikolaou and
Westerfield
www.northinfo.com
Conclusions
• The key drawback of having a large exposure to illiquid assets is the loss of the option to rebalance
• By focusing an a factor exposure representation of the asset allocation, the loss of the option to rebalance is largely mitigated by the ability to rebalance or hedge in liquid markets.
• With an appropriate model robust estimation of common factors exposures of illiquid assets can be done either at the index level or more appropriately at the individual asset level and aggregated
• Using this approach, investors who believe in a liquidity risk premium can hold more illiquid assets without suffering the major drawback.