PORTFOLIO ADDITIONAL ESTIMATES STATEMENTS 2013 · PDF file2014. Use of the Coat of ... The...
120
PORTFOLIO ADDITIONAL ESTIMATES STATEMENTS 2013-14 INFRASTRUCTURE AND REGIONAL DEVELOPMENT PORTFOLIO EXPLANATIONS OF ADDITIONAL ESTIMATES 2013-14
Transcript of PORTFOLIO ADDITIONAL ESTIMATES STATEMENTS 2013 · PDF file2014. Use of the Coat of ... The...

PORTFOLIO ADDITIONAL ESTIMATES STATEMENTS 2013-14
INFRASTRUCTURE AND REGIONAL DEVELOPMENT PORTFOLIO
EXPLANATIONS OF ADDITIONAL ESTIMATES 2013-14
© Commonwealth of Australia 2014 ISBN 978-1-922205-58-2
Ownership of intellectual property rights in this publication Unless otherwise noted, copyright (and any other intellectual property rights, if any) in this publication is owned by the Commonwealth of Australia (referred to below as the Commonwealth).
Disclaimer The material contained in this publication is made available on the understanding that the Commonwealth is not providing professional advice, and that users exercise their own skill and care with respect to its use, and seek independent advice if necessary. The Commonwealth makes no representations or warranties as to the contents or accuracy of the information contained in this publication. To the extent permitted by law, the Commonwealth disclaims liability to any person or organisation in respect of anything done, or omitted to be done, in reliance upon information contained in this publication.
Creative Commons licence With the exception of (a) the Coat of Arms; (b) the Department of Infrastructure and Regional Development’s and Australian Maritime Safety Authority’s photos and graphics; and (c) signatures, copyright in this publication is licensed under a Creative Commons Attribution 3.0 Australia Licence. Creative Commons Attribution 3.0 Australia Licence is a standard form licence agreement that allows you to copy, communicate and adapt this publication provided that you attribute the work to the Commonwealth and abide by the other licence terms. A summary of the licence terms is available from http://creativecommons.org/licenses/by/3.0/au/deed.en. The full licence terms are available from http://creativecommons.org/licenses/by/3.0/au/legalcode. This publication should be attributed in the following way: ©Commonwealth of Australia 2014.
Use of the Coat of Arms The Department of the Prime Minister and Cabinet sets the terms under which the Coat of Arms is used. Please refer to the Department’s Commonwealth Coat of Arms and Government Branding web page http://www.dpmc.gov.au/guidelines/index.cfm#brand and in particular, the Guidelines on the use of the Commonwealth Coat of Arms publication.
Contact us This publication is available in hard copy or PDF format. All other rights are reserved, including in relation to any Departmental logos or trademarks which may exist. For enquiries regarding the licence and any use of this publication, please contact: Director - Publishing and Communications Communications Branch Department of Infrastructure and Regional Development GPO Box 594 Canberra ACT 2601 Australia Email: [email protected] Website: www.infrastructure.gov.au Printed by CanPrint Communications Pty Ltd, Canberra


iv
Abbreviations and conventions The following notations may be used:
N/A not applicable (unless otherwise specified) nfp not for publication $m $ million
Figures in tables and in the text may be rounded. Figures in text are generally rounded to one decimal place, whereas figures in tables are generally rounded to the nearest thousand. Discrepancies in tables between totals and sums of components are due to rounding. Enquiries Should you have any queries regarding this publication, please contact: Marilyn Prothero Chief Financial Officer Department of Infrastructure and Regional Development Phone: (02) 6274 6260 Fax: (02) 6274 6695 E-mail: [email protected] A copy of this document can be located on the Australian Government Budget website <www.budget.gov.au> or on the Department of Infrastructure and Regional Development website <www.infrastructure.gov.au>.

v
USER GUIDE TO THE
PORTFOLIO ADDITIONAL ESTIMATES STATEMENTS

vi

vii
USER GUIDE The purpose of the Portfolio Additional Estimates Statements (PAES), like that of the Portfolio Budget Statements (PB Statements), is to inform Senators and Members of Parliament of the proposed allocation of resources to Government outcomes by agencies within the portfolio. The focus of the PAES differs from the PB Statements in one important aspect. While the PAES include an Agency Resource Statement to inform Parliament of the revised estimate of the total resources available to an agency, the focus of the PAES is on explaining the changes in resourcing by outcome(s) since the Budget. As such, the PAES provides information on new measures and their impact on the financial and/or non-financial planned performance of programs supporting those outcomes. The PAES facilitate understanding of the proposed appropriations in Appropriation Bills (Nos. 3 and 4) 2013-14. In this sense the PAES is declared by the Additional Estimates Appropriation Bills to be a ‘relevant document’ to the interpretation of the Bills according to section 15AB of the Acts Interpretation Act 1901. Whereas the Mid-Year Economic and Fiscal Outlook (MYEFO) 2013-14 is a mid-year budget report which provides updated information to allow the assessment of the Government’s fiscal performance against its fiscal strategy, the PAES update the most recent budget appropriations for agencies within the portfolio.
viii
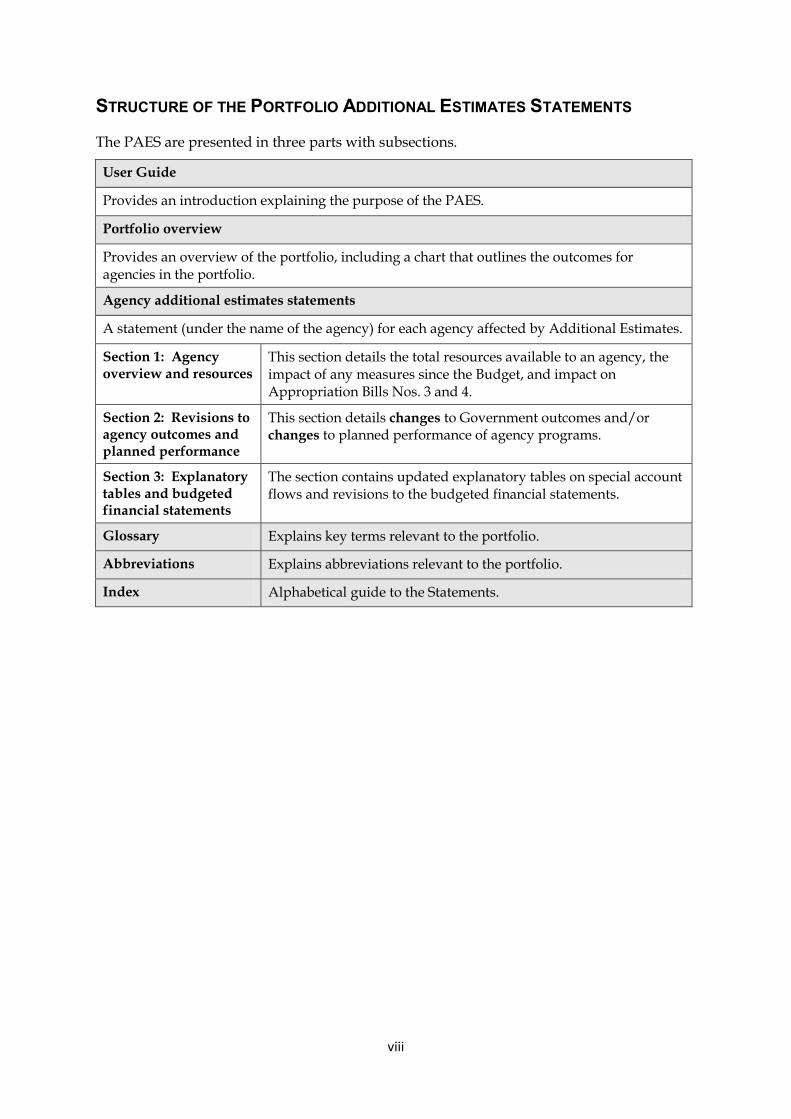
STRUCTURE OF THE PORTFOLIO ADDITIONAL ESTIMATES STATEMENTS
The PAES are presented in three parts with subsections.
User Guide
Provides an introduction explaining the purpose of the PAES.
Portfolio overview
Provides an overview of the portfolio, including a chart that outlines the outcomes for agencies in the portfolio.
Agency additional estimates statements
A statement (under the name of the agency) for each agency affected by Additional Estimates.
Section 1: Agency overview and resources
This section details the total resources available to an agency, the impact of any measures since the Budget, and impact on Appropriation Bills Nos. 3 and 4.
Section 2: Revisions to agency outcomes and planned performance
This section details changes to Government outcomes and/or changes to planned performance of agency programs.
Section 3: Explanatory tables and budgeted financial statements
The section contains updated explanatory tables on special account flows and revisions to the budgeted financial statements.
Glossary Explains key terms relevant to the portfolio.
Abbreviations Explains abbreviations relevant to the portfolio.
Index Alphabetical guide to the Statements.

ix
CONTENTS Portfolio Overview ............................................................................................................... 1
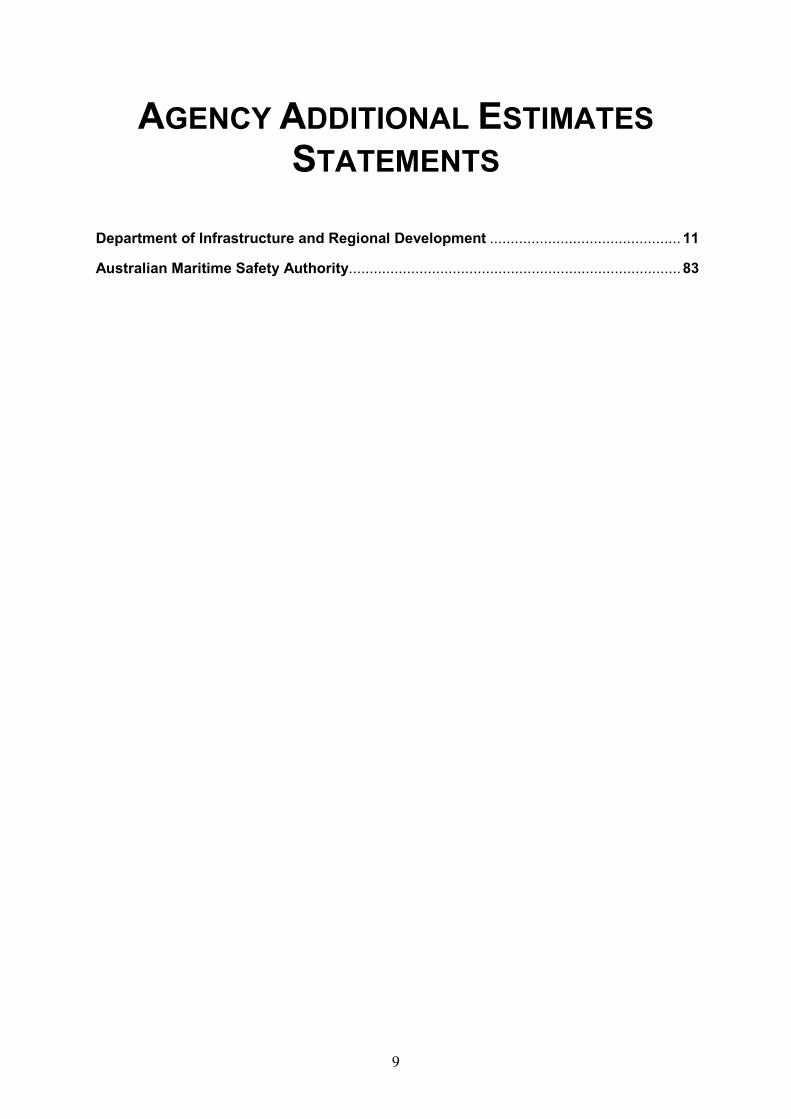
Agency Additional Estimates Statements .......................................................................... 9 Department of Infrastructure and Regional Development ..................................................... 11 Australian Maritime Safety Authority .................................................................................... 83
Glossary ........................................................................................................................... 103
Abbreviations ................................................................................................................... 107
Index ................................................................................................................................. 109

x

1
PORTFOLIO OVERVIEW

2

3
INFRASTRUCTURE AND REGIONAL DEVELOPMENT PORTFOLIO OVERVIEW MINISTERS AND PORTFOLIO RESPONSIBILITIES
The responsibilities of the ministers and portfolio have changed since tabling of the 2013-14 Portfolio Budget Statements (PB Statements).
Under the Administrative Arrangements Order of 18 September 2013, the Department of Infrastructure and Transport was renamed the Department of Infrastructure and Regional Development (the Department). The Department of Regional Australia, Local Government, Arts and Sport (DRALGAS) was abolished.
The Department retains responsibility for infrastructure and transport, and gained the functions relating to regional development, local government and territories from DRALGAS. The relevant outcomes relating to these functions have transferred to the Department and are known as Outcomes 3 and 4.
The full set of outcomes for the Department are provided below.
• Outcome 1: Improved infrastructure across Australia through investment in and coordination of transport and other infrastructure.
• Outcome 2: An efficient, sustainable, competitive, safe and secure transport system for all transport users through regulation, financial assistance and safety investigations.
• Outcome 3: Strengthening the sustainability, capacity and diversity of regional economies including through facilitating local partnerships between all levels of government and local communities; and providing grants and financial assistance.
• Outcome 4: Good governance in the Australian territories through the maintenance and improvement of the overarching legislative framework for self-governing territories, and laws and services for non-self-governing territories.
The portfolio also gained an additional General Government Sector agency, the National Capital Authority (NCA). The NCA’s statutory function is to comprehensively establish the Australian Government's continuing interest in the strategic planning, promotion, development and enhancement of Canberra as the National Capital.
The NCA has the following outcome.
• Outcome 1: Manage the strategic planning, promotion and enhancement of Canberra as the National Capital for all Australians through the development and administration of the National Capital Plan, operation of the National Capital Exhibition, delivery of education and awareness programmes and works to enhance the character of the National Capital.
More information about the NCA can be found at <www.nationalcapital.gov.au>.
The Department is accountable to the Hon Warren Truss MP, Minister for Infrastructure and Regional Development and the Hon Jamie Briggs MP, Assistant Minister for Infrastructure and Regional Development.
The Portfolio Additional Estimates Statements (PAES) provides information on variations since the Budget for the Portfolio’s General Government Sector agencies who are seeking additional appropriations through Appropriation Bills (No.3 and No.4) 2013-14. For the

Portfolio overview
4
2013-14 PAES, variations relate only to the Department and the Australian Maritime Safety Authority (AMSA). Statements for the Australian Transport Safety Bureau (ATSB), Civil Aviation Safety Authority (CASA), National Capital Authority (NCA) and National Transport Commission (NTC) are therefore not included.

Portfolio overview
5
Figure 1: Infrastructure and Regional Development portfolio structure and outcomes
Outcome 1:
Outcome 2:
Outcome 3:
Outcome 4:
Outcome 1:
Outcome 1:
Outcome 1:
Civil Aviation Safety AuthorityChair: Dr Allan Hawke
Director of Aviation Safety: John McCormick
Maximise aviation safety through a regulatory regime, detailed technical material
on safety standards, comprehensive aviation industry oversight, risk analysis,
industry consultation, education and training.
Australian Maritime Safety AuthorityChairman: Leo Zussino
Minimise the risk of shipping incidents and pollution in Australian waters through
ship safety and environment protection regulation and services and maximise
people saved from maritime and aviation incidents through search and rescue
coordination.
Australian Transport Safety BureauChief Commissioner: Martin Dolan
Improved transport safety in Australia including through: independent 'no blame'
investigation of transport accidents and other safety occurrences; safety data
recording, analysis and research; and fostering safety awareness, knowledge
and action.
of transport and other infrastructure.
Minister for Infrastructure and Regional DevelopmentDeputy Prime Minister
The Hon Warren Truss MP
Assistant Minister for Infrastructure and Regional DevelopmentThe Hon Jamie Briggs MP
Department of Infrastructure and Regional DevelopmentSecretary: Mike Mrdak
Improved infrastructure across Australia through investment in and coordination
Chief Executive Officer: Graham Peachey
An efficient, sustainable, competitive, safe and secure transport system for all
transport users through regulation, financial assistance and safety investigations.
Strengthening the sustainability, capacity and diversity of regional economies
including through facilitating local partnerships between all levels of government
and local communities; and providing grants and financial assistance.
Good governance in the Australian territories through the maintenance and
improvement of the overarching legislative framework for self-governing
territories, and laws and services for non-self-governing territories.

Portfolio overview
6
Figure 1: Infrastructure and Regional Development portfolio structure and outcomes (continued)
Outcome 1:
Outcome 1:
Chief Executive Officer: Malcolm Snow
of the National Capital Plan, operation of the National Capital Exhibition, delivery
National Capital Authority
Chair: Shelley Penn
Manage the strategic planning, promotion and enhancement of Canberra as the
National Capital for all Australians through the development and administration
of education and awareness programs and works to enhance the character of
the National Capital.
National Transport CommissionChair: David Anderson
Chief Executive Officer and Commissioner: Paul Retter
Improved transport productivity, efficiency, safety and environmental performance
and regulatory efficiency in Australia through developing, monitoring and
maintaining nationally consistent regulatory and operational arrangements
relating to road, rail and intermodal transport.

Portfolio overview
7
PORTFOLIO RESOURCES
Table 1 shows for those agencies reporting in the PAES the additional resources provided to the portfolio in the 2013-14 Budget year, by agency. Additional appropriation is not being sought for ATSB, CASA, NCA and NTC. Table 1: Portfolio resources 2013-14
Appropriation ReceiptsBill No. 3 Bill No. 4 Special Total
$m $m $m $m $mThe Department
Administered appropriations 81.0 33.4 - - 114.3 Departmental appropriations 47.9 23.4 - 1.7 73.0 Total 128.9 56.8 - 1.7 187.4
AMSAAdministered appropriations - - - - - Departmental appropriations 8.1 - - - 8.1 Total 8.1 - - - 8.1
Portfolio Total 195.5
Less amounts transferred within portfolio -
Additional resources available within portfolio: 195.5

8
9
AGENCY ADDITIONAL ESTIMATES STATEMENTS
Department of Infrastructure and Regional Development .............................................. 11
Australian Maritime Safety Authority................................................................................ 83

10

11
Department of Infrastructure and Regional Development
Section 1: Agency overview and resources ..................................................................... 13 1.1 Strategic direction statement ......................................................................................... 13 1.2 Agency resource statement ........................................................................................... 16 1.3 Agency measures table ................................................................................................. 19 1.4 Additional estimates and variations ............................................................................... 21 1.5 Breakdown of additional estimates by appropriation bill ................................................ 25
Section 2: Revisions to agency outcomes and planned performance ........................... 27 2.1 Outcomes and performance information ....................................................................... 27
Section 3: Explanatory tables and budgeted financial statements ................................ 64 3.1 Explanatory tables ......................................................................................................... 64 3.2 Budgeted financial statements ...................................................................................... 65

12

Department of Infrastructure and Regional Development
13
SECTION 1: AGENCY OVERVIEW AND RESOURCES Under the Administrative Arrangements Order of 18 September 2013, the Department of Infrastructure and Transport was renamed the Department of Infrastructure and Regional Development (the Department). Functions of the abolished Department of Regional Australia, Local Government, Arts and Sport (DRALGAS) relating to regional development, local government and services to territories were transferred to the Department.
An updated Strategic Direction Statement is provided below.
1.1: STRATEGIC DIRECTION STATEMENT
In accordance with the four outcomes outlined in the Portfolio Overview, the Department is responsible for providing policy advice and targeted research, delivering administered items and regulation for the following programmes:
• infrastructure investment;
• transport security;
• surface transport;
• road safety;
• air transport;
• regional development;
• local government; and
• services to territories.
These programmes are described in detail in Section 2 of this document, ‘Revisions to Agency Outcomes and Planned Performance’.
The Department consists of six business divisions that in aggregate deliver these programmes. These business divisions are supported by the Corporate Services division. Employees are made available by the Department to assist the Infrastructure Coordinator who supports Infrastructure Australia in the performance of its functions. The Department also provides employees in support of the International Air Services Commission and the Office of the Inspector of Transport Security.
On behalf of the Minister, the Department oversees the Australian Maritime Safety Authority (AMSA), the Australian Transport Safety Bureau (ATSB), Airservices Australia, the Civil Aviation Safety Authority (CASA), the National Capital Authority (NCA), and the operations of the National Transport Commission (NTC) in collaboration with the states and territories through the Council of Australian Governments (COAG) Council on Transport and Infrastructure.
In 2013-14 and beyond, the Department will continue to be at the forefront of the Australian Government’s efforts to build a more productive Australia. The portfolio has an economic investment focus - a focus which is critical to the economic development of all regions to meet the growth and development challenges the nation faces. The AusLink Programme will continue to be a priority, and the transport agenda continues to involve significant national and international reforms.
The addition of outcomes 3 and 4 to the portfolio’s responsibilities provide the opportunity to integrate regional economic development with Commonwealth infrastructure investment
Department of Infrastructure and Regional Development
14
programmes. This focus will assist in delivering economic and social outcomes for regions across Australia. The Department’s new responsibilities for promoting effective local government and for external territories administration will further contribute to a strong and liveable Australia.
In addressing the growth and development challenges that lie ahead for Australia, the Department will build on policy development and delivery capability, and further strengthen engagement and partnership with stakeholders and the users of services.
Other key priorities for 2013-14 include:
• delivering the Australian Government’s AusLink Programme and supporting future infrastructure investment decisions;
• providing advice to the Australian Government on projects for the next phase of the AusLink Programme including continuing work on infrastructure financing, assessment and procurement processes, integrated transport planning and micro-economic reforms;
• implementing the national ports and land freight initiatives to harness improvements in Australia’s productivity and international competitiveness;
• continuing to develop a strong maritime policy agenda;
• continuing to work with states and territories and the national regulators for maritime safety, rail safety and heavy vehicle safety to embed national transport regulation reforms;
• continuing development of the heavy vehicle charging and investment reforms for COAG consideration;
• implementing the Australian Government’s aviation policy, including initiatives set out in the Coalition’s Policy for Aviation (August 2013);
• providing advice to the Australian Government to settle its strategy to address aviation capacity needs in the Sydney region and work towards implementation;
• ensuring Australian aviation is supported by a modern and competitive regulatory framework across the regional, domestic and international markets;
• undertaking an external review of Australia’s system of aviation safety regulation;
• providing advice to the Australian Government on what role high speed rail could play as part of long-term transport planning and implementing resulting decisions;
• continuing the State of Australian Cities reporting;
• continuing to work with states and territories to implement the national road safety initiative, and managing arrangements for the scheduled 2014 review of the strategy;
• providing advice in relation to the Australian Government’s investments into rail freight through the Australian Rail Track Corporation and the Moorebank Intermodal Company Limited;
• ensuring Australia is best placed to meet new and emerging threats in transport security through delivery of enhanced security measures;
• strengthening the sustainability, capacity and diversity of regional economies to support regional Australians;
• progressing regional initiatives in key areas such as Tasmania, Murray-Darling Basin, Latrobe Valley and Northern Australia;

Department of Infrastructure and Regional Development
15
• managing regional and local government grants programmes to fund capital works projects to improve socio-economic circumstances through locally identified priorities;
• responding to the review of the Local Government Financial Assistance Grants Programme;
• progressing reforms towards long term financial sustainability and improved governance on Norfolk Island;
• supporting the Inspectorate and the National Disaster Recovery Taskforce in its review of reconstruction activities in Queensland flood affected areas from 2011-13;
• maintaining and upgrading essential infrastructure in the Indian Ocean Territories; and
• developing the capacity and capability of local government.
At all times the Department’s work will recognise the importance of ongoing effective delivery of vital regulatory and programme functions, whilst maintaining and enhancing policy capability.

Department of Infrastructure and Regional Development
16
1.2: AGENCY RESOURCE STATEMENT
The Agency resource statement details the resourcing for the Department at Additional Estimates. Table 1.1 shows the total resources from all sources for the 2013-14 Budget year, including variations through Appropriation Bills No. 3 and No. 4, special appropriations and special accounts.
Table 1.1: Agency resource statement - Additional estimates for 2013-14 as at Additional Estimates February 2014
Estimate Proposed Total Totalas at + Additional = estimate at available
Budget Estimate Additional appropriationEstimates
2013-14 2013-14 2013-14 2012-13$'000 $'000 $'000 $'000
Ordinary annual services1
Departmental appropriationPrior year Departmental appropriation2 75,336 75,336 73,849
Departmental appropriation3 190,673 47,912 238,585 190,320
s31 relevant agency receipts4 16,242 1,701 17,943 16,774 Total 282,251 49,613 331,864 280,943
Administered expensesOutcome 1 82,965 2,109 85,074 48,205 Outcome 25 199,475 - 199,475 195,328
Outcome 36 - 279,325 279,325 -
Outcome 47 - 146,969 146,969 - Payments to CAC Act bodies 102,576 8,133 110,709 108,944 Total 385,016 436,536 821,552 352,477
Total ordinary annual services A 667,267 486,149 1,153,416 633,420
Other services8
Administered expensesSpecific payments to States, ACT, NT
and local governmentOutcome 1 383,426 3,360 386,786 361,415
Outcome 39 - 27,412 27,412 - Total 383,426 30,772 414,198 361,415
Departmental non-operatingEquity injections2 2,153 23,416 25,569 3,150 Total 2,153 23,416 25,569 3,150
Administered non-operatingAdministered assets and liabilities10 19,600 34,492 54,092 215,269 Payments to CAC Act bodies 7,485 - 7,485 2,380 Total 27,085 34,492 61,577 217,649
Total other services B 412,664 88,680 501,344 582,214
Total available annual appropriations 1,079,931 574,829 1,654,760 1,215,634

Department of Infrastructure and Regional Development
17
Table 1.1: Agency resource statement - Additional estimates for 2013-14 as at Additional Estimates February 2014 (continued)
Estimate Proposed Total Totalas at + Additional = estimate at available
Budget Estimate Additional appropriationEstimates
2013-14 2013-14 2013-14 2012-13$'000 $'000 $'000 $'000
Special appropriationsSpecial appropriations limited by
criteria/entitlementAustralian Maritime Safety Authority Act 117,363 - 117,363 106,600
1990 - s48(2)11
Aviation Fuel Revenues (Special 125,909 155 126,064 121,023 Appropriation) Act 1988 - s411
Interstate Road Transport Act 1985 - s22 80,839 (2,837) 78,002 76,835 Local Government (Financial Assistance) - 848,427 848,427 -
Act 1995 - s19Protection of the Sea (Oil Pollution 535 (534) 1 -
Compensation Fund) Act 1993 - s40(4)Total special appropriations C 324,646 845,211 1,169,857 304,458
Total appropriations excluding Special 1,404,577 1,420,040 2,824,617 1,520,092 Accounts
Special Accounts12
Opening balance 8,905 (1,582) 7,323 8,905 Non-Appropriation receipts13 949,000 (36,410) 912,590 981,610
Appropriation receipts14 80,839 (2,837) 78,002 76,831
Total Special Accounts D 1,038,744 (40,829) 997,915 1,067,346
Total resourcing 2,443,321 1,379,211 3,822,532 2,587,438 A+B+C+D
Less appropriations drawn from annual (190,900) (5,296) (196,196) (188,159)or special appropriations above andcredited to special accounts and/orCAC Act bodies through annualappropriations
Total net resourcing 2,252,421 1,373,915 3,626,336 2,399,279
All figures are GST exclusive.
Notes: 1. Appropriation Act (No.1) 2013-14 and Appropriation Bill (No.3) 2013-14. 2. Estimate at Budget has been adjusted to reflect the actual balance carried from previous year for annual
appropriations (refer to Note 26C in the Department’s 2012-13 Annual Report). 3. Includes an amount of $5.643m in 2013-14 for the Departmental Capital Budget (refer to table 3.2.5 for
further details). For accounting purposes this amount has been designated as ‘contributions by owners’. 4. s31 Relevant Agency receipts - estimate. 5. Estimate at Budget has been adjusted to include actual funds of $4.867m carried forward from previous
years. 6. Includes the Section 32 transfer of $273.007m from DRALGAS in the AAO of 18 September 2013. 7. Includes the Section 32 transfer of $74.440m from DRALGAS in the AAO of 18 September 2013. Also
includes an amount of $7.073m in 2013-14 for the Administered Capital Budget (refer to table 3.2.10 for further details).
8. Appropriation Act (No.2) 2013-14 and Appropriation Bill (No.4) 2013-14. 9. Includes the Section 32 transfer of $27.412m from DRALGAS in the AAO of 18 September 2013.

Department of Infrastructure and Regional Development
18
10. Includes the Section 32 transfer of $4.480m from DRALGAS in the AAO of 18 September 2013. 11. Relates to payments to Commonwealth Authorities and Companies Act 1997 (CAC Act) bodies. 12. Opening balance for special accounts (less ‘Special Public Money’ held in accounts like Services for Other
Entities and Trust Monies accounts). For further detail on special accounts see Table 3.1.2. 13. Non-Appropriation receipts from the BAF Infrastructure Portfolio Special Account. 14. Appropriation receipts from special appropriations.
Table 1.1: Agency resource statement - Additional estimates for 2013-14 as at Additional Estimates February 2014 (continued)
Third party payments from and on behalf of other agencies Estimate Estimate at
at AdditionalBudget Estimates
2013-14 2013-14$'000 $'000
Receipts received from other agencies for the provision of services(disclosed above within Departmental s31 relevant agency receipts)
Australian Transport Safety Bureau 2,999 2,999 Department of Regional Australia, Local Government, Arts and Sport 800 800
Total 3,799 3,799
Total receipts received from other agencies for the provision of services 3,799 3,799
Payments made by other agencies on behalf of the Department(disclosed above within Administered expenses)
Department of Human Services1 157,350 152,350
Total 157,350 152,350
Total payments made by other agencies on behalf of the Department 157,350 152,350
Payments made to CAC Act bodies within the portfolio
AMSAAppropriation Act (No.1) & Bill (No.3) 2013-14 56,947 65,080 Appropriation Act (No.2) 2013-14 7,485 7,485 Australian Maritime Safety Authority Act 1990 - s48(2) 117,363 117,363 Total 181,795 189,928
CASAAppropriation Act (No.1) 2013-14 42,460 42,460 Aviation Fuel Revenues (Special Appropriation) Act 1988 - s4 125,909 126,064 Total 168,369 168,524
NTCAppropriation Act (No.1) 2013-14 3,169 3,169 Total 3,169 3,169
Total payments made to CAC Act bodies within the portfolio 353,333 361,621
Notes: 1. Payments relate to the Bass Strait Passenger Vehicle Equalisation Scheme; Tasmanian Freight Equalisation Scheme;
and Tasmanian Wheat Freight Scheme administered items.

Department of Infrastructure and Regional Development
19
1.3: AGENCY MEASURES TABLE
Table 1.2 summarises new Government measures taken since the 2013-14 Budget. The table shows expense measures, with the affected programme identified.
Table 1.2: Agency 2013-14 measures since Budget Programme 2013-14 2014-15 2015-16 2016-17
$'000 $'000 $'000 $'000
Expense measures
AusLink Programme - National 1.1Land Transport Projects
Administered expenses (19,713) 458,750 65,000 20,000 Departmental expenses - - - - Total (19,713) 458,750 65,000 20,000
Aviation Safety Regulation Review 2.4Administered expenses - - - - Departmental expenses 1,017 - - - Total 1,017 - - -
Community Development Grants 3.1Programme - establishment
Administered expenses 22,000 160,000 140,000 20,000 Departmental expenses - - - - Total 22,000 160,000 140,000 20,000
Community Infrastructure Grants - 3.1cessation1
Administered expenses (27,853) (17,650) - - Departmental expenses - - - - Total (27,853) (17,650) - -
Keys2Drive - extension 2.3Administered expenses 2,000 4,000 4,000 - Departmental expenses - - - - Total 2,000 4,000 4,000 -
Latrobe Valley economic diversification2 3.1Administered expenses 3,400 5,000 2,450 - Departmental expenses - - - - Total 3,400 5,000 2,450 -
Lord Howe Island aerodrome improvement 3.1works3
Administered expenses (1,000) (3,000) - - Departmental expenses - - - - Total (1,000) (3,000) - -
Payment scheme for Airservices Australia 2.4en-route charges
Administered expenses 500 1,000 1,000 1,000 Departmental expenses - - - - Total 500 1,000 1,000 1,000

Department of Infrastructure and Regional Development
20
Table 1.2: Agency 2013-14 measures since Budget (continued) Programme 2013-14 2014-15 2015-16 2016-17
$'000 $'000 $'000 $'000
Expense measures (continued)
Referendum on the financial recognition of 3.2local government - not proceeding4
Administered expenses (8,500) - - - Departmental expenses (600) - - - Total (9,100) - - -
Regional and Rural Research and 3.1Development Grants - cessation
Administered expenses (228) (228) (228) (228)Departmental expenses - - - - Total (228) (228) (228) (228)
Regional development projects in Northern 3.1Australia2
Administered expenses 500 4,300 - - Departmental expenses - - - - Total 500 4,300 - -
Repeal of the Mineral Resources Rent Tax - 1.1Regional Infrastructure Fund and RegionalDevelopment Australia Fund - discontinue
Administered expenses (143,053) (229,160) (75,439) (32,843)Departmental expenses - - - - Total (143,053) (229,160) (75,439) (32,843)
Total expense measuresAdministered (171,947) 383,012 136,783 7,929 Departmental 417 - - - Total (171,530) 383,012 136,783 7,929
Prepared on a Government Financial Statistics (fiscal) basis.
Notes: 1. The amounts shown for this decision which was reported in the 2013-14 Mid-Year Economic and Fiscal
Outlook (MYEFO) incorrectly included amounts associated with the ‘Lord Howe Island aerodrome improvement works’ measure.
2. This measure was originally announced in the 2013 Economic Statement and has been partially reversed by a reduction measure announced in MYEFO. The above financial figures reflect the current net fiscal impact of the measure. The measure originally announced in the 2013 Economic Statement was reported as a decision taken but not yet announced in the 2013-14 Budget.
3. This measure was originally announced in the 2013 Economic Statement and has been fully reversed by a cessation measure announced in the MYEFO. The measure reflects an overall save to the Budget of $4.0 million due to the original measure being met from existing resources.
4. Measure relates to a decision reported in the Pre-Election Economic and Fiscal Outlook 2013 under the former Department of Regional Australia, Local Government, Arts and Sport. Functions relating to this measure were transferred to the Department consistent with the Administrative Arrangements Order of 18 September 2013.

Department of Infrastructure and Regional Development
21
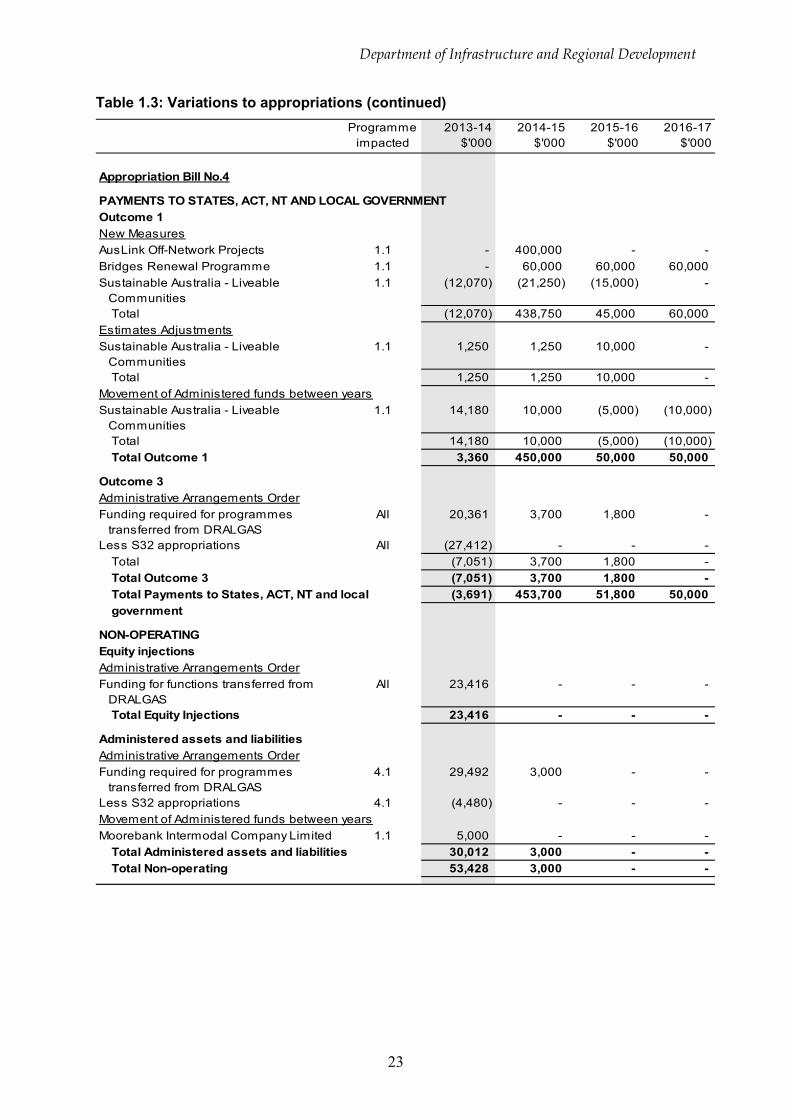
1.4: ADDITIONAL ESTIMATES AND VARIATIONS
Table 1.3 summarises variations to appropriations since the 2013-14 Budget.
Table 1.3: Variations to appropriations Programme
impacted2013-14
$'0002014-15
$'0002015-16
$'0002016-17
$'000
Appropriation Bill No.3
ADMINISTERED ITEMSOutcome 1New MeasuresAusLink Off-Network Projects 1.1 - 20,000 20,000 (40,000)AusLink Programme Investment 1.1 (7,643) - - -
Total (7,643) 20,000 20,000 (40,000)Movement of Administered funds between yearsAusLink Programme Investment 1.1 7,648 - - - Jobs Fund - Infrastructure Employment Projects
1.1 2,104 - - -
Total 9,752 - - - Total Outcome 1 2,109 20,000 20,000 (40,000)
Outcome 2New Measureskeys2drive 2.3 2,000 4,000 4,000 - Payment scheme for Airservices Australia's en route charges
2.4 500 1,000 1,000 1,000
Total 2,500 5,000 5,000 1,000 Estimates AdjustmentsAirport Lessee Companies - reimbursement of parking fines
2.4 (500) (500) (500) (500)
Total (500) (500) (500) (500)Parameter AdjustmentsAviation security enhancements - regional passenger screening
2.1 - (2) (5) (5)
Bass Strait Passenger Vehicle Equalisation Scheme
2.2 (5,000) (5,300) (5,500) (5,600)
International Civil Aviation Organization - contribution
2.4 312 208 210 197
International Maritime Organization - contribution
2.2 120 71 98 138
OECD Road Transport - contribution 2.2 4 4 4 5 Regional Aviation Access 2.4 - (24) (62) (63)
Total (4,564) (5,043) (5,255) (5,328)Total Outcome 2 (2,564) (543) (755) (4,828)
Outcome 3Administrative Arrangements OrderFunding required for programmes transferred from DRALGAS
All 279,325 376,225 236,504 79,153
Less S32 appropriations All (273,007) - - - Total 6,318 376,225 236,504 79,153 Total Outcome 3 6,318 376,225 236,504 79,153

Department of Infrastructure and Regional Development
22
Table 1.3: Variations to appropriations (continued) Programme
impacted2013-14
$'0002014-15
$'0002015-16
$'0002016-17
$'000
Appropriation Bill No.3 (continued)
Outcome 4Administrative Arrangements OrderFunding required for programmes transferred from DRALGAS
4.1 139,896 112,046 113,599 115,660
Funding required for Administered Capital Budget transferred from DRALGAS
4.1 7,073 11,846 11,764 11,753
Less S32 appropriations 4.1 (74,440) - - - Total 72,529 123,892 125,363 127,413 Total Outcome 4 72,529 123,892 125,363 127,413 Total Administered Items 78,392 519,574 381,112 161,738
DEPARTMENTAL PROGRAMMESDepartmental expensesNew MeasuresAviation Safety Regulation Review 2.4 1,017 - - -
Total 1,017 - - - Administrative Arrangements OrderFunding for functions transferred from DRALGAS
All 45,443 55,021 50,157 49,447
Total 45,443 55,021 50,157 49,447 Estimates AdjustmentsIncrease in Efficiency Dividend All - (1,873) (4,287) (6,265)
Parameter adjustments All - (356) (721) (849)
Whole of Government savings All (278) (895) (1,823) (2,356)Total (278) (3,124) (6,831) (9,470)Total Departmental expenses 46,182 51,897 43,326 39,977
Departmental Capital BudgetAdministrative Arrangements OrderFunding for functions transferred from DRALGAS
All 1,730 634 661 657
Total 1,730 634 661 657 Estimates AdjustmentsIncrease in Efficiency Dividend All - (57) (130) (202)
Parameter adjustments All - (12) (22) (27)
Total - (69) (152) (229)Total Departmental Capital Budget 1,730 565 509 428
Total Departmental 47,912 52,462 43,835 40,405
Department of Infrastructure and Regional Development
23
Table 1.3: Variations to appropriations (continued) Programme
impacted2013-14
$'0002014-15
$'0002015-16
$'0002016-17
$'000
Appropriation Bill No.4
PAYMENTS TO STATES, ACT, NT AND LOCAL GOVERNMENTOutcome 1New MeasuresAusLink Off-Network Projects 1.1 - 400,000 - - Bridges Renewal Programme 1.1 - 60,000 60,000 60,000 Sustainable Australia - Liveable Communities
1.1 (12,070) (21,250) (15,000) -
Total (12,070) 438,750 45,000 60,000 Estimates AdjustmentsSustainable Australia - Liveable Communities
1.1 1,250 1,250 10,000 -
Total 1,250 1,250 10,000 - Movement of Administered funds between yearsSustainable Australia - Liveable Communities
1.1 14,180 10,000 (5,000) (10,000)
Total 14,180 10,000 (5,000) (10,000)Total Outcome 1 3,360 450,000 50,000 50,000
Outcome 3Administrative Arrangements OrderFunding required for programmes transferred from DRALGAS
All 20,361 3,700 1,800 -
Less S32 appropriations All (27,412) - - - Total (7,051) 3,700 1,800 - Total Outcome 3 (7,051) 3,700 1,800 - Total Payments to States, ACT, NT and local (3,691) 453,700 51,800 50,000
NON-OPERATINGEquity injectionsAdministrative Arrangements OrderFunding for functions transferred from DRALGAS
All 23,416 - - -
Total Equity Injections 23,416 - - -
Administered assets and liabilitiesAdministrative Arrangements OrderFunding required for programmes transferred from DRALGAS
4.1 29,492 3,000 - -
Less S32 appropriations 4.1 (4,480) - - - Movement of Administered funds between yearsMoorebank Intermodal Company Limited 1.1 5,000 - - -
Total Administered assets and liabilities 30,012 3,000 - - Total Non-operating 53,428 3,000 - -
government

Department of Infrastructure and Regional Development
24
Table 1.3: Variations to appropriations (continued) Programme
impacted2013-14
$'0002014-15
$'0002015-16
$'0002016-17
$'000
Special AppropriationsOutcome 2Estimates AdjustmentsAviation Fuel Revenues (Special Appropriation) Act 1988
2.4 155 - - -
Interstate Road Transport Act 1985 2.2 (2,837) (4,510) (6,282) (8,158)Protection of the Sea (Oil Pollution Compensation Fund) Act 1993
2.2 (534) - - -
Total (3,216) (4,510) (6,282) (8,158)Total Outcome 2 (3,216) (4,510) (6,282) (8,158)
Outcome 3Administrative Arrangements OrderLocal Government (Financial Assistance) Act 1995
3.2 848,427 2,359,427 2,461,315 2,566,413
Total 848,427 2,359,427 2,461,315 2,566,413 Total Outcome 3 848,427 2,359,427 2,461,315 2,566,413 Total Special Appropriations 845,211 2,354,917 2,455,033 2,558,255
Department of Infrastructure and Regional Development
25
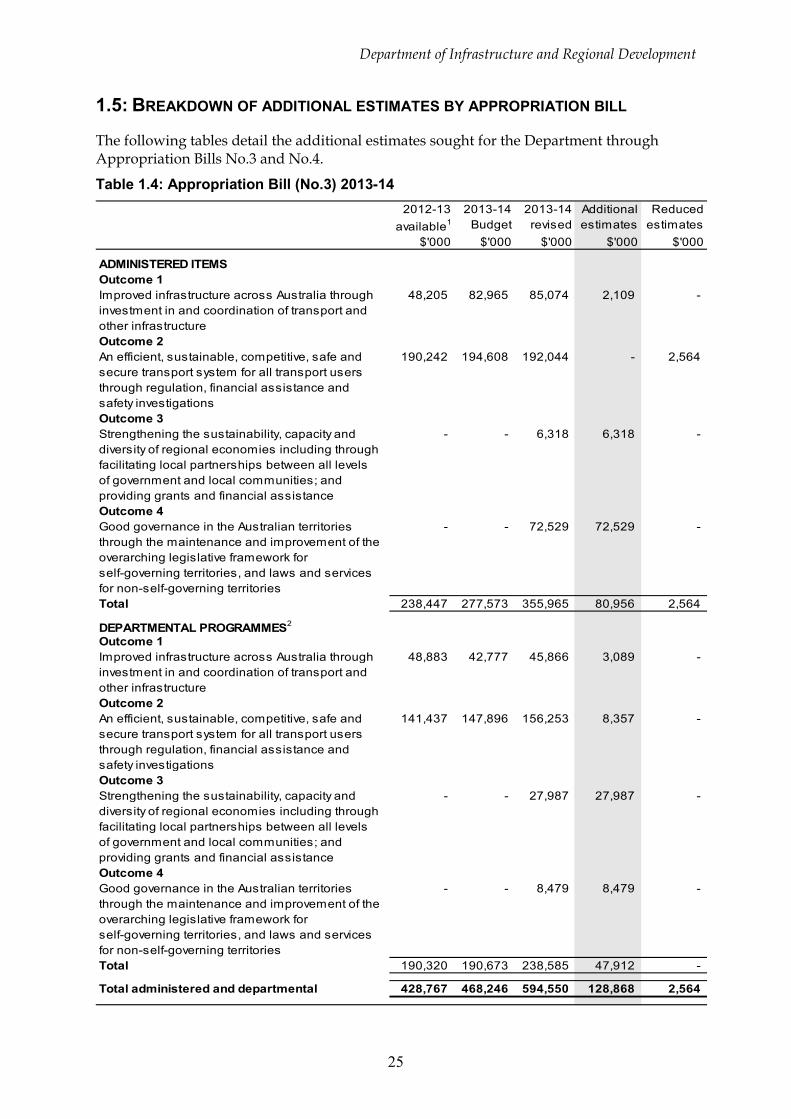
1.5: BREAKDOWN OF ADDITIONAL ESTIMATES BY APPROPRIATION BILL
The following tables detail the additional estimates sought for the Department through Appropriation Bills No.3 and No.4.
Table 1.4: Appropriation Bill (No.3) 2013-14 2012-13 2013-14 2013-14 Additional Reduced
available1 Budget revised estimates estimates$'000 $'000 $'000 $'000 $'000
ADMINISTERED ITEMSOutcome 1Improved infrastructure across Australia through 48,205 82,965 85,074 2,109 - investment in and coordination of transport andother infrastructureOutcome 2An efficient, sustainable, competitive, safe and 190,242 194,608 192,044 - 2,564 secure transport system for all transport usersthrough regulation, financial assistance andsafety investigationsOutcome 3Strengthening the sustainability, capacity and - - 6,318 6,318 - diversity of regional economies including throughfacilitating local partnerships between all levelsof government and local communities; andproviding grants and financial assistanceOutcome 4Good governance in the Australian territories - - 72,529 72,529 - through the maintenance and improvement of theoverarching legislative framework forself-governing territories, and laws and servicesfor non-self-governing territoriesTotal 238,447 277,573 355,965 80,956 2,564
DEPARTMENTAL PROGRAMMES2
Outcome 1Improved infrastructure across Australia through 48,883 42,777 45,866 3,089 - investment in and coordination of transport andother infrastructureOutcome 2An efficient, sustainable, competitive, safe and 141,437 147,896 156,253 8,357 - secure transport system for all transport usersthrough regulation, financial assistance andsafety investigationsOutcome 3Strengthening the sustainability, capacity and - - 27,987 27,987 - diversity of regional economies including throughfacilitating local partnerships between all levelsof government and local communities; andproviding grants and financial assistanceOutcome 4Good governance in the Australian territories - - 8,479 8,479 - through the maintenance and improvement of theoverarching legislative framework forself-governing territories, and laws and servicesfor non-self-governing territoriesTotal 190,320 190,673 238,585 47,912 -
Total administered and departmental 428,767 468,246 594,550 128,868 2,564

Department of Infrastructure and Regional Development
26
Notes: 1. The 2012-13 available appropriation is included to allow a comparison of this year's appropriation with what
was made available for use in the previous year. Available appropriation is the amount available to be drawn down, and is equal to: Budget Appropriation + Additional Estimates Appropriation + AFM - Savings – Movement of Funds - Other Reductions +/- Section 32 transfers.
2. No appropriation is provided under Appropriation Bill (No.3) for the Department where the total funding change across outcomes is negative.
Table 1.5: Appropriation Bill (No.4) 2013-14
2012-13 2013-14 2013-14 Additional Reducedavailable1 Budget revised estimates estimates
$'000 $'000 $'000 $'000 $'000
PAYMENTS TO STATES, ACT, NT AND LOCAL GOVERNMENTOutcome 1
Improved infrastructure across Australiathrough investment in and coordinationof transport and other infrastructure
361,415 383,426 386,786 3,360 -
Total 361,415 383,426 386,786 3,360 -
Non-operatingEquity injections - - 23,416 23,416 - Administered assets and liabilities - 19,600 49,612 30,012 -
Total non-operating - 19,600 73,028 53,428 -
Total 361,415 403,026 459,814 56,788 -
Notes: 1. The 2012-13 available appropriation is included to allow a comparison of this year's appropriation with what
was made available for use in the previous year. Available appropriation is the amount available to be drawn down, and is equal to: Budget Appropriation + Additional Estimates Appropriation + AFM - Savings – Movement of Funds - Other Reductions +/- Section 32 transfers.

Department of Infrastructure and Regional Development
27
SECTION 2: REVISIONS TO AGENCY OUTCOMES AND PLANNED PERFORMANCE 2.1: OUTCOMES AND PERFORMANCE INFORMATION
Outcomes are the intended results, impacts or consequences of actions by the Government on the Australian community. Programmes are the primary vehicle by which government agencies achieve the intended results of their outcome statements. Agencies are required to identify the programmes which contribute to Government outcomes over the Budget and forward years.
Under the Administrative Arrangements Order (AAO) of 18 September 2013, the Department of Infrastructure and Transport was renamed the Department of Infrastructure and Regional Development (the Department). Functions of the abolished Department of Regional Australia, Local Government, Arts and Sport (DRALGAS) relating to regional development, local government and services to territories were transferred to the Department.
Two additional outcomes were gained, with outcomes 1 and 2 of the former DRALGAS being transferred to the Department. These are known as outcomes 3 and 4 respectively.
Figure 2.1 provides the revised outcome and programme structure following the Administrative Arrangements Order of 18 September 2013.
Figure 2.1: Outcome and programme structure Outcome Programme
Outcome 1Improved infrastructure across Australia through investment in and coordination of transport and other infrastructure.
1.1 Infrastructure investment
Outcome 2An efficient, sustainable, competitive, safe and secure transport system for all transport users through regulation, financial assistance and safety investigations.
2.1 Transport security
2.2 Surface transport
2.3 Road safety
2.4 Air transport
Outcome 3Strengthening the sustainability, capacity and diversity of regional economies including through facilitating local partnerships between all levels of government and local communities; and providing grants and financial assistance.
3.1 Regional development
3.2 Local government
Outcome 4Good governance in the Australian territories through the maintenance and improvement of the overarching legislative framework for self-governing territories, and laws and services for non-self-governing territories.
4.1 Services to territories

Department of Infrastructure and Regional Development
28
Administered items The Department administers a range of items on behalf of the Government. The relationship between the Department’s outcomes and its administered items are detailed in Figures 2.2 to 2.5.
Figure 2.2: Outcome 1 – Programmes and administered items for 2013-14
Outcome 1
Programme 1.1: Infrastructure investment • AusLink Programme1
- AusLink Programme Investment2 - AusLink Black Spot Projects2 - AusLink Heavy Vehicle Safety and Productivity2 - AusLink Roads to Recovery - AusLink Off-Network Projects2
- AusLink Off-Network - supplementary - AusLink improving the National Network2
• AusLink Plan for the Future2 • Bridges Renewal Programme • Sustainable Australia - Liveable Communities2 • Sustainable Australia - National Smart Managed Motorways2
Notes: 1. The AusLink Programme was previously known as the Nation Building Programme. 2. The Department of the Treasury is appropriated for payments to and through states and territories for
National Partnership payments. Further information on these programmes can be found in Budget Paper 3 or the Treasury’s Portfolio Budget Statements (Programme 1.10).

Department of Infrastructure and Regional Development
29
Figure 2.3: Outcome 2 – Programmes and administered items for 2013-14
Outcome 2
Programme 2.1: Transport security • Aviation security enhancements
- improving international aviation security - regional passenger screening
• Strengthening aviation security - optimal technologies at international gateway airports - regional and domestic aviation security
Programme 2.2: Surface transport • Bass Strait Passenger Vehicle Equalisation Scheme • International Maritime Organization - contribution • Interstate Road Transport Fees • OECD Road Transport - contribution • Oil Pollution Compensation Funds • Sustaining Australia’s maritime skills • Tasmanian Freight Equalisation Scheme • Tasmanian Wheat Freight Scheme • Payments to CAC Act bodies - AMSA • Payments to CAC Act bodies - NTC
Programme 2.3: Road safety • keys2drive • Seatbelts on regional school buses
Programme 2.4: Air transport • Airport Lessee Companies - reimbursement of parking fines • Implementation of noise amelioration for Adelaide Airport • International Civil Aviation Organization – contribution • Payment scheme for Airservices Australia’s en route charges • Regional Aviation Access • Sydney West Airport - rental properties • Payments to CAC Act bodies - CASA

Department of Infrastructure and Regional Development
30
Figure 2.4: Outcome 3 – Programmes and administered items for 2013-14
Outcome 3
Programme 3.1: Regional development • Boyer Pulp Mill - Structural Assistance • Community Development Grants Fund • Community Infrastructure Grants1 • Latrobe Valley economic diversification1 • Murray-Darling Basin Regional Economic Diversification Programme • Northern Australia Sustainable Futures • Regional Development Australia Committees • Regional Development Australia Fund • Regional Development Projects in Northern Australia • South Australia Economic Development Programme1 • Tasmanian Jobs and Growth Package
Programme 3.2: Local government • Local Government Financial Assistance Grants • Local Government Reform Fund1 • Referendum on the recognition of local government in the Australian Constitution • Supplementary funding to South Australian councils for local roads
Notes: 1. The Department of the Treasury is appropriated for payments to and through states and territories for
National Partnership payments. Further information on these programmes can be found in Budget Paper 3 or the Treasury’s Portfolio Budget Statements (Programme 1.10).

Department of Infrastructure and Regional Development
31
Figure 2.5: Outcome 4 – Programmes and administered items for 2013-14
Outcome 4
Programme 4.1: Services to territories • ACT Government - national capital functions • Centenary of Canberra 2013 - a gift to the national capital1 • Centenary of Canberra 2013 - joint national programme1 • Christmas Island Phosphate Mining Rehabilitation • Norfolk Island - Commonwealth administration • Norfolk Island - Kingston and Arthur's Vale historic area • Norfolk Island - reforms and services • Office of Administrator, Northern Territory • Services to Indian Ocean Territories • Services to Jervis Bay Territory
Notes: 1. The Department of the Treasury is appropriated for payments to and through states and territories for
National Partnership payments. Further information on these programmes can be found in Budget Paper 3 or the Treasury’s Portfolio Budget Statements (Programme 1.10).

Department of Infrastructure and Regional Development
32
Outcome 1: Improved infrastructure across Australia through investment in and coordination of transport and other infrastructure.
Outcome 1 Strategy The strategy for Outcome 1 has changed from that published in the 2013-14 PB Statements.
The key changes include replacing references to the Nation Building Programme with AusLink Programme. References to Regional Infrastructure Fund, National Urban Policy, Cities Work Plan and national urban transport strategy have been removed. In addition, Infrastructure Australia’s work programme has been modified. These variations reflect a change in government direction.
The modified strategy is provided below.
Outcome 1 is delivered through the following programme:
1.1 Infrastructure investment
Infrastructure investment will support economic productivity across Australia through investment in and coordination of transport and other infrastructure. The Department will work with states and territories on transport planning to inform future investment priorities.
During 2013-14 and the forward years, the Department will:
• contribute to improved transport infrastructure decision-making and delivery through sound management and partnered decision-making with other jurisdictions;
• advise on potential projects to be funded under the AusLink Programme; and
• advise on transport planning and potential projects to inform future infrastructure investment.
Major initiatives during 2013-14, which will continue into the forward years, include:
• implementing and delivering a range of land transport investment administered items as part of the AusLink Programme, and through the Australian Government equity investment in the Australian Rail Track Corporation and the Moorebank Intermodal Company Limited;
• developing a programme of works for land transport infrastructure priorities for funding under the AusLink Programme from 2014-15;
• implementing the national land freight and ports initiatives; and
• continuing work on national transport planning including, in consultation with the eastern states and the ACT, consideration of the role which high speed rail could play – as part of a range of options, across transport modes – in addressing long term transport challenges.
During 2013-14 Infrastructure Australia’s work programme will include:
• expanding the national infrastructure pipeline;
• developing the fifteen year infrastructure plan for Australia;
• reviewing all Commonwealth funded infrastructure projects valued at $100 million and above for cost effectiveness and financial liability;
• auditing Australia’s current asset base;

Department of Infrastructure and Regional Development
33
• identifying the critical infrastructure investment required in northern Australia;
• developing infrastructure financing reforms;
• pursuing water reform;
• implementing the national ports and the national land freight initiatives;
• implementing the tax loss incentive for designated infrastructure projects; and
• gaining agreement to a new framework for prioritising remote Indigenous infrastructure.

Department of Infrastructure and Regional Development
34
Outcome 1 expense statement Table 2.1 provides an overview of the total expenses for Outcome 1, by programme.
Table 2.1: Budgeted expenses for Outcome 1 2012-13 2013-14
Actual Revisedexpenses estimated
expenses$'000 $'000
Programme 1.1: Infrastructure investment
Administered expensesOrdinary Annual Services (Appropriation Act No.1 & Bill No.3) 48,205 85,074 Other Services (Appropriation Act No.2 and Bill No.4) 361,415 386,786 Special Accounts 981,610 912,590 Expenses not requiring appropriation in the Budget year1 1,980 7,512
Departmental expensesDepartmental appropriation2 41,819 46,408
Expenses not requiring appropriation in the Budget year3 1,938 1,886
Total for Programme 1.1 1,436,967 1,440,256
Outcome 1 Total 1,436,967 1,440,256
Outcome 1 totals by appropriation type
Administered expensesOrdinary Annual Services (Appropriation Act No.1 & Bill No.3) 48,205 85,074 Other Services (Appropriation Act No.2 and Bill No.4) 361,415 386,786 Special Accounts 981,610 912,590 Expenses not requiring appropriation in the Budget year1 1,980 7,512
Departmental expensesDepartmental appropriation2 41,819 46,408
Expenses not requiring appropriation in the Budget year3 1,938 1,886
Total expenses for Outcome 1 1,436,967 1,440,256
2012-13 2013-14
Average staffing level (number) 187 193
Departmental appropriation splits and totals are indicative estimates and may change in the course of the budget year as government priorities change.
Notes: 1. Administered expenses not requiring appropriation in the Budget year is made up of expenses relating to
prepayments associated with prior year payments and the write down of assets. 2. Departmental appropriation combines ‘Ordinary annual services (Appropriation Act No. 1 and Bill No.3)’
and ‘Revenue from independent sources (s31)’. 3. Departmental expenses not requiring appropriation in the Budget year is made up of Depreciation and
Amortisation expenses.

Department of Infrastructure and Regional Development
35
Contributions to Outcome 1
Programme 1.1: Infrastructure investment
The key performance indicators are unchanged from those published in the 2013-14 PB Statements. However, the objective and deliverables for Programme 1.1 have been modified as outlined below.
Programme 1.1 Objective The key changes to the Programme 1.1 Objective include replacing references to the Nation Building Programme and the Sustainable Australia - Liveable Cities Programme with AusLink Programme and the Sustainable Australia - Liveable Communities Programme respectively. References to the National Urban Policy, Regional Infrastructure Fund and Infrastructure Working Group have been removed to reflect a change in government direction.
The modified objective is below.
The Infrastructure investment programme contributes to Outcome 1 by increasing the efficiency and safety of Australia’s land transport infrastructure whilst strengthening the Australian economy. This is accomplished through the provision of policy advice to the Australian Government, the delivery of a suite of administered items, and the work undertaken by Infrastructure Australia, supported by the Office of the Infrastructure Coordinator.
Components of Programme 1.1:
(a) Raising the standard of land transport infrastructure
The economic and social outcomes for all Australians depend upon the land transport networks available to them. The Department manages the programmes of the Australian Government’s significant investment in improving infrastructure for land transport operations. The Australian Government’s future infrastructure investment is planned around meeting Australia’s changing transport needs.
(b) Infrastructure policy initiatives
Infrastructure-related policy advice covers a range of infrastructure matters including infrastructure priorities, regulatory barriers, and improved planning regimes, along with support and input to COAG priorities and reforms.
In administering the AusLink Programme, the Department‘s role is to ensure delivery of the Australian Government’s infrastructure priorities in the land transport area.
(c) Infrastructure funding
The Department provides advice to the Australian Government on financing and implementation of infrastructure investment. This includes advice on Public Private Partnerships (PPPs), patronage risk and procurement options. To foster development of Australia’s construction market, the Department established the National Infrastructure Construction Schedule in 2012.
(d) Remedial road projects to improve safety and productivity
The Department manages the Black Spot projects administered item which focuses on treating high-risk sites to reduce the number and severity of road crashes. Funding is provided to jurisdictions for road maintenance and the Department is implementing the Heavy Vehicle Safety and Productivity projects to improve the safety and productivity of

Department of Infrastructure and Regional Development
36
heavy vehicle operations across Australia.
(e) Increasing the ability of local councils to improve land transport infrastructure
The Department manages the Roads to Recovery programme which provides funding to local councils to improve transport infrastructure.
(f) Major Projects Facilitation
The Department provides a Major Project Facilitation service that assists strategically significant private sector projects to obtain coordinated decisions on necessary Australian Government approvals and identifies any impediments to the investment proceeding. The service is tailored to suit each project, drawing on the Department’s knowledge and experience of government processes.
(g) Driving a national strategy to guide policy and investments in Australia
The Department works with states and territories to ensure that long term planning articulates nationally significant infrastructure planning and policy settings which in turn drive greater productivity, sustainability and liveability outcomes. This includes annual State of Australian Cities reporting.
(h) Supporting state, territory and local governments to increase the productivity, sustainability and liveability of our communities
The Department manages the Sustainable Australia – Liveable Communities Programme, which is in its final year.
(i) Infrastructure Australia
Infrastructure Australia provides advice on nationally significant infrastructure and urban systems which promote Australia’s productivity, with particular focus on the quality and efficiency of transport, water, energy and communication infrastructure, and the development and liveability of major cities across Australia.
This advice will be prepared in collaboration with the Department, other federal agencies, state and local governments, industry and the community.
Administered items • AusLink Programme
- AusLink Programme Investment1 - AusLink Black Spot Projects1 - AusLink Heavy Vehicle Safety and Productivity1 - AusLink Roads to Recovery - AusLink Off-Network Projects1
- AusLink Off-Network - supplementary - AusLink improving the National Network1
• AusLink Plan for the Future1 • Bridges Renewal Programme • Sustainable Australia - Liveable Communities1 • Sustainable Australia - National Smart Managed Motorways1
Notes: 1. The Department of the Treasury is appropriated for payments to and through states and territories for
National Partnership payments. Further information on these programmes can be found in Budget Paper 3 or the Treasury’s Portfolio Budget Statements (Programme 1.10).
Department of Infrastructure and Regional Development
37
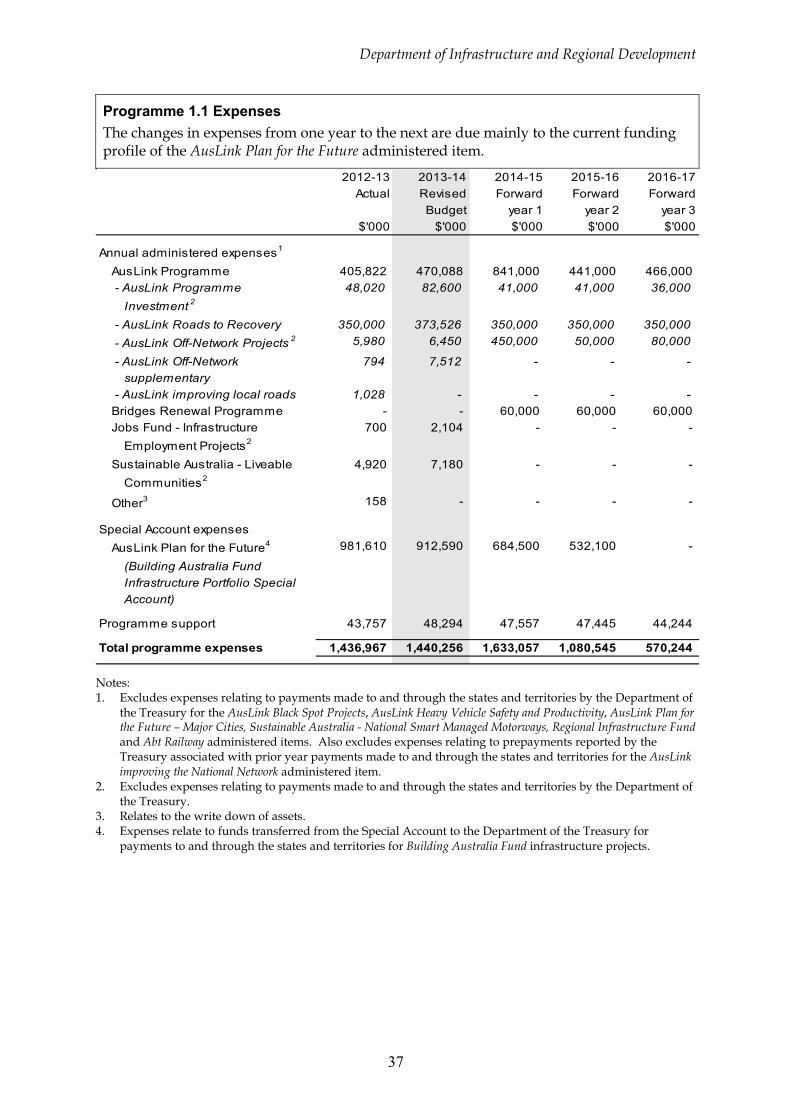
Programme 1.1 Expenses The changes in expenses from one year to the next are due mainly to the current funding profile of the AusLink Plan for the Future administered item.
2012-13 2013-14 2014-15 2015-16 2016-17Actual Revised Forward Forward Forward
Budget year 1 year 2 year 3$'000 $'000 $'000 $'000 $'000
Annual administered expenses1
AusLink Programme 405,822 470,088 841,000 441,000 466,000 - AusLink Programme 48,020 82,600 41,000 41,000 36,000
Investment 2
- AusLink Roads to Recovery 350,000 373,526 350,000 350,000 350,000 - AusLink Off-Network Projects 2 5,980 6,450 450,000 50,000 80,000
- AusLink Off-Network 794 7,512 - - - supplementary
- AusLink improving local roads 1,028 - - - - Bridges Renewal Programme - - 60,000 60,000 60,000 Jobs Fund - Infrastructure 700 2,104 - - -
Employment Projects2
Sustainable Australia - Liveable 4,920 7,180 - - - Communities2
Other3 158 - - - -
Special Account expensesAusLink Plan for the Future4 981,610 912,590 684,500 532,100 -
(Building Australia Fund Infrastructure Portfolio SpecialAccount)
Programme support 43,757 48,294 47,557 47,445 44,244
Total programme expenses 1,436,967 1,440,256 1,633,057 1,080,545 570,244
Notes: 1. Excludes expenses relating to payments made to and through the states and territories by the Department of
the Treasury for the AusLink Black Spot Projects, AusLink Heavy Vehicle Safety and Productivity, AusLink Plan for the Future – Major Cities, Sustainable Australia - National Smart Managed Motorways, Regional Infrastructure Fund and Abt Railway administered items. Also excludes expenses relating to prepayments reported by the Treasury associated with prior year payments made to and through the states and territories for the AusLink improving the National Network administered item.
2. Excludes expenses relating to payments made to and through the states and territories by the Department of the Treasury.
3. Relates to the write down of assets. 4. Expenses relate to funds transferred from the Special Account to the Department of the Treasury for
payments to and through the states and territories for Building Australia Fund infrastructure projects.

Department of Infrastructure and Regional Development
38
Programme 1.1 Deliverables
Three of the Programme 1.1 deliverables have been modified from those published in the 2013-14 PB Statements.
The modified deliverables, relating to the Nation Building (now AusLink) administered items, National Urban Policy and the National Land Freight Strategy are provided below. These variations have been made following a change in government direction.
Deliverables Year Target
Deliver the administered items in cooperation with state, territory and local governments.
2012-13 Revised budget Ongoing – refer to 2013-14 Budget target.
2013-14 Budget Payout of 100% funding for project progress.
2014-15 Forward year 1 Ongoing – refer to 2013-14 Budget target.
2015-16 Forward year 2 Ongoing – refer to 2013-14 Budget target.
2016-17 Forward year 3 Ongoing – refer to 2013-14 Budget target.
Identified integrated urban and regional infrastructure priorities.
2012-13 Revised budget Ongoing – refer to 2013-14 Budget target.
2013-14 Budget Implement agreed actions.
2014-15 Forward year 1 Ongoing – refer to 2013-14 Budget target.
2015-16 Forward year 2 Ongoing – refer to 2013-14 Budget target.
2016-17 Forward year 3 Ongoing – refer to 2013-14 Budget target.
National ports and land freight initiatives.
2012-13 Revised budget Recommendations considered by Australian governments.
2013-14 Budget Strategy implementation.
2014-15 Forward year 1 N/A.
2015-16 Forward year 2 N/A.
2016-17 Forward year 3 N/A.

Department of Infrastructure and Regional Development
39
Outcome 2: An efficient, sustainable, competitive, safe and secure transport system for all transport users through regulation, financial assistance and safety investigations.
Outcome 2 Strategy The strategy for Outcome 2 has changed from that published in the 2013-14 PB Statements.
The key changes include modifying the shipping reform activities from implementing initiatives to developing a maritime policy agenda. Strategies for national ports and freight have been replaced with initiatives. References to the National Aviation Policy ‘White Paper’ have been replaced with the Coalition’s Policy for Aviation. In addition, an external review of Australia’s system of aviation safety regulation has been included. These variations reflect a change in government direction.
The modified strategy is provided below.
Outcome 2 is delivered through the following programmes:
2.1 Transport security
2.2 Surface transport
2.3 Road safety
2.4 Air transport
Safe and efficient transport systems and transport infrastructure connect Australians with domestic markets and the nation to the global economy, and are key determinants of our economic growth. Given the current global and local economic situation, Australia’s prosperity depends on having a transport system that is efficient, sustainable, competitive, safe, secure and productive. Achieving long-term productivity growth will require reforms to support the operation of a seamless national economy.
During 2013-14 and forward years, the Department will continue to advise on and lead national efforts to address key transport issues that support an efficient, sustainable, competitive, safe and secure transport system, including:
• promoting integrated surface transport (road, rail) reforms supporting the operation of single national markets and building on effective relationships with key stakeholders, including other governments, unions, industry and regulators;
• finalising the implementation of COAG initiatives contributing towards a seamless national economy including national approaches to heavy vehicle regulation, maritime safety and rail safety regulation and investigation;
• continuing to develop a strong maritime policy agenda;
• collaborating with relevant agencies (including Infrastructure Australia) on the national ports and freight initiatives;
• commencing of the Navigation Act 2012;
• finalising the development of a Global Technical Regulation on Pole Side Impact, improving vehicle occupant protection in side impact crashes;
• ensuring vehicle standards deliver both safety and environmental outcomes and are consistent with international approaches;
Department of Infrastructure and Regional Development
40
• contributing to effective progress on the COAG Heavy Vehicle Charging and Investment Initiative (formerly the COAG Road Reform Plan);
• coordinating a review of the National Road Safety Strategy 2011-20 and ongoing road safety data collection and progress reporting;
• pursuing ongoing enhancements to Australia’s transport security framework;
• implementing the Australian Government’s aviation policy, including initiatives set out in the Coalition’s Policy for Aviation (2013);
• supporting the external review of Australia’s system of aviation safety regulation, announced by the Deputy Prime Minister on 13 November 2013;
• implementing strengthened aviation security measures;
• continuing to engage with Indonesia, Papua New Guinea and Pacific Island countries to enhance transport safety;
• introducing measures to strengthen transport security systems, including transport security coordination and passenger ship security;
• continuing to promote best practice regulation through progressive improvements in guidance materials, regulatory tools and processes; and
• delivering a range of associated administered items.
A major new activity during 2013-14 that will continue into the forward years is assisting the Australian Government to settle its strategy to address aviation capacity needs in the Sydney region and to work towards implementation.
In delivering the Outcome 2 programmes, the Department will consult extensively with state, territory and local governments and industry and, where appropriate, with foreign governments and international organisations.
Following COAG’s federal financial framework reforms the Treasury is responsible for National Partnership payments to and through the states and territories. The Treasury holds the appropriation for these items and reports the financial details accordingly. The non-financial performance of the corresponding programmes remains the responsibility of the Department. As a result, financial information for each affected programme will not be complete for each financial year within a single Portfolio Budget Statement.

Department of Infrastructure and Regional Development
41
Outcome 2 expense statement Table 2.2 provides an overview of the total expenses for Outcome 2, by programme.
Table 2.2: Budgeted expenses Outcome 2 2012-13 2013-14
Actual Revisedexpenses estimated
expenses$'000 $'000
Programme 2.1: Transport security
Administered expensesOrdinary Annual Services (Appropriation Act No.1 & Bill No.3) 9,695 5,295 Expenses not requiring appropriation in the Budget year1 147 -
Departmental expensesDepartmental appropriation2 78,126 86,338
Expenses not requiring appropriation in the Budget year3 4,767 3,885
Total for Programme 2.1 92,735 95,518
Programme 2.2: Surface transport
Administered expensesOrdinary Annual Services (Appropriation Act No.1 & Bill No.3) 209,834 222,576 Special Appropriations 106,600 117,364 Special Accounts 78,413 78,002 Expenses not requiring appropriation in the Budget year1 209 1,671
Departmental expensesDepartmental appropriation2 13,786 18,956
Expenses not requiring appropriation in the Budget year3 768 (1,648)
Total for Programme 2.2 409,610 436,921
Programme 2.3: Road safety
Administered expensesOrdinary Annual Services (Appropriation Act No.1 & Bill No.3) 4,480 4,500
Departmental expensesDepartmental appropriation2 17,914 18,989
Expenses not requiring appropriation in the Budget year3 1,118 923
Total for Programme 2.3 23,512 24,412
Programme 2.4: Air transport
Administered expensesOrdinary Annual Services (Appropriation Act No.1 & Bill No.3) 70,400 70,382 Special Appropriations 121,023 126,064 Expenses not requiring appropriation in the Budget year1 3,775 (942)
Departmental expensesDepartmental appropriation2 36,207 39,485
Expenses not requiring appropriation in the Budget year3 559 767
Total for Programme 2.4 231,964 235,756
Department of Infrastructure and Regional Development
42
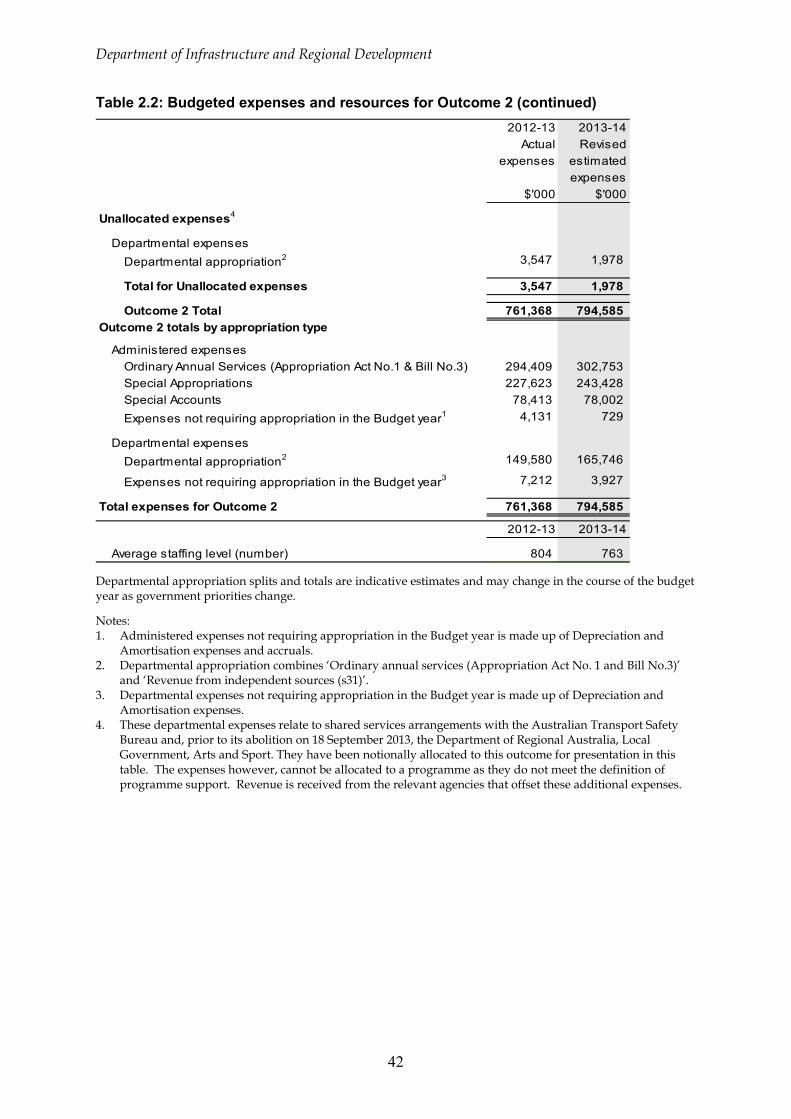
Table 2.2: Budgeted expenses and resources for Outcome 2 (continued) 2012-13 2013-14
Actual Revisedexpenses estimated
expenses$'000 $'000
Unallocated expenses4
Departmental expensesDepartmental appropriation2 3,547 1,978
Total for Unallocated expenses 3,547 1,978
Outcome 2 Total 761,368 794,585 Outcome 2 totals by appropriation type
Administered expensesOrdinary Annual Services (Appropriation Act No.1 & Bill No.3) 294,409 302,753 Special Appropriations 227,623 243,428 Special Accounts 78,413 78,002 Expenses not requiring appropriation in the Budget year1 4,131 729
Departmental expensesDepartmental appropriation2 149,580 165,746
Expenses not requiring appropriation in the Budget year3 7,212 3,927
Total expenses for Outcome 2 761,368 794,585
2012-13 2013-14
Average staffing level (number) 804 763
Departmental appropriation splits and totals are indicative estimates and may change in the course of the budget year as government priorities change.
Notes: 1. Administered expenses not requiring appropriation in the Budget year is made up of Depreciation and
Amortisation expenses and accruals. 2. Departmental appropriation combines ‘Ordinary annual services (Appropriation Act No. 1 and Bill No.3)’
and ‘Revenue from independent sources (s31)’. 3. Departmental expenses not requiring appropriation in the Budget year is made up of Depreciation and
Amortisation expenses. 4. These departmental expenses relate to shared services arrangements with the Australian Transport Safety
Bureau and, prior to its abolition on 18 September 2013, the Department of Regional Australia, Local Government, Arts and Sport. They have been notionally allocated to this outcome for presentation in this table. The expenses however, cannot be allocated to a programme as they do not meet the definition of programme support. Revenue is received from the relevant agencies that offset these additional expenses.

Department of Infrastructure and Regional Development
43
Contributions to Outcome 2
Programme 2.1: Transport security
The objective, deliverables and key performance indicators for Programme 2.1 are unchanged from that published in the 2013-14 PB Statements.
Programme 2.1 Expenses The decrease in expenses from 2013-14 is due mainly to measures announced in the 2010-11 Budget.
2012-13 2013-14 2014-15 2015-16 2016-17Actual Revised Forward Forward Forward
Budget year 1 year 2 year 3$'000 $'000 $'000 $'000 $'000
Annual administered expensesAviation security enhancements 880 997 1,016 1,034 1,057 - improving international aviation 44 23 23 23 23
security- regional passenger screening 836 974 993 1,011 1,034 Strengthening aviation security 8,962 4,298 - - - - optimal technologies at 8,213 100 - - -
international gateway airports- regional and domestic aviation 749 4,198 - - -
security
Programme support 82,893 90,223 88,121 91,834 84,713
Total programme expenses 92,735 95,518 89,137 92,868 85,770

Department of Infrastructure and Regional Development
44
Programme 2.2: Surface transport
The key performance indicators for Programme 2.2 are unchanged from those published in the 2013-14 PB Statements. However, the objective and deliverables have been modified.
Programme 2.2 Objective Three components of the Programme 2.2 Objective have been modified.
The modified components, relating to shipping policy reforms and sustaining maritime skills, and National Ports and Freight Strategies are provided below. These have been changed following a change in government direction. Further, the reference to the Standing Council on Transport and Infrastructure has been changed following a pending change to the COAG structure.
Components of Programme 2.2:
(d) Shipping policy and regulation
In consultation with key stakeholders, the Department will continue to develop a strong maritime policy agenda which meets the needs of both industry and Government, with a particular focus on optimising the regulation of the coastal shipping sector.
(f) Road transport policy
To improve heavy vehicle productivity and safety, the Department will contribute to the effective progress of the Council of Australian Government and Transport and Infrastructure Council reform agenda for road transport, including in relation to compliance and enforcement, high productivity heavy vehicles, and network access for performance-based standards vehicles and fatigue management.
(k) National ports and freight initiatives
The Department, in collaboration with the states and territories and other key stakeholders, will implement the national ports and freight initiatives.

Department of Infrastructure and Regional Development
45
Programme 2.2 Expenses The increase in expenses from one year to the next is mainly due to the demand driven nature of the Tasmanian Freight Equalisation Scheme and Bass Strait Passenger Equalisation Scheme administered items and the changing profile of expenses for the Payments to CAC Act bodies – AMSA administered item and special appropriation expenses.
2012-13 2013-14 2014-15 2015-16 2016-17Actual Revised Forward Forward Forward
Budget year 1 year 2 year 3$'000 $'000 $'000 $'000 $'000
Annual administered expenses1
Bass Strait Passenger Vehicle 34,495 37,000 37,700 38,600 39,600 Equalisation Scheme
International Maritime 184 312 284 303 308 Organization - contribution
OECD Road Transport - 35 40 40 42 43 contribution
Sustaining Australia's maritime - 1,625 1,650 1,725 - skills
Tasmanian Freight Equalisation 111,046 114,300 116,500 118,700 121,000 Scheme
Tasmanian Wheat Freight - 1,050 1,050 1,050 1,050 Scheme
Payments to CAC Act bodies - 63,323 65,080 56,523 57,622 66,138 AMSA
Payments to CAC Act bodies - 3,100 3,169 3,233 3,314 3,397 NTC
Other2 4 - - - -
Special Appropriation expensesAustralian Maritime Safety 106,889 119,034 133,344 149,167 154,796
Authority Act 1990 3
Protection of the Sea (Oil 146 1 1,000 1,000 1,000 Pollution Compensation Funds)Act 1993
Special Account expensesInterstate Road Transport fees - 75,834 78,002 79,562 81,153 82,776
(Interstate Road TransportSpecial Account)
Programme support 14,554 17,308 16,704 16,724 15,517
Total programme expenses 409,610 436,921 447,590 469,400 485,625
Notes 1. Excludes expenses relating to payments made to and through the states and territories by the Department of
the Treasury for the National Transport Reform administered items. 2. Relates to the write down of assets. 3. Relates to appropriation for CAC Act bodies which is provided through the Department.
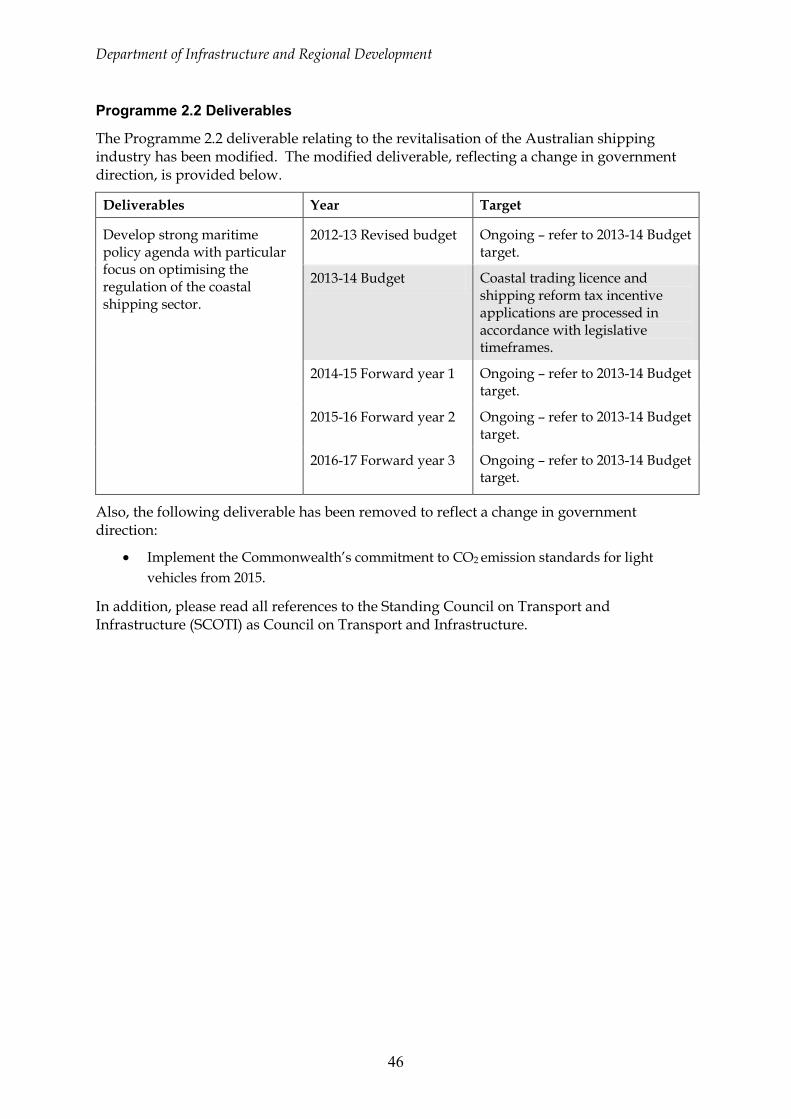
Department of Infrastructure and Regional Development
46
Programme 2.2 Deliverables
The Programme 2.2 deliverable relating to the revitalisation of the Australian shipping industry has been modified. The modified deliverable, reflecting a change in government direction, is provided below.
Deliverables Year Target
Develop strong maritime policy agenda with particular focus on optimising the regulation of the coastal shipping sector.
2012-13 Revised budget Ongoing – refer to 2013-14 Budget target.
2013-14 Budget Coastal trading licence and shipping reform tax incentive applications are processed in accordance with legislative timeframes.
2014-15 Forward year 1 Ongoing – refer to 2013-14 Budget target.
2015-16 Forward year 2 Ongoing – refer to 2013-14 Budget target.
2016-17 Forward year 3 Ongoing – refer to 2013-14 Budget target.
Also, the following deliverable has been removed to reflect a change in government direction:
• Implement the Commonwealth’s commitment to CO2 emission standards for light vehicles from 2015.
In addition, please read all references to the Standing Council on Transport and Infrastructure (SCOTI) as Council on Transport and Infrastructure.

Department of Infrastructure and Regional Development
47
Programme 2.3: Road safety
The objective, deliverables and key performance indicators for Programme 2.3 are unchanged from that published in the 2013-14 PB Statements.
Programme 2.3 Expenses 2012-13 2013-14 2014-15 2015-16 2016-17
Actual Revised Forward Forward ForwardBudget year 1 year 2 year 3
$'000 $'000 $'000 $'000 $'000
Annual administered expenseskeys2drive 3,500 3,500 4,000 4,000 - Seatbelts on regional school 980 1,000 1,000 1,000 -
buses
Programme support 19,032 19,912 19,970 20,010 18,866
Total programme expenses 23,512 24,412 24,970 25,010 18,866

Department of Infrastructure and Regional Development
48
Programme 2.4: Air transport
The objective, deliverables and key performance indicators for Programme 2.4 have been modified.
Programme 2.4 Objective Three components of the Programme 2.4 Objective have been modified.
The modified components, relating to the National Aviation Policy ‘White Paper’, the Joint Study on aviation capacity in the Sydney region and an external review of Australia’s system of aviation safety regulation, are provided below. These have been changed following a change in government direction.
Components of Programme 2.4:
(a) Implementation of the Australian Government’s aviation policies
The Department will coordinate the implementation of Australian Government aviation initiatives, including initiatives set out in the 2013 Coalition’s Policy for Aviation. The Department will consult with industry and key stakeholders to ensure the development of a safe, secure, environmentally sustainable and efficient aviation industry that will contribute to Australia’s future economic prosperity.
(b) Implementation of a strategy for enhanced aviation capacity in the Sydney region
The Department will provide advice as it continues to address the need for additional aviation capacity in the Sydney region.
(c) Maintaining aviation safety
The Department will work with government aviation agencies and industry in maintaining Australia's civil aviation safety record by supporting an effective regulatory framework and ensuring Australia's aviation safety-related agencies are well-placed to meet the challenges of an evolving aviation environment.
As announced by the Deputy Prime Minster on 13 November 2013, the Department will facilitate an external review of Australia’s system of aviation safety regulation, which will consider whether the current safety regulatory system is appropriate for the growing and evolving aviation industry and recommend possible improvements to ensure Australia remains at the forefront of aviation safety globally.
The Department will also support the continued alignment of Australia’s aviation framework with international practice through active membership of the International Civil Aviation Organization and bilateral cooperation. The Department will support Australian Government initiatives to assist other countries, including Indonesia, Papua New Guinea and Pacific Island countries, to continue to improve the safety and efficiency of aviation in the region.
In conjunction with other aviation agencies, the Department will continue to provide and coordinate advice on air safety and traffic management policy issues.
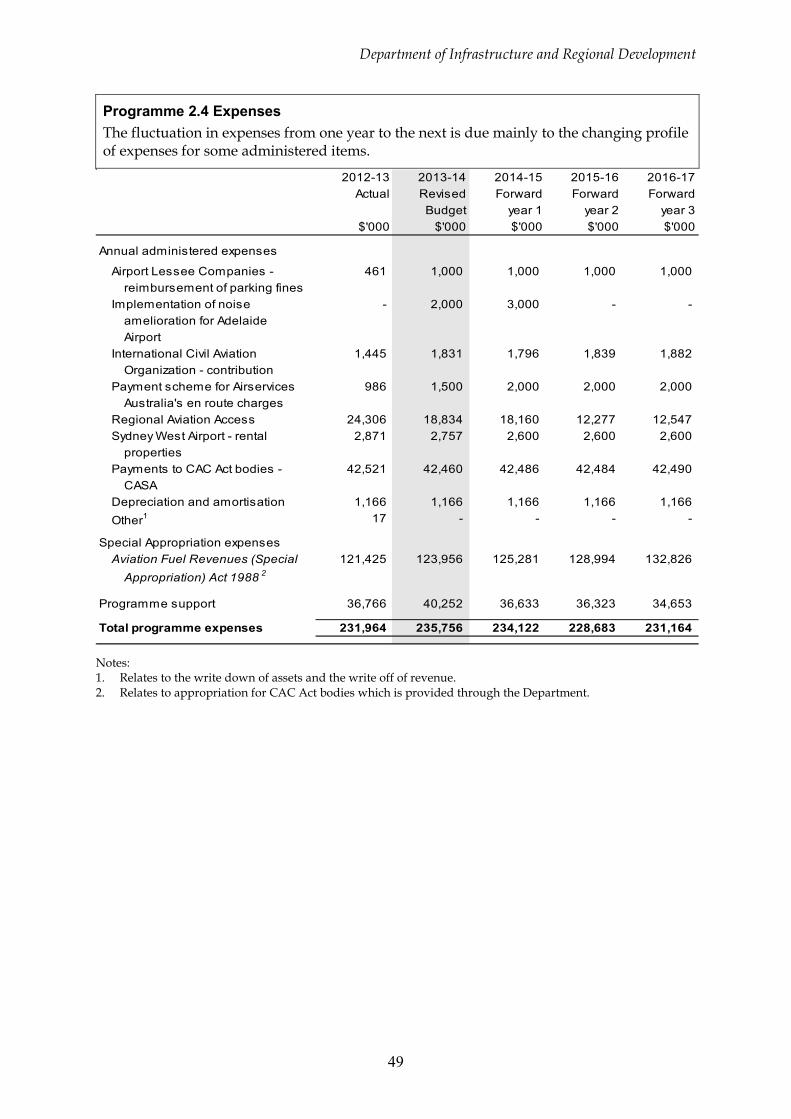
Department of Infrastructure and Regional Development
49
Programme 2.4 Expenses The fluctuation in expenses from one year to the next is due mainly to the changing profile of expenses for some administered items.
2012-13 2013-14 2014-15 2015-16 2016-17Actual Revised Forward Forward Forward
Budget year 1 year 2 year 3$'000 $'000 $'000 $'000 $'000
Annual administered expenses
Airport Lessee Companies - 461 1,000 1,000 1,000 1,000 reimbursement of parking fines
Implementation of noise - 2,000 3,000 - - amelioration for AdelaideAirport
International Civil Aviation 1,445 1,831 1,796 1,839 1,882 Organization - contribution
Payment scheme for Airservices 986 1,500 2,000 2,000 2,000 Australia's en route charges
Regional Aviation Access 24,306 18,834 18,160 12,277 12,547 Sydney West Airport - rental 2,871 2,757 2,600 2,600 2,600
propertiesPayments to CAC Act bodies - 42,521 42,460 42,486 42,484 42,490
CASADepreciation and amortisation 1,166 1,166 1,166 1,166 1,166 Other1 17 - - - -
Special Appropriation expensesAviation Fuel Revenues (Special 121,425 123,956 125,281 128,994 132,826
Appropriation) Act 1988 2
Programme support 36,766 40,252 36,633 36,323 34,653
Total programme expenses 231,964 235,756 234,122 228,683 231,164
Notes: 1. Relates to the write down of assets and the write off of revenue. 2. Relates to appropriation for CAC Act bodies which is provided through the Department.

Department of Infrastructure and Regional Development
50
Programme 2.4 Deliverables
Three of the Programme 2.4 deliverables have been modified from those published in the 2013-14 PB Statements.
The modified deliverables, relating to the National Aviation Policy ‘White Paper’, aircraft noise and Joint Study on Aviation Capacity for the Sydney Region, are provided below. These variations have been made following a change in government direction.
Deliverables Year Target
Aviation industry operates within a clear and robust regulatory framework. Aviation safety agency governance arrangements operate effectively.
2012-13 Revised budget Substantial progression of White paper initiatives.
2013-14 Budget Advice to incoming Government on new aviation policy initiatives and commencement of implementation. Facilitate the Aviation Safety Regulation Review.
2014-15 Forward year 1 Implement Government aviation policy initiatives.
2015-16 Forward year 2 Ongoing – refer to 2014-15 Budget target.
2016-17 Forward year 3 Ongoing – refer to 2014-15 Budget target.
Aviation environmental impact on communities including aircraft noise is monitored to ensure operator compliance with airport curfews and aircraft noise certification requirements, and appropriate noise disclosure in Airport Master Plans.
2012-13 Revised budget Ongoing – refer to 2013-14 Budget target.
2013-14 Budget Dispensation reports tabled; compliance with airport curfews; administration of aircraft noise regulations; and continued improvements in aircraft noise information.
2014-15 Forward year 1 Ongoing – refer to 2013-14 Budget target.
2015-16 Forward year 2 Ongoing – refer to 2013-14 Budget target.
2016-17 Forward year 3 Ongoing – refer to 2013-14 Budget target.

Department of Infrastructure and Regional Development
51
Deliverables Year Target
Implementation of the Australian Government’s strategy on aviation capacity in the Sydney region.
2012-13 Revised budget Ongoing – refer to 2013-14 Budget target.
2013-14 Budget Progress all elements of the Australian Government’s strategy for aviation capacity in the Sydney region.
2014-15 Forward year 1 Ongoing – refer to 2013-14 Budget target.
2015-16 Forward year 2 Ongoing – refer to 2013-14 Budget target.
2016-17 Forward year 3 Ongoing – refer to 2013-14 Budget target.
Programme 2.4 Key performance indicators
The following key performance indicator for Programme 2.4, relating to aviation policy, has been modified to remove reference to the National Aviation Policy White Paper from the target.
Key performance indicators Year Target
Policy advice is influential in the Government's response to current and emerging international and domestic aviation industry issues.
2012-13 Revised budget Ongoing – refer to 2013-14 Budget target.
2013-14 Budget Advice to Government on aviation policy issues and initiatives and work on implementation of policy directions.
2014-15 Forward year 1 N/A.
2015-16 Forward year 2 N/A.
2016-17 Forward year 3 N/A.

Department of Infrastructure and Regional Development
52
Outcome 3: Strengthening the sustainability, capacity and diversity of regional economies including through facilitating local partnerships between all levels of government and local communities; and providing grants and financial assistance.
This Outcome transferred to the Department following the Government’s administrative changes made on 18 September 2013. This outcome was known as Outcome 1 of the former DRALGAS and is now Outcome 3 for this Department.
Outcome 3 Strategy The strategy for Outcome 3 has changed from that published in the 2013-14 DRALGAS PB Statements.
The key changes include removing references to the COAG Regional Australia Standing Council; the Local Government Ministers’ Forum and Northern Australian Ministerial Forum. The changes also add references to the White Paper on developing northern Australia. These modifications reflect a change in government direction.
The modified strategy is provided below.
Outcome 3 is delivered through the following programmes:
3.1 Regional development
3.2 Local government
The Department will lead and advise on national efforts to address regional and local government issues by:
• developing and implementing policies and programmes to support economic growth and services to regional communities;
• working across the Commonwealth and other tiers of government to ensure the needs of regional communities are taken into account in Government decisions;
• progressing projects in regional economies in transition, including in Tasmania, Murray-Darling Basin, Latrobe Valley and northern Australia;
• supporting the network of 55 Regional Development Australia committees, 565 local governments and state and territory governments to ensure that policy making and advice is informed by local input and priorities;
• developing the National Stronger Regions Fund and managing regional and local government grants programmes, including the Community Development Grants, Regional Development Australia Fund, and the Community Infrastructure Grants programme which contribute to the development of local infrastructure, and the Local Government Financial Assistance Grants that support local government service delivery and infrastructure;
• coordinating, integrating and leveraging initiatives relating to the Government’s northern Australian programme. This includes supporting the Department of Prime Minister and Cabinet based taskforce responsible for the White Paper process on developing northern Australia;
• supporting effective planning and coordination across all levels of government on matters affecting local government and regional communities;

Department of Infrastructure and Regional Development
53
• coordinating and working with other Commonwealth and state government agencies to develop policy which underpins sound and innovative reconstruction and recovery efforts following the national disasters in late 2010 through to early 2013, and providing secretariat support to the Australian Government Reconstruction Inspectorate;
• managing Local Government Financial Assistance Grants that support local government service delivery and infrastructure, fostering better practice in respect of administering the Local Government Financial Assistance Grants, engaging with local government on nationally significant issues, the national awards for local governments and infrastructure funding options and responding to the review of the Local Government Financial Assistance Grants Programme; and
• undertaking activities to support a referendum on the recognition of local government in the Australian Constitution.

Department of Infrastructure and Regional Development
54
Outcome 3 expense statement Table 2.3 provides an overview of the total expenses for Outcome 3, by programme.
Table 2.3: Budgeted expenses Outcome 3 2012-13 2013-14
Actual Revisedexpenses estimated
expenses1
$'000 $'000
Programme 3.1: Regional development
Administered expensesOrdinary Annual Services (Appropriation Act No.1 & Bill No.3) - 278,139 Ordinary Annual Services (Appropriation Act No.2 & Bill No.4) - 7,000 Expenses not requiring appropriation in the Budget year2 - (9,308)
Departmental expensesDepartmental appropriation3 - 26,687
Expenses not requiring appropriation in the Budget year4 - 1,180
Total for Programme 3.1 - 303,698
Programme 3.2: Local government
Administered expensesOrdinary Annual Services (Appropriation Act No.1 & Bill No.3) - 1,186 Ordinary Annual Services (Appropriation Act No.2 & Bill No.4) - 13,361 Special Appropriations - 848,427 Expenses not requiring appropriation in the Budget year2 - 4,772
Departmental expensesDepartmental appropriation3 - 1,804
Expenses not requiring appropriation in the Budget year4 - 78
Total for Programme 3.2 - 869,628
Outcome 3 Total - 1,173,326 Outcome 3 totals by appropriation type
Administered expensesOrdinary Annual Services (Appropriation Act No.1 & Bill No.3) - 279,325 Ordinary Annual Services (Appropriation Act No.2 & Bill No.4) - 20,361 Special Appropriations - 848,427 Expenses not requiring appropriation in the Budget year2 - (4,536)
Departmental expensesDepartmental appropriation3 - 28,491
Expenses not requiring appropriation in the Budget year4 - 1,258
Total expenses for Outcome 3 - 1,173,326
2012-13 2013-14
Average staffing level (number) - 143
Departmental appropriation splits and totals are indicative estimates and may change in the course of the budget year as government priorities change.
Notes: 1. Excludes actuals incurred prior to the transfer of functions from DRALGAS in the AAO of
18 September 2013.

Department of Infrastructure and Regional Development
55
2. Administered expenses not requiring appropriation in the Budget year is made up of accruals. 3. Departmental appropriation combines ‘Ordinary annual services (Appropriation Act No. 1 and Bill No.3)’
and ‘Revenue from independent sources (s31)’. 4. Departmental expenses not requiring appropriation in the Budget year is made up of Depreciation and
Amortisation expenses.
Contributions to Outcome 3
Programme 3.1: Regional development
The objective, deliverables and key performance indicators for Programme 3.1 have been modified from that published in the 2013-14 DRALGAS PB Statements.
Programme 3.1 Objective Two of the components of the Programme 3.1 Objective have been modified.
The modified components, relating to regional and local infrastructure programmes and major regional initiatives, are provided below. These have been varied following a change in government direction.
The regional development programme contributes to Outcome 3 by strengthening the sustainability, capacity and diversity of regional economies including through facilitating local partnerships between all levels of government and local communities; and providing grants and financial assistance. These include:
Regional and Local Infrastructure Programmes: develops and implements programmes to fund capital works projects to improve socio-economic circumstances, build and improve locally identified priority facilities.
Regional Initiatives: develops and implements measures to support economic transition in specified regions, in collaboration with state, territory and local governments.

Department of Infrastructure and Regional Development
56
Programme 3.1 Expenses The fluctuation in expenses from one year to the next is due mainly to the changing profile of expenses for some administered items.
2012-13 2013-14 2014-15 2015-16 2016-17Actual Revised Forward Forward Forward
Budget1 year 1 year 2 year 3$'000 $'000 $'000 $'000 $'000
Annual administered expenses2
Boyer Pulp Mill - Structural - 14,000 - - - Assistance
Community Development - 22,000 160,000 140,000 20,000 Grants Fund
Community Infrastructure Grants3 - 44,023 11,850 - -
Latrobe Valley economic - 2,000 3,700 1,800 - diversification3
Murray-Darling Basin Regional - 18,990 27,998 26,024 24,683 Economic Diversification Programme
Northern Australia Sustainable - 1,399 971 - - Futures
Regional Development Australia - 10,307 19,566 19,919 20,337 Committees
Regional Development Australia - 135,151 111,540 30,561 1,133 Fund
Regional Development Projects - 500 4,300 - - in Northern Australia
Tasmanian Jobs and Growth - 27,461 40,000 20,000 13,000 Package
Programme support - 27,867 33,006 31,212 28,081
Total programme expenses - 303,698 412,931 269,516 107,234
Notes: 1. Excludes actuals incurred prior to the transfer of functions from DRALGAS in the AAO of
18 September 2013. 2. Excludes expenses relating to payments made to and through the states and territories by the Department of
the Treasury for the South Australia Economic Development Programme administered items. 3. Excludes expenses relating to payments made to and through the states and territories by the Department of
the Treasury.

Department of Infrastructure and Regional Development
57
Programme 3.1 Deliverables
Six of the Programme 3.1 deliverables have been modified.
References to the Regional Development Australia Fund and the Community Infrastructure Grants programme have been replaced with Community Development Grants Programme and National Stronger Regions Fund respectively.
Also, references to the Tasmanian Economic Diversification Package and the Tasmanian Forest Intergovernmental Agreement have been replaced with the Tasmanian Jobs and Growth Plan and the Government’s Economic Growth Plan for Tasmania respectively.
Activities relating to northern Australia have been modified, as well as removing the word ‘Major’ from Regional Initiatives to reflect changes in the government’s direction.
The deliverable relating to the Queensland Flood Recovery has been modified to refer to the Minister for Infrastructure and Regional Development.
The modified deliverables are provided below.
Regional and Local Infrastructure Programmes Support needed infrastructure that promotes stable, secure and viable local and
regional economies through the Community Development Grants Programme.
Establish the National Stronger Regions Fund which will invest in local capital works projects to improve local communities across Australia.
Northern Australia Sustainable Futures Provide advice to the Government concerning northern Australia issues including
long term options for the development of the region such as through the beef industry, water, resources and Indigenous economic development.
Regional Initiatives
Develop and implement the Tasmanian Jobs and Growth Plan as a part of the Government’s Economic Growth Plan for Tasmania.
Support the Latrobe Valley region of Victoria through the Latrobe Valley Economic Diversification Programme.
Implement the Murray Darling Regional Economic Diversification Programme to strengthen and diversify Murray Darling Basin communities that may be affected by the Murray Darling Basin Plan.
Support the development of the White Paper on Developing Northern Australia.
National Disaster Recovery Taskforce Provide responsive support to the Minister for Infrastructure and Regional
Development and the Australian Government Reconstruction Inspectorate.
Assure the Commonwealth that public funding of reconstruction efforts represents value for money.

Department of Infrastructure and Regional Development
58
Programme 3.1 Key performance indicators Four of the Programme 3.1 key performance indicators have been modified.
Indicators relating to the Regional Development Australia Fund (the Fund) have been modified to include references to the new Community Development Grants Programme which will replace the Fund when related activities are completed.
One new key performance indicator has been added relating to the establishment of the National Stronger Regions Fund.
Reference to the Northern Australian Ministerial Forum has been removed.
The word ‘Major’ from the Regional Initiatives section has been removed and Tasmania added as a priority area, to reflect changes in the government’s direction.
The modified key performance indicators are provided below.
Regional and Local Infrastructure Programmes Community Development Grants projects are implemented and support and
strengthen regions.
Provide timely advice to the Minister for the delivery of regional infrastructure funds including the Community Development Grants, Regional Development Australia Fund and the Community Infrastructure Grants.
Establish the National Stronger Regions Fund.
Northern Australia Sustainable Futures Delivery of programmes to support the sustainable development of Northern
Australia.
Regional Initiatives Implementation of initiatives developed for key priority areas including those related
to Murray-Darling Basin, Latrobe Valley, Tasmania and Northern Australia.
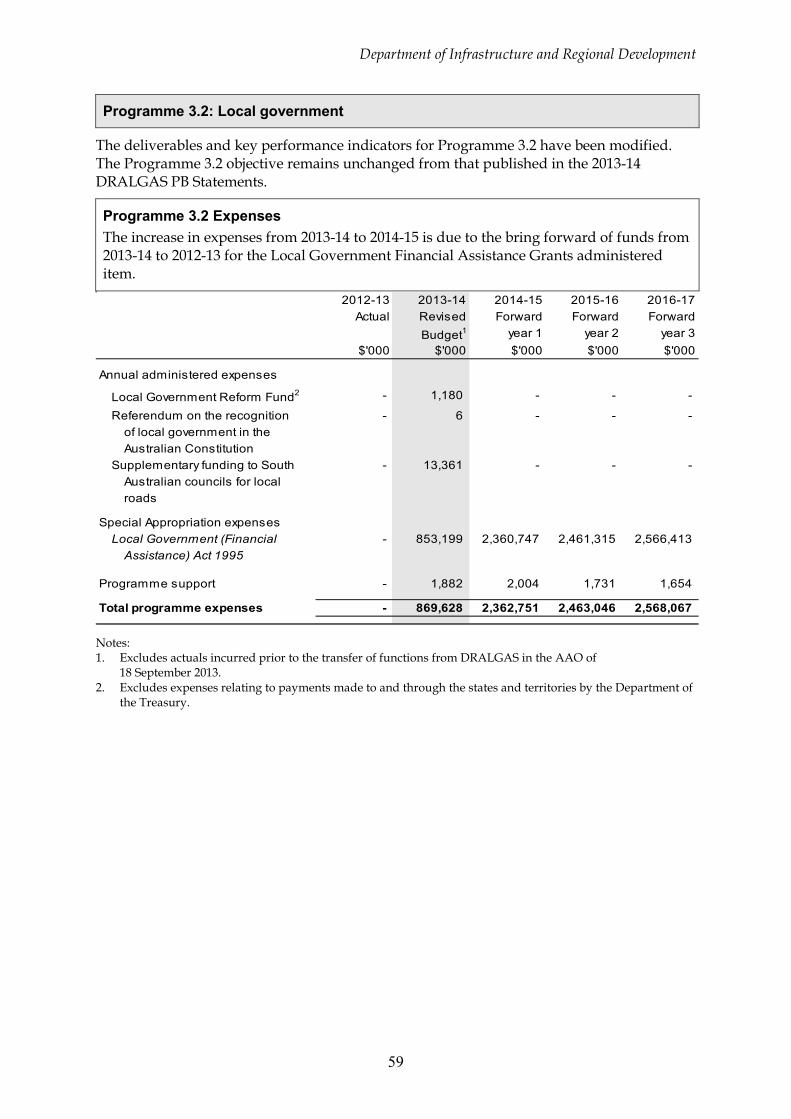
Department of Infrastructure and Regional Development
59
Programme 3.2: Local government
The deliverables and key performance indicators for Programme 3.2 have been modified. The Programme 3.2 objective remains unchanged from that published in the 2013-14 DRALGAS PB Statements.
Programme 3.2 Expenses The increase in expenses from 2013-14 to 2014-15 is due to the bring forward of funds from 2013-14 to 2012-13 for the Local Government Financial Assistance Grants administered item.
2012-13 2013-14 2014-15 2015-16 2016-17Actual Revised Forward Forward Forward
Budget1 year 1 year 2 year 3$'000 $'000 $'000 $'000 $'000
Annual administered expenses
Local Government Reform Fund2 - 1,180 - - -
Referendum on the recognition - 6 - - - of local government in theAustralian Constitution
Supplementary funding to South - 13,361 - - - Australian councils for localroads
Special Appropriation expensesLocal Government (Financial - 853,199 2,360,747 2,461,315 2,566,413
Assistance) Act 1995
Programme support - 1,882 2,004 1,731 1,654
Total programme expenses - 869,628 2,362,751 2,463,046 2,568,067
Notes: 1. Excludes actuals incurred prior to the transfer of functions from DRALGAS in the AAO of
18 September 2013. 2. Excludes expenses relating to payments made to and through the states and territories by the Department of
the Treasury.

Department of Infrastructure and Regional Development
60
Programme 3.2 Deliverables The Programme 3.2 deliverables have been modified from those published in the 2013-14 DRALGAS PB Statements, as outlined below.
Three deliverables have been removed. These relate to the referendum on the recognition of local government in the Australian Constitution, the Local Government Ministerial Forum and the Australian Council of Local Government (ACLG), and infrastructure financing by local government.
The deliverable relating to the review of the Local Government Financial Assistance Grants programme has been modified to more accurately reflect the role of the Department.
Two new deliverables have been included and relate to the Local Government National Report and the National Awards for Local Government.
The modified and new deliverables are provided below.
Local Government
Build capacity in local government, including through the ongoing operation of the Australian Centre of Excellence for Local Government.
Respond to the review of the Local Government Financial Assistance Grants programme in conjunction with state, territory and local governments.
Administer the Local Government (Financial Assistance) Act 1995.
Administer supplementary funding to South Australian councils for local roads.
Prepare the annual Local Government National Report.
Conduct the National Awards for Local Government.
Programme 3.2 Key performance indicators The Programme 3.2 key performance indicators have been modified except for one from those published in the 2013-14 DRALGAS PB Statements.
Three key performance indicators have been removed. These relate to infrastructure financing by local government, a referendum on the recognition of local government in the Australian Constitution and the Australian Council of Local Government.
The indicators relating to the review of the Local Government Financial Assistance Grants programme and the National Awards for local Government have been modified to more accurately reflect the role of the Department.
The modified and new key performance indicators are provided below.
Local Government
Local Government Financial Assistance Grants programme review responded to.
Participation in National Awards for Local Government is used as a tool for promoting innovation and best-practice service delivery.
Australian Centre of Excellence for Local Government contributes to innovative ideas for local government.
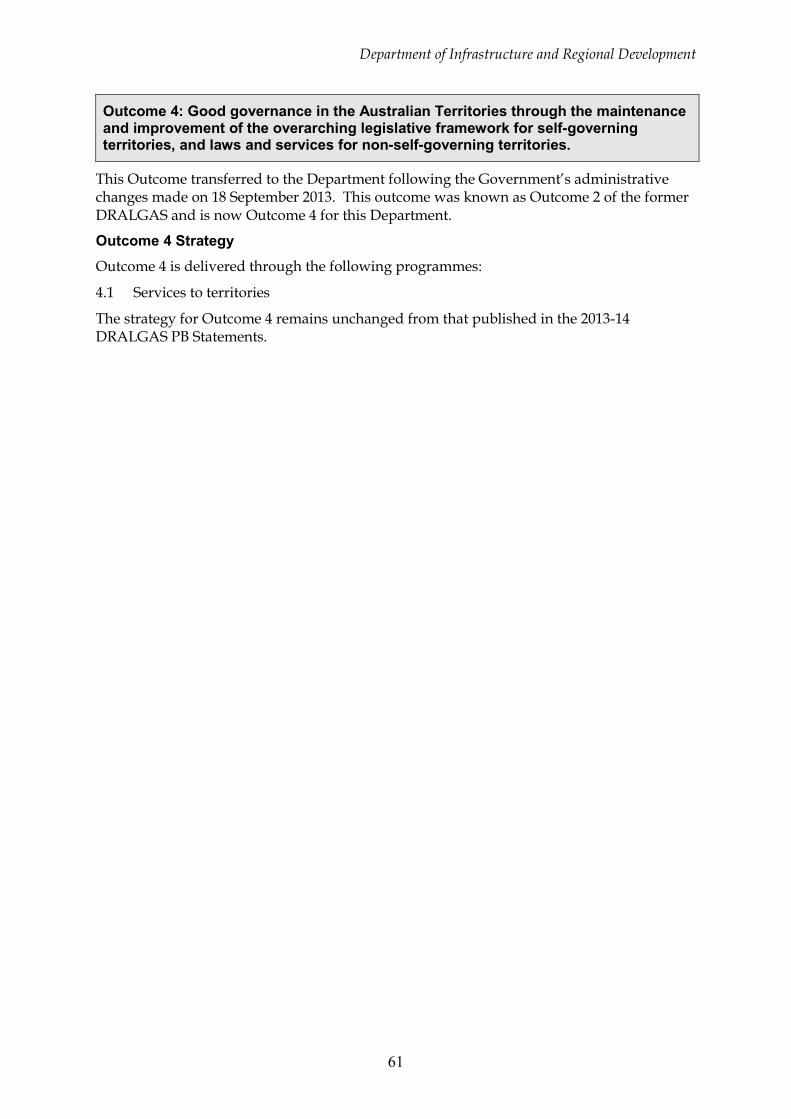
Department of Infrastructure and Regional Development
61
Outcome 4: Good governance in the Australian Territories through the maintenance and improvement of the overarching legislative framework for self-governing territories, and laws and services for non-self-governing territories.
This Outcome transferred to the Department following the Government’s administrative changes made on 18 September 2013. This outcome was known as Outcome 2 of the former DRALGAS and is now Outcome 4 for this Department.
Outcome 4 Strategy Outcome 4 is delivered through the following programmes:
4.1 Services to territories
The strategy for Outcome 4 remains unchanged from that published in the 2013-14 DRALGAS PB Statements.
Department of Infrastructure and Regional Development
62
Outcome 4 expense statement Table 2.4 provides an overview of the total expenses for Outcome 4, by programme.
Table 2.4: Budgeted expenses Outcome 4 2012-13 2013-14
Actual Revisedexpenses estimated
expenses1
$'000 $'000
Programme 4.1: Services to territories
Administered expensesOrdinary Annual Services (Appropriation Act No.1 & Bill No.3) - 139,896 Special Accounts - 1,710 Expenses not requiring appropriation in the Budget year2 - 5,634
Departmental expensesDepartmental appropriation3 - 8,672
Expenses not requiring appropriation in the Budget year4 - 392
Total for Programme 4.1 - 156,304
Outcome 2 Total - 156,304 Outcome 4 totals by appropriation type
Administered expensesOrdinary Annual Services (Appropriation Act No.1 & Bill No.3) - 139,896 Special Accounts - 1,710 Expenses not requiring appropriation in the Budget year2 - 5,634
Departmental expensesDepartmental appropriation3 - 8,672
Expenses not requiring appropriation in the Budget year4 - 392
Total expenses for Outcome 4 - 156,304
2012-13 2013-14
Average staffing level (number) - 44
Departmental appropriation splits and totals are indicative estimates and may change in the course of the budget year as government priorities change.
Notes: 1. Excludes actuals incurred prior to the transfer of functions from DRALGAS in the AAO of
18 September 2013. 2. Administered expenses not requiring appropriation in the Budget year is made up of Depreciation and
Amortisation expenses and accruals. 3. Departmental appropriation combines ‘Ordinary annual services (Appropriation Act No. 1 and Bill No.3)’
and ‘Revenue from independent sources (s31)’. 4. Departmental expenses not requiring appropriation in the Budget year is made up of Depreciation and
Amortisation expenses.

Department of Infrastructure and Regional Development
63
Contributions to Outcome 4
Programme 4.1: Services to territories
The objective, deliverables and key performance indicators for Programme 4.1 are unchanged from those published in the 2013-14 DRALGAS PB Statements.
Programme 4.1 Expenses The fluctuation in expenses from one year to the next is due mainly to the termination of the ‘Norfolk Island – reforms and services’ administered item in 2013-14 and the changing profile of depreciation expenses.
2012-13 2013-14 2014-15 2015-16 2016-17Actual Revised Forward Forward Forward
Budget1 year 1 year 2 year 3$'000 $'000 $'000 $'000 $'000
Annual administered expenses2
ACT Government - national - 1,674 1,965 1,998 2,015 capital functions
Norfolk Island - Commonwealth - 540 641 651 701 administration
Norfolk Island - Kingston and - 600 616 628 639 Arthur's Vale historic area
Norfolk Island - reforms and - 7,034 - - - services
Office of Administrator, Northern - 257 332 341 342 Territory
Services to Indian Ocean - 96,267 102,628 104,025 105,860 Territories
Services to Jervis Bay Territory - 5,634 5,864 5,956 6,103 Depreciation and amortisation - 33,655 43,644 41,685 36,740
Special Account expensesChristmas Island Phosphate - 1,579 1,614 1,649 1,686
Mining RehabilitationSpecial Account
Programme support - 9,064 10,674 9,415 8,975
Total programme expenses - 156,304 167,978 166,348 163,061
Notes: 1. Excludes actuals incurred prior to the transfer of functions from DRALGAS in the AAO of
18 September 2013. 2. Excludes expenses relating to payments made to and through the states and territories by the Department of
the Treasury for the Centenary of Canberra 2013 - a gift to the national capital and Centenary of Canberra 2013 - joint national programme administered items.
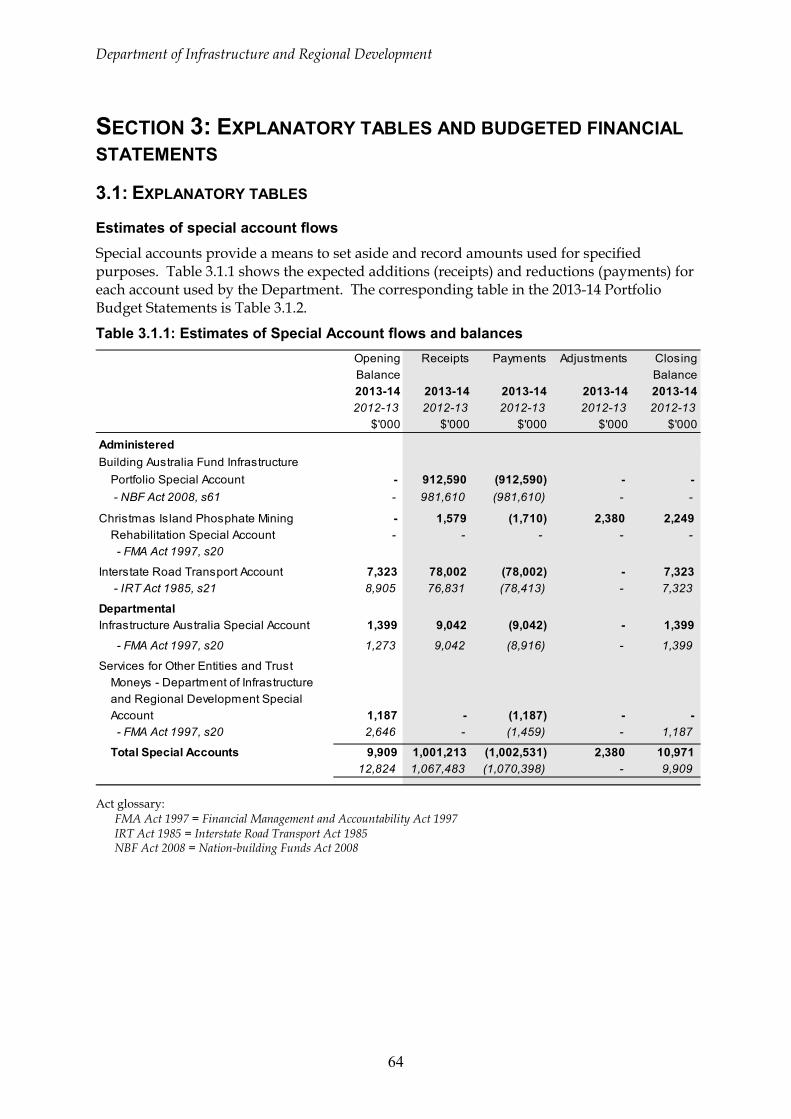
Department of Infrastructure and Regional Development
64
SECTION 3: EXPLANATORY TABLES AND BUDGETED FINANCIAL STATEMENTS 3.1: EXPLANATORY TABLES
Estimates of special account flows Special accounts provide a means to set aside and record amounts used for specified purposes. Table 3.1.1 shows the expected additions (receipts) and reductions (payments) for each account used by the Department. The corresponding table in the 2013-14 Portfolio Budget Statements is Table 3.1.2.
Table 3.1.1: Estimates of Special Account flows and balances Opening Receipts Payments Adjustments ClosingBalance Balance2013-14 2013-14 2013-14 2013-14 2013-142012-13 2012-13 2012-13 2012-13 2012-13
$'000 $'000 $'000 $'000 $'000
AdministeredBuilding Australia Fund Infrastructure
Portfolio Special Account - 912,590 (912,590) - - - NBF Act 2008, s61 - 981,610 (981,610) - -
Christmas Island Phosphate Mining - 1,579 (1,710) 2,380 2,249 Rehabilitation Special Account - - - - -
- FMA Act 1997, s20
Interstate Road Transport Account 7,323 78,002 (78,002) - 7,323 - IRT Act 1985, s21 8,905 76,831 (78,413) - 7,323
DepartmentalInfrastructure Australia Special Account 1,399 9,042 (9,042) - 1,399
- FMA Act 1997, s20 1,273 9,042 (8,916) - 1,399
Services for Other Entities and TrustMoneys - Department of Infrastructureand Regional Development SpecialAccount 1,187 - (1,187) - -
- FMA Act 1997, s20 2,646 - (1,459) - 1,187
Total Special Accounts 9,909 1,001,213 (1,002,531) 2,380 10,971 12,824 1,067,483 (1,070,398) - 9,909
Act glossary: FMA Act 1997 = Financial Management and Accountability Act 1997 IRT Act 1985 = Interstate Road Transport Act 1985 NBF Act 2008 = Nation-building Funds Act 2008

Department of Infrastructure and Regional Development
65
3.2: BUDGETED FINANCIAL STATEMENTS
3.2.1: Analysis of budgeted financial statements An analysis of the Department’s financial position, as reflected in the budgeted departmental financial statements and administered schedules for 2013-14, is provided below.
Departmental Budgeted departmental income statement
Total expenses are estimated to be $256.8m in 2013-14, an increase of $44.3m from Budget. The increase is primarily due to increased funding following the Administrative Arrangements Order of 18 September 2013 ($45.4m), revised depreciation estimates ($1.0m) and the impact of measures announced since Budget ($1.0m), partially offset by corrections to the accounting treatment of property rental expenses ($3.2m).
Chart 3.1: Total departmental expenses
0
50
100
150
200
250
300
2008-09 2009-10 2010-11 2011-12 2012-13 2013-14 2014-15 2015-16 2016-17$m
Budgeted departmental balance sheet
The Department’s major assets are in Buildings ($21.5m), Property, plant & equipment ($7.5m) and Intangibles ($14.5m). The Department’s primary liability continues to be accrued employee leave entitlements, estimated at $49.7m.
Administered Schedule of budgeted income and expenses administered on behalf of government
The Department administers the collection of taxes, fees and fines, other non-taxation revenue and interest and dividends estimated at $1 276.3m in 2013-14, representing an increase of $12.3m from Budget. The increase is primarily due to the transfer of revenue items from DRALGAS following the Administrative Arrangements Order of 18 September 2013 ($39.6m) and the return of previous year payments ($19.4m). These increases were partially offset by the revised profile of receipts from the Building Australia Fund special account for grants under the AusLink Plan for the Future administered item ($36.4m) and reduced dividends received from the Australian Rail Track Corporation Limited ($12.7m).
Administered expenses are budgeted at $3 307.7m in 2013-14, representing an increase of $1 269.6m from Budget and will be incurred for the administered items set out at Section 2. The increase is primarily due to the transfer of administered items from DRALGAS

Department of Infrastructure and Regional Development
66
following the Administrative Arrangements Order of 18 September 2013 ($1 290.8m), partially offset by changes in the funding profile of the AusLink Plan for the Future administered item ($36.4m).
Chart 3.2: Total administered expenses
- 1,000 2,000 3,000 4,000 5,000 6,000 7,000 8,000 9,000
10,000 11,000 12,000
2008-09 2009-10 2010-11 2011-12 2012-13 2013-14 2014-15 2015-16 2016-17
Infrastructure The Treasury
$m
Schedule of budgeted assets and liabilities administered on behalf of government
Total assets are expected to increase in 2013-14 by $722.5m to $5 284.4m from the 2012-13 actual result. The increase relates mainly to the transfer of assets from DRALGAS following the Administrative Arrangements Order of 18 September 2013 ($698.8m) and an increase in administered investments ($32.1m).

Department of Infrastructure and Regional Development
67
3.2.2: Budgeted financial statements tables Table 3.2.1: Comprehensive income statement (showing net cost of services)
(for the period ended 30 June) Actual Revised Forward Forward Forward
Notes budget estimate estimate estimate2012-13 2013-14 2014-15 2015-16 2016-17
$'000 $'000 $'000 $'000 $'000
EXPENSESEmployee benefits 3 117,365 146,138 156,334 153,133 150,871 Suppliers 4 72,089 98,386 87,551 91,329 77,795 Grants 301 500 500 500 500 Depreciation and amortisation 5 10,185 11,757 11,486 10,959 8,788 Finance costs 244 - - - - Write-down and impairment of assets 365 - - - -
Total expenses 200,549 256,781 255,871 255,921 237,954
LESS:OWN-SOURCE INCOME
Own-source revenueSale of goods and rendering of services 6,982 9,988 7,545 10,903 7,594 Other revenue - 74 80 80 80
Total own-source revenue 6 6,982 10,062 7,625 10,983 7,674
GainsSale of assets 53 - - - - Reversals of previous asset
write-downs and impairments 1,573 - - - - Other 5,112 2,020 2,032 2,393 2,907
Total gains 6,738 2,020 2,032 2,393 2,907
Total own-source income 13,720 12,082 9,657 13,376 10,581
Net cost of (contribution by) services 186,829 244,699 246,214 242,545 227,373
Revenue from Government 180,689 232,942 234,728 231,586 218,585 Surplus (Deficit) attributable to the
Australian Government (6,140) (11,757) (11,486) (10,959) (8,788)
OTHER COMPREHENSIVE INCOMEChanges in asset revaluation surplus (2,509) - - - -
Total other comprehensive income (2,509) - - - - Total comprehensive income (loss) (8,649) (11,757) (11,486) (10,959) (8,788) Total comprehensive income (loss)
attributable to the AustralianGovernment (8,649) (11,757) (11,486) (10,959) (8,788)
Note: Impact of Net Cash Appropriation 2012-13 2013-14 2014-15 2015-16 2016-17Arrangements $'000 $'000 $'000 $'000 $'000
Total comprehensive income (loss) lessdepreciation/amortisation expenses previouslyfunded through revenue appropriations 1,536 - - - -
plus depreciation/amortisation expenses previouslyfunded through revenue appropriations1 10,185 11,757 11,486 10,959 8,788
Total comprehensive income (loss) - as perStatement of Comprehensive Income (8,649) (11,757) (11,486) (10,959) (8,788)
Prepared on Australian Accounting Standards basis.

Department of Infrastructure and Regional Development
68
Notes: 1. From 2010-11, the Government introduced net cash appropriation arrangements where Appropriation
Act No.1 or Bill No.3 revenue appropriations for the depreciation/amortisation expenses of FMA Act agencies were replaced with a separate capital budget (the Departmental Capital Budget, or DCB) provided through Appropriation Act No.1 or Bill No.3 equity appropriations. For information regarding DCB’s, please refer to Table 3.2.5 Departmental Capital Budget Statement.
Table 3.2.2: Budgeted departmental balance sheet (as at 30 June)
Actual Revised Forward Forward ForwardNotes budget estimate estimate estimate
2012-13 2013-14 2014-15 2015-16 2016-17$'000 $'000 $'000 $'000 $'000
ASSETS
Financial assetsCash and cash equivalents 1,555 1,555 1,555 1,555 1,555 Trade and other receivables 85,685 95,172 93,977 88,114 86,197 Other financial assets 789 790 790 790 790
Total financial assets 7 88,029 97,517 96,322 90,459 88,542
Non-financial assetsLand and buildings 18,880 21,497 16,795 12,635 12,430 Property, plant and equipment 6,401 7,460 5,106 2,865 2,836 Intangibles 9,874 14,457 16,390 17,530 19,514 Other non-financial assets 4,812 4,812 4,812 4,812 4,812
Total non-financial assets 8 39,967 48,226 43,103 37,842 39,592
Total assets 127,996 145,743 139,425 128,301 128,134
LIABILITIES
PayablesSuppliers 10,589 10,728 10,871 10,871 10,871 Other payables 6,253 6,844 7,149 3,411 3,870
Total payables 16,842 17,572 18,020 14,282 14,741
ProvisionsEmployee provisions 36,045 49,671 49,346 48,900 48,717 Other provisions 15,972 14,892 13,574 11,895 9,702
Total provisions 9 52,017 64,563 62,920 60,795 58,419 Total liabilities 68,859 82,135 80,940 75,077 73,160
Net assets 59,137 63,608 58,485 53,224 54,974
EQUITYContributed equity (125,727) (109,499) (103,136) (97,438) (86,900)Reserves 16,203 16,203 16,203 16,203 16,203 Retained surplus (accumulated deficit) 168,661 156,904 145,418 134,459 125,671
Total equity 59,137 63,608 58,485 53,224 54,974
Prepared on Australian Accounting Standards basis.

Department of Infrastructure and Regional Development
69
Table 3.2.3: Departmental statement of changes in equity – summary of movement (Budget year 2013-14)
Retained Asset Other Contributed Totalearnings revaluation reserves equity/ equity
reserve capital$'000 $'000 $'000 $'000 $'000
Opening balance as at 1 July 2013Balance carried forw ard from previous period 168,661 16,203 - (125,727) 59,137
Adjusted opening balance 168,661 16,203 - (125,727) 59,137
Comprehensive incomeSurplus (deficit) for the period (11,757) - - - (11,757)
Total comprehensive income (11,757) - - - (11,757)of w hich:
Attributable to the Australian Government (11,757) - - - (11,757)
Transactions with ownersContribution by owners
Departmental Capital Budget (DCBs) - - - 5,643 5,643 Restructuring - - - 10,585 10,585
Sub-total transactions with owners - - - 16,228 16,228
Estimated closing balance as at 30 June 2014 156,904 16,203 - (109,499) 63,608
Less non-controlling interest - - - - -
Closing balance attributable to theAustralian Government 156,904 16,203 - (109,499) 63,608
Prepared on Australian Accounting Standards basis.

Department of Infrastructure and Regional Development
70
Table 3.2.4: Budgeted departmental statement of cash flows (for the period ended 30 June)
Actual Revised Forward Forward Forwardbudget estimate estimate estimate
2012-13 2013-14 2014-15 2015-16 2016-17$'000 $'000 $'000 $'000 $'000
OPERATING ACTIVITIESCash received
Appropriations 212,415 248,165 235,823 237,449 220,502 Sale of goods and rendering of
services 8,729 15,928 11,500 14,917 11,670 Other 10,344 6,908 4,606 4,606 4,606
Total cash received 231,488 271,001 251,929 256,972 236,778
Cash usedEmployees 114,436 143,126 156,254 157,317 150,595 Suppliers 91,151 109,106 90,649 94,629 81,157 Grants 301 500 500 500 500 Section 31 receipts transferred to OPA 24,357 - - - - Other - 14,478 4,526 4,526 4,526
Total cash used 230,245 267,210 251,929 256,972 236,778 Net cash from (used by) operating
activities 1,243 3,791 - - -
INVESTING ACTIVITIESCash received
Proceeds from sales of property, plantand equipment and intangibles 107 - - - -
Total cash received 107 - - - -
Cash usedPurchase of land and building 401 - - - - Purchase of property plant and
equipment and intangibles 1,601 9,434 6,363 5,698 10,538 Purchase of intangibles 4,824 - - - -
Total cash used 6,826 9,434 6,363 5,698 10,538
Net cash from (used by) investingactivities (6,719) (9,434) (6,363) (5,698) (10,538)
FINANCING ACTIVITIESCash received
Contributed equity 6,067 5,643 6,363 5,698 10,538 Total cash received 6,067 5,643 6,363 5,698 10,538
Net cash from (used by) financingactivities 6,067 5,643 6,363 5,698 10,538
Net increase (decrease) in cash held 591 - - - -
Cash and cash equivalents at thebeginning of the reporting period 964 1,555 1,555 1,555 1,555
Cash and cash equivalents at the endof the reporting period 1,555 1,555 1,555 1,555 1,555
Prepared on Australian Accounting Standards basis.

Department of Infrastructure and Regional Development
71
Table 3.2.5: Departmental capital budget statement Actual Revised Forward Forward Forward
budget estimate estimate estimate2012-13 2013-14 2014-15 2015-16 2016-17
$'000 $'000 $'000 $'000 $'000
NEW CAPITAL APPROPRIATIONSCapital budget - Bill 1 (DCB) 9,631 5,643 6,363 5,698 10,538 Equity injections - Bill 2 - 23,416 - - -
Total new capital appropriations 9,631 29,059 6,363 5,698 10,538
Provided for:Purchase of non-financial assets 9,631 5,643 6,363 5,698 10,538 Other items - 23,416 - - -
Total items 9,631 29,059 6,363 5,698 10,538
PURCHASE OF NON-FINANCIAL ASSETSFunded by capital appropriations1 997 2,153 - - -
Funded by capital appropriations - DCB2 5,829 7,281 6,363 5,698 10,538
Total 6,826 9,434 6,363 5,698 10,538
RECONCILIATION OF CASH USED TOACQUIRE ASSETS TO ASSETMOVEMENT TABLETotal purchases 6,826 9,434 6,363 5,698 10,538
Total cash used to acquire assets 6,826 9,434 6,363 5,698 10,538
Consistent with information contained in the Statement of Asset Movements and the Budgeted Statement of Cash Flows basis.
Notes: 1. Includes both current and prior year Appropriation Act No.2 and Bills Nos.4/6. 2. Includes both current and previous year’s Departmental Capital Budgets (DCBs).

Department of Infrastructure and Regional Development
72
Table 3.2.6: Statement of asset movements (2013-14) Buildings Property, Intangibles Total
plant andequipment
$'000 $'000 $'000 $'000
As at 1 July 2013Gross book value 27,205 9,279 39,438 75,922 Accumulated depreciation/amortisation and impairment (8,325) (2,878) (29,564) (40,767)
Opening net book balance 18,880 6,401 9,874 35,155
CAPITAL ASSET ADDITIONSEstimated expenditure on new or replacement assets
By purchase - appropriation equity1 - - 2,153 2,153 By purchase - appropriation ordinary annual services2 651 1,208 5,422 7,281
From acquisition of entities or operations (includingrestructuring) 7,224 2,570 788 10,582
Sub-total 7,875 3,778 8,363 20,016
Other movementsDepreciation/amortisation expense (5,258) (2,719) (3,780) (11,757)
Sub-total (5,258) (2,719) (3,780) (11,757)
As at 30 June 2014Gross book value 35,080 13,057 47,801 95,938 Accumulated depreciation/amortisation and impairment (13,583) (5,597) (33,344) (52,524)
Closing net book balance 21,497 7,460 14,457 43,414
Prepared on Australian Accounting Standards basis.
Notes: 1. ‘Appropriation equity’ refers to equity injections provided through Appropriation Act No. 2 and Bill No. 4
2013-14. 2. ‘Appropriation ordinary annual services’ refers to funding provided through Appropriation Act No. 1 and
Bill No. 3 2013-14 for DCBs.

Department of Infrastructure and Regional Development
73
Table 3.2.7: Schedule of budgeted income and expenses administered on behalf of Government (for the period ended 30 June)
Actual Revised Forward Forward ForwardNotes budget estimate estimate estimate
2012-13 2013-14 2014-15 2015-16 2016-17$'000 $'000 $'000 $'000 $'000
EXPENSES ADMINISTERED ONBEHALF OF GOVERNMENTEmployee benefits - 12,083 13,561 13,968 14,387 Supplier expenses 18,079 109,706 113,844 112,106 109,072 Subsidies 161,521 177,684 170,310 173,627 176,197 Grants 1,707,751 2,862,687 4,672,100 4,093,750 3,542,741 Depreciation and amortisation 1,166 34,821 44,810 42,851 37,906 Payments to CAC Act bodies 108,944 110,709 102,242 103,420 112,025 Write-down and impairment of assets 162 - - - - Other expenses 163 1 1,000 1,000 1,000
Total expenses administeredon behalf of Government 10 1,997,786 3,307,691 5,117,867 4,540,722 3,993,328
LESS:OWN-SOURCE INCOMEOwn-source incomeTaxation revenue
Other taxes 24,772 34,117 37,451 35,753 37,108 Total taxation revenue 24,772 34,117 37,451 35,753 37,108
Non-taxation revenueSale of goods and rendering of 1,815 29,015 20,000 20,000 20,000
servicesFees and fines 200,572 215,491 230,505 247,919 255,171 Interest 125 4,186 5,284 4,389 3,995 Dividends 21,000 53,550 86,200 123,800 150,900 Rental income 3,050 5,365 6,288 6,308 6,326 Other revenue 1,014,851 934,557 687,124 534,759 2,696
Total non-taxation revenue 1,241,413 1,242,164 1,035,401 937,175 439,088 Total own-source revenues administered
on behalf of Government 11 1,266,185 1,276,281 1,072,852 972,928 476,196
Total own-source income administeredon behalf of Government 1,266,185 1,276,281 1,072,852 972,928 476,196
Net cost of (contribution by) services 731,601 2,031,410 4,045,015 3,567,794 3,517,132 Surplus (Deficit) (731,601) (2,031,410) (4,045,015) (3,567,794) (3,517,132)
OTHER COMPREHENSIVE INCOME
Changes in asset revaluation reserves (63,922) - - - - Total other comprehensive income (63,922) - - - - Total comprehensive income (loss) (795,523) (2,031,410) (4,045,015) (3,567,794) (3,517,132)
Prepared on Australian Accounting Standards basis.

Department of Infrastructure and Regional Development
74
Table 3.2.8: Schedule of budgeted assets and liabilities administered on behalf of Government (as at 30 June)
Actual Revised Forward Forward ForwardNotes budget estimate estimate estimate
2012-13 2013-14 2014-15 2015-16 2016-17$'000 $'000 $'000 $'000 $'000
ASSETS
Financial assetsReceivables 5,368 80,862 68,970 63,523 59,742 Investments accounted for using the
equity method 4,482,405 4,514,490 4,514,490 4,514,490 4,853,490 Other investments 783 783 783 783 783 Other financial assets 8,179 7,798 7,798 7,798 7,798
Total financial assets 12 4,496,735 4,603,933 4,592,041 4,586,594 4,921,813
Non-financial assetsLand & buildings 49,608 237,927 228,001 218,348 208,460 Infrastructure, plant and equipment - 324,737 305,496 284,839 269,351 Heritage and cultural assets 8,050 106,606 106,167 105,728 105,289 Intangibles - 3,685 3,327 2,989 2,651 Inventories - 2,060 2,060 2,060 2,060 Other non-financial assets 7,512 5,418 4,098 4,098 4,098
Total non-financial assets 65,170 680,433 649,149 618,062 591,909
Total assets administered on behalfof Government 4,561,905 5,284,366 5,241,190 5,204,656 5,513,722
LIABILITIES
PayablesSuppliers 333 100 100 100 100 Subsidies 4,129 3,788 3,788 3,788 3,788 Personal benefits - 3,372 2,793 2,876 2,963 Grants 20,825 20,028 20,090 20,565 20,605 Other payables - 2,249 2,153 2,092 2,068
Total payables 25,287 29,537 28,924 29,421 29,524 Total liabilities administered on behalf
of Government 25,287 29,537 28,924 29,421 29,524 Net assets/(liabilities) 4,536,618 5,254,829 5,212,266 5,175,235 5,484,198
Prepared on Australian Accounting Standards basis.

Department of Infrastructure and Regional Development
75
Table 3.2.9: Schedule of budgeted administered cash flows (for the period ended 30 June)
Actual Revised Forward Forward Forwardbudget estimate estimate estimate
2012-13 2013-14 2014-15 2015-16 2016-17$'000 $'000 $'000 $'000 $'000
OPERATING ACTIVITIESCash received
Interest 125 4,577 4,400 3,556 3,221 Dividends 21,000 53,550 86,200 123,800 150,900 Taxes 24,198 34,116 36,451 34,753 36,108 Fees 94,170 127,781 116,159 117,750 119,373 Fines 908 1,056 1,000 1,000 1,000 Other 1,024,266 959,544 708,412 556,067 24,022
Total cash received 1,164,667 1,180,624 952,622 836,926 334,624
Cash usedGrant payments 1,711,480 2,870,208 4,673,949 4,096,587 3,546,096 Subsidies paid 162,220 181,789 170,310 173,627 176,197 Personal benefits - 11,980 14,140 13,885 14,300 Suppliers 18,254 124,840 113,844 112,106 109,072 Payments to CAC Act bodies 108,944 107,540 99,009 100,106 108,628 Other - 15,000 15,000 15,000 15,000
Total cash used 2,000,898 3,311,357 5,086,252 4,511,311 3,969,293 Net cash from (used by) operating
activities (836,231) (2,130,733) (4,133,630) (3,674,385) (3,634,669)
INVESTING ACTIVITIESCash received
Repayment of advances and loans 383 10,074 12,838 6,755 4,595 Total cash received 383 10,074 12,838 6,755 4,595
Cash usedPurchase of property, plant,
equipment and intangibles - 37,009 14,942 11,825 11,777 Investments 219,080 32,085 - - 339,000
Total cash used 219,080 69,094 14,942 11,825 350,777
Net cash from (used by) investingactivities (218,697) (59,020) (2,104) (5,070) (346,182)
Net increase / (decrease) in cash held (1,054,928) (2,189,753) (4,135,734) (3,679,455) (3,980,851)
Cash and cash equivalents atbeginning of reporting period - - - - -
Cash from Official Public Account for: - Appropriations 1,160,100 2,389,859 4,337,132 3,909,883 3,898,294 - Special Accounts 1,060,026 990,592 764,062 613,253 421,776
2,220,126 3,380,451 5,101,194 4,523,136 4,320,070
Cash to Official Public Account for: - Appropriations (106,764) (200,106) (201,398) (230,428) (256,443) - Special Accounts (1,058,434) (990,592) (764,062) (613,253) (82,776)
(1,165,198) (1,190,698) (965,460) (843,681) (339,219)
Cash and cash equivalents at endof reporting period - - - - -
Prepared on Australian Accounting Standards basis.

Department of Infrastructure and Regional Development
76
Table 3.2.10: Schedule of administered capital budget Actual Revised Forward Forward Forward
budget estimate estimate estimate2012-13 2013-14 2014-15 2015-16 2016-17
$'000 $'000 $'000 $'000 $'000
NEW CAPITAL APPROPRIATIONSCapital budget - Act 1 (ACB) - 7,073 11,846 11,764 11,753 Administered assets and liabilities - Act 2 - 54,092 3,000 - -
Total new capital appropriations - 61,165 14,846 11,764 11,753
Provided for:Purchase of non-financial assets - 36,565 14,846 11,764 11,753 Other items - 24,600 - - -
Total tems - 61,165 14,846 11,764 11,753
PURCHASE OF NON-FINANCIAL ASSETSFunded by capital appropriations1 - 29,492 3,000 - - Funded by capital appropriation - ACB2 - 7,073 11,846 11,764 11,753
Total - 36,565 14,846 11,764 11,753
Consistent with information contained in the Statement of Asset Movements and the Budgeted Statement of Cash Flows.
Notes: 1. Includes both current and prior year Appropriation Act No.2 and Bills Nos.4/6. 2. Includes both current and previous year’s Administered Capital Budgets (ACBs).

Department of Infrastructure and Regional Development
77
Table 3.2.11: Schedule of asset movements (2013-14) Land Buildings Other Heritage Computer Total
property, and softwareplant and cultural and
equipment assets intangibles$'000 $'000 $'000 $'000 $'000 $'000
As at 1 July 2013Gross book value 39,200 11,762 - 8,050 - 59,012 Accumulated depreciation/amortisation - (1,354) - - - (1,354)
Opening net book balance 39,200 10,408 - 8,050 - 57,658
CAPITAL ASSET ADDITIONSEstimated expenditure on new or
replacement assetsby purchase - appropriation equity1 - 8,741 20,751 - - 29,492 By purchase - appropriation ordinary
annual services2 - - 7,073 - - 7,073 From acquisition of entities or
operations (including restructuring) 70,458 123,564 373,843 99,409 4,107 671,381 Total additions 70,458 132,305 401,667 99,409 4,107 707,946
Other movementsDepreciation/amortisation expense - (8,130) (26,161) (349) (181) (34,821)Other - (6,314) (50,769) (504) (241) (57,828)
Total other movements - (14,444) (76,930) (853) (422) (92,649)
As at 30 June 2014Gross book value 109,658 144,067 401,667 107,459 4,107 766,958 Accumulated depreciation/amortisation - (15,798) (76,930) (853) (422) (94,003)
Closing net book balance 109,658 128,269 324,737 106,606 3,685 672,955
Prepared on Australian Accounting Standards basis.
Notes: 1. ‘Appropriation equity’ refers to Administered Assets and Liabilities appropriations provided through
Appropriation Act No. 2 and Bill No. 4 2013-14. 2. ‘Appropriation ordinary annual services’ refers to funding provided through Appropriation Act No. 1 and
Bill No. 3 2013-14 for depreciation / amortisation expenses, ACBs or other operational expenses.

Department of Infrastructure and Regional Development
78
3.2.3: Notes to the financial statements 1. Accounting policy The budgeted financial statements have been prepared on an accrual accounting basis, having regard to Statements of Accounting Concepts, and in accordance with: • the Finance Minister’s Orders; • Australian Accounting Standards; • Other authoritative pronouncements of the Australian Accounting Standards Board; and • The Consensus Views of the Urgent Issues Group. 2. Departmental and administered items Agency assets, liabilities, revenues and expenses are those items that are controlled by the Department and are used by the Department in producing its outputs and include: • computers, plant and equipment used in providing goods and services; • liabilities for employee entitlements; • revenue from appropriations or independent sources in payment for outputs; and • employee, supplier and depreciation expenses incurred in providing agency outputs. Administered items are those items incurred in providing programmes that are controlled by government and managed, or oversighted, by the Department on behalf of government. Administered expenses included grant payments and subsidies, and administered revenues include levies, fees and fines. 3. Departmental expenses – employees Payments and net increases in entitlements to employees for services rendered in the financial year. 4. Departmental expenses – suppliers Payments to suppliers for goods and services used in providing agency outputs. 5. Departmental expenses – depreciation and amortisation Depreciable infrastructure, plant and equipment, buildings and intangible assets are written-off to their estimated residual values over their estimated useful life to the Department, using the straight-line calculation method. 6. Departmental own-source revenue Revenue from government represents the purchase of outputs from the Department by government and is recognised to the extent that it has been received into the Department’s bank account. Revenue from other sources, representing sales from goods and services, is recognised when: • the risks and rewards of ownership have been transferred to the buyer; • the seller retains no managerial involvement nor effective control over the goods; • the revenue and transaction costs incurred can be reliably measured; and • it is probable that the economic benefits associated with the transaction will flow to the
Department.

Department of Infrastructure and Regional Development
79
7. Departmental assets – financial assets The primary financial asset relates to receivables. Financial assets are used to fund the Department‘s capital programme, employee entitlements, creditors and to provide working capital. 8. Departmental assets – non-financial assets These items represent future economic benefits that the Department will consume in producing outputs. The reported value represents the purchase price paid less depreciation incurred to date in using the asset. 9. Departmental liabilities – provisions Provision has been made for the Department’s liability for employee entitlements arising from services rendered by employees. This liability includes unpaid annual leave and long service leave. 10. Expenses administered on behalf of Government The majority of the Department’s administered programmes are classified as grants, the most significant being the AusLink Programme, AusLink Plan for the Future and Local Government Financial Assistance Grants administered items. 11. Own-source revenues administered on behalf of Government Details of the range of taxation and non-taxation revenue collected by the Department are provided at Appendix 3.2.1. 12. Administered assets – financial assets Comprise primarily the Australian Government’s investments in portfolio agencies.

Department of Infrastructure and Regional Development
80
Appendix 3.2.1: Administered income Actual Revised
budget2012-13 2013-14
$'000 $'000
TAXATION REVENUEOther
Aircraft noise levy - Adelaide Airport - 2,000 Airport land tax equivalents 24,614 27,608 International Oil Pollution Compensation Funds 146 1 Services to Indian Ocean Territories - 4,508 Other 12 -
24,772 34,117 NON-TAXATION REVENUESale of goods and rendering of services
Services to Indian Ocean Territories - 26,032 Services to Jervis Bay Territory - 1,073 Sale of Jandakot sand 1,815 1,910
1,815 29,015
Fees and finesCoastal Trading (Revitalising Australian Shipping) Act 2012 240 240 Cost recovery for Airport Building Controllers at leased airports 5,993 6,200 Interstate Road Transport Act 1985 - fines 3 2 Interstate Road Transport Act 1985 - registration charges 75,831 78,000 Marine Navigation Levy 29,051 32,071 Marine Navigation (Regulatory Functions) Levy 42,287 46,779 Motor Vehicle Standards Regulations Fees 10,396 11,000 Navigation Act 1912 11 - Part X of the Competition and Consumer Act 2010 14 15 Parking fines at leased Federal airports 658 1,000 Protection of the Sea Levy 35,841 40,184 Other fines 247 -
200,572 215,491 Interest
Northern Territory - 2,828 Railway Agreement (Western Australia) 116 96 Sewerage Agreements - 1,262
9 - 125 4,186
DividendsProvision for dividends from government business enterprises 21,000 53,550
21,000 53,550 Rental income
Services to Indian Ocean Territories - 2,068 Services to Jervis Bay Territory - 232 Sydney West Airport - rental properties 3,050 3,065
3,050 5,365 Other revenue
Building Australia Fund 981,610 912,590 Christmas Island phosphate mining rehabilitation - conservation levy - 1,579 Cost recovery for Airport Environmental Officers at leased airports 895 990 Return of previous years payments 32,346 19,398
1,014,851 934,557
TOTAL INCOME 1,266,185 1,276,281
Other interest

Department of Infrastructure and Regional Development
81
Appendix 3.2.2: Administered loan repayments Actual Revised
budget2012-13 2013-14
$'000 $'000
Loan RepaymentsRailway Agreement (Western Australia) 365 365 Railway Standardisation (New South Wales and Victoria) Agreement 66 18 Total loan repayments 431 383

82

83
Australian Maritime Safety Authority
Section 1: Agency overview and resources ..................................................................... 85 1.1 Strategic direction statement ......................................................................................... 85 1.2 Agency resource statement ........................................................................................... 86 1.3 Agency measures table ................................................................................................. 87 1.4 Additional estimates and variations ............................................................................... 87 1.5 Breakdown of additional estimates by appropriation bill ................................................ 88
Section 2: Revisions to agency outcomes and planned performance ........................... 89 2.1 Outcomes and performance information ....................................................................... 89
Section 3: Explanatory tables and budgeted financial statements ................................ 93 3.1 Explanatory tables ......................................................................................................... 93 3.2 Budgeted financial statements ...................................................................................... 93

84

Australian Maritime Safety Authority
85
SECTION 1: AGENCY OVERVIEW AND RESOURCES 1.1: STRATEGIC DIRECTION STATEMENT
The Australian Maritime Safety Authority (AMSA) is a statutory authority established under the Australian Maritime Safety Authority Act 1990 (AMSA Act). AMSA’s primary role is to: • promote maritime safety and protection of the marine environment;
• prevent and combat ship-sourced pollution in the marine environment;
• provide infrastructure to support safety of navigation in Australian waters;
• provide a national search and rescue service to the maritime and aviation sectors;
• provide, on request, services to the maritime industry on a commercial basis; and
• provide, on request, services of a maritime nature on a commercial basis to the Commonwealth and/or States and Territories.
AMSA’s vision is to support an efficient, safe and environmentally friendly Australian maritime sector and provide world leading maritime and aviation search and rescue services to the community.
AMSA’s Outcome Statement is to minimise the risk of shipping incidents and pollution in Australian waters through ship safety and environment protection regulation and services and maximise people saved from maritime and aviation incidents through search and rescue coordination.
A full outline of AMSA’s Strategic direction statement can be found in the 2013-14 Portfolio Budget Statements.

Australian Maritime Safety Authority
86
1.2: AGENCY RESOURCE STATEMENT
The Agency resource statement details the resourcing for AMSA at Additional Estimates. Table 1.1 shows the total resources from all sources for the 2013-14 Budget year, including variations through Appropriation Bills No. 3 and No. 4 and special appropriations.
Table 1.1: Agency resource statement - Additional estimates for 2013-14 as at Additional Estimates February 2014
Estimate of Proposed Total Totalas at + Additional = estimate at resources
Budget Estimates AdditionalEstimates
2013-14 2013-14 2013-14 2012-13$'000 $'000 $'000 $'000
Opening balance/Reserves at bank1 55,213 55,213 61,590
REVENUE FROM GOVERNMENTOrdinary annual services2
Outcome 1 56,947 8,133 65,080 63,323 Total ordinary annual services 56,947 8,133 65,080 63,323
Other services3
Non-Operating 7,485 - 7,485 2,380 Total other services 7,485 - 7,485 2,380 Total annual services 64,432 8,133 72,565 65,703
Special appropriations (Department ofInfrastructure and Transport)Australian Maritime Safety Authority Act 117,363 - 117,363 105,711 1990 s48(2) - payment of levies to AMSA 4
Total special appropriations 117,363 - 117,363 105,711
Payments from related entities5
Department of Infrastructure and 3,157 - 3,157 1,301 Regional DevelopmentTotal 3,157 - 3,157 1,301
Total funds from Government 240,165 8,133 248,298 234,305
FUNDS FROM OTHER SOURCESInterest 1,300 - 1,300 2,481 Sale of goods and services 9,740 - 9,740 11,616 Total 11,040 - 11,040 14,097
Total net resourcing 251,205 8,133 259,338 248,402
All figures are GST exclusive.
AMSA is not directly appropriated as it is a CAC Act body. Appropriations are made to the Department of Infrastructure and Regional Development, which are then paid to AMSA and are considered 'departmental' for all purposes.
Notes: 1. Estimate as at Budget reflects the actual Opening balance / Reserves at bank. 2. Appropriation Act (No. 1) 2013-14 and Appropriation Bill (No. 3) 2013-14. 3. Appropriation Act (No. 2) 2013-14 and Appropriation Bill (No .4) 2013-14.

Australian Maritime Safety Authority
87
4. Levies under Marine Navigation Levy Collection Act 1989, Marine Navigation (Regulatory Function) Levy Collection Act 1991 and Protection of the Sea (Shipping Levy) Collection Act 1981 are paid to CRF and appropriated under section 48 of AMSA Act.
5. Funding provided by a Government body that is not specified within the annual appropriation bills as a payment to the CAC Act body.
1.3: AGENCY MEASURES TABLE
Table 1.2 summarises new Government measures taken since the 2013-14 Budget. The table shows expense measures, with the affected programme identified.
Table 1.2: Agency 2013-14 measures since Budget Programme 2013-14
$'0002014-15
$'0002015-16
$'0002016-17
$'000
Expense measures
Saving Lives - Sustaining Australia's Search 1.1and Rescue Service1
Departmental expenses - - - - Total resourcing - - - -
Total expense measuresDepartmental - - - -
Total - - - -
Prepared on a Government Financial Statistics (fiscal) basis.
Notes: 1. This measure includes funding of $19.0 million over the next four years. This measure was included as a
‘decision taken but not yet announced’ in the 2013-14 Budget. 1.4: ADDITIONAL ESTIMATES AND VARIATIONS
Table 1.3 summarises variations to appropriations since the 2013-14 Budget.
Table 1.3: Variations to appropriations Programme
impacted2013-14
$'0002014-15
$'0002015-16
$'0002016-17
$'000
Appropriation Bill No.3
Payments to CAC Act bodiesOutcome 1Estimates AdjustmentsParameter Adjustments 1.1 - (217) (639) (901)Search and Rescue 1.1 8,133 - - -
Total 8,133 (217) (639) (901)Total Outcome 1 8,133 (217) (639) (901)Total Payments to CAC Act bodies 8,133 (217) (639) (901)
The increase in 2013-14 relates to funding for AMSA’s Community Service Obligation search and rescue response activities. The increased funding will eliminate the previous operating deficit for this activity.

Australian Maritime Safety Authority
88
1.5: BREAKDOWN OF ADDITIONAL ESTIMATES BY APPROPRIATION BILL
The following tables detail the additional estimates sought for AMSA through Appropriation Bills No. 3 and No. 4.
Table 1.4: Appropriation Bill (No. 3) 2013-14 2012-13 2013-14 2013-14 Additional Reduced
available1 Budget revised estimates estimates$'000 $'000 $'000 $'000 $'000
Payments to CAC Act bodiesOutcome 1
Minimise the risk of shipping incidentsand pollution in Australian waters throughship safety and environment protectionregulation and services and maximisepeople saved from maritime and aviationincidents through search and rescuecoordination.
63,323 56,947 65,080 8,133 -
Total payments to CAC Act bodies 63,323 56,947 65,080 8,133 -
Notes: 1. The 2012-13 available appropriation is included to allow a comparison of this year's appropriation with what
was made available for use in the previous year. Available appropriation is the amount available to be drawn down, and is equal to: Budget Appropriation + Additional Estimates Appropriation + AFM - Savings – Movement of Funds - Other Reductions +/- Section 32 transfers.
Table 1.5: Appropriation Bill (No.4) 2013-14 AMSA is not seeking additional appropriation through Appropriation Bill (No. 4).

Australian Maritime Safety Authority
89
SECTION 2: REVISIONS TO AGENCY OUTCOMES AND PLANNED PERFORMANCE 2.1: OUTCOMES AND PERFORMANCE INFORMATION
Figure 2.1 summarises the relationship between AMSA’s outcome statement, its programme and subprogrammes and the involvement of its divisions in delivering each subprogramme.
Figure 2.1: AMSA’s Outcome, Programmes and Divisions
Seafarer and ship safety and environment protection subprogramme 1.1.1
SEAFARER AND SHIP SAFETY, ENVIRONMENT PROTECTION AND SEARCH AND RESCUE PROGRAMME
AMSA'S PROGRAMME
AMSA's DIVISIONS
AMSA's SUBPROGRAMMES
AMSA's OUTCOME STATEMENT
Minimise the risk of shipping incidents and pollution in Australian waters through ship safety and environment protection regulation and
services and maximise people saved from maritime and aviation incidents through search and rescue coordination
Search and rescue subprogramme 1.1.2
Marine Environment
NavigationSafety and International
ShipSafety
Domestic Vessel
Emergency Response
Corporate Services and Corporate Relations Divisions

Australian Maritime Safety Authority
90
Outcome 1: Minimise the risk of shipping incidents and pollution in Australian waters through ship safety and environment protection regulation and services and maximise people saved from maritime and aviation incidents through search and rescue coordination.
Outcome 1 Strategy AMSA contributes to one Outcome and one Programme, which is divided into two subprogrammes:
Subprogramme 1.1.1: Seafarer and ship safety and environment protection aims to achieve the first part of AMSA’s Outcome: Minimising the risk of shipping incidents and pollution in Australian waters through ship safety and environment protection regulation and services.
Subprogramme 1.1.2: Search and rescue aims to achieve the second part of AMSA’s Outcome: Maximising the number of people saved from maritime and aviation incidents through search and rescue coordination.
The strategy for Outcome 1 remains unchanged from that published in the 2013-14 Portfolio Budget Statements (PB Statements).
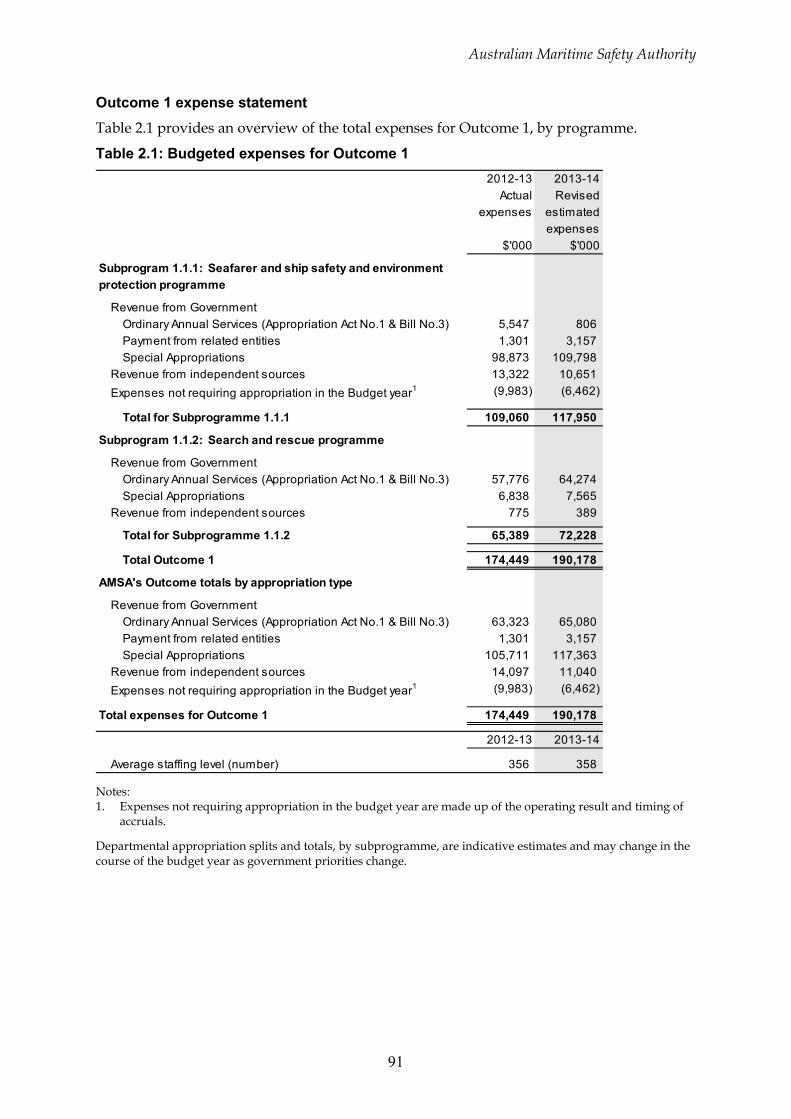
Australian Maritime Safety Authority
91
Outcome 1 expense statement Table 2.1 provides an overview of the total expenses for Outcome 1, by programme.
Table 2.1: Budgeted expenses for Outcome 1 2012-13 2013-14
Actual Revisedexpenses estimated
expenses$'000 $'000
Subprogram 1.1.1: Seafarer and ship safety and environmentprotection programme
Revenue from GovernmentOrdinary Annual Services (Appropriation Act No.1 & Bill No.3) 5,547 806 Payment from related entities 1,301 3,157 Special Appropriations 98,873 109,798
Revenue from independent sources 13,322 10,651 Expenses not requiring appropriation in the Budget year1 (9,983) (6,462)
Total for Subprogramme 1.1.1 109,060 117,950
Subprogram 1.1.2: Search and rescue programme
Revenue from GovernmentOrdinary Annual Services (Appropriation Act No.1 & Bill No.3) 57,776 64,274 Special Appropriations 6,838 7,565
Revenue from independent sources 775 389
Total for Subprogramme 1.1.2 65,389 72,228
Total Outcome 1 174,449 190,178
AMSA's Outcome totals by appropriation type
Revenue from GovernmentOrdinary Annual Services (Appropriation Act No.1 & Bill No.3) 63,323 65,080 Payment from related entities 1,301 3,157 Special Appropriations 105,711 117,363
Revenue from independent sources 14,097 11,040 Expenses not requiring appropriation in the Budget year1 (9,983) (6,462)
Total expenses for Outcome 1 174,449 190,178
2012-13 2013-14
Average staffing level (number) 356 358
Notes: 1. Expenses not requiring appropriation in the budget year are made up of the operating result and timing of
accruals.
Departmental appropriation splits and totals, by subprogramme, are indicative estimates and may change in the course of the budget year as government priorities change.

Australian Maritime Safety Authority
92
Contributions to Outcome 1
Programme 1.1: Seafarer and ship safety, environment protection and search and rescue
The objective, deliverables and key performance indicators for programme 1.1 are unchanged from that published in the 2013-14 PB Statements.
Programme 1.1 Expenses 2012-13 2013-14 2014-15 2015-16 2016-17
Actual Revised Forward Forward Forwardbudget year 1 year 2 year 3
$'000 $'000 $'000 $'000 $'000
Annual departmental expensesOrdinary Annual Services 63,323 65,080 56,523 57,622 66,138 (Appropriation Bills No.1 & No.3)
Special AppropriationsAustralian Maritime Safety Authority 105,711 117,363 133,282 148,692 154,756 Act 1990 - s48
Expenses not requiring appropriation in 5,415 7,735 7,483 (678) (1,098)the Budget year1
Total programme expenses 174,449 190,178 197,288 205,636 219,796
Notes: 1. Expenses not requiring appropriation in the budget year are made up of revenue from independent sources,
payments from related entities, the operating result and timing of accruals.

Australian Maritime Safety Authority
93
SECTION 3: EXPLANATORY TABLES AND BUDGETED FINANCIAL STATEMENTS 3.1: EXPLANATORY TABLES
Estimates of special account flows AMSA does not maintain any Special Accounts.
3.2: BUDGETED FINANCIAL STATEMENTS
3.2.1: Analysis of budgeted financial statements AMSA has revised its budgeted zero operating result in 2013-14 to a budgeted operating surplus of $8.133m. The surplus is due to Government increases to Outcome 1 funding for AMSA’s Community Service Obligation search and rescue response activities. The increased funding will eliminate the previous operating deficit for this activity.
AMSA’s budgeted financial statements over the forward estimates have been adjusted to take into account the effect of indexation adjustments and efficiency dividend. AMSA has absorbed the increase within those affected activities and has maintained budgeted financial statements over the forward estimates as per the 2013-14 Portfolio Budget Statements (PB Statements).
There are no other changes to AMSA’s budgeted financial statements, as reflected in the PB Statements. Accordingly AMSA’s revised budgeted financial statements should be read in conjunction with the Budget Papers and PB Statements.

Australian Maritime Safety Authority
94
3.2.2: Budgeted financial statements tables Table 3.2.1: Comprehensive income statement (showing net cost of services)
(for the period ended 30 June) Actual Revised Forward Forward Forward
Notes budget estimate estimate estimate2012-13 2013-14 2014-15 2015-16 2016-17
$'000 $'000 $'000 $'000 $'000
EXPENSES
Employee benefits 3 52,304 55,572 57,183 60,445 64,109 Suppliers 4 110,193 120,741 123,261 128,517 138,757 Depreciation and amortisation 5 11,118 13,865 16,844 16,674 16,930 Finance costs 63 - - - - Write-down and impairment of assets 625 - - - - Losses from asset sales 146 - - - -
Total expenses 174,449 190,178 197,288 205,636 219,796
LESS:OWN-SOURCE INCOME
Own-source revenueSale of goods and rendering of services 12,038 12,897 10,621 10,947 12,262 Interest 2,378 1,300 1,000 900 900
Total own-source revenue 6 14,416 14,197 11,621 11,847 13,162
Total own-source income 14,416 14,197 11,621 11,847 13,162
Net cost of (contribution by) services 160,033 175,981 185,667 193,789 206,634
Revenue from Government 170,624 184,114 189,867 206,789 220,934 Surplus (Deficit) attributable to the
Australian Government 10,591 8,133 4,200 13,000 14,300
Total comprehensive income (loss)attributable to the AustralianGovernment 10,591 8,133 4,200 13,000 14,300
Prepared on Australian Accounting Standards basis.

Australian Maritime Safety Authority
95
Table 3.2.2: Budgeted departmental balance sheet (as at 30 June)
Actual Revised Forward Forward ForwardNotes budget estimate estimate estimate
2012-13 2013-14 2014-15 2015-16 2016-17$'000 $'000 $'000 $'000 $'000
ASSETS
Financial assetsCash and cash equivalents 55,213 6,378 6,235 6,261 6,559 Trade and other receivables 8,034 9,546 9,707 10,274 10,419 Investments - 38,000 43,000 62,000 73,000
Total financial assets 7 63,247 53,924 58,942 78,535 89,978
Non-financial assetsLand and buildings 16,354 22,492 23,432 22,514 21,425 Property, plant and equipment 127,549 132,355 132,277 128,622 135,388 Intangibles 5,181 15,718 13,918 11,066 8,121 Inventories 4,406 5,102 5,860 6,630 6,830 Other non-financial assets 3,416 3,880 3,713 3,843 3,919
Total non-financial assets 8 156,906 179,547 179,200 172,675 175,683
Total assets 220,153 233,471 238,142 251,210 265,661
LIABILITIES
PayablesSuppliers 30,330 29,297 28,949 28,777 29,038 Other payables 2,547 1,649 2,029 2,519 2,389
Total payables 9 32,877 30,946 30,978 31,296 31,427
Interest bearing liabilitiesLeases 231 - - - -
Total interest bearing liabilities 231 - - - -
ProvisionsEmployee provisions 16,090 15,962 16,401 16,151 16,171 Other provisions 4,971 4,961 4,961 4,961 4,961
Total provisions 9 21,061 20,923 21,362 21,112 21,132 Total liabilities 54,169 51,869 52,340 52,408 52,559
Net assets 165,984 181,602 185,802 198,802 213,102
EQUITYContributed equity 30,501 37,986 37,986 37,986 37,986 Reserves 102,601 102,601 102,601 102,601 102,601 Retained surplus (accumulated deficit) 32,882 41,015 45,215 58,215 72,515
Total equity 165,984 181,602 185,802 198,802 213,102
Prepared on Australian Accounting Standards basis.

Australian Maritime Safety Authority
96
Table 3.2.3: Departmental statement of changes in equity – summary of movement (Budget year 2013-14)
Retained Asset General Pollution Contributed Totalearnings revaluation reserve reserve equity/ equity
reserve capital$'000 $'000 $'000 $'000 $'000 $'000
Opening balance as at 1 July 2013Balance carried forw ard from previous period 32,882 91,101 1,500 10,000 30,501 165,984
Adjusted opening balance 32,882 91,101 1,500 10,000 30,501 165,984
Comprehensive incomeSurplus (deficit) for the period 8,133 - - - - 8,133
Total comprehensive income 8,133 - - - - 8,133 of w hich:
Attributable to the Australian Government 8,133 - - - - 8,133
Contribution by ownersEquity injection - Appropriation - - - - 7,485 7,485
Sub-total transactions with owners - - - - 7,485 7,485
Estimated closing balance as at 30 June 2014 41,015 91,101 1,500 10,000 37,986 181,602
Closing balance attributable to theAustralian Government 41,015 91,101 1,500 10,000 37,986 181,602
Prepared on Australian Accounting Standards basis.

Australian Maritime Safety Authority
97
Table 3.2.4: Budgeted departmental statement of cash flows (for the period ended 30 June)
Actual Revised Forward Forward Forwardbudget estimate estimate estimate
2012-13 2013-14 2014-15 2015-16 2016-17$'000 $'000 $'000 $'000 $'000
OPERATING ACTIVITIESCash received
Appropriations 63,323 65,080 56,523 57,622 66,138 Sale of goods and rendering of
services 24,437 24,941 22,733 23,507 24,991 Interest 2,481 1,300 1,000 900 900 Other 107,012 117,363 133,282 148,692 154,756
Total cash received 197,253 208,684 213,538 230,721 246,785
Cash usedEmployees 50,588 56,598 56,363 60,205 64,219 Suppliers 130,307 134,363 135,654 141,471 151,406
Total cash used 180,895 190,961 192,017 201,676 215,625 Net cash from (used by) operating
activities 16,358 17,723 21,521 29,045 31,160
INVESTING ACTIVITIESCash used
Purchase of property plant andequipment and intangibles 24,874 36,043 16,664 10,019 19,862
Total cash used 24,874 36,043 16,664 10,019 19,862
Net cash from (used by) investingactivities (24,874) (36,043) (16,664) (10,019) (19,862)
FINANCING ACTIVITIESCash received
Contributed equity 2,380 7,485 - - - Total cash received 2,380 7,485 - - -
Cash usedOther 241 - - - -
Total cash used 241 - - - -
Net cash from (used by) financingactivities 2,139 7,485 - - -
Net increase (decrease) in cash held (6,377) (10,835) 4,857 19,026 11,298
Cash and cash equivalents at thebeginning of the reporting period 61,590 55,213 44,378 49,235 68,261
Cash and cash equivalents at the endof the reporting period 55,213 44,378 49,235 68,261 79,559
Prepared on Australian Accounting Standards basis.

Australian Maritime Safety Authority
98
Table 3.2.5: Departmental capital budget statement Actual Revised Forward Forward Forward
budget estimate estimate estimate2012-13 2013-14 2014-15 2015-16 2016-17
$'000 $'000 $'000 $'000 $'000
NEW CAPITAL APPROPRIATIONSEquity injections - Bill 2 2,380 7,485 - - -
Total new capital appropriations 2,380 7,485 - - -
Provided for:Purchase of non-financial assets 2,380 7,485 - - -
Total items 2,380 7,485 - - -
PURCHASE OF NON-FINANCIAL ASSETSFunded by capital appropriations1 2,380 7,485 - - - Funded internally from departmental
resources2 22,494 28,558 16,664 10,019 19,862
Total 24,874 36,043 16,664 10,019 19,862
RECONCILIATION OF CASH USED TOACQUIRE ASSETS TO ASSETMOVEMENT TABLETotal purchases3 25,267 36,043 16,664 10,019 19,862
less additions by creditors / borrowings (393) - - - - Total cash used to acquire assets 24,874 36,043 16,664 10,019 19,862
Consistent with information contained in the Statement of Asset Movements and the Budgeted Statement of Cash Flows basis. Prepared on Australian Accounting Standards basis.
Notes: 1. Includes both current and prior Act 2 and Bills 4/6 appropriations. 2. Includes funding from prior year appropriations, agency receipts, and proceeds from the sale of assets. 3. Includes cash used to acquire inventories which are not reported in the asset movement table.

Australian Maritime Safety Authority
99
Table 3.2.6: Statement of asset movements (2013-14) Land Buildings Property, Intangibles Total
plant andequipment
$'000 $'000 $'000 $'000 $'000
As at 1 July 2013Gross book value 4,360 12,470 141,187 9,328 167,345 Accumulated depreciation/amortisation
and impairment - (476) (13,638) (4,147) (18,261)Opening net book balance 4,360 11,994 127,549 5,181 149,084
CAPITAL ASSET ADDITIONSEstimated expenditure on new or
replacement assetsBy purchase - appropriation equity1 - - - 7,485 7,485
By purchase - other - 6,787 16,801 4,273 27,861 Sub-total - 6,787 16,801 11,758 35,346
Other movementsDepreciation/amortisation expense - (649) (11,995) (1,221) (13,865)
Sub-total - (649) (11,995) (1,221) (13,865)
As at 30 June 2014Gross book value 4,360 19,257 157,988 21,086 202,691 Accumulated depreciation/amortisation
and impairment - (1,125) (25,633) (5,368) (32,126)Closing net book balance 4,360 18,132 132,355 15,718 170,565
Prepared on Australian Accounting Standards basis.
Notes: 1. ‘Appropriation equity’ refers to equity injections provided through Appropriation Acts No. 2 and Bill No. 4
2013-14.
Australian Maritime Safety Authority
100
3.2.3: Notes to the financial statements 1. Accounting policy The budgeted financial statements have been prepared on an accrual accounting basis, having regard to Statements of Accounting Concepts, and in accordance with: • the Finance Minister's Orders; • Australian Accounting Standards; • other authoritative pronouncements of the Australian Accounting Standards Board; and • the Consensus Views of the Urgent Issues Group. 2. Departmental and administered items Agency assets, liabilities, revenues and expenses are those items that are controlled by AMSA that are used in producing its outcomes and include: • infrastructure, plant and equipment used in providing goods and services; • liabilities for employee entitlements; • revenue from appropriations or independent sources in payment for outcomes; and • employee, supplier and depreciation expenses incurred in providing agency outcomes. AMSA has no administered items. 3. Departmental expenses – employees Payments and net increases in entitlements to employees for services rendered in the financial year. 4. Departmental expenses – suppliers Payments to suppliers for goods and services used in providing agency outcomes. 5. Departmental expenses - depreciation and amortisation Depreciable property plant and equipment, buildings and intangible assets are written-off to their estimated residual values over their estimated useful life to AMSA, using the straight-line calculation method. 6. Departmental revenue Revenue from government represents the purchase of outcomes from AMSA by the government and is recognised to the extent that it has been received into AMSA’s bank account. Revenue from other sources, representing sales from goods and services, is recognised when: • the risks and rewards of ownership have been transferred to the buyer; • the seller retains no managerial involvement nor effective control over the goods; • the revenue and transaction costs incurred can be reliably measured; and • it is probable that the economic benefits associated with the transaction will flow to the
entity.
Australian Maritime Safety Authority
101
7. Departmental assets - financial assets The primary financial asset relates to receivables. Financial assets are used to fund AMSA’s capital program, employee entitlements, creditors and to provide working capital. 8. Departmental assets - non-financial assets These items represent future economic benefits that AMSA will consume in producing outcomes. The reported value represents the purchase price paid less depreciation incurred to date in using the asset. 9. Departmental liabilities - provisions and payables Provision has been made for AMSA’s liability for employee entitlements arising from services rendered by employees. This liability includes unpaid annual leave and long service leave. Provision has also been made for unpaid supplier expenses as at balance date.

102

Glossary
103
GLOSSARY
Actual available appropriation
The Actual available appropriation indicates the total appropriations available to the agency for 2012-13. It includes all appropriations made available to the agency in the year (+/- section 32 transfers, formal reductions, Advance to the Finance Minister and movements of funds). It is to be the same as the comparator figure included in the Appropriation Bills, and as such provides a comparison with the appropriation proposed for the budget year.
Additional Estimates
Where amounts appropriated at Budget time are insufficient, Parliament may appropriate more funds to portfolios through the Additional Estimates Acts. This is the Additional Estimates process.
Additional Estimates Bills or Acts
These are Appropriation Bills 3 and 4, and a separate Bill for the Parliamentary Departments Appropriations (Parliamentary Departments) Bill (No 2). These Bills are introduced into Parliament after the Budget Bills. In 2012-13, the Budget was introduced in May 2012, and the Additional Estimates Bills were introduced in February 2013.
Administered item Appropriation that consists of funding managed on behalf of the Commonwealth. This funding is not at the discretion of the agency and any unspent appropriation is returned to the CRF at the end of the financial year. An administered item is a component of an administered programme. It may be a measure but will not constitute a programme in its own right.
Agency Generic term for Australian Government General Government Sector entities, including those governed by the FMA Act or CAC Act and the High Court of Australia.
Annual appropriation
Two appropriation Bills are introduced into Parliament in May and comprise the Budget for the financial year beginning 1 July. Further Bills are introduced later in the financial year as part of the additional estimates. Parliamentary departments have their own appropriations.
Appropriation An amount of public money parliament authorises for spending (i.e. funds to be withdrawn from the CRF). Parliament makes laws for appropriating money under the Annual Appropriation Acts and under Special Appropriations, with spending restricted to the purposes specified in the Appropriation Acts.
Central Agencies The Department of Prime Minister and Cabinet, the Department of the Treasury and the Department of Finance and Deregulation.
Commonwealth Authorities and Companies Act 1997 (CAC Act)
The CAC Act sets out the financial management, accountability and audit obligations on Commonwealth statutory authorities and companies in which the Commonwealth has at least a direct controlling interest. A list of CAC Act bodies can be found at: finance.gov.au/financial-framework/cac-legislation/docs/CAC-body-list.pdf.

Glossary
104
Consolidated Revenue Fund (CRF)
The principal operating fund from which money is drawn to pay for the activities of the Government. Section 81 of the Australian Constitution provides that all revenue raised or monies received by the Executive Government forms one consolidated revenue fund from which appropriations are made for the purposes of the Australian Government.
Departmental item Resources (assets, liabilities, revenues and expenses) that agency Chief Executive Officers control directly. This includes outsourced activities funded and controlled by the agency. Examples of departmental items include agency running costs, accrued employee entitlements and net appropriations. A departmental item is a component of a departmental programme.
Estimated actual expenses
Details of the current year‘s estimated final figures as included in the Budget documentation. As the Budget is released in May each year, but the financial year does not close off until 30 June, the current year numbers that are used for comparison with Budget amounts can only be estimates.
Expenses not requiring appropriation in the Budget year
Expenses not involving a cash flow impact are not included within the calculation of an appropriation. An example of such an event is goods or services received free of charge that are then expensed: e.g. ANAO audit services — the ANAO does not charge for audit services however the expense must be recognised. Similarly, bad debts are recognised as an expense but are not recognised for the purpose of calculating appropriation amounts to be sought from Parliament.
Financial Management and Accountability Act 1997 (FMA Act)
The FMA Act sets out the financial management, accountability and audit obligations of agencies (including Departments) that are financially part of the Commonwealth (and form part of the General Government Sector). A list of FMA Act agencies can be found at: finance.gov.au/financial-framework/fma-legislation/docs/FMA-Agencies-List.pdf.
Forward Estimates Period
The three years following the budget year. For example if 2012-13 is the budget year, 2013-14 is forward year 1, 2014-15 is forward year 2 and 2015-16 is forward year 3. This period does not include the current or budget year.
General Government Sector (GGS)
A Government Finance Statistics classification of all entities that are controlled and largely funded by the Commonwealth Government. The GGS provides public services that are mainly non-market in nature and for the collective consumption of the community, or involve the transfer or redistribution of income. These services are largely financed through taxes and other compulsory levies, user charging and external funding. This sector comprises all government departments, offices and some other bodies.

Glossary
105
Government Finance Statistics (GFS)
A reporting framework that is a specialised statistical system designed to support economic analysis of the public sector. It allows for comprehensive assessments of the economic impact of government and is consistent with international statistical standards of the International Monetary Fund and the System of National Accounts.
Measure A new policy or savings decision of the government with financial impacts on the government's: underlying cash balance; fiscal balance; operating balance; headline cash balance; net debt or net worth. Such proposals are normally made in the context of the annual Budget, and are typically published in Budget Paper No. 2, in the Mid-Year Economic and Fiscal Outlook (MYEFO) and in the Pre-election Economic and Fiscal Outlook (PEFO).
Mid-Year Economic and Fiscal Outlook (MYEFO)
The MYEFO provides an update of the government's budget estimates by examining expenses and revenues in the year to date, as well as provisions for new decisions that have been taken since the Budget. The report provides updated information to allow the assessment of the government‘s fiscal performance against the fiscal strategy set out in its current fiscal strategy statement.
Official Public Account (OPA)
The OPA is the Australian Government‘s central bank account held within the Reserve Bank of Australia. The OPA reflects the operations of the Consolidated Revenue Fund.
Outcome An outcome is the intended result, consequence or impact of Government actions on the Australian community.
Outcome Statement
An outcome statement articulates the intended results, activities and target group of an Australian Government agency. An outcome statement serves three main purposes within the financial framework: • to explain and control the purposes for which annual
appropriations are approved by the Parliament for use by agencies;
• to provide a basis for annual budgeting, including (financial) reporting against the use of appropriated funds; and
• to measure and assess agency and programme (non-financial) performance in contributing to Government policy objectives.
Portfolio Budget Statements (PB Statements)
Budget related paper detailing budget initiatives and explanations of appropriations specified by outcome and programme by each agency within a portfolio.
Programme Activity that delivers benefits, services or transfer payments to individuals, industry and/or the community as a whole, with the aim of achieving the intended result specified in an outcome statement.
Programme support
The agency running costs allocated to a programme. This is funded as part of the agency‘s departmental appropriations.

Glossary
106
Special Account Balances existing within the CRF, that are supported by standing appropriations (Financial Management and Accountability (FMA) Act 1997, ss.20 and 21). Special Accounts allow money in the CRF to be acknowledged as set-aside (hypothecated) for a particular purpose. Amounts credited to a Special Account may only be spent for the purposes of the Special Account. Special Accounts can only be established by a written determination of the Finance Minister (s.20 FMA Act) or through an Act of Parliament (referred to in s.21 of the FMA Act).
Special Appropriations (including Standing Appropriations)
An amount of money appropriated by a particular Act of Parliament for a specific purpose and number of years. For special appropriations the authority to withdraw funds from the Consolidated Revenue Fund does not generally cease at the end of the financial year.
Standing appropriations are a sub-category consisting of ongoing special appropriations - the amount appropriated will depend on circumstances specified in the legislation.

Abbreviations
107
ABBREVIATIONS
AAO Administrative Arrangements Order
AAS Australian Accounting Standards
ACB Administered Capital Budget
ACLG Australian Council of Local Government
ACT Australian Capital Territory
AFM Advance to the Finance Minister
AMSA Australian Maritime Safety Authority
AMSA Act Australian Maritime Safety Authority Act 1990
ANAO Australian National Audit Office
ATSB Australian Transport Safety Bureau
BAF Building Australia Fund
CAC Act Commonwealth Authorities and Companies Act, 1997
CASA Civil Aviation Safety Authority
CO2 Carbon Dioxide
COAG Council of Australian Governments
CRF Consolidated Revenue Fund
DCB Departmental Capital Budget
the Department
The Department of Infrastructure and Regional Development
Dept Department
Dr Doctor
DRALGAS The Department of Regional Australia, Local Government, Arts and Sport
FMA Act Financial Management and Accountability Act, 1997
GGS General Government Sector
GFS Government Finance Statistics
Hon Honourable
IRT Act Interstate Road Transport Act, 1985
MP Member of Parliament
MYEFO Mid-Year Economic and Fiscal Outlook

Abbreviations
108
N/A Not Applicable
NBF Act Nation-building Funds Act 2008
NCA National Capital Authority
nfp Not for publication
No. Number
NT Northern Territory
NTC National Transport Commission
OECD Organisation for Economic Cooperation and Development
OPA Official Public Account
PAES Portfolio Additional Estimates Statements
PB Statements Portfolio Budget Statements
PEFO Pre-Election Economic and Fiscal Outlook
PPPs Public Private Partnerships
SCOTI Standing Council on Transport and Infrastructure

Index
109
INDEX
A Abbreviations 107-108 ACT Government - national capital functions 31, 63 Airport Lessee Companies – reimbursement of parking fines 21, 29, 49 Appropriations (see Resources) AusLink Black Spot Projects 28, 36, 37 AusLink Heavy Vehicle Safety and Productivity 28, 36, 37 AusLink improving local roads 37 AusLink improving the National Network 28, 36, 37 AusLink Plan for the Future 28, 36, 37 AusLink Programme Investment 21, 28, 36, 37 AusLink Roads to Recovery 28, 36, 37 AusLink Off-Network Projects 21, 23, 28, 36, 37 AusLink Off-Network Projects - supplementary 28, 36, 37 Australian Maritime Safety Authority 3-7, 13, 83-101 Australian Transport Safety Bureau 3-7, 13 Aviation security enhancements – improving international aviation security 29, 43 Aviation security enhancements – regional passenger screening 21, 29, 43
B, C, D, E Bass Strait Passenger Vehicle Equalisation Scheme 21, 29, 45 Boyer Pulp Mill - Structural Assistance 30, 56 Bridges Renewal Programme 23, 28, 36, 37 Centenary of Canberra 2013 - a gift to the national capital 31, 63 Centenary of Canberra 2013 - joint national programme 31, 63 Christmas Island Phosphate Mining Rehabilitation 31, 63 Civil Aviation Safety Authority 3-7, 13 Community Development Grants Fund 19, 30, 56 Community Infrastructure Grants 19, 30, 56 Department of Infrastructure and Regional Development 3-7,11-81
F, G, H Financial statements (Budgeted)
Australian Maritime Safety Authority 93-101 Department of Infrastructure and Regional Development 65-81
Glossary 103-106 I, J, K, L
Implementation of Noise Amelioration for Adelaide Airport 29, 49 International Civil Aviation Organization – contribution 21, 29, 49 International Maritime Organization – contribution 21, 29, 45 Interstate Road Transport Fees 29, 45 Jobs Fund – Infrastructure Employment Projects 21, 37 keys2drive 19, 21, 29, 47 Latrobe Valley economic diversification 19, 30, 56 Local Government Financial Assistance Grants 24, 30, 59 Local Government Reform Fund 30, 59
M Measures
Australian Maritime Safety Authority 87 Department of Infrastructure and Regional Development 19-20
Murray-Darling Basin Regional Economic Diversification Programme 30, 56

Index
110
N National Capital Authority 3-7, 13 National Transport Commission 3-7, 13 National Transport Reform 45 Norfolk Island - Commonwealth administration 31, 63 Norfolk Island - Kingston and Arthur's Vale historic area 31, 63 Norfolk Island - reforms and services 31, 63 Northern Australia Sustainable Futures 30, 56, 57
O, P, Q OECD Road Transport – contribution 21, 29, 45 Oil Pollution Compensation Fund 29, 45 Office of Administrator, Northern Territory 31, 63 Payment scheme for Airservices Australia’s enroute charges 19, 21, 29, 49 Payments to CAC Act bodies - AMSA 29, 45 Payments to CAC Act bodies - CASA 29, 49 Payments to CAC Act bodies - NTC 29, 45 Portfolio 1-7
R Regional Aviation Access 21, 29, 49 Regional Infrastructure Fund 37 Referendum on the recognition of local government in the Australian Constitution 20,
30, 59 Regional Development Australia Committees 30, 56 Regional Development Australia Fund 30, 56 Regional Development Projects in Northern Australia 20, 30, 56 Resources
Australian Maritime Safety Authority 86-87 Portfolio 7 Department of Infrastructure and Transport 16-18
S Seatbelts on regional school buses 29, 47 Services to Indian Ocean Territories 31, 63 Services to Jervis Bay Territory 31, 63 South Australia Economic Development Programme 30, 56 Strengthening aviation security – optimal technologies at international gateway airports
29, 43 Strengthening aviation security – regional and domestic aviation security 29, 43 Supplementary funding to South Australian councils for local roads 30, 59 Sustainable Australia – Liveable Communities 23, 28, 36, 37 Sustainable Australia – National Smart Managed Motorways 28, 36, 37 Sustaining Australia’s maritime skills 29, 45 Sydney West Airport – rental properties 29, 49
T, U, V, W, X, Y, Z Tasmanian Freight Equalisation Scheme 29, 45 Tasmanian Jobs and Growth Package 30, 56 Tasmanian Wheat Freight Scheme 29, 45 User Guide vii-viii