PORTABLE SPECTRUM ANALYZERS ARINST
84
SCIENTIFIC AND PRODUCTION COMPANY PORTABLE SPECTRUM ANALYZERS ARINST USER MANUAL
Transcript of PORTABLE SPECTRUM ANALYZERS ARINST
SCIENTIFIC AND PRODUCTION COMPANY
PORTABLE SPECTRUM ANALYZERS
ARINST
USER MANUAL
Portable spectrum analyzers Arinst 13.01.2020
www.arinst.net | www.arinst.ru | www.kroks.ru 2
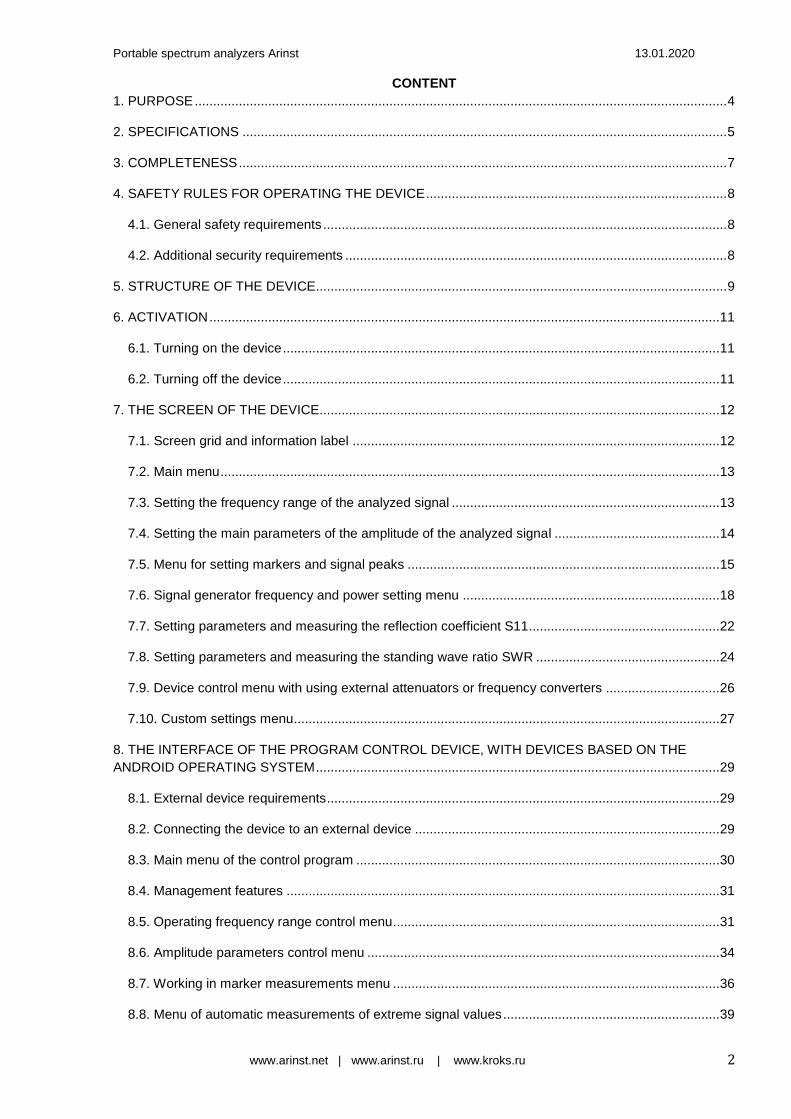
CONTENT
1. PURPOSE ................................................................................................................................................. 4
2. SPECIFICATIONS .................................................................................................................................... 5
3. COMPLETENESS ..................................................................................................................................... 7
4. SAFETY RULES FOR OPERATING THE DEVICE .................................................................................. 8
4.1. General safety requirements .............................................................................................................. 8
4.2. Additional security requirements ........................................................................................................ 8
5. STRUCTURE OF THE DEVICE................................................................................................................ 9
6. ACTIVATION ........................................................................................................................................... 11
6.1. Turning on the device ....................................................................................................................... 11
6.2. Turning off the device ....................................................................................................................... 11
7. THE SCREEN OF THE DEVICE............................................................................................................. 12
7.1. Screen grid and information label .................................................................................................... 12
7.2. Main menu ........................................................................................................................................ 13
7.3. Setting the frequency range of the analyzed signal ......................................................................... 13
7.4. Setting the main parameters of the amplitude of the analyzed signal ............................................. 14
7.5. Menu for setting markers and signal peaks ..................................................................................... 15
7.6. Signal generator frequency and power setting menu ...................................................................... 18
7.7. Setting parameters and measuring the reflection coefficient S11.................................................... 22
7.8. Setting parameters and measuring the standing wave ratio SWR .................................................. 24
7.9. Device control menu with using external attenuators or frequency converters ............................... 26
7.10. Custom settings menu .................................................................................................................... 27
8. THE INTERFACE OF THE PROGRAM CONTROL DEVICE, WITH DEVICES BASED ON THE
ANDROID OPERATING SYSTEM .............................................................................................................. 29
8.1. External device requirements ........................................................................................................... 29
8.2. Connecting the device to an external device ................................................................................... 29
8.3. Main menu of the control program ................................................................................................... 30
8.4. Management features ...................................................................................................................... 31
8.5. Operating frequency range control menu ......................................................................................... 31
8.6. Amplitude parameters control menu ................................................................................................ 34
8.7. Working in marker measurements menu ......................................................................................... 36
8.8. Menu of automatic measurements of extreme signal values ........................................................... 39
Portable spectrum analyzers Arinst 13.01.2020
www.arinst.net | www.arinst.ru | www.kroks.ru 3
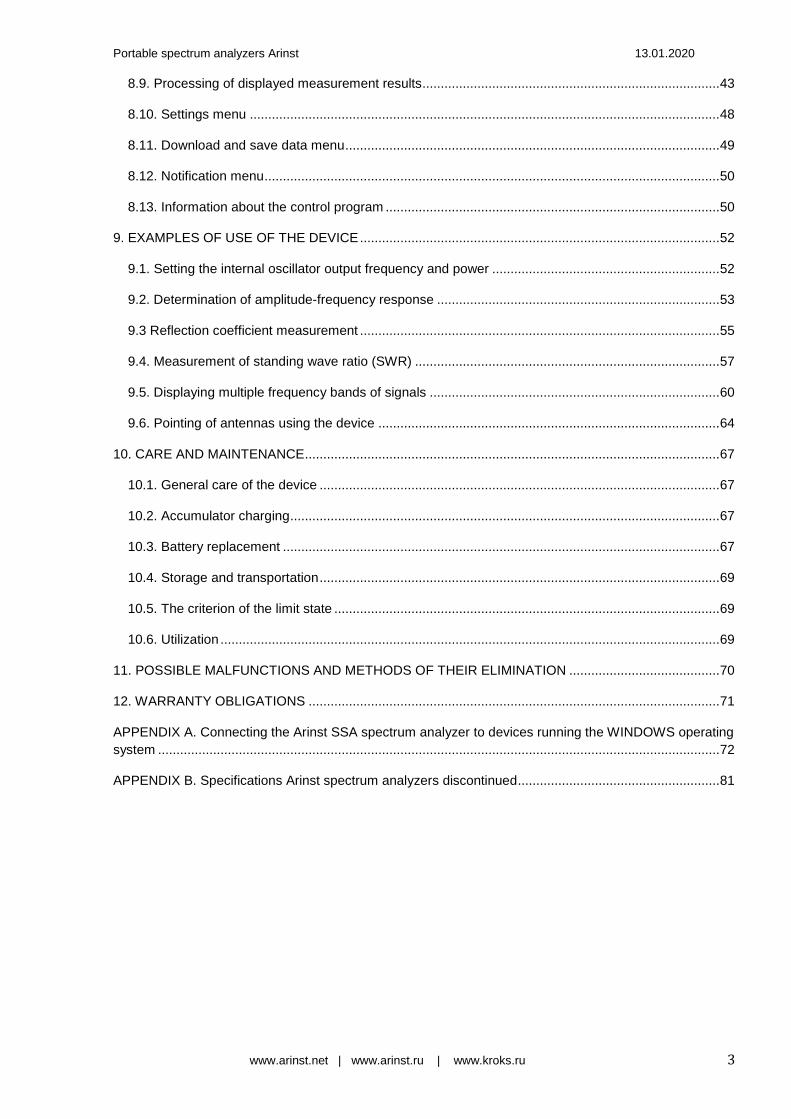
8.9. Processing of displayed measurement results................................................................................. 43
8.10. Settings menu ................................................................................................................................ 48
8.11. Download and save data menu ...................................................................................................... 49
8.12. Notification menu ............................................................................................................................ 50
8.13. Information about the control program ........................................................................................... 50
9. EXAMPLES OF USE OF THE DEVICE .................................................................................................. 52
9.1. Setting the internal oscillator output frequency and power .............................................................. 52
9.2. Determination of amplitude-frequency response ............................................................................. 53
9.3 Reflection coefficient measurement .................................................................................................. 55
9.4. Measurement of standing wave ratio (SWR) ................................................................................... 57
9.5. Displaying multiple frequency bands of signals ............................................................................... 60
9.6. Pointing of antennas using the device ............................................................................................. 64
10. CARE AND MAINTENANCE ................................................................................................................. 67
10.1. General care of the device ............................................................................................................. 67
10.2. Accumulator charging ..................................................................................................................... 67
10.3. Battery replacement ....................................................................................................................... 67
10.4. Storage and transportation ............................................................................................................. 69
10.5. The criterion of the limit state ......................................................................................................... 69
10.6. Utilization ........................................................................................................................................ 69
11. POSSIBLE MALFUNCTIONS AND METHODS OF THEIR ELIMINATION ......................................... 70
12. WARRANTY OBLIGATIONS ................................................................................................................ 71
APPENDIX A. Connecting the Arinst SSA spectrum analyzer to devices running the WINDOWS operating
system ......................................................................................................................................................... 72
APPENDIX B. Specifications Arinst spectrum analyzers discontinued....................................................... 81
Portable spectrum analyzers Arinst 13.01.2020
www.arinst.net | www.arinst.ru | www.kroks.ru 4
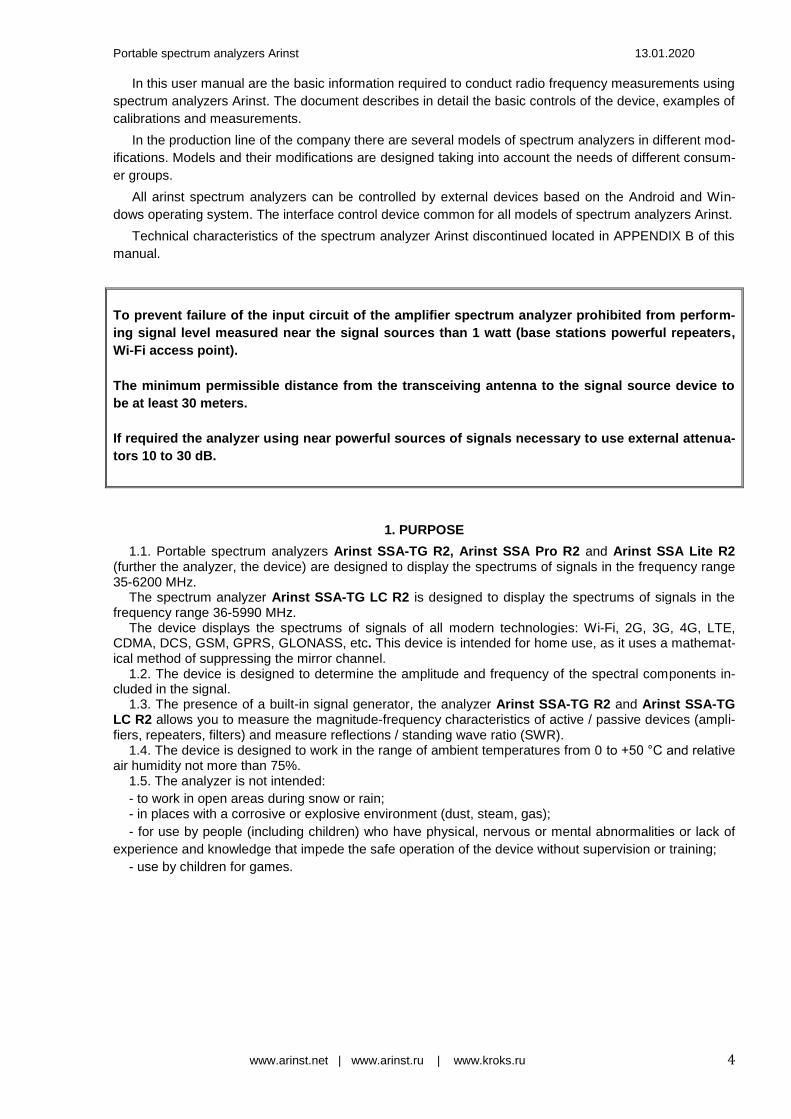
In this user manual are the basic information required to conduct radio frequency measurements using
spectrum analyzers Arinst. The document describes in detail the basic controls of the device, examples of
calibrations and measurements.
In the production line of the company there are several models of spectrum analyzers in different mod-
ifications. Models and their modifications are designed taking into account the needs of different consum-
er groups.
All arinst spectrum analyzers can be controlled by external devices based on the Android and Win-
dows operating system. The interface control device common for all models of spectrum analyzers Arinst.
Technical characteristics of the spectrum analyzer Arinst discontinued located in APPENDIX B of this
manual.
To prevent failure of the input circuit of the amplifier spectrum analyzer prohibited from perform-
ing signal level measured near the signal sources than 1 watt (base stations powerful repeaters,
Wi-Fi access point).
The minimum permissible distance from the transceiving antenna to the signal source device to
be at least 30 meters.
If required the analyzer using near powerful sources of signals necessary to use external attenua-
tors 10 to 30 dB.
1. PURPOSE 1.1. Portable spectrum analyzers Arinst SSA-TG R2, Arinst SSA Pro R2 and Arinst SSA Lite R2
(further the analyzer, the device) are designed to display the spectrums of signals in the frequency range 35-6200 MHz.
The spectrum analyzer Arinst SSA-TG LC R2 is designed to display the spectrums of signals in the frequency range 36-5990 MHz.
The device displays the spectrums of signals of all modern technologies: Wi-Fi, 2G, 3G, 4G, LTE, CDMA, DCS, GSM, GPRS, GLONASS, etc. This device is intended for home use, as it uses a mathemat-ical method of suppressing the mirror channel.
1.2. The device is designed to determine the amplitude and frequency of the spectral components in-cluded in the signal.
1.3. The presence of a built-in signal generator, the analyzer Arinst SSA-TG R2 and Arinst SSA-TG LC R2 allows you to measure the magnitude-frequency characteristics of active / passive devices (ampli-fiers, repeaters, filters) and measure reflections / standing wave ratio (SWR).
1.4. The device is designed to work in the range of ambient temperatures from 0 to +50 °С and relative air humidity not more than 75%.
1.5. The analyzer is not intended: - to work in open areas during snow or rain; - in places with a corrosive or explosive environment (dust, steam, gas); - for use by people (including children) who have physical, nervous or mental abnormalities or lack of
experience and knowledge that impede the safe operation of the device without supervision or training;
- use by children for games.

Portable spectrum analyzers Arinst 13.01.2020
www.arinst.net | www.arinst.ru | www.kroks.ru 5
2. SPECIFICATIONS 2.1. Technical characteristics of the spectrum analyzers Arinst shown in tables 1 and 2.
Table 1 – Features Arinst SSA-TG R2, Arinst SSA Pro R2 and Arinst SSA Lite R2
Name of parameter
Parameter values
Arinst
SSA-TG R2
Arinst
SSA Pro R2
Arinst
SSA Lite R2
Displayed frequency range 35-6200 MHz
Measured frequency range 35-4500 MHz
Dynamic range for 35-3000 MHz band 75 dB
for 3000-4500 MHz band 70 dB
Maximum bandwidth 6165 MHz
IF bandwidth (fixed) 200 kHz
Sweep speed with a span of more than 100 MHz 700 MHz/s
Sweep time of 100 MHz span < 0,25 s
Detectable signal duration at 10 MHz scan span 20 ms
Noise floor
in the band up to 3000 MHz < -100 dBm
in the band 3000-4500 MHz < -95 dBm
in the band 4500-6200 MHz < -90 dBm
Input impedance 50 Ohm
SWR in the operating frequency range < 1,5
Internal attenuator 0-30 dB
Error of attenuation
up to 10 dB 2 dB
from 10 to 20 dB 5 dB
from 20 to 30 dB 8 dB
Frequency range of built-in tracking generator 35-6200 MHz - -
Tracking generator output power -15 .. -25 dBm - -
Accuracy of display of a signal within a dynamic range 2 dB
Maximum input power
with 0 dB attenuator + 10 dBm
with attenuator > 20 dB + 20 dBm
The measured maximum input signal + 10 dBm
Maximum RF input DC voltage 25 V
Maximum supply current
when running on battery 450 mA 350 mA
when running on USB
(in charging mode) 500 mA
Battery capacity 2000 mAh
Continuous operation time from accumulator 3 h 4 h
Battery charging time ~5 h
Dimensions 155×81×27 mm
Weight 0,4 kg

Portable spectrum analyzers Arinst 13.01.2020
www.arinst.net | www.arinst.ru | www.kroks.ru 6
Table 2 – Features Arinst SSA-TG LC R2
Name of parameter Parameter values
Displayed frequency range 36-5990 MHz
Measured frequency range 36-3000 MHz
Dynamic range for 36-3000 MHz band 70 dB
Maximum bandwidth 5954 MHz
IF bandwidth (fixed) 250 kHz
Sweep time of 100 MHz span < 0,1 s
Detectable signal duration at 10 MHz scan span 20 ms
Noise floor in the band 36-3000 MHz < -95 dBm
Input impedance 50 Ohm
SWR in the operating frequency range < 1,5
Internal attenuator 0-30 dB
Error of attenuation
up to 10 dB 2 dB
from 10 to 20 dB 5 dB
from 20 to 30 dB 8 dB
Frequency range of built-in tracking generator 36-5990 MHz
Tracking generator output power -15 … -25 dBm
Accuracy of display of a signal within a dynamic range 2 dB
Maximum input power with 0 dB attenuator + 10 dBm
with attenuator > 20 dB + 20 dBm
The measured maximum input signal + 10 dBm
Maximum RF input DC voltage 25 V
Maximum supply current when running on USB 350 mA
Dimensions 88×81×27 mm
Weight 0,13 kg
Note. Specifications Arinst spectrum analyzers discontinued placed in APPENDIX B of this manual.

Portable spectrum analyzers Arinst 13.01.2020
www.arinst.net | www.arinst.ru | www.kroks.ru 7
3. COMPLETENESS 3.1. The delivery sets of the devices are given in Tables 3 and 4.
Table 3 – Delivery sets of Arinst SSA-TG R2, Arinst SSA Pro R2 и Arinst SSA Lite R2
Name
Arinst
SSA-TG R2
Arinst
SSA Pro R2
Arinst
SSA Lite R2
Amount
Spectrum analyzer 1 pc. 1 pc. 1 pc.
Adapter SMA (male) – SMA (female)1 2 pc. 1 pc. 1 pc.
Adapter SMA (male) – F (female) - 1 pc. -
Adapter SMA (male) – N (female) - 1 pc. -
Attenuator 30 dB SMA-50-30-2 - 1 pc. -
Power cable mini-USB on USB 2.0 with data transfer 2 1 pc. 1 pc. 1 pc.
Operation manual (passport) 1 pc. 1 pc. 1 pc.
Packaging 1 pc. 1 pc. 1 pc.
Table 4 – Delivery set of Arinst SSA-TG LC R2
Name Amount
Spectrum analyzer 1 pc.
Adapter SMA (male) – SMA (female)1 2 pc.
Power cable mini-USB on USB 2.0 with data transfer 2 1 pc.
Operation manual (passport) 1 pc.
Packaging 1 pc.
Note. Delivery packages Arinst spectrum analyzers discontinued placed in APPENDIX B of this manual.
In connection with constant improvement of design and software, the manufacturer reserves
the right to make changes in the scheme, technical characteristics and completeness of this de-
vice.
1 It used to protect high-frequency connector device from wear and tear.
2 Cable for connecting the device to a PC and charging the built-in battery.

Portable spectrum analyzers Arinst 13.01.2020
www.arinst.net | www.arinst.ru | www.kroks.ru 8
4. SAFETY RULES FOR OPERATING THE DEVICE 4.1. General safety requirements 4.1.1. To work with the instrument allowed persons familiar with the present "User Manual" and been
briefed on rules for safe work with electrical appliances. 4.1.2. The risk of injury is possible when the charger is plugged in or unplugged. Use serviceable
sockets and chargers.
4.1.3. In order to avoid damage to the wires and connectors of the device, it is prohibited to hang any-
thing on the wires, paint over and glue the wires and connectors, disconnect the wires from the cord.
4.1.4. It is strictly forbidden to persons using the device: transfer the device to strangers, disassemble
and repair any device not agreed with the manufacturer, use the device with a damaged case.
4.1.5. If a fault is detected, stop operation immediately and turn off the instrument. 4.1.6. If you need to leave the workplace, turn off the device and other devices. Do not leave the de-
vice running unattended!
4.1.7. Do not use the device in hospitals. The use of the device near medical equipment is allowed on-
ly with the consent of the medical staff.
4.2. Additional security requirements 4.2.1. Use the device only for its intended purpose. Familiarize yourself with the purpose, device and
technical characteristics of the device.
4.2.2. Keep the balance and steady posture while working with the device. Move slowly, do not run.
4.2.3. Avoid working in open spaces during snow or rain. Increased humidity and all types of liquid,
once inside the device, can damage it. 4.2.4. Do not expose the device to very low or very high temperatures; exposure to extreme tempera-
tures may damage the internal battery.
4.2.5. Do not use the appliance in a corrosive or explosive environment. Aggressive vapors can de-
stroy the insulation, which can lead to failure of the device.
4.2.6. Do not carry the device by the cables and wires connected to it, do not unplug the connectors by
pulling the cable or cord.
4.2.7. Do not apply excessive force to the control buttons and the instrument screen. 4.2.8. Avoid dropping or otherwise shocking the unit. The device may be damaged if dropped.
4.2.9. Do not disassemble or modify the appliance without the approval of the manufacturer or outside
of the procedures described in this manual. Incorrect self-intervention will result in loss of warranty.
4.2.10. Do not allow children to play with the device, as they can hurt or injure others, or damage the
device.
4.2.11. Use chargers, cords, adapters and other accessories recommended by the manufacturer. 4.2.12. When connecting to the device other devices, carefully read their purpose, technical character-
istics and safety rules in their manuals. Do not connect incompatible devices.
4.2.13. Maintenance and repair of the instrument must be carried out only by the manufacturer or an
authorized service center.

Portable spectrum analyzers Arinst 13.01.2020
www.arinst.net | www.arinst.ru | www.kroks.ru 9
5. STRUCTURE OF THE DEVICE 5.1. The spectrum analyzers Arinst SSA-TG R2, Arinst SSA Pro R2 and Arinst SSA Lite R2 shown
in Figures 1 - 3.
Figure 1 – Arinst SSA-TG R2
Figure 2 – Arinst SSA Pro R2 and Arinst SSA Lite R2
1. The output of the signal generator TG OUT 6. Indicator of the mode of operation of the device 2. Antenna input RF IN MODE 3. Housing 7. Battery charging indicator CHARGE 4. Color resistive screen 3,2’’ 8. Connector mini-USB 5. Button on / off POWER 9. Control button block
5.2. The control button unit is shown in figure 3.
Figure 3 – The block of control buttons
10. «SPAN» (overview frequency range) - buttons " - " and " + " change the frequency range of the analyzed signal. 11. Buttons to move the screen scale grid and change the frequency. 12. «FREQ» - displays the frequency parameters on the screen. Long press (more than 2 seconds) to open the menu for setting the viewing frequency range. 13. «MKR» setting markers. Long (more than 2 seconds) button holding opens the menu of markers and peak val-ues of the analyzed signal. 14. «MENU» - the button opens the main menu of the device. 15. «AMPL» - output amplitude parameters on the screen. Long (more than 2 seconds) holding the button opens the menu for setting the amplitude parameters.
Portable spectrum analyzers Arinst 13.01.2020
www.arinst.net | www.arinst.ru | www.kroks.ru 10
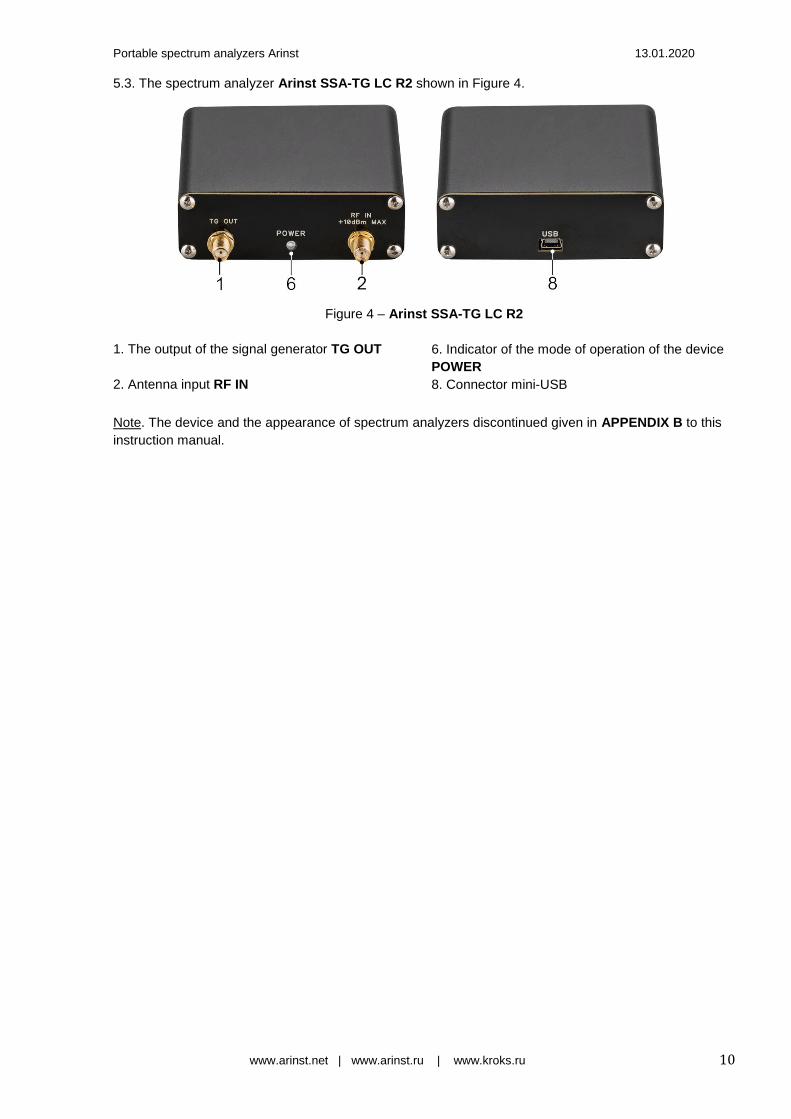
5.3. The spectrum analyzer Arinst SSA-TG LC R2 shown in Figure 4.
Figure 4 – Arinst SSA-TG LC R2
1. The output of the signal generator TG OUT 6. Indicator of the mode of operation of the device
POWER
2. Antenna input RF IN 8. Connector mini-USB
Note. The device and the appearance of spectrum analyzers discontinued given in APPENDIX B to this
instruction manual.

Portable spectrum analyzers Arinst 13.01.2020
www.arinst.net | www.arinst.ru | www.kroks.ru 11
6. ACTIVATION Attention! The use of the device in open spaces during snowfall or rain is prohibited. If the de-
vice is brought in the winter from a cold room, or from the street into a warm room, do not turn it
on for a time sufficient to evaporate condensate from the device. Attention! Match the voltage and power of the input signal with the maximum technical
characteristics of the device listed in Tables 1 and 2.
6.1. Turning on the device
6.1.1. Ensure that the instrument is free from external damage and the battery is charged. Charge the discharged battery pack before using the device, following the instructions in section 10.2. of this “Manu-al”.
6.1.2. To enable Arinst SSA-TG R2, Arinst SSA Pro R2 and Arinst SSA Lite R2, press and hold the
«POWER» button (5) for 1-2 seconds. The operation mode LED (7) «MODE» will flicker a series of flash-
es. Screen (4) turns on and the signal's spectrum graph will be displayed on it.
6.1.3. The spectrum analyzer Arinst SSA-TG LC R2 does not have its own independent power supply.
The device is powered from a power source (battery) phone or tablet to which it is connected or the pow-
er supply from the PC or laptop.
6.1.4. The device is controlled by a smartphone or tablet running Android version 4.1 and above that
support the USB OTG standard. Since the spectrum analyzer does not have its own power source, the
device is powered from the power source (battery) of the smartphone or tablet to which it is connected. All
measured data are transmitted in real time to a smartphone or tablet via USB OTG cable and displayed
on the screen.
Connect the spectrum analyzer to your smartphone or tablet. Make sure your smartphone or tab-
let is running Android OS version 4.1 or higher and supports USB OTG standard. You will need a
USB OTG cable. Connect the USB OTG cable mini-USB connector of the device to the micro-
USB connector of your smartphone or tablet. The glow of the instrument mode indicator (6)
«POWER» confirms the power supply and activation of the analyzer.
6.1.5. The device can be controlled by a PC or laptop running Windows 7 and above. Power supply,
control of the device and data transfer is carried out via USB-cable.
Connect the spectrum analyzer to a PC or laptop. Connect the USB cable supplied with the mini-
USB connector of the device to the USB connector of your computer or laptop. The operating
mode led (6) «POWER» will light up and the analyzer will turn on.
Note. Description of the instrument control software interface using devices based on Android and
Windows operating system is placed in section 8 of this manual. The detailed algorithm of the spectrum
analyzer to connect to devices running Windows operating system is set out in APPENDIX A of this man-
ual.
6.2. Turning off the device 6.2.1. To turn off the devices Arinst SSA-TG R2, Arinst SSA Pro R2 and Arinst SSA Lite R2, press
and hold the "POWER" button (5) for 1-2 seconds. The mode LED (7) "MODE" and the screen (4) are off. The device will turn off.
6.2.2. Information on the installation of automatic shutdown of the device is in section 7.9.6 of this
"Manual".
6.2.3. To turn off the analyzer Arinst SSA-TG LC R2, disconnect it from your smartphone or tablet (or
laptop computer). Mode indicator (6) «POWER» will go off, the device switches off.
Portable spectrum analyzers Arinst 13.01.2020
www.arinst.net | www.arinst.ru | www.kroks.ru 12
7. THE SCREEN OF THE DEVICE
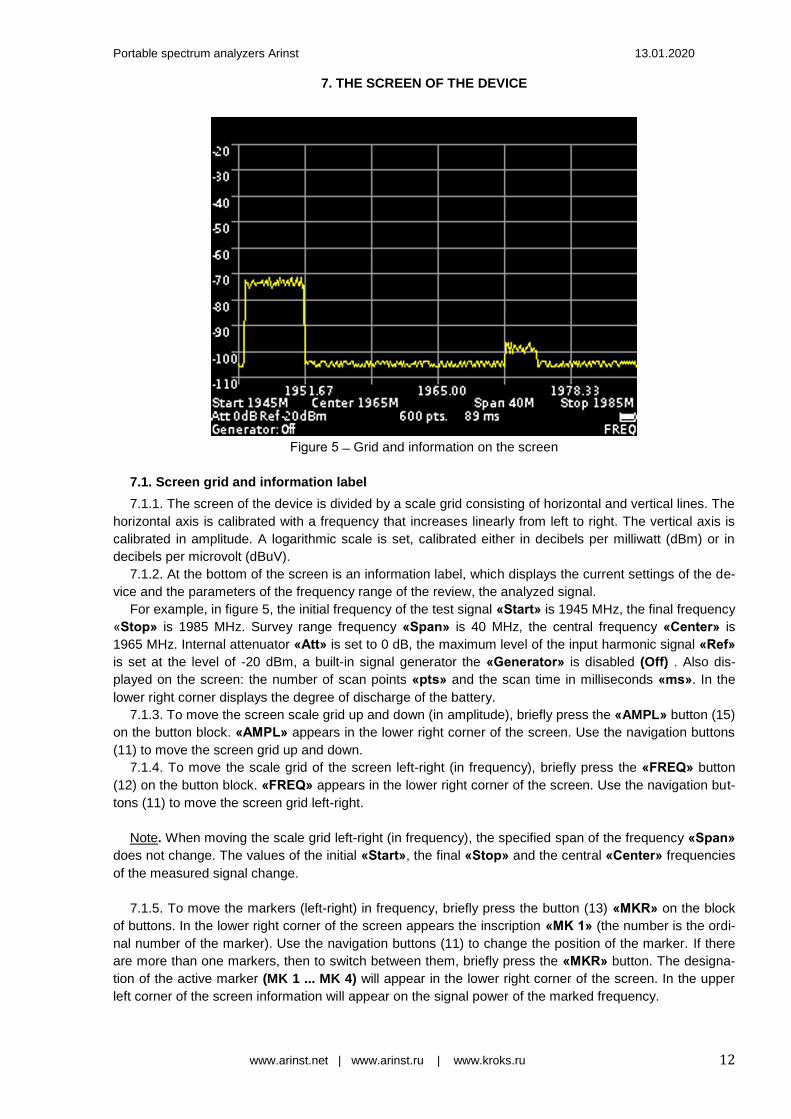
igure 5 Grid and information on the screen
7.1. Screen grid and information label 7.1.1. The screen of the device is divided by a scale grid consisting of horizontal and vertical lines. The
horizontal axis is calibrated with a frequency that increases linearly from left to right. The vertical axis is
calibrated in amplitude. A logarithmic scale is set, calibrated either in decibels per milliwatt (dBm) or in
decibels per microvolt (dBuV).
7.1.2. At the bottom of the screen is an information label, which displays the current settings of the de-
vice and the parameters of the frequency range of the review, the analyzed signal.
For example, in figure 5, the initial frequency of the test signal «Start» is 1945 MHz, the final frequency
«Stop» is 1985 MHz. Survey range frequency «Span» is 40 MHz, the сentral frequency «Center» is
1965 MHz. Internal attenuator «Att» is set to 0 dB, the maximum level of the input harmonic signal «Ref»
is set at the level of -20 dBm, a built-in signal generator the «Generator» is disabled (Off) . Also dis-
played on the screen: the number of scan points «pts» and the scan time in milliseconds «ms». In the
lower right corner displays the degree of discharge of the battery.
7.1.3. To move the screen scale grid up and down (in amplitude), briefly press the «AMPL» button (15)
on the button block. «AMPL» appears in the lower right corner of the screen. Use the navigation buttons
(11) to move the screen grid up and down.
7.1.4. To move the scale grid of the screen left-right (in frequency), briefly press the «FREQ» button
(12) on the button block. «FREQ» appears in the lower right corner of the screen. Use the navigation but-
tons (11) to move the screen grid left-right.
Note. When moving the scale grid left-right (in frequency), the specified span of the frequency «Span»
does not change. The values of the initial «Start», the final «Stop» and the central «Center» frequencies
of the measured signal change.
7.1.5. To move the markers (left-right) in frequency, briefly press the button (13) «MKR» on the block
of buttons. In the lower right corner of the screen appears the inscription «MK 1» (the number is the ordi-
nal number of the marker). Use the navigation buttons (11) to change the position of the marker. If there
are more than one markers, then to switch between them, briefly press the «MKR» button. The designa-
tion of the active marker (MK 1 ... MK 4) will appear in the lower right corner of the screen. In the upper
left corner of the screen information will appear on the signal power of the marked frequency.

Portable spectrum analyzers Arinst 13.01.2020
www.arinst.net | www.arinst.ru | www.kroks.ru 13
7.2. Main menu 7.2.1. Turn on the instrument in accordance with section 6 of this «Manual». To enter the main menu,
press the «MENU» button (14) on the button block. The menu appears on the screen, as in figure 6.
Figure 6 Main menu
7.2.2. Each section of the main menu has its own purpose:
Frequency - subsection of the menu in which the frequency range of the analyzed signal is set.
Amplitude – the subsection of the menu in which the amplitude parameters are set (step and scale of
the screen grid, input resistance, maximum level of the input harmonic signal).
Markers – a submenu in which visual amplitude markers are set at a fixed frequency or over the entire
frequency range of the analyzed signal.
Generator – the menu for turning on the signal generator, setting the power and frequency of the sig-
nal generator. It also measures the standing wave ratio (SWR) and the amplitude-frequency response of
the equipment under test.
Device - in this menu, the device shutdown timer, amplitude and frequency shift are set, the serial
number of the device, its version and the settings for connecting the device via Bluetooth are specified.
Presets - menu to save custom presets. 7.2.3. To exit the main menu, press (14) «MENU».
7.3. Setting the frequency range of the analyzed signal
igure 7 Menu of setting the frequency of the overview
Portable spectrum analyzers Arinst 13.01.2020
www.arinst.net | www.arinst.ru | www.kroks.ru 14
7.3.1. To set the frequency range, enter the main menu of the instrument (Figure 6) by pressing (14)
«MENU». Select subsection «Frequency». The menu appears on the screen, as in figure 7.
Note. For quick access to the menu, press and hold the button (12) for about 2 seconds «FREQ».
7.3.2. Each of the options of the submenu has its own purpose: Center – setting the center frequency of the frequency range of the overview of the analyzed signal. Span – setting the frequency range. Start – setting the initial frequency of the measured frequency range.
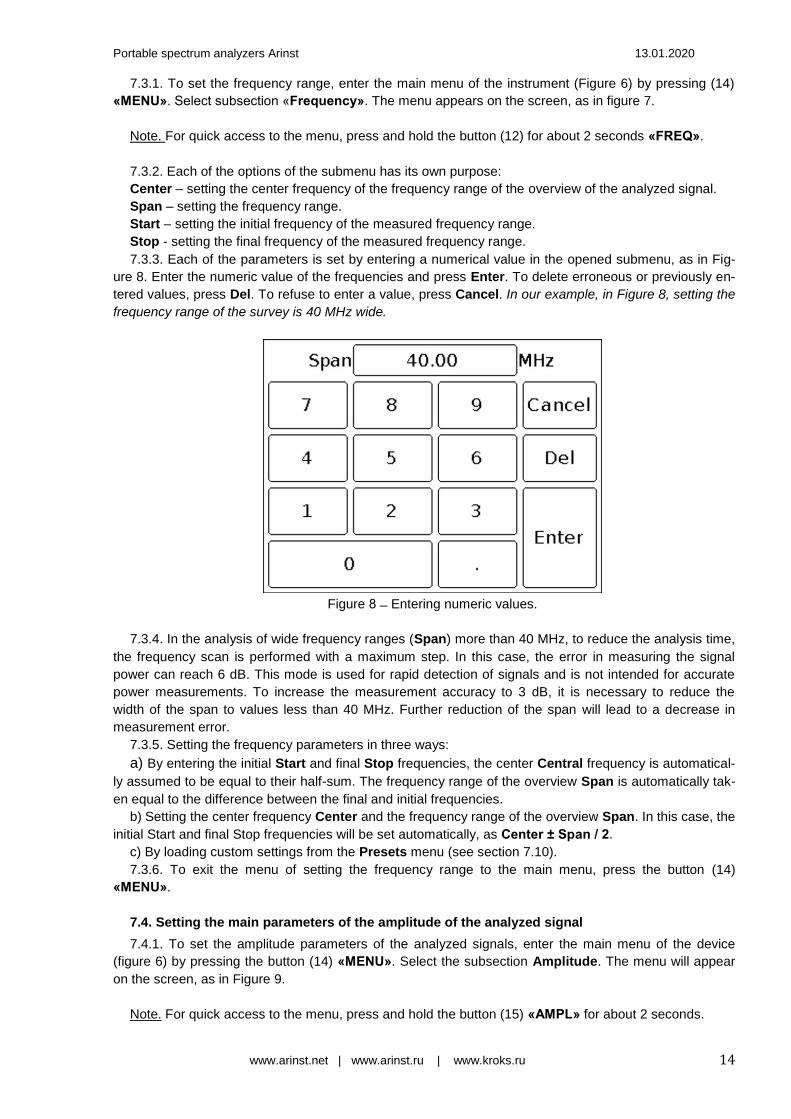
Stop - setting the final frequency of the measured frequency range. 7.3.3. Each of the parameters is set by entering a numerical value in the opened submenu, as in Fig-
ure 8. Enter the numeric value of the frequencies and press Enter. To delete erroneous or previously en-
tered values, press Del. To refuse to enter a value, press Cancel. In our example, in Figure 8, setting the
frequency range of the survey is 40 MHz wide.
Figure 8 Entering numeric values.
7.3.4. In the analysis of wide frequency ranges (Span) more than 40 MHz, to reduce the analysis time,
the frequency scan is performed with a maximum step. In this case, the error in measuring the signal
power can reach 6 dB. This mode is used for rapid detection of signals and is not intended for accurate
power measurements. To increase the measurement accuracy to 3 dB, it is necessary to reduce the
width of the span to values less than 40 MHz. Further reduction of the span will lead to a decrease in
measurement error.
7.3.5. Setting the frequency parameters in three ways:
a) By entering the initial Start and final Stop frequencies, the center Central frequency is automatical-
ly assumed to be equal to their half-sum. The frequency range of the overview Span is automatically tak-
en equal to the difference between the final and initial frequencies.
b) Setting the center frequency Center and the frequency range of the overview Span. In this case, the
initial Start and final Stop frequencies will be set automatically, as Center ± Span / 2.
c) By loading custom settings from the Presets menu (see section 7.10).
7.3.6. To exit the menu of setting the frequency range to the main menu, press the button (14)
«MENU».
7.4. Setting the main parameters of the amplitude of the analyzed signal 7.4.1. To set the amplitude parameters of the analyzed signals, enter the main menu of the device
(figure 6) by pressing the button (14) «MENU». Select the subsection Amplitude. The menu will appear
on the screen, as in Figure 9.
Note. For quick access to the menu, press and hold the button (15) «AMPL» for about 2 seconds.

Portable spectrum analyzers Arinst 13.01.2020
www.arinst.net | www.arinst.ru | www.kroks.ru 15
igure 9 Amplitude parameters setup menu
7.4.2. In this menu, the following parameters are set:
Grid step – parameter that sets the step of the scale grid of the screen, along the vertical axis. It is
possible to set the grid in increments of 5 dB or 10 dB.
Z in – The parameter that determines the input / output impedance. It is used when calculating the in-
put signal level of the receiver and the generator output signal (if any). At the same time, the real value of
impedances is 50 Ohm The value of 50 or 75 Ohm must be chosen depending on the wave impedance of
the connected antenna / load.
Scale – change of vertical scale graduation in dBm or dBuV values. Reference amplitude – the parameter that sets the maximum level of the input harmonic signal does
not cause overload of the receiver (the maximum displayed value of the amplitude). It is set depending on
the selected parameter calibration of the vertical scale (Scale) range from 10 to -75 dBm or in the range
of 117 to 32 dBuV.
7.4.3. Each parameter is set by pressing the corresponding menu value or by "scrolling" the values to
a fixed selected area.
7.4.4. The level of attenuation of the input signal (the value of the internal attenuator) is set automati-
cally, depending on the set value Reference amplitude. Attention! If the input signal level is much higher than the Reference amplitude value, a warning
message Dynamic range exceeded appears on the device screen. In this case, the correct display of
the input signal level is impossible. In this case it is necessary:
increase the value Reference amplitude (the internal attenuator will be activated);
to use an external attenuator. 7.4.5. To exit to the main menu, press the button (14) «MENU».
7.5. Menu for setting markers and signal peaks 7.5.1. To enter the menu of setting markers and peaks, enter the main menu of the device (Figure 6)
by pressing the button (14) «MENU». Select subsection Markers. The menu appears on the instrument
screen, as in Figure 10.
Note. To quickly access the menu, press and hold the button for about 2 seconds (13) «MKR».

Portable spectrum analyzers Arinst 13.01.2020
www.arinst.net | www.arinst.ru | www.kroks.ru 16
igure 10 The menu of markers and peak values of the signal. Max trace mode is on
7.5.2. In this menu are installed:
Max trace – when this mode is enabled, the maximum values of the signal are displayed on the
screen and a red line is drawn along the points of the maximum values. In order to fix the track include a
pause, touching the screen of the device.
Min trace – when this mode is enabled, the minimum values of the signal are displayed on the screen
and a green line is drawn along the points of the minimum values. In order to fix the track include a
pause, touching the screen of the device.
When you turn on the Avg trace (Average) mode, the signal will be averaged on the screen. The
number of measurements in this mode is limited in the range from 4 to 16. In order to fix the track include
a pause, touching the screen of the device.
In Waterfall mode, a spectrogram is displayed below the spectrum graph. The spectrogram allows you
to analyze the background of the signal for a certain time interval. Due to the selectivity of color percep-
tion of a person, it is possible to detect signals at the noise level with the help of spectrogram.
igure 10.1 The menu of markers and peak values of the signal. Min trace mode is on

Portable spectrum analyzers Arinst 13.01.2020
www.arinst.net | www.arinst.ru | www.kroks.ru 17
igure 10.2 The menu of markers and peak values of the signal. Avg trace mode is on
igure 11 The menu of markers and peak values of the signal. Waterfall mode is on
When Waterfall mode is enabled, a spectrogram is displayed on the instrument screen below the
spectrum graph (figure 11.1).
Figure 11.1 – Displaying the spectrogram below the spectrum graph
Turning on / off the Max trace, Min trace, Avg trace and Waterfall modes is performed by moving the
“slider” to the right / left opposite the corresponding mode.

Portable spectrum analyzers Arinst 13.01.2020
www.arinst.net | www.arinst.ru | www.kroks.ru 18
Marker - visual indicator of signal amplitude at the frequency of marker location specified by the opera-
tor. The design of the device allows the use of up to four multi-colored markers at the same time to moni-
tor the change in the amplitudes of the analyzed signal at four frequencies given by the operator.
Note. Also, the marker can be switched to the maximum signal tracking mode (Peak mode). Up to four
simultaneous tracking peaks on a chart.
Peak – visual indicator of the maximum value of the signal amplitude over the entire frequency range.
The design of the device allows the use of up to four multi-colored peak indicators to monitor changes in
the amplitudes of the analyzed signal over the entire range of the specified frequency range.
7.5.3. Setting the specified marker frequency is performed by entering a numeric value in the opened
submenu, as in figure 12. Enter a numeric frequency value and press Enter (enter data). To delete erro-
neous or previously entered values, press Del (Delete). To refuse to enter a value, click Cancel. In our
example, in figure 12, we set the frequency to 1960 MHz for marker.
7.5.4. Moving the included markers on the screen in real time, make in accordance with paragraph
7.1.5. of this «Manual».
7.5.5. If it is necessary to search and track the maximum (peak) amplitude values over the entire range
of the signal under analyze, one or several Marker indicators must be switched to the Peak value as
shown in figure 10.
igure 12 Entering numerical values of marker frequencies
Switching on / off the Marker and Peak modes is made by moving the “slider” to the right / left oppo-
site the corresponding mode.
7.5.6. To exit the setup menu of markers and peak values of the signal, press the button (14)
«MENU».
7.6. Signal generator frequency and power setting menu
7.6.1. To set the values of the frequency and output power of the built-in generator, go to the main
menu of the device (Figure 6) by pressing the button (14) «MENU». Select subsection Generator, menu
will appear on the screen as in figure 13.
Portable spectrum analyzers Arinst 13.01.2020
www.arinst.net | www.arinst.ru | www.kroks.ru 19
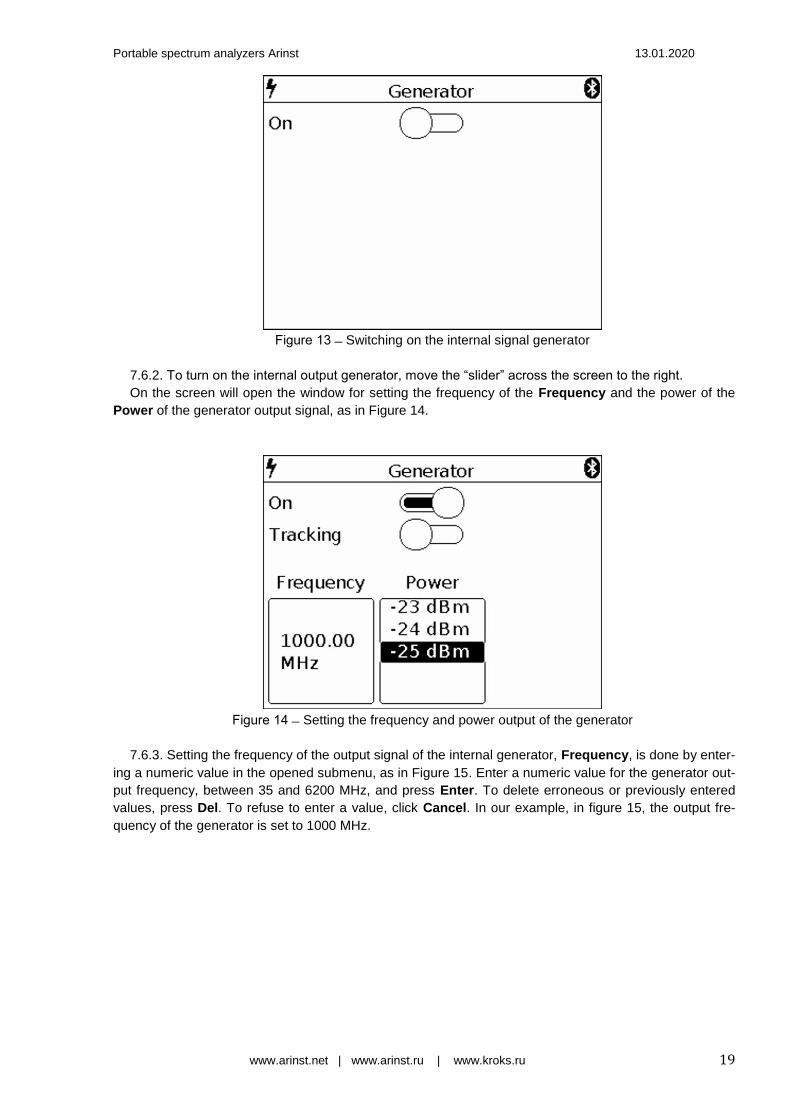
igure 13 Switching on the internal signal generator
7.6.2. To turn on the internal output generator, move the “slider” across the screen to the right.
On the screen will open the window for setting the frequency of the Frequency and the power of the
Power of the generator output signal, as in Figure 14.
igure 14 Setting the frequency and power output of the generator
7.6.3. Setting the frequency of the output signal of the internal generator, Frequency, is done by enter-
ing a numeric value in the opened submenu, as in Figure 15. Enter a numeric value for the generator out-
put frequency, between 35 and 6200 MHz, and press Enter. To delete erroneous or previously entered
values, press Del. To refuse to enter a value, click Cancel. In our example, in figure 15, the output fre-
quency of the generator is set to 1000 MHz.
Portable spectrum analyzers Arinst 13.01.2020
www.arinst.net | www.arinst.ru | www.kroks.ru 20
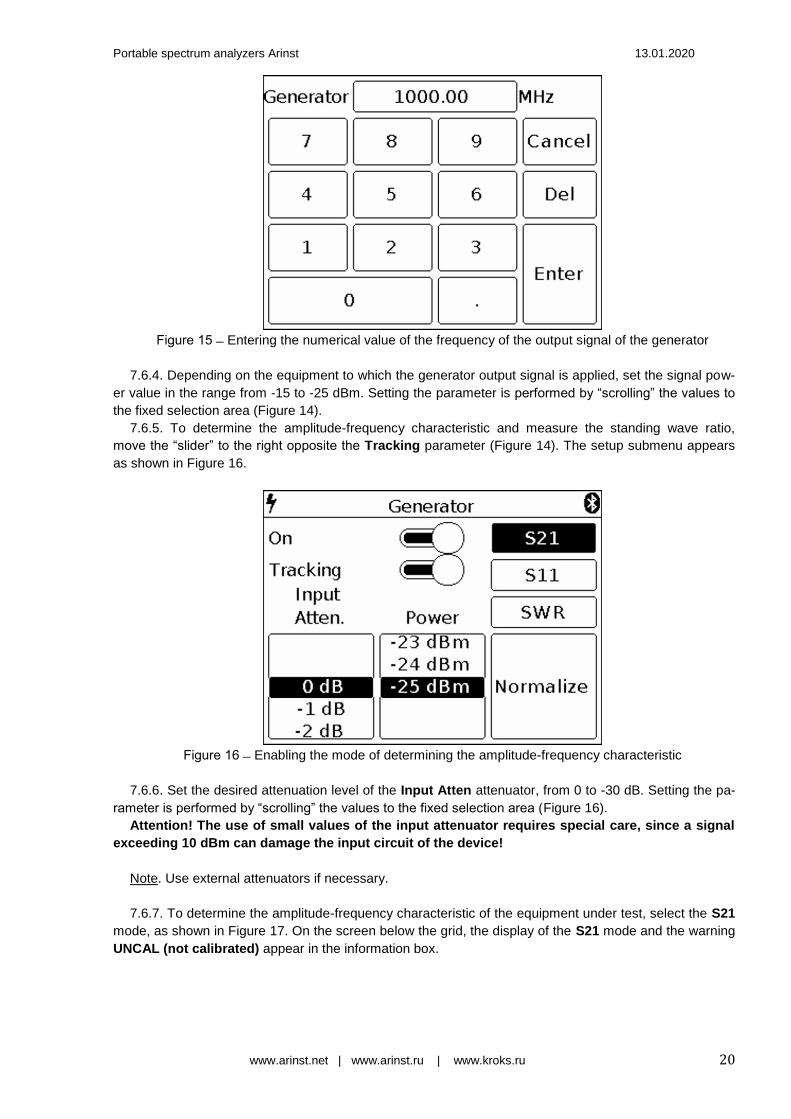
igure 15 Entering the numerical value of the frequency of the output signal of the generator
7.6.4. Depending on the equipment to which the generator output signal is applied, set the signal pow-
er value in the range from -15 to -25 dBm. Setting the parameter is performed by “scrolling” the values to
the fixed selection area (Figure 14).
7.6.5. To determine the amplitude-frequency characteristic and measure the standing wave ratio,
move the “slider” to the right opposite the Tracking parameter (Figure 14). The setup submenu appears
as shown in Figure 16.
igure 16 Enabling the mode of determining the amplitude-frequency characteristic
7.6.6. Set the desired attenuation level of the Input Atten attenuator, from 0 to -30 dB. Setting the pa-
rameter is performed by “scrolling” the values to the fixed selection area (Figure 16).
Attention! The use of small values of the input attenuator requires special care, since a signal
exceeding 10 dBm can damage the input circuit of the device!
Note. Use external attenuators if necessary.
7.6.7. To determine the amplitude-frequency characteristic of the equipment under test, select the S21
mode, as shown in Figure 17. On the screen below the grid, the display of the S21 mode and the warning
UNCAL (not calibrated) appear in the information box.

Portable spectrum analyzers Arinst 13.01.2020
www.arinst.net | www.arinst.ru | www.kroks.ru 21
igure 17 Determination of the amplitude-frequency characteristics of the equipment under test
Note. When determining the frequency response of active and passive devices, it is recommended to
use cables with a high screening coefficient. This will ensure minimization of the parasitic transmission of
electromagnetic energy from one port of the device to another port.
To reduce the influence of connecting wires and connectors on the measurement results, it is neces-
sary to normalize Normalize the test circuit, without the test equipment. To do this, connect the output of
the signal generator (1) TG OUT with the antenna input (2) RF IN of the device between the connectors
(cables), which will then be used to connect to the measured device and press the command Normalize.
When this operation is completed, the background of the Normalize command will turn yellow to confirm
the completion of the normalize operation. To cancel normalization, click Normalize again. The command
background will return to the original menu background color.
On the screen under the grid in the information label will display the mode S21 and the message Freq.
Lock (frequency cannot change) (Figure 17).
Note. After normalization, the setting of the frequency span of the generator output signal and analyz-
er are inaccessible. Set the frequency range of the generator output signal and analyzer before normali-
zation.
Without turning off the device, turn on the equipment under test in the circuit. The instrument will dis-
play a graph of the amplitude-frequency characteristics of the equipment under test in a given frequency
range.
Note. When changing the elements in the circuit to which the tested equipment is connected, normali-
zation should be carried out anew.
Measurement of the frequency response of active devices with known power characteristics.
To measure the frequency response of active devices, such as antenna amplifiers, with known power
characteristics, it is necessary to set the signal power of the generator and the level of signal attenuation
by the input attenuator so that the signal level from the internal oscillator of the device, before the normal-
ization operation was at-50-60 dBm.
Note. A lower signal level will lead to increased noise and non-linearity of the measured signal.
After installation, perform a normalization and measure the frequency response of the active device.
Measurement of the frequency response of active devices with unknown power characteristics.
Set the minimum output power of the internal generator and the maximum attenuation value of the in-
put attenuator of the instrument receiver. If necessary, add an additional external attenuator. Perform the
normalization operation and connect the test device to the circuit. If necessary, reduce the attenuation
level of the attenuator.
Portable spectrum analyzers Arinst 13.01.2020
www.arinst.net | www.arinst.ru | www.kroks.ru 22
Note. When changing the external attenuator, perform the normalization operation again.
Attention! If the input signal level is greatly exceeded, a warning message Dynamic range exceeded
appears on the screen of the device. In this case, the input level cannot be displayed correctly. In this
case, it is necessary to increase the level of signal attenuation by external attenuators.
Attention! The use of small values of the input attenuator requires special attention, since a
signal exceeding 10 dBm can damage the input circuit of the device!
7.6.7. To exit the menu of setting the frequency and output power of the generator, press the button
(14) «MENU».
7.7. Setting parameters and measuring the reflection coefficient S11
Our device ARINST SSA-TG R2, in the measurement mode of the S11 parameter, uses a scalar SOL
calibration.
And these measurements are not vector, that is, they provide compensation only for the amplitude of
the signal without phase.
The scalar calibration algorithm is as follows S11corr = (S11open + S11short) / 2;
S11 = S11measure - S11corr.
In this case, the minimum level of the measured coefficient S11 is set by the calibration S11load.
that is, S11min = S11load - S11corr;
Screenshots presented by you confirm this.
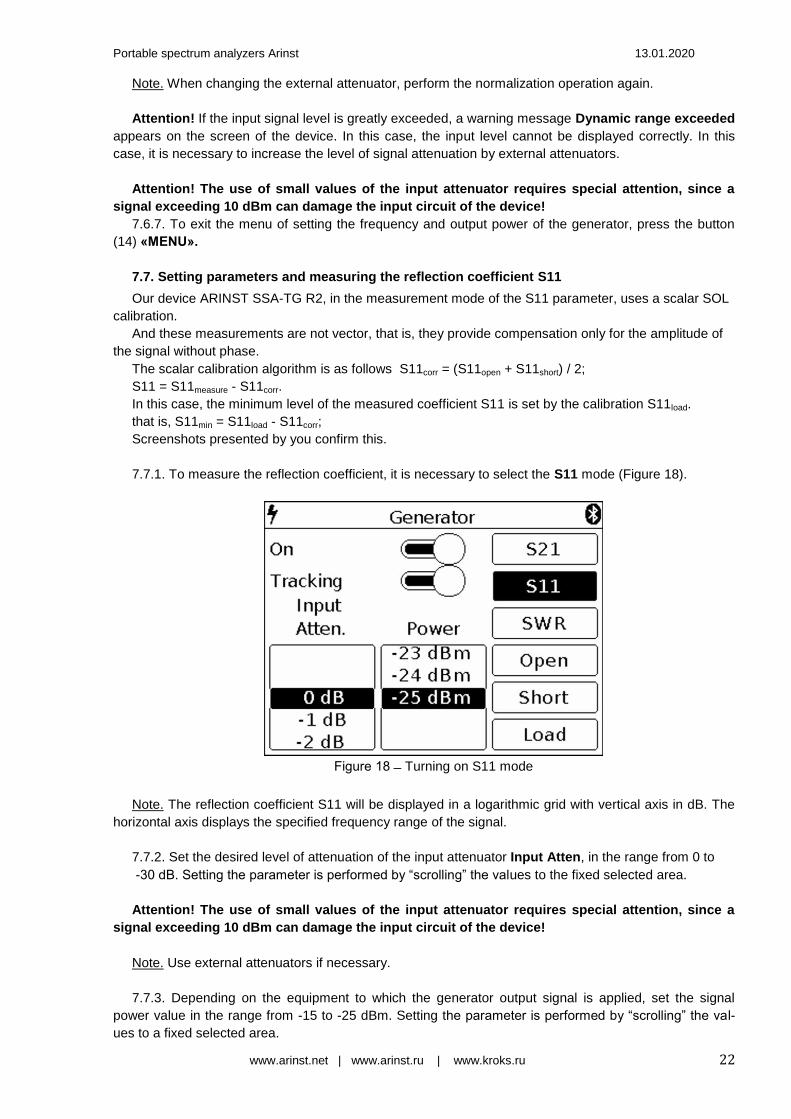
7.7.1. To measure the reflection coefficient, it is necessary to select the S11 mode (Figure 18).
igure 18 Turning on S11 mode
Note. The reflection coefficient S11 will be displayed in a logarithmic grid with vertical axis in dB. The
horizontal axis displays the specified frequency range of the signal.
7.7.2. Set the desired level of attenuation of the input attenuator Input Atten, in the range from 0 to
-30 dB. Setting the parameter is performed by “scrolling” the values to the fixed selected area.
Attention! The use of small values of the input attenuator requires special attention, since a
signal exceeding 10 dBm can damage the input circuit of the device!
Note. Use external attenuators if necessary.
7.7.3. Depending on the equipment to which the generator output signal is applied, set the signal
power value in the range from -15 to -25 dBm. Setting the parameter is performed by “scrolling” the val-
ues to a fixed selected area.
Portable spectrum analyzers Arinst 13.01.2020
www.arinst.net | www.arinst.ru | www.kroks.ru 23
Note. To measure the reflection coefficient S11, it is necessary to use a directional coupler or measur-
ing bridge at the appropriate frequency range (not included in the package). In our example in figure 19,
the KROKS KSB 2700 measuring bridge is specifically designed for use with ARINST spectrum analyz-
ers.
7.7.4. Select the mode S11 in which you want to measure, as shown in figure 18. On the screen under
the grid, the information label will display the mode S11 and the warning UNCAL (not calibrated). 7.7.5. To reduce the influence of connecting wires and connectors on the measurement results, it is
necessary to calibrate.
Note. It is allowed to perform calibration once for modes S11 and SWR, provided that the connectors
and cables of the circuit under test do not change.
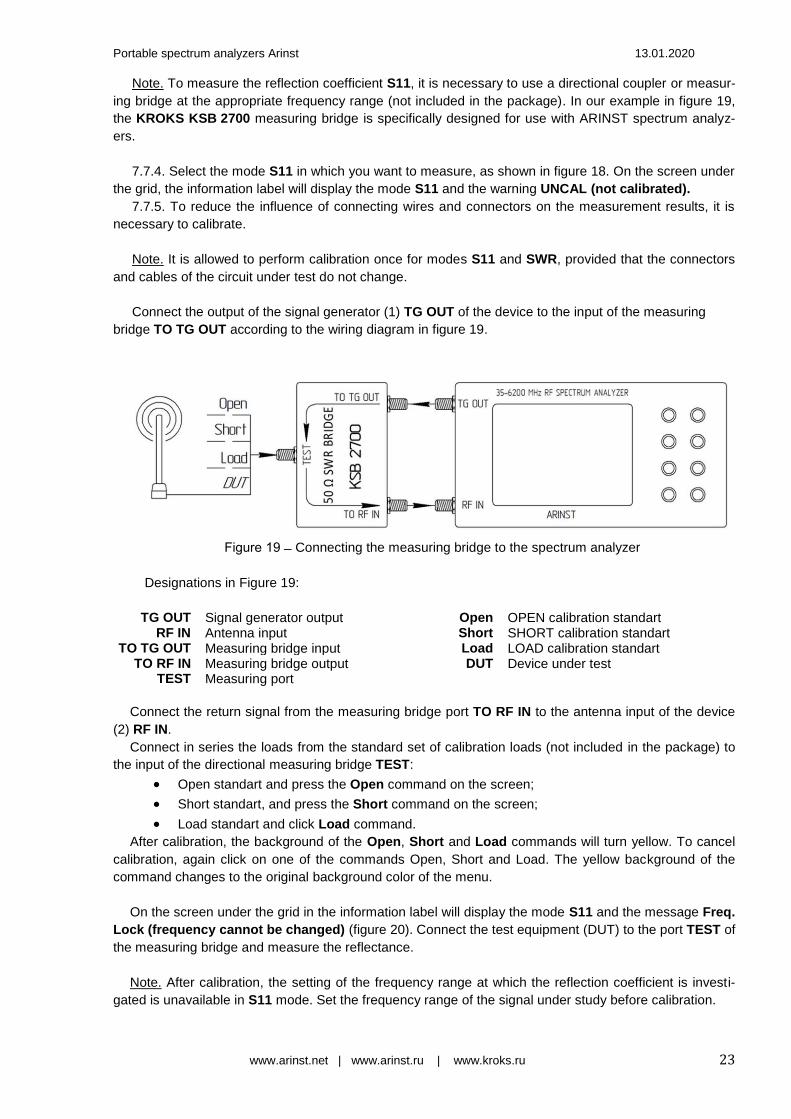
Connect the output of the signal generator (1) TG OUT of the device to the input of the measuring
bridge TO TG OUT according to the wiring diagram in figure 19.
igure 19 Connecting the measuring bridge to the spectrum analyzer
Designations in Figure 19:
TG OUT Signal generator output Open OPEN calibration standart RF IN Antenna input Short SHORT calibration standart
TO TG OUT Measuring bridge input Load LOAD calibration standart TO RF IN Measuring bridge output DUT Device under test
TEST Measuring port
Connect the return signal from the measuring bridge port TO RF IN to the antenna input of the device
(2) RF IN.
Connect in series the loads from the standard set of calibration loads (not included in the package) to
the input of the directional measuring bridge TEST:
Open standart and press the Open command on the screen;
Short standart, and press the Short command on the screen;
Load standart and click Load command. After calibration, the background of the Open, Short and Load commands will turn yellow. To cancel
calibration, again click on one of the commands Open, Short and Load. The yellow background of the
command changes to the original background color of the menu.
On the screen under the grid in the information label will display the mode S11 and the message Freq.
Lock (frequency cannot be changed) (figure 20). Connect the test equipment (DUT) to the port TEST of
the measuring bridge and measure the reflectance.
Note. After calibration, the setting of the frequency range at which the reflection coefficient is investi-
gated is unavailable in S11 mode. Set the frequency range of the signal under study before calibration.

Portable spectrum analyzers Arinst 13.01.2020
www.arinst.net | www.arinst.ru | www.kroks.ru 24
Note. When connecting other connectors and cables, it is necessary to re-calibrate.
igure 20 Display of the reflection coefficient graph
7.7.6. To exit the reflection measurement menu S11, press the button (14) «MENU».
7.8. Setting parameters and measuring the standing wave ratio SWR 7.8.1 To measure the standing wave ratio, you must select the SWR mode (Figure 21). The standing
wave ratio is measured in SWR mode. The graph will be displayed with the vertical axis as a numerical
standing wave ratio. The horizontal axis shows the specified frequency range of the signal.
Figure 21 Enabling SWR mode
7.8.2. Set the desired level of attenuation of the input attenuator Input Atten in the range of 0 to -30
dB. Setting the parameter is performed by “scrolling” the values to the fixed selected area.
Attention! The use of small values of the input attenuator requires special attention, since a
signal exceeding 10 dBm can damage the input circuit of the device!
Note. Use external attenuators if necessary.
7.8.3. Depending on the equipment to which the generator output signal is applied, set the signal pow-
er value in the range from -15 to -25 dBm. Setting the parameter is performed by “scrolling” the values to
a fixed selected area.

Portable spectrum analyzers Arinst 13.01.2020
www.arinst.net | www.arinst.ru | www.kroks.ru 25
Note. To measure the standing wave ratio, you must use a directional coupler or measuring bridge (not
included in the package). In our example in figure 19, the KROKS KSB 2700 measuring bridge is specifi-
cally designed for use with ARINST spectrum analyzers.
7.8.4. Select the SWR mode in which you want to measure, as shown in figure 21. On the screen un-
der the grid, the information label will display the SWR mode and the warning UNCAL (not calibrated). 7.8.5. To reduce the influence of connecting cables and connectors on the measurement results, it is
necessary to calibrate.
Note. It is allowed to perform the calibration once for the SWR and S11 modes, provided that the con-
nectors and cables of the circuit under test do not change.
Connect the output of the signal generator (1) TG OUT of the device to the input of the directional
measuring bridge TO TG OUT according to the wiring diagram in figure 19. Output of the reflected signal
from the measuring bridge port TO RF IN connect to the antenna input of the device (2) RF IN. Connect in series the loads from the standard set of calibration loads (not included in the package) to
the input of the measuring bridge TEST:
Open standart and press the Open command on the screen;
Short standart, and press the Short command on the screen;
Load standart and click Load command. After calibration, the background of the Open, Short and Load commands will turn yellow. To cancel
calibration, again click on one of the commands Open, Short and Load. The yellow background of the
command changes to the original background color of the menu.
On the screen under the grid in the information label will display the SWR mode and the message
Freq. Lock (frequency cannot be changed) (figure 22). Connect the test equipment (DUT) to the TEST
port of the measuring bridge and measure the standing wave ratio.
igure 22 Displaying the standing wave ratio in the SWR mode
Note. After calibration, setting the frequency range and amplitude values of the test signal in SWR
mode becomes unavailable. Set the frequency range and amplitude values of the test signal before cali-
bration.
Note. When connecting other connectors and cables, it is necessary to re-calibrate.
7.8.6. To exit from the menu for measuring the standing wave ratio SWR, press the button (14)
«MENU».
Portable spectrum analyzers Arinst 13.01.2020
www.arinst.net | www.arinst.ru | www.kroks.ru 26
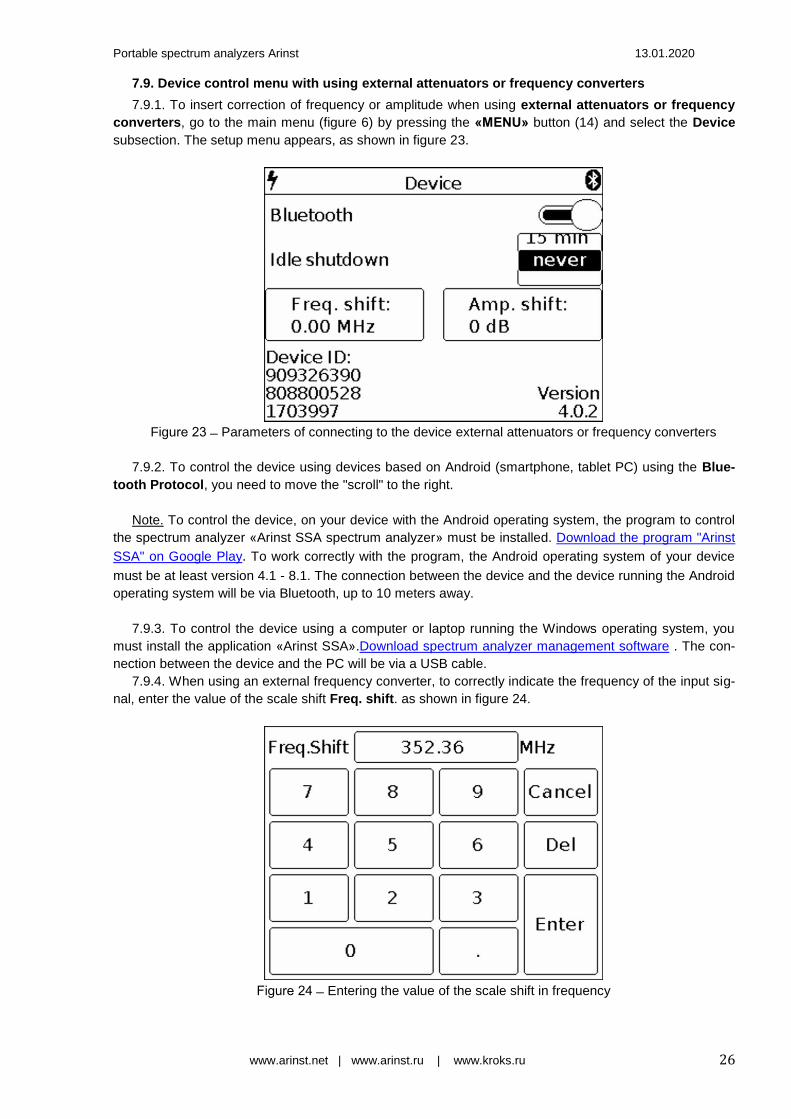
7.9. Device control menu with using external attenuators or frequency converters
7.9.1. To insert correction of frequency or amplitude when using external attenuators or frequency
converters, go to the main menu (figure 6) by pressing the «MENU» button (14) and select the Device
subsection. The setup menu appears, as shown in figure 23.
Figure 23 Parameters of connecting to the device external attenuators or frequency converters
7.9.2. To control the device using devices based on Android (smartphone, tablet PC) using the Blue-
tooth Protocol, you need to move the "scroll" to the right.
Note. To control the device, on your device with the Android operating system, the program to control
the spectrum analyzer «Arinst SSA spectrum analyzer» must be installed. Download the program "Arinst
SSA" on Google Play. To work correctly with the program, the Android operating system of your device
must be at least version 4.1 - 8.1. The connection between the device and the device running the Android
operating system will be via Bluetooth, up to 10 meters away.
7.9.3. To control the device using a computer or laptop running the Windows operating system, you
must install the application «Arinst SSA».Download spectrum analyzer management software . The con-
nection between the device and the PC will be via a USB cable.
7.9.4. When using an external frequency converter, to correctly indicate the frequency of the input sig-
nal, enter the value of the scale shift Freq. shift. as shown in figure 24.
igure 24 Entering the value of the scale shift in frequency
Portable spectrum analyzers Arinst 13.01.2020
www.arinst.net | www.arinst.ru | www.kroks.ru 27
Note. The input values of the shift frequency scale Freq. shift is not possible when the device's track-
ing generator is turned on. Turn off the tracking generator before entering the frequency shift value.
Setting the value of the shift of the input signal frequency Freq. shift, is made by entering a numerical
value in the submenu that opens, as in figure 24. Enter the numerical value of the frequency and press
Enter. To delete erroneous or previously entered values, press Del. To refuse to enter a value, click
Cancel.
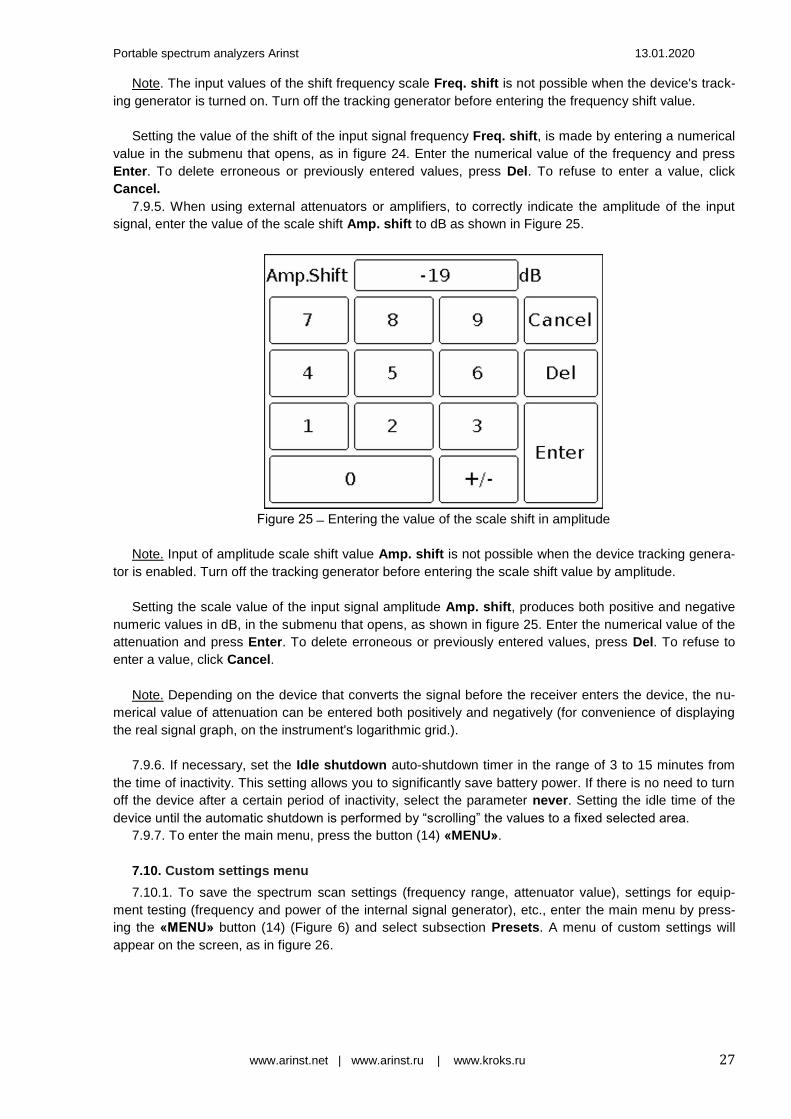
7.9.5. When using external attenuators or amplifiers, to correctly indicate the amplitude of the input
signal, enter the value of the scale shift Amp. shift to dB as shown in Figure 25.
igure 25 Entering the value of the scale shift in amplitude
Note. Input of amplitude scale shift value Amp. shift is not possible when the device tracking genera-
tor is enabled. Turn off the tracking generator before entering the scale shift value by amplitude.
Setting the scale value of the input signal amplitude Amp. shift, produces both positive and negative
numeric values in dB, in the submenu that opens, as shown in figure 25. Enter the numerical value of the
attenuation and press Enter. To delete erroneous or previously entered values, press Del. To refuse to
enter a value, click Cancel.
Note. Depending on the device that converts the signal before the receiver enters the device, the nu-
merical value of attenuation can be entered both positively and negatively (for convenience of displaying
the real signal graph, on the instrument's logarithmic grid.).
7.9.6. If necessary, set the Idle shutdown auto-shutdown timer in the range of 3 to 15 minutes from
the time of inactivity. This setting allows you to significantly save battery power. If there is no need to turn
off the device after a certain period of inactivity, select the parameter never. Setting the idle time of the
device until the automatic shutdown is performed by “scrolling” the values to a fixed selected area.
7.9.7. To enter the main menu, press the button (14) «MENU».
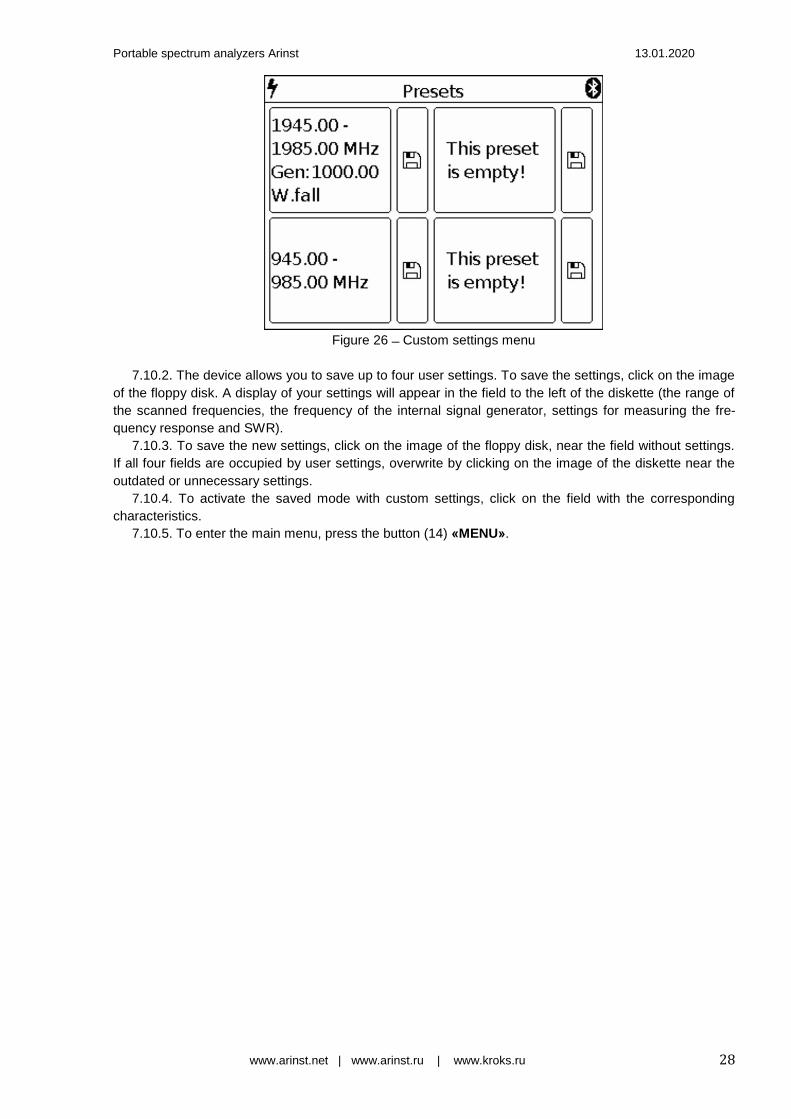
7.10. Custom settings menu 7.10.1. To save the spectrum scan settings (frequency range, attenuator value), settings for equip-
ment testing (frequency and power of the internal signal generator), etc., enter the main menu by press-
ing the «MENU» button (14) (Figure 6) and select subsection Presets. A menu of custom settings will
appear on the screen, as in figure 26.
Portable spectrum analyzers Arinst 13.01.2020
www.arinst.net | www.arinst.ru | www.kroks.ru 28
Figure 26 Custom settings menu
7.10.2. The device allows you to save up to four user settings. To save the settings, click on the image
of the floppy disk. A display of your settings will appear in the field to the left of the diskette (the range of
the scanned frequencies, the frequency of the internal signal generator, settings for measuring the fre-
quency response and SWR).
7.10.3. To save the new settings, click on the image of the floppy disk, near the field without settings.
If all four fields are occupied by user settings, overwrite by clicking on the image of the diskette near the
outdated or unnecessary settings. 7.10.4. To activate the saved mode with custom settings, click on the field with the corresponding
characteristics. 7.10.5. To enter the main menu, press the button (14) «MENU».
Portable spectrum analyzers Arinst 13.01.2020
www.arinst.net | www.arinst.ru | www.kroks.ru 29
8. THE INTERFACE OF THE PROGRAM CONTROL DEVICE, WITH DEVICES
BASED ON THE ANDROID OPERATING SYSTEM
8.1. External device requirements 8.1.1. For reliable and stable connection to the device, devices managed by the Android operating sys-
tem must meet the following requirements: - Android operating system version 4.1 and higher; - installed application «Arinst SSA spectrum analyzer»;
- availability of protocol information exchange Bluetooth 2.1 and above.
8.2. Connecting the device to an external device 8.2.1. Turn on your device, controlled by the Android operating system (tablet / smartphone) and make
sure that it has Bluetooth data transfer enabled. 8.2.2. Start the application "Arinst SA spectrum analyzer" (hereinafter control program) on your tab-
let/smartphone. If this control program is not installed on your tablet/smartphone, you need to download
and install it. Download "Arinst SSA" from Google Play
8.2.3. Turn on the device as indicated in p.6.1. of this «Manual». 8.2.4. Enter the main menu of the device by pressing the «MENU» button (14) (Figure 6) and select
the Device subsection and turn on the data transfer using the Bluetooth protocol by moving the “slider” to
the right, as indicated in section 7.9.2. (Figure 23).
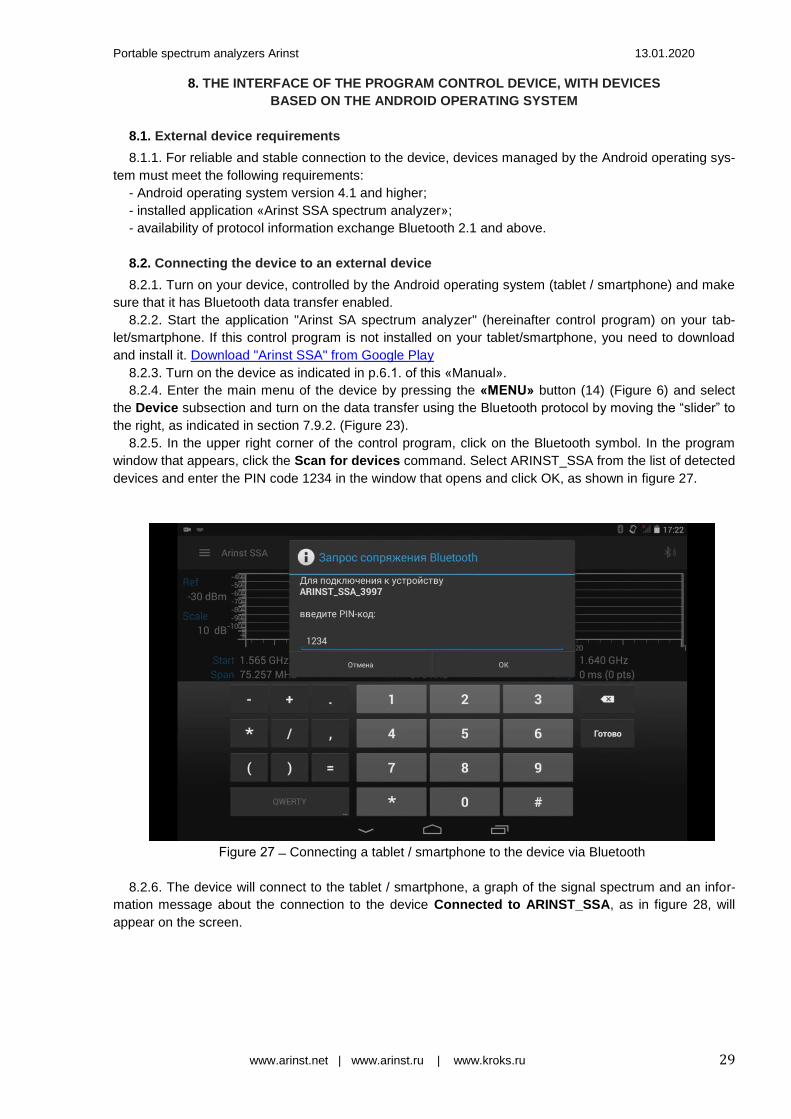
8.2.5. In the upper right corner of the control program, click on the Bluetooth symbol. In the program
window that appears, click the Scan for devices command. Select ARINST_SSA from the list of detected
devices and enter the PIN code 1234 in the window that opens and click OK, as shown in figure 27.
igure 27 Connecting a tablet / smartphone to the device via Bluetooth
8.2.6. The device will connect to the tablet / smartphone, a graph of the signal spectrum and an infor-
mation message about the connection to the device Connected to ARINST_SSA, as in figure 28, will
appear on the screen.
Portable spectrum analyzers Arinst 13.01.2020
www.arinst.net | www.arinst.ru | www.kroks.ru 30
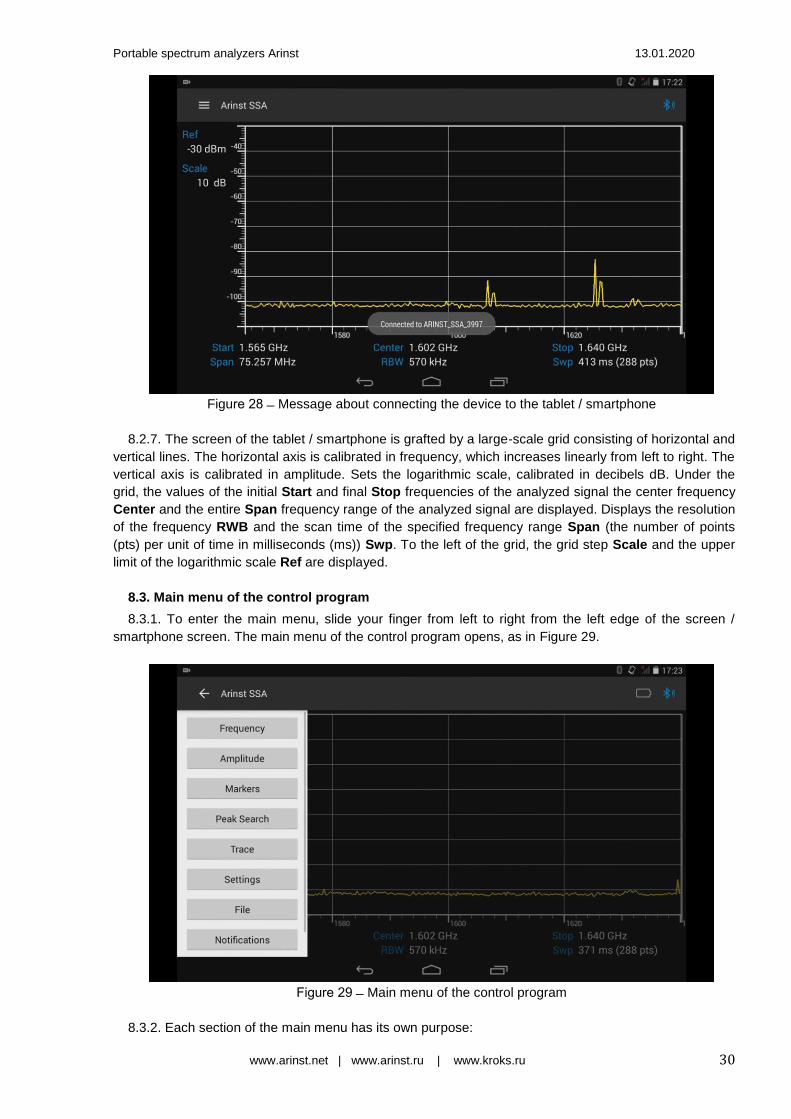
Figure 28 Message about connecting the device to the tablet / smartphone
8.2.7. The screen of the tablet / smartphone is grafted by a large-scale grid consisting of horizontal and
vertical lines. The horizontal axis is calibrated in frequency, which increases linearly from left to right. The
vertical axis is calibrated in amplitude. Sets the logarithmic scale, calibrated in decibels dB. Under the
grid, the values of the initial Start and final Stop frequencies of the analyzed signal the center frequency
Center and the entire Span frequency range of the analyzed signal are displayed. Displays the resolution
of the frequency RWB and the scan time of the specified frequency range Span (the number of points
(pts) per unit of time in milliseconds (ms)) Swp. To the left of the grid, the grid step Scale and the upper
limit of the logarithmic scale Ref are displayed.
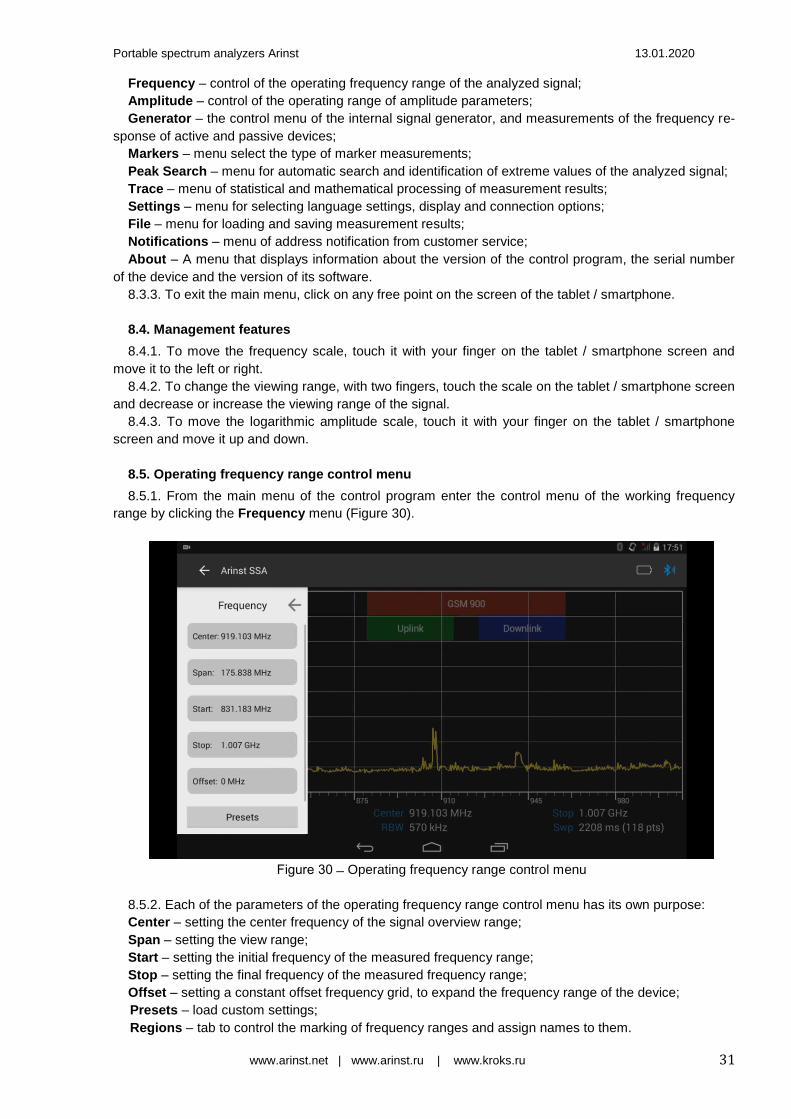
8.3. Main menu of the control program 8.3.1. To enter the main menu, slide your finger from left to right from the left edge of the screen /
smartphone screen. The main menu of the control program opens, as in Figure 29.
igure 29 Main menu of the control program
8.3.2. Each section of the main menu has its own purpose:
Portable spectrum analyzers Arinst 13.01.2020
www.arinst.net | www.arinst.ru | www.kroks.ru 31
Frequency – control of the operating frequency range of the analyzed signal;
Amplitude – control of the operating range of amplitude parameters; Generator – the control menu of the internal signal generator, and measurements of the frequency re-
sponse of active and passive devices;
Markers – menu select the type of marker measurements; Peak Search – menu for automatic search and identification of extreme values of the analyzed signal;
Trace – menu of statistical and mathematical processing of measurement results;
Settings – menu for selecting language settings, display and connection options; File – menu for loading and saving measurement results;
Notifications – menu of address notification from customer service; About – A menu that displays information about the version of the control program, the serial number
of the device and the version of its software.
8.3.3. To exit the main menu, click on any free point on the screen of the tablet / smartphone.
8.4. Management features 8.4.1. To move the frequency scale, touch it with your finger on the tablet / smartphone screen and
move it to the left or right.
8.4.2. To change the viewing range, with two fingers, touch the scale on the tablet / smartphone screen
and decrease or increase the viewing range of the signal. 8.4.3. To move the logarithmic amplitude scale, touch it with your finger on the tablet / smartphone
screen and move it up and down.
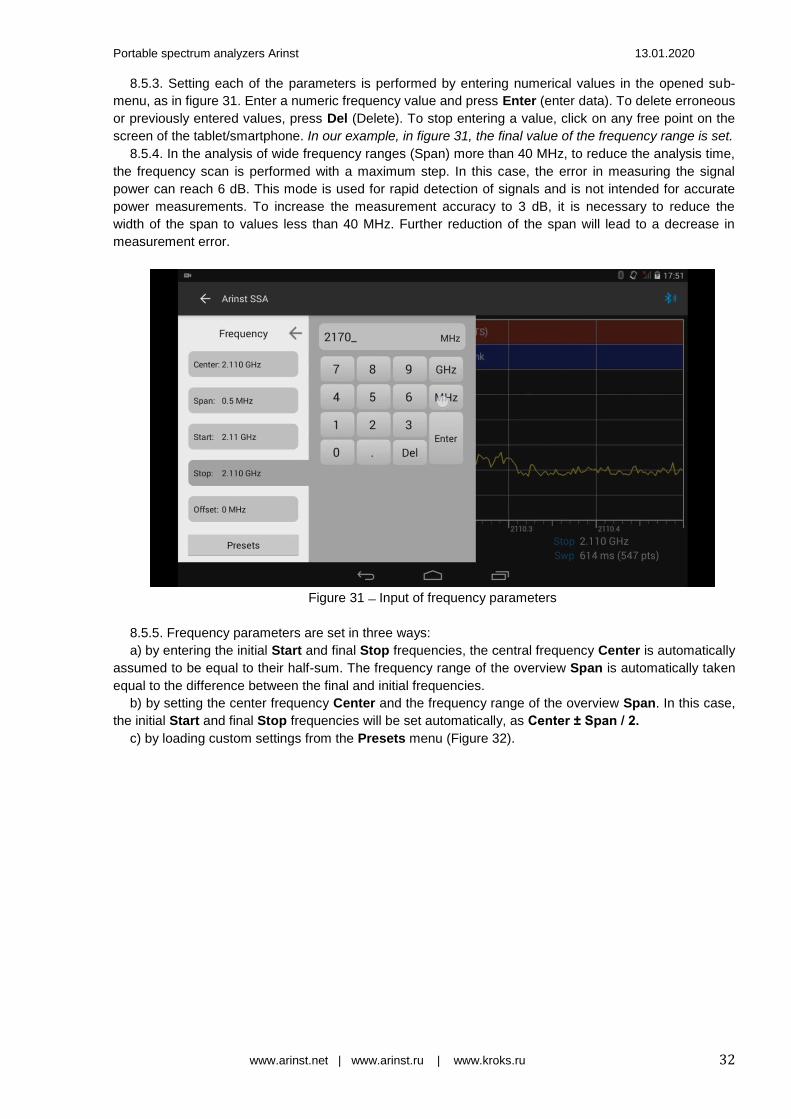
8.5. Operating frequency range control menu 8.5.1. From the main menu of the control program enter the control menu of the working frequency
range by clicking the Frequency menu (Figure 30).
igure 30 Operating frequency range control menu
8.5.2. Each of the parameters of the operating frequency range control menu has its own purpose:
Center – setting the center frequency of the signal overview range; Span – setting the view range; Start – setting the initial frequency of the measured frequency range; Stop – setting the final frequency of the measured frequency range; Offset – setting a constant offset frequency grid, to expand the frequency range of the device;
Presets – load custom settings;
Regions – tab to control the marking of frequency ranges and assign names to them.
Portable spectrum analyzers Arinst 13.01.2020
www.arinst.net | www.arinst.ru | www.kroks.ru 32
8.5.3. Setting each of the parameters is performed by entering numerical values in the opened sub-
menu, as in figure 31. Enter a numeric frequency value and press Enter (enter data). To delete erroneous
or previously entered values, press Del (Delete). To stop entering a value, click on any free point on the
screen of the tablet/smartphone. In our example, in figure 31, the final value of the frequency range is set.
8.5.4. In the analysis of wide frequency ranges (Span) more than 40 MHz, to reduce the analysis time,
the frequency scan is performed with a maximum step. In this case, the error in measuring the signal
power can reach 6 dB. This mode is used for rapid detection of signals and is not intended for accurate
power measurements. To increase the measurement accuracy to 3 dB, it is necessary to reduce the
width of the span to values less than 40 MHz. Further reduction of the span will lead to a decrease in
measurement error.
Figure 31 Input of frequency parameters
8.5.5. Frequency parameters are set in three ways:
a) by entering the initial Start and final Stop frequencies, the сentral frequency Center is automatically
assumed to be equal to their half-sum. The frequency range of the overview Span is automatically taken
equal to the difference between the final and initial frequencies.
b) by setting the center frequency Center and the frequency range of the overview Span. In this case,
the initial Start and final Stop frequencies will be set automatically, as Center ± Span / 2.
c) by loading custom settings from the Presets menu (Figure 32).

Portable spectrum analyzers Arinst 13.01.2020
www.arinst.net | www.arinst.ru | www.kroks.ru 33
igure 32 Loading user settings of frequency parameters
8.5.6. In the Presets tab, select the pre-saved installation and click Load. To refuse to download the
pre-installation, click Cancel. To save the new setting, click Save. To remove all user settings, press Re-
set to default (return to factory settings).
8.5.7. To expand the frequency range of the device, for example when using an external converter, set
the offset frequency grid by entering the Offset menu. Enter the numeric value of the frequency grid con-
stant offset, as shown in figure 33.
igure 33 Entering the numerical value of the frequency grid constant offset
8.5.8. The frequency value is set by entering a numeric value in the opened submenu, as in figure 33.
Enter a numeric value, units, and press Enter. To delete erroneous or previously entered values, press
Del. To refuse to enter the value, click on any free point on the screen of the tablet / smartphone.
8.5.9. To control the marking of frequency bands, go to the Regions tab of the menu to manage the
frequency range Frequency, "scrolling" the menu up.

Portable spectrum analyzers Arinst 13.01.2020
www.arinst.net | www.arinst.ru | www.kroks.ru 34
Figure 34 Regions menu
8.5.10. In this menu you can set:
Show regions – control of displaying of markings of the ranges and their names; Region presets – custom installation of the markings of the frequency bands; Add region – adding frequency range markings; Remove all regions – remove all markings. 8.5.11 Figure 35 shows an example of displaying the name, color marking, and the set frequency
range. To change the name, color marking or frequency range, click Edit, to cancel, click Cancel.
igure 35 Example of displaying and editing the set frequency range
8.6. Amplitude parameters control menu 8.6.1. From the main menu of the control program, enter the amplitude parameters control menu Am-
plitude (Figure 36).
Portable spectrum analyzers Arinst 13.01.2020
www.arinst.net | www.arinst.ru | www.kroks.ru 35
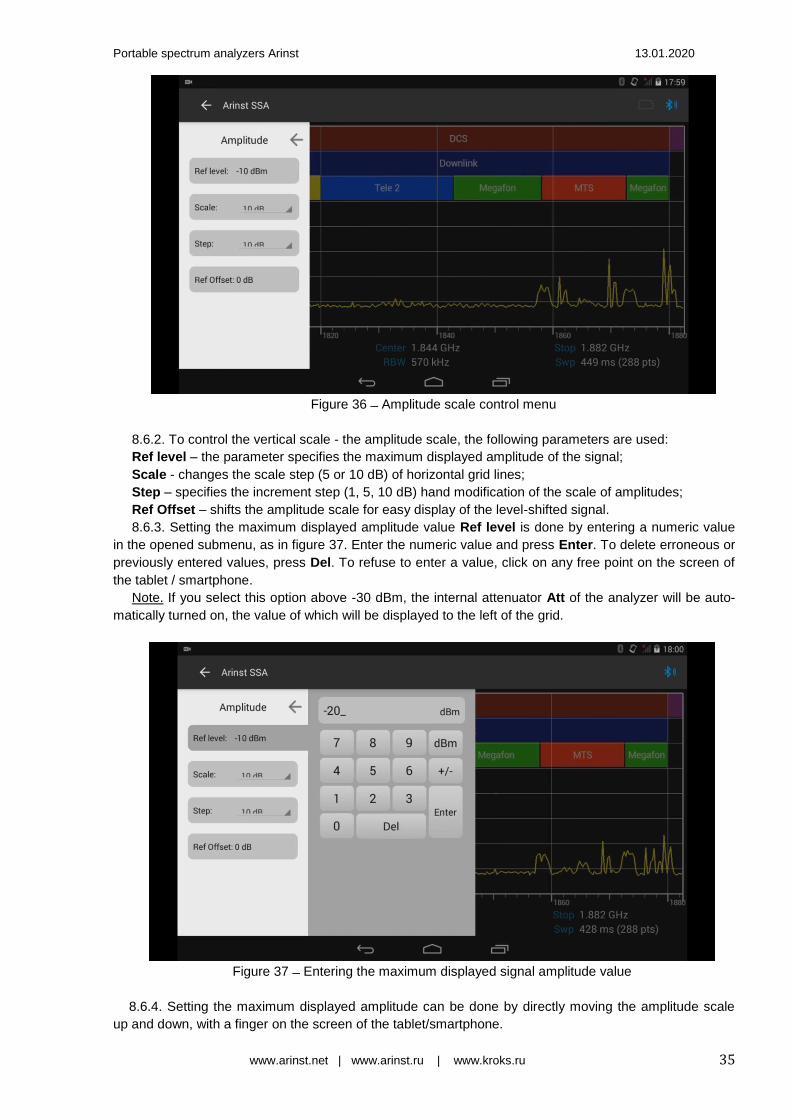
Figure 36 Amplitude scale control menu
8.6.2. To control the vertical scale - the amplitude scale, the following parameters are used:
Ref level – the parameter specifies the maximum displayed amplitude of the signal;
Scale - changes the scale step (5 or 10 dB) of horizontal grid lines;
Step – specifies the increment step (1, 5, 10 dB) hand modification of the scale of amplitudes; Ref Offset – shifts the amplitude scale for easy display of the level-shifted signal. 8.6.3. Setting the maximum displayed amplitude value Ref level is done by entering a numeric value
in the opened submenu, as in figure 37. Enter the numeric value and press Enter. To delete erroneous or
previously entered values, press Del. To refuse to enter a value, click on any free point on the screen of
the tablet / smartphone.
Note. If you select this option above -30 dBm, the internal attenuator Att of the analyzer will be auto-
matically turned on, the value of which will be displayed to the left of the grid.
Figure 37 Entering the maximum displayed signal amplitude value
8.6.4. Setting the maximum displayed amplitude can be done by directly moving the amplitude scale
up and down, with a finger on the screen of the tablet/smartphone.

Portable spectrum analyzers Arinst 13.01.2020
www.arinst.net | www.arinst.ru | www.kroks.ru 36
8.6.5. When using an external attenuator or amplifier, there is a need to shift the amplitude scale for
ease of display, shifted by the signal level. Enter the Ref Offset menu and enter the numerical value of
the amplitude scale offset, as shown in figure 38. Enter the numeric value and press Enter. To delete er-
roneous or previously entered values, press Del. To refuse to enter a value, click on any free point on the
screen of the tablet / smartphone.
igure 38 Entering the amplitude scale offset value
8.7. Working in marker measurements menu 8.7.1. From the main menu of the control program, enter the menu for selecting the marker measure-
ments type Markers (figure 39).
igure 39 Menu for selection of marker measurements type
Portable spectrum analyzers Arinst 13.01.2020
www.arinst.net | www.arinst.ru | www.kroks.ru 37
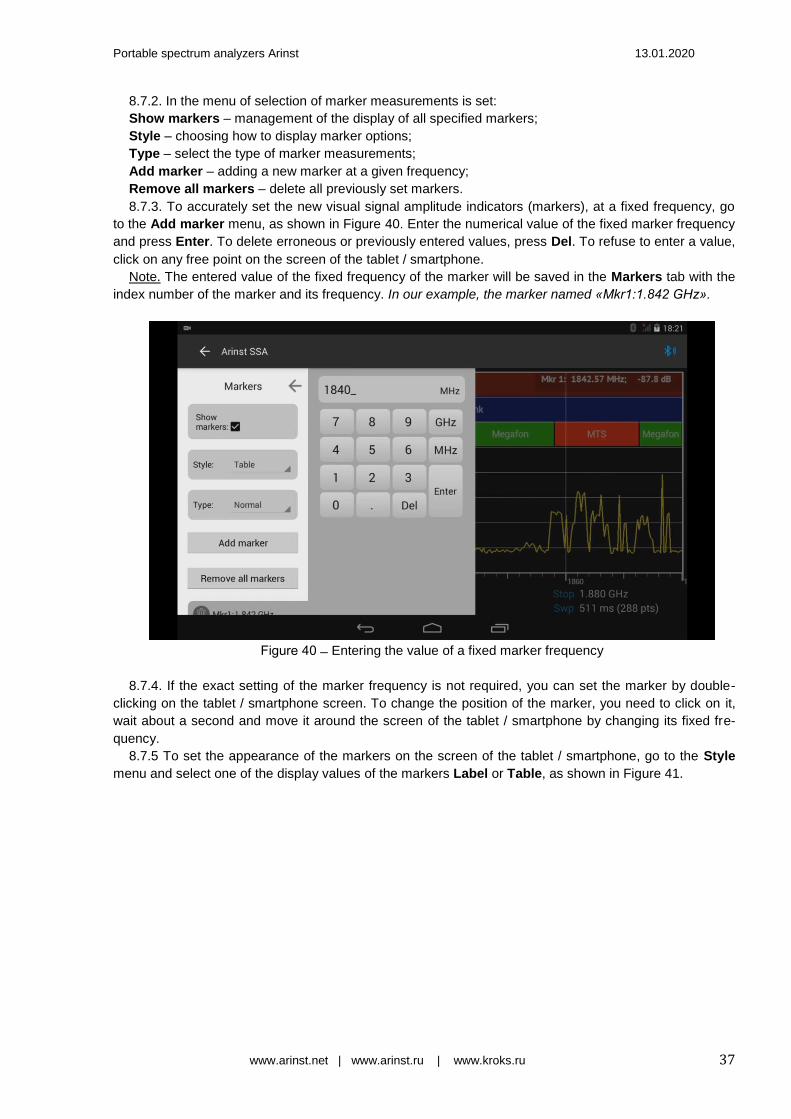
8.7.2. In the menu of selection of marker measurements is set: Show markers – management of the display of all specified markers; Style – choosing how to display marker options; Type – select the type of marker measurements; Add marker – adding a new marker at a given frequency; Remove all markers – delete all previously set markers.
8.7.3. To accurately set the new visual signal amplitude indicators (markers), at a fixed frequency, go
to the Add marker menu, as shown in Figure 40. Enter the numerical value of the fixed marker frequency
and press Enter. To delete erroneous or previously entered values, press Del. To refuse to enter a value,
click on any free point on the screen of the tablet / smartphone.
Note. The entered value of the fixed frequency of the marker will be saved in the Markers tab with the
index number of the marker and its frequency. In our example, the marker named «Mkr1:1.842 GHz».
igure 40 Entering the value of a fixed marker frequency
8.7.4. If the exact setting of the marker frequency is not required, you can set the marker by double-
clicking on the tablet / smartphone screen. To change the position of the marker, you need to click on it,
wait about a second and move it around the screen of the tablet / smartphone by changing its fixed fre-
quency.
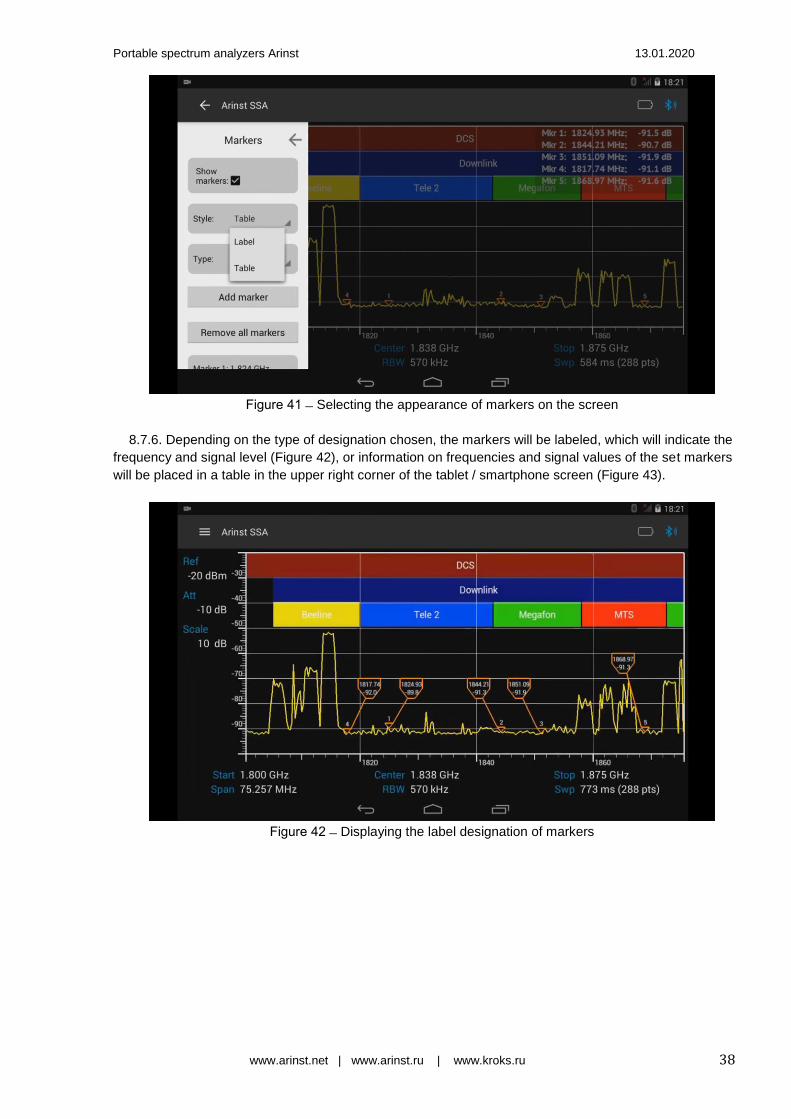
8.7.5 To set the appearance of the markers on the screen of the tablet / smartphone, go to the Style
menu and select one of the display values of the markers Label or Table, as shown in Figure 41.
Portable spectrum analyzers Arinst 13.01.2020
www.arinst.net | www.arinst.ru | www.kroks.ru 38
igure 41 Selecting the appearance of markers on the screen
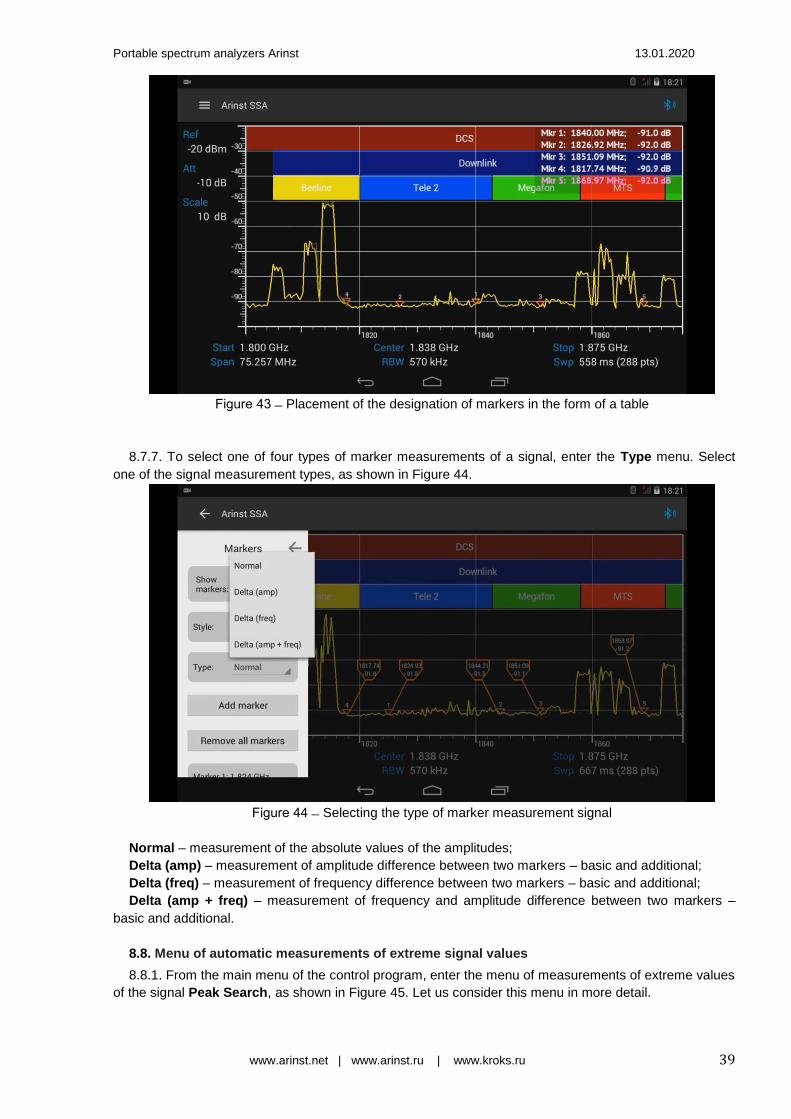
8.7.6. Depending on the type of designation chosen, the markers will be labeled, which will indicate the
frequency and signal level (Figure 42), or information on frequencies and signal values of the set markers
will be placed in a table in the upper right corner of the tablet / smartphone screen (Figure 43).
igure 42 Displaying the label designation of markers
Portable spectrum analyzers Arinst 13.01.2020
www.arinst.net | www.arinst.ru | www.kroks.ru 39
igure 43 Placement of the designation of markers in the form of a table
8.7.7. To select one of four types of marker measurements of a signal, enter the Type menu. Select
one of the signal measurement types, as shown in Figure 44.
igure 44 Selecting the type of marker measurement signal
Normal – measurement of the absolute values of the amplitudes;
Delta (amp) – measurement of amplitude difference between two markers – basic and additional; Delta (freq) – measurement of frequency difference between two markers – basic and additional; Delta (amp + freq) – measurement of frequency and amplitude difference between two markers –
basic and additional.
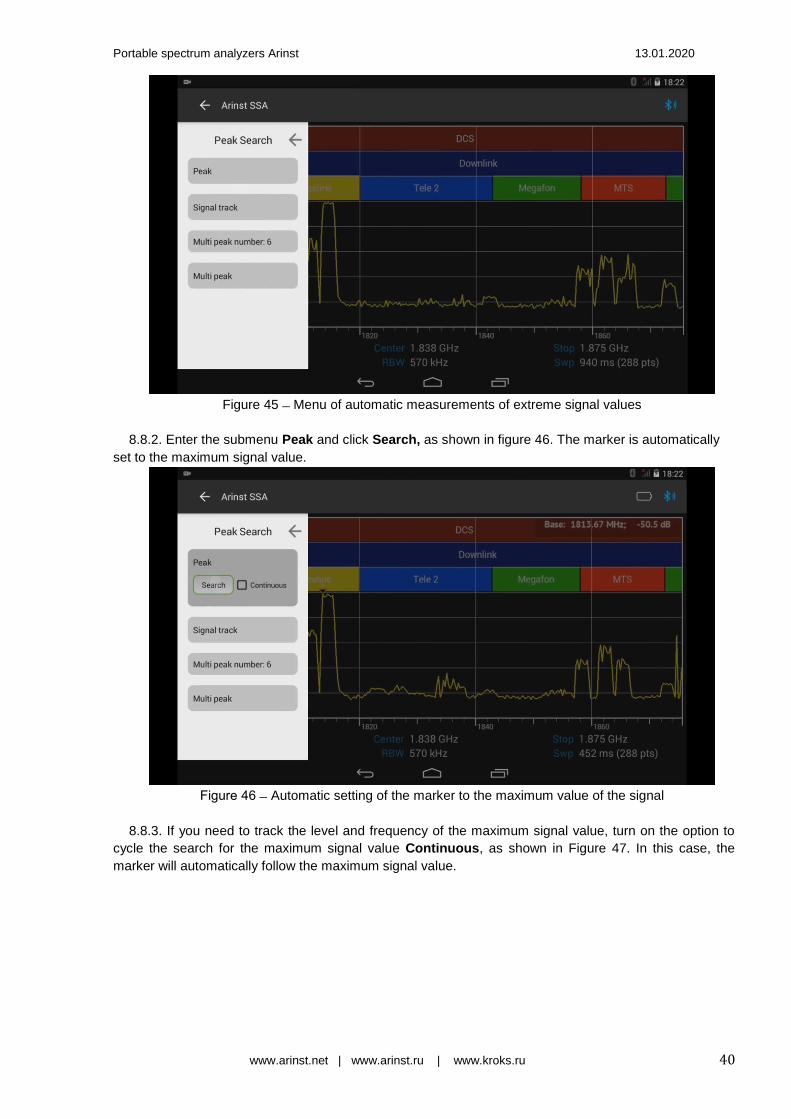
8.8. Menu of automatic measurements of extreme signal values 8.8.1. From the main menu of the control program, enter the menu of measurements of extreme values
of the signal Peak Search, as shown in Figure 45. Let us consider this menu in more detail.
Portable spectrum analyzers Arinst 13.01.2020
www.arinst.net | www.arinst.ru | www.kroks.ru 40
Figure 45 Menu of automatic measurements of extreme signal values
8.8.2. Enter the submenu Peak and click Search, as shown in figure 46. The marker is automatically
set to the maximum signal value.
igure 46 Automatic setting of the marker to the maximum value of the signal
8.8.3. If you need to track the level and frequency of the maximum signal value, turn on the option to
cycle the search for the maximum signal value Continuous, as shown in Figure 47. In this case, the
marker will automatically follow the maximum signal value.

Portable spectrum analyzers Arinst 13.01.2020
www.arinst.net | www.arinst.ru | www.kroks.ru 41
igure 47 Automatic tracking of the maximum signal value
8.8.4. To automatically set the maximum signal level marker in the center of the tablet / smartphone
screen, enter the Signal track submenu and click the Track command, as shown in Figure 48. The max-
imum signal level marker will automatically be installed in the center of the tablet / smartphone screen.
igure 48 Automatic installation of the maximum signal marker in the center of the screen
8.8.5. If you need to monitor a signal with a changing frequency, enable the Auto option as shown in
figure 49. In this case, the maximum signal level marker will be placed automatically in the center of the
tablet / smartphone screen.
Portable spectrum analyzers Arinst 13.01.2020
www.arinst.net | www.arinst.ru | www.kroks.ru 42
igure 49 Tracking signal with varying frequency
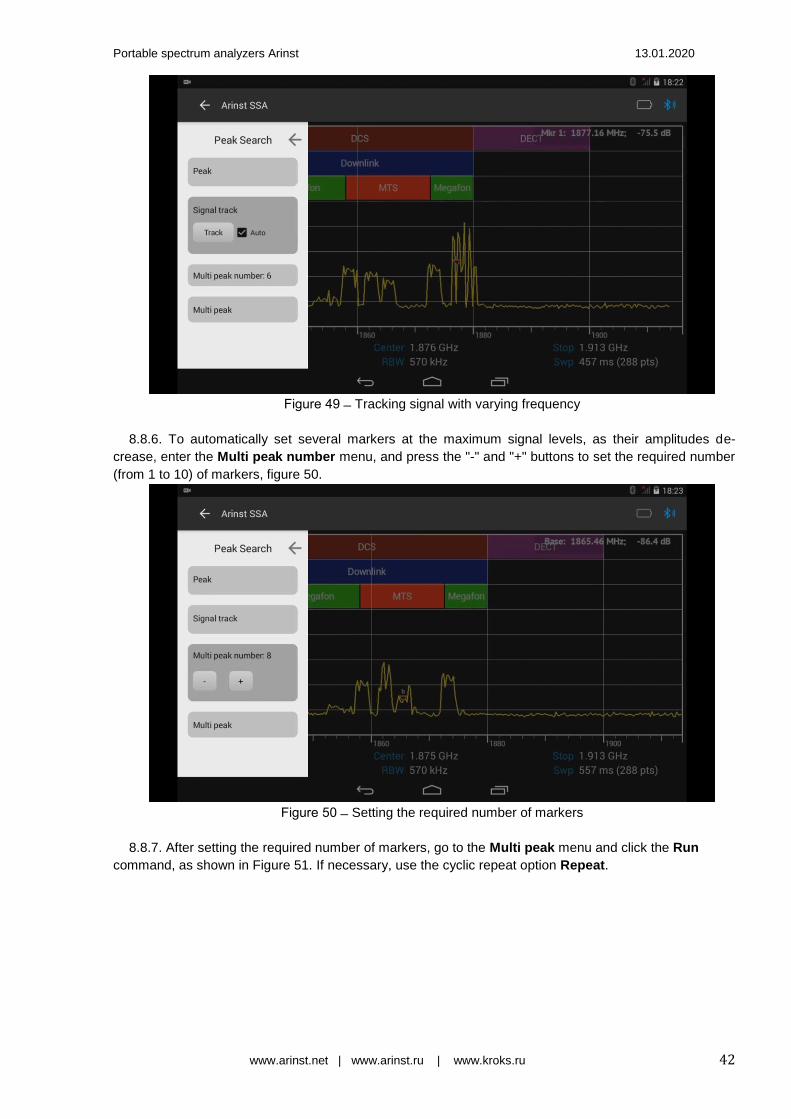
8.8.6. To automatically set several markers at the maximum signal levels, as their amplitudes de-
crease, enter the Multi peak number menu, and press the "-" and "+" buttons to set the required number
(from 1 to 10) of markers, figure 50.
igure 50 Setting the required number of markers
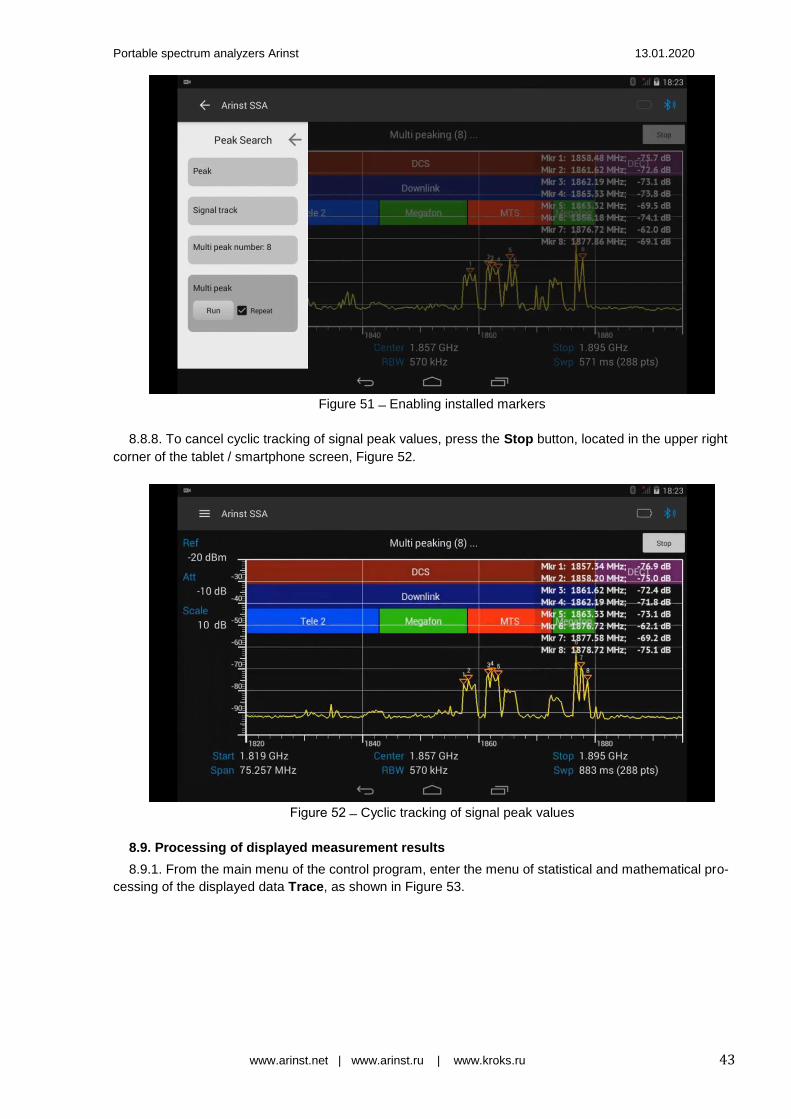
8.8.7. After setting the required number of markers, go to the Multi peak menu and click the Run
command, as shown in Figure 51. If necessary, use the cyclic repeat option Repeat.
Portable spectrum analyzers Arinst 13.01.2020
www.arinst.net | www.arinst.ru | www.kroks.ru 43
Figure 51 Enabling installed markers
8.8.8. To cancel cyclic tracking of signal peak values, press the Stop button, located in the upper right
corner of the tablet / smartphone screen, Figure 52.
igure 52 Cyclic tracking of signal peak values
8.9. Processing of displayed measurement results 8.9.1. From the main menu of the control program, enter the menu of statistical and mathematical pro-
cessing of the displayed data Trace, as shown in Figure 53.

Portable spectrum analyzers Arinst 13.01.2020
www.arinst.net | www.arinst.ru | www.kroks.ru 44
igure 53 Menu for processing the displayed measurement results
8.9.2. Trace mode displays the results of mathematical processing of measurements. Mathematical
processing of a specified number of measurements allows you to get more information about the ana-
lyzed signal.
8.9.3. To stop cyclic spectrum scanning, press the Freeze scan button. Scanning of the signal spec-
trum will be paused (frozen), figure 54. Pressing the Scan button updates the spectrum graph, the Un-
freeze button starts the paused scan.
Figure 54 Spectrum scanning suspended
8.9.4. First, you need to select the type of measurement accumulation, as in Figure 55 Normal – single data accumulation mode according to the specified number of scans;
Sliding – sliding data accumulation mode.

Portable spectrum analyzers Arinst 13.01.2020
www.arinst.net | www.arinst.ru | www.kroks.ru 45
Figure 55 – Select the type of accumulation of data for measurement
8.9.5. To average the results of measurements, enter the Average menu, as shown in figure 55 and
use the "-" and "+" buttons to set the required number of measurements in the range from 4 to 128.
Figure 56 Setting the number of measurements
8.9.6. To restart the scan, press the Restart button, to stop the scan, press the Stop button, in the up-
per right corner of the tablet/smartphone screen, figure 57.
Portable spectrum analyzers Arinst 13.01.2020
www.arinst.net | www.arinst.ru | www.kroks.ru 46
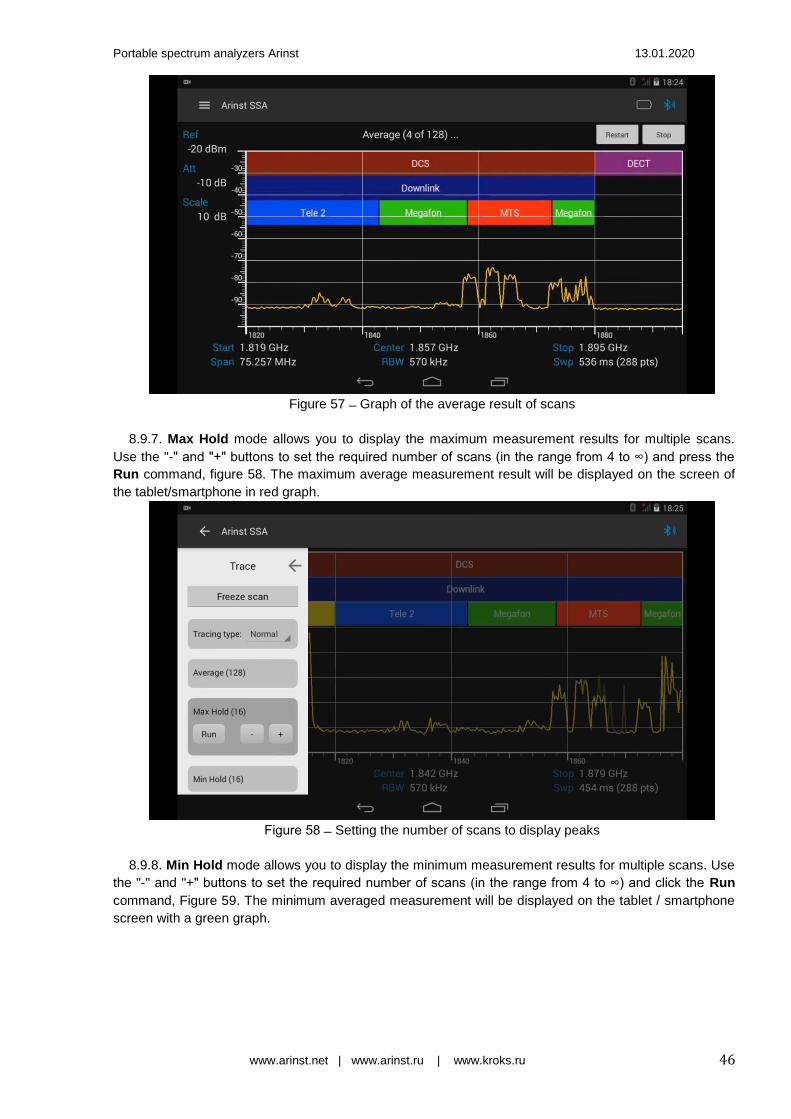
Figure 57 Graph of the average result of scans
8.9.7. Max Hold mode allows you to display the maximum measurement results for multiple scans.
Use the "-" and "+" buttons to set the required number of scans (in the range from 4 to ∞) and press the
Run command, figure 58. The maximum average measurement result will be displayed on the screen of
the tablet/smartphone in red graph.
igure 58 Setting the number of scans to display peaks
8.9.8. Min Hold mode allows you to display the minimum measurement results for multiple scans. Use
the "-" and "+" buttons to set the required number of scans (in the range from 4 to ∞) and click the Run
command, Figure 59. The minimum averaged measurement will be displayed on the tablet / smartphone
screen with a green graph.

Portable spectrum analyzers Arinst 13.01.2020
www.arinst.net | www.arinst.ru | www.kroks.ru 47
igure 59 Setting the number of scans for displaying minimum
8.9.9. To display the maximum and minimum results of multiple scans, enter the Spreading menu as
shown in figure 60. Use the "-" and "+" buttons to set the required number of scans (in the range from 4 to
∞) and press the Run button.
igure 60 Setting the number of scans to display maximums and minimums
8.9.10. Figure 61 shows the operation in the display mode of the maximum and minimum measure-
ment result. The red graph shows the maximum averaged measurement result. The minimum averaged
measurement result is displayed in green graph. To restart the scan, click the Restart button, to stop the
scan, click the Stop button in the upper right corner of the tablet / smartphone screen.
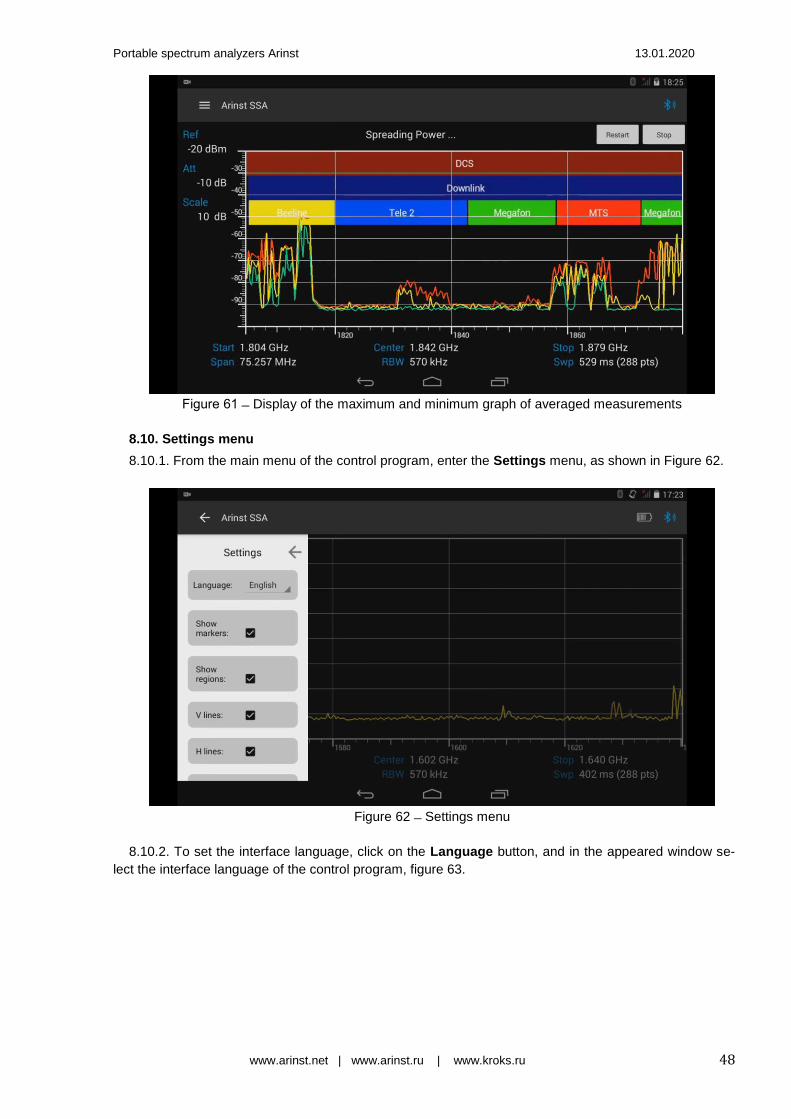
Portable spectrum analyzers Arinst 13.01.2020
www.arinst.net | www.arinst.ru | www.kroks.ru 48
igure 61 Display of the maximum and minimum graph of averaged measurements
8.10. Settings menu 8.10.1. From the main menu of the control program, enter the Settings menu, as shown in Figure 62.
Figure 62 Settings menu
8.10.2. To set the interface language, click on the Language button, and in the appeared window se-
lect the interface language of the control program, figure 63.
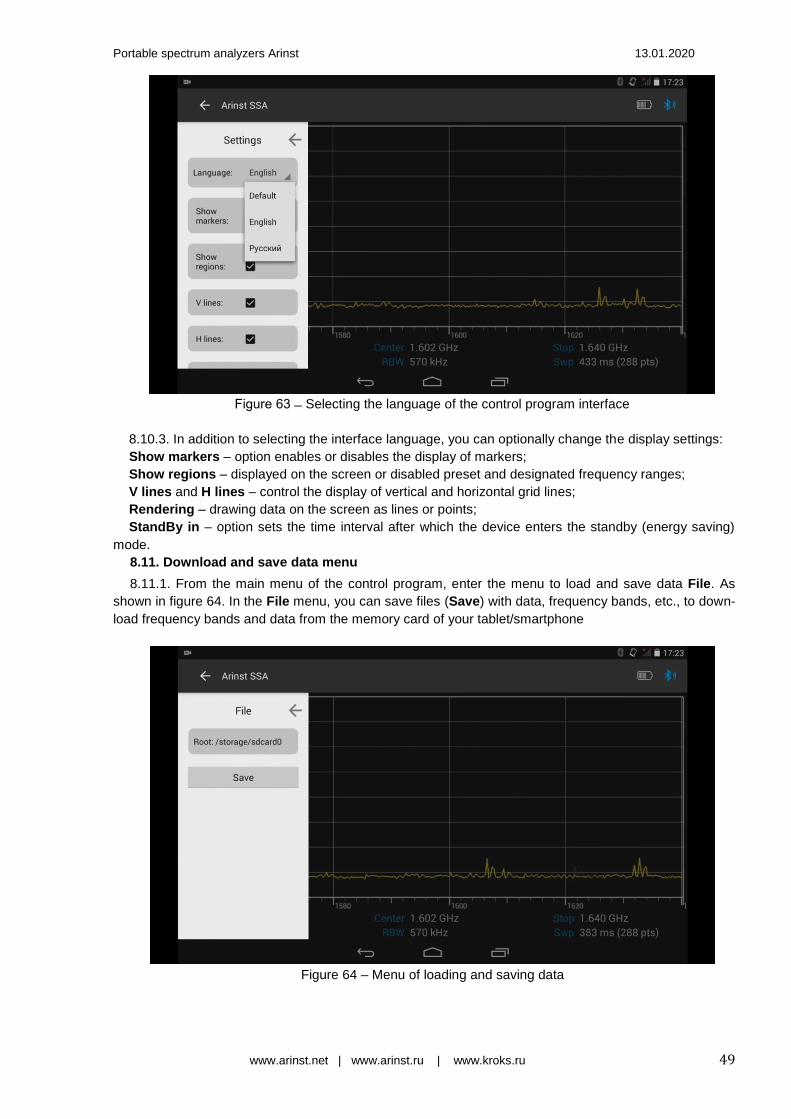
Portable spectrum analyzers Arinst 13.01.2020
www.arinst.net | www.arinst.ru | www.kroks.ru 49
igure 63 Selecting the language of the control program interface
8.10.3. In addition to selecting the interface language, you can optionally change the display settings:
Show markers – option enables or disables the display of markers;
Show regions – displayed on the screen or disabled preset and designated frequency ranges;
V lines and H lines – control the display of vertical and horizontal grid lines; Rendering – drawing data on the screen as lines or points; StandBy in – option sets the time interval after which the device enters the standby (energy saving)
mode.
8.11. Download and save data menu 8.11.1. From the main menu of the control program, enter the menu to load and save data File. As
shown in figure 64. In the File menu, you can save files (Save) with data, frequency bands, etc., to down-
load frequency bands and data from the memory card of your tablet/smartphone
Figure 64 – Menu of loading and saving data

Portable spectrum analyzers Arinst 13.01.2020
www.arinst.net | www.arinst.ru | www.kroks.ru 50
8.12. Notification menu 8.12.1. From the main menu of the control program, enter the menu of address notifications from the
Notifications support service, as shown in figure 65. To update the software version of the device, click
the Refresh button.
Figure 65 Notification menu
8.13. Information about the control program
8.13.1. From the main menu of the control program, enter the About menu, which contains information
about the software version, software version of the device and the device number, figure 66. To check the
availability of a new software version of the device, click the Check for update button. If a new version of
the instrument software is released, it will be possible to update the instrument software.
Figure 66 Information about the control program and the device

Portable spectrum analyzers Arinst 13.01.2020
www.arinst.net | www.arinst.ru | www.kroks.ru 51
8.13.2. Timely software updates ensure that you are using the most current version of the software
with bugs fixed and new features added.
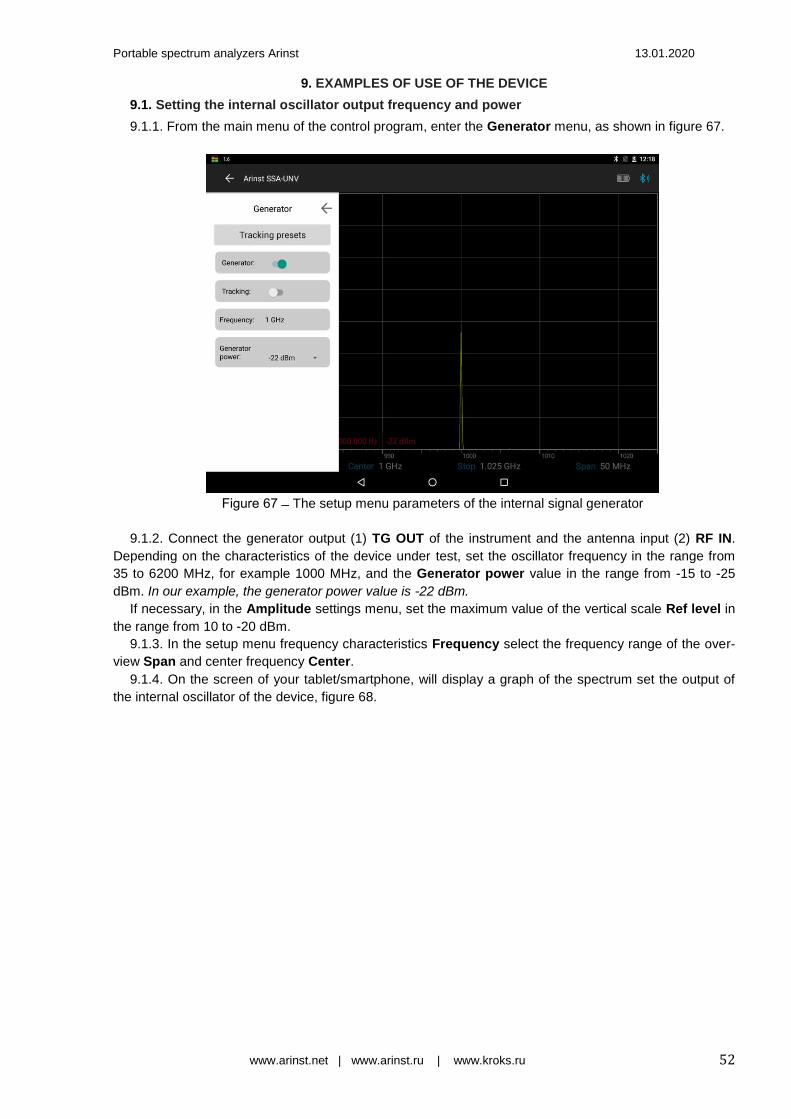
Portable spectrum analyzers Arinst 13.01.2020
www.arinst.net | www.arinst.ru | www.kroks.ru 52
9. EXAMPLES OF USE OF THE DEVICE 9.1. Setting the internal oscillator output frequency and power 9.1.1. From the main menu of the control program, enter the Generator menu, as shown in figure 67.
igure 67 The setup menu parameters of the internal signal generator
9.1.2. Connect the generator output (1) TG OUT of the instrument and the antenna input (2) RF IN.
Depending on the characteristics of the device under test, set the oscillator frequency in the range from
35 to 6200 MHz, for example 1000 MHz, and the Generator power value in the range from -15 to -25
dBm. In our example, the generator power value is -22 dBm.
If necessary, in the Amplitude settings menu, set the maximum value of the vertical scale Ref level in
the range from 10 to -20 dBm.
9.1.3. In the setup menu frequency characteristics Frequency select the frequency range of the over-
view Span and center frequency Center. 9.1.4. On the screen of your tablet/smartphone, will display a graph of the spectrum set the output of
the internal oscillator of the device, figure 68.
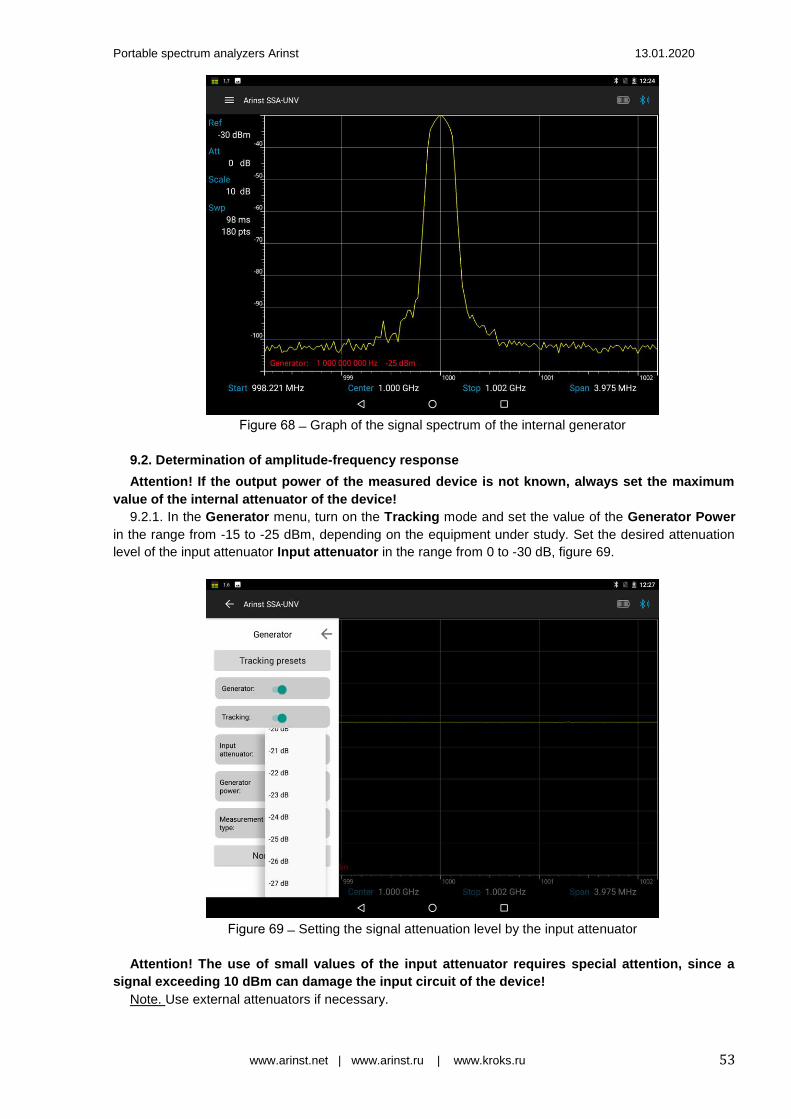
Portable spectrum analyzers Arinst 13.01.2020
www.arinst.net | www.arinst.ru | www.kroks.ru 53
igure 68 Graph of the signal spectrum of the internal generator
9.2. Determination of amplitude-frequency response
Attention! If the output power of the measured device is not known, always set the maximum
value of the internal attenuator of the device!
9.2.1. In the Generator menu, turn on the Tracking mode and set the value of the Generator Power
in the range from -15 to -25 dBm, depending on the equipment under study. Set the desired attenuation
level of the input attenuator Input attenuator in the range from 0 to -30 dB, figure 69.
igure 69 Setting the signal attenuation level by the input attenuator
Attention! The use of small values of the input attenuator requires special attention, since a
signal exceeding 10 dBm can damage the input circuit of the device!
Note. Use external attenuators if necessary.

Portable spectrum analyzers Arinst 13.01.2020
www.arinst.net | www.arinst.ru | www.kroks.ru 54
9.2.2. In the frequency characteristic setup menu Frequency, set the frequency range of the Span and
Center frequency.
Note. When determining the frequency response of active and passive devices, it is recommended to
use cables with a high screening coefficient. This will ensure minimization of the parasitic transmission of
electromagnetic energy from one port of the device to another port.
9.2.3. To determine the frequency response of the equipment under test, select S21 mode from the
Measurement type selection menu. Connect the generator output (1) TG OUT of the instrument and the
antenna input (2) RF IN and normalize, figure 70.
Note. Normalization is necessary to eliminate the influence of connecting wires and connectors of the
circuit under study on the results of measuring the frequency response of the equipment under test. To
cancel normalization, click Reset normalize.
Figure 70 Elimination of the influence of connecting wires and connectors of the test circuit
9.2.4. The S21 mode will be displayed on the screen below the grid in the information label.
Note. After normalization, the setting of the frequency range of the signal under study becomes una-
vailable. Set the frequency range of the signal under study before normalization.
9.2.5. Without turning off the device, turn on the equipment under test in the circuit. The instrument will
display a graph of the amplitude-frequency characteristics of the equipment under study in a given fre-
quency range, figure 71.
Measurement of the frequency response of active devices with known power characteristics
To measure the frequency response of active devices, such as antenna amplifiers, with known power
characteristics, it is necessary to set the signal power of the generator and the level of signal attenuation
by the input attenuator so that the signal level from the internal oscillator of the device before the normali-
zation operation was at the level of -50 -60 dBm.
Note. A lower signal level will lead to increased noise and non-linearity of the measured signal.
After installation, perform a normalization and determine the frequency response of the active device.
Measurement of the frequency response of active devices with unknown power characteristics.
Set the minimum output power of the internal generator and the maximum attenuation value of the in-
put attenuator of the instrument receiver. If necessary, add an additional external attenuator, perform the
normalization operation and connect the test device to the circuit. If necessary, reduce the attenuation
value of the attenuator.
Note. If you change the external attenuator, perform the normalization operation again.
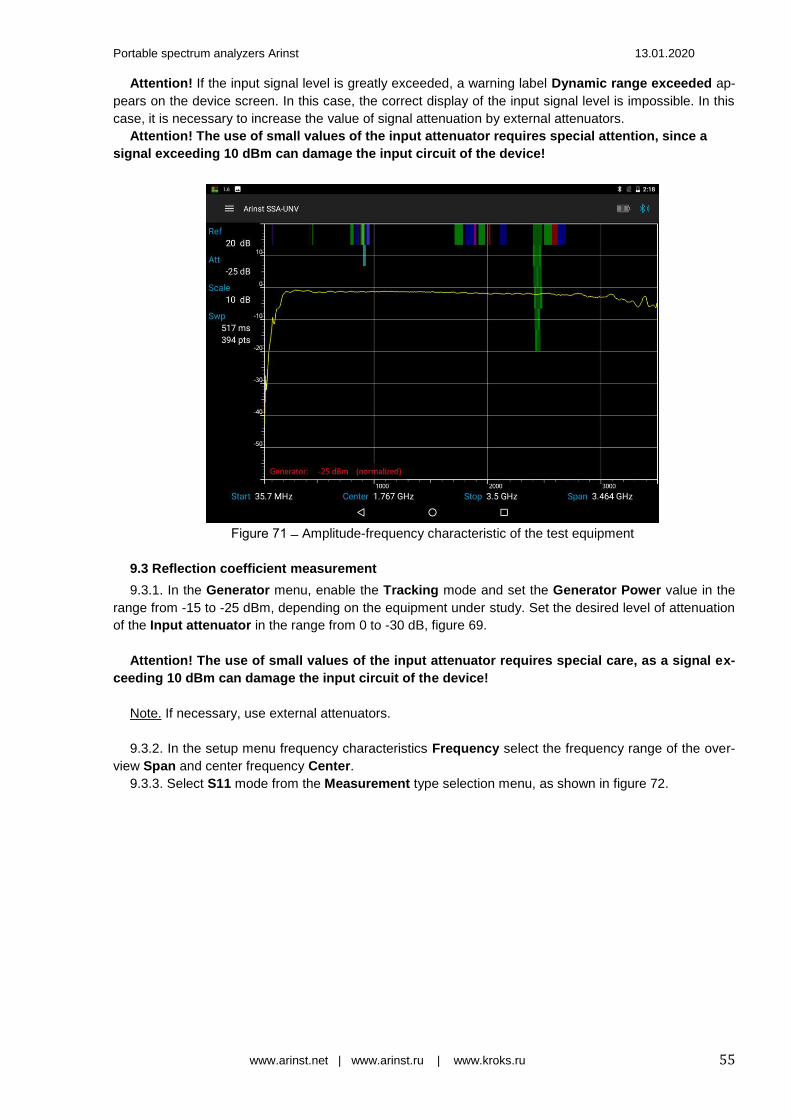
Portable spectrum analyzers Arinst 13.01.2020
www.arinst.net | www.arinst.ru | www.kroks.ru 55
Attention! If the input signal level is greatly exceeded, a warning label Dynamic range exceeded ap-
pears on the device screen. In this case, the correct display of the input signal level is impossible. In this
case, it is necessary to increase the value of signal attenuation by external attenuators.
Attention! The use of small values of the input attenuator requires special attention, since a
signal exceeding 10 dBm can damage the input circuit of the device!
igure 71 Amplitude-frequency characteristic of the test equipment
9.3 Reflection coefficient measurement 9.3.1. In the Generator menu, enable the Tracking mode and set the Generator Power value in the
range from -15 to -25 dBm, depending on the equipment under study. Set the desired level of attenuation
of the Input attenuator in the range from 0 to -30 dB, figure 69.
Attention! The use of small values of the input attenuator requires special care, as a signal ex-
ceeding 10 dBm can damage the input circuit of the device!
Note. If necessary, use external attenuators.
9.3.2. In the setup menu frequency characteristics Frequency select the frequency range of the over-
view Span and center frequency Center. 9.3.3. Select S11 mode from the Measurement type selection menu, as shown in figure 72.
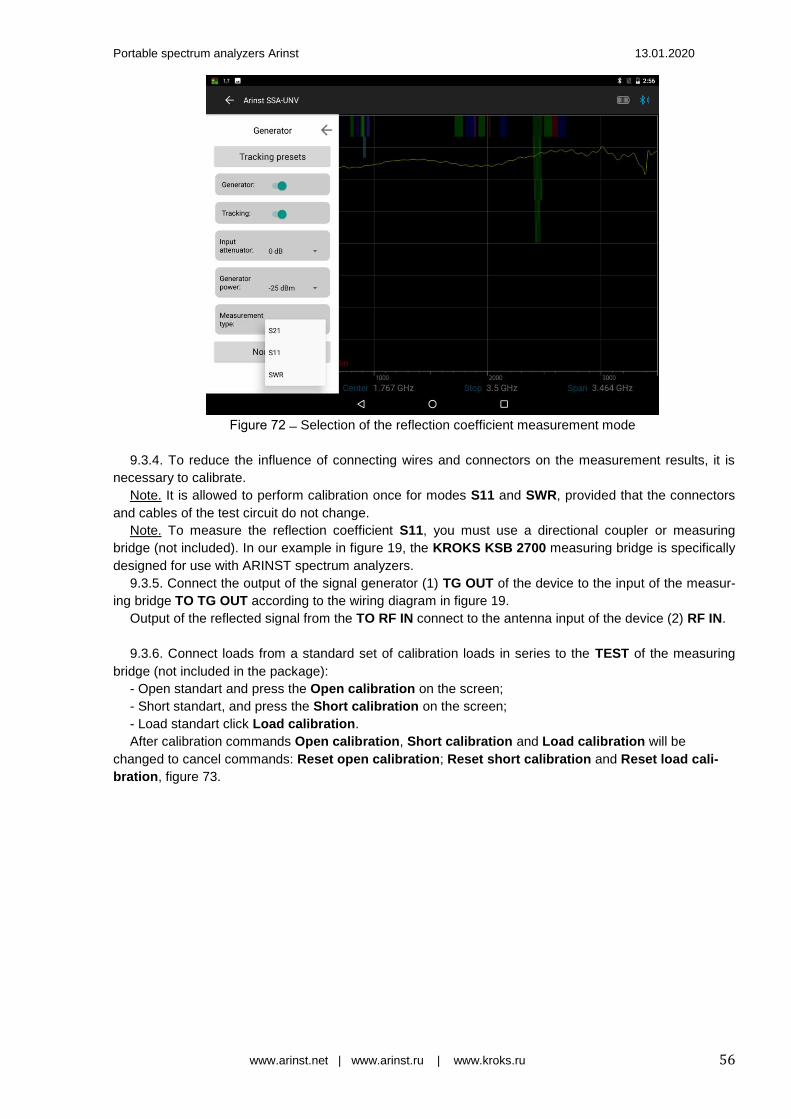
Portable spectrum analyzers Arinst 13.01.2020
www.arinst.net | www.arinst.ru | www.kroks.ru 56
igure 72 Selection of the reflection coefficient measurement mode
9.3.4. To reduce the influence of connecting wires and connectors on the measurement results, it is
necessary to calibrate. Note. It is allowed to perform calibration once for modes S11 and SWR, provided that the connectors
and cables of the test circuit do not change. Note. To measure the reflection coefficient S11, you must use a directional coupler or measuring
bridge (not included). In our example in figure 19, the KROKS KSB 2700 measuring bridge is specifically
designed for use with ARINST spectrum analyzers.
9.3.5. Connect the output of the signal generator (1) TG OUT of the device to the input of the measur-
ing bridge TO TG OUT according to the wiring diagram in figure 19. Output of the reflected signal from the TO RF IN connect to the antenna input of the device (2) RF IN.
9.3.6. Connect loads from a standard set of calibration loads in series to the TEST of the measuring
bridge (not included in the package):
- Open standart and press the Open calibration on the screen; - Short standart, and press the Short calibration on the screen; - Load standart click Load calibration. After calibration commands Open calibration, Short calibration and Load calibration will be
changed to cancel commands: Reset open calibration; Reset short calibration and Reset load cali-
bration, figure 73.

Portable spectrum analyzers Arinst 13.01.2020
www.arinst.net | www.arinst.ru | www.kroks.ru 57
Figure 73 Calibration in mode S11
Connect the test equipment (DUT) to the TEST port of the measuring bridge and measure the reflec-
tion coefficient.
Note. The reflection coefficient S11 will be displayed in a logarithmic grid with vertical axis in dB. The
horizontal axis displays the specified frequency range of the signal, figure 74.
igure 74 Graph of the reflection coefficient in a given frequency range
9.4. Measurement of standing wave ratio (SWR) 9.4.1. In the Generator menu, turn on the Tracking mode and set the value of the Generator Power
in the range from -15 to -25 dBm, depending on the equipment under study. Set the desired attenuation
value of the input attenuator Input attenuator in the range from 0 to -30 dB, figure 69.
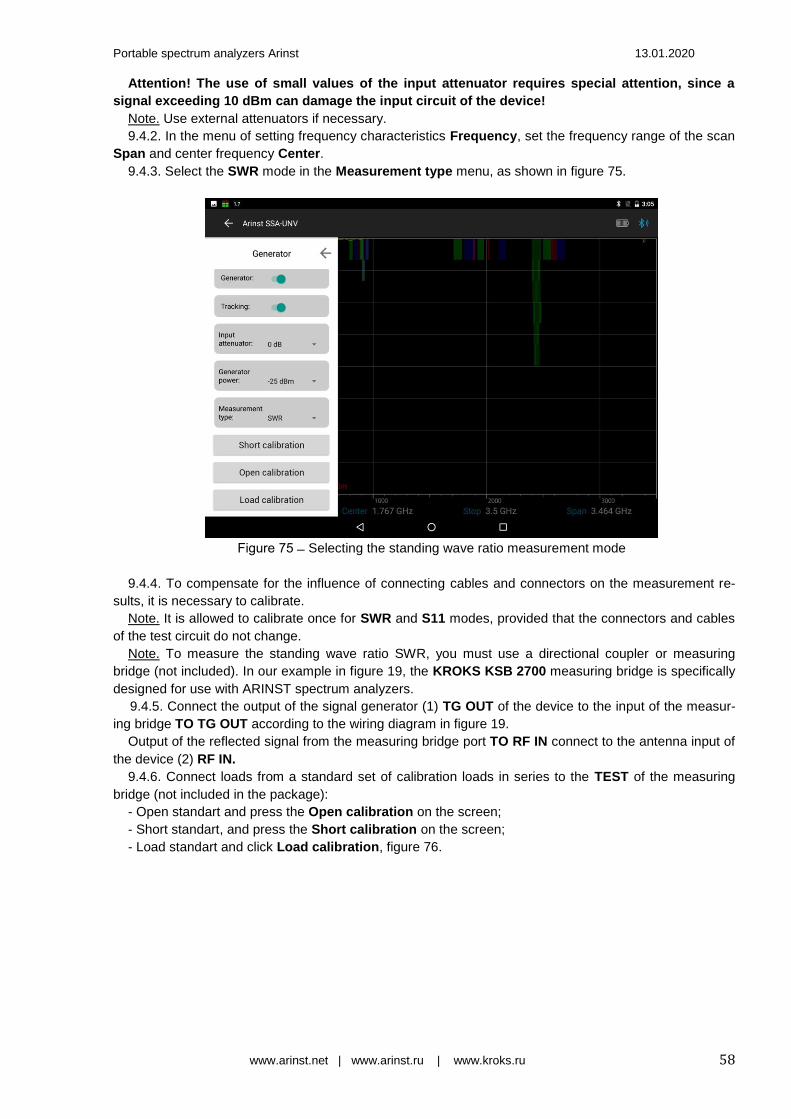
Portable spectrum analyzers Arinst 13.01.2020
www.arinst.net | www.arinst.ru | www.kroks.ru 58
Attention! The use of small values of the input attenuator requires special attention, since a
signal exceeding 10 dBm can damage the input circuit of the device!
Note. Use external attenuators if necessary. 9.4.2. In the menu of setting frequency characteristics Frequency, set the frequency range of the scan
Span and center frequency Center. 9.4.3. Select the SWR mode in the Measurement type menu, as shown in figure 75.
igure 75 Selecting the standing wave ratio measurement mode
9.4.4. To compensate for the influence of connecting cables and connectors on the measurement re-
sults, it is necessary to calibrate. Note. It is allowed to calibrate once for SWR and S11 modes, provided that the connectors and cables
of the test circuit do not change.
Note. To measure the standing wave ratio SWR, you must use a directional coupler or measuring
bridge (not included). In our example in figure 19, the KROKS KSB 2700 measuring bridge is specifically
designed for use with ARINST spectrum analyzers.
9.4.5. Connect the output of the signal generator (1) TG OUT of the device to the input of the measur-
ing bridge TO TG OUT according to the wiring diagram in figure 19. Output of the reflected signal from the measuring bridge port TO RF IN connect to the antenna input of
the device (2) RF IN.
9.4.6. Connect loads from a standard set of calibration loads in series to the TEST of the measuring
bridge (not included in the package):
- Open standart and press the Open calibration on the screen; - Short standart, and press the Short calibration on the screen; - Load standart and click Load calibration, figure 76.
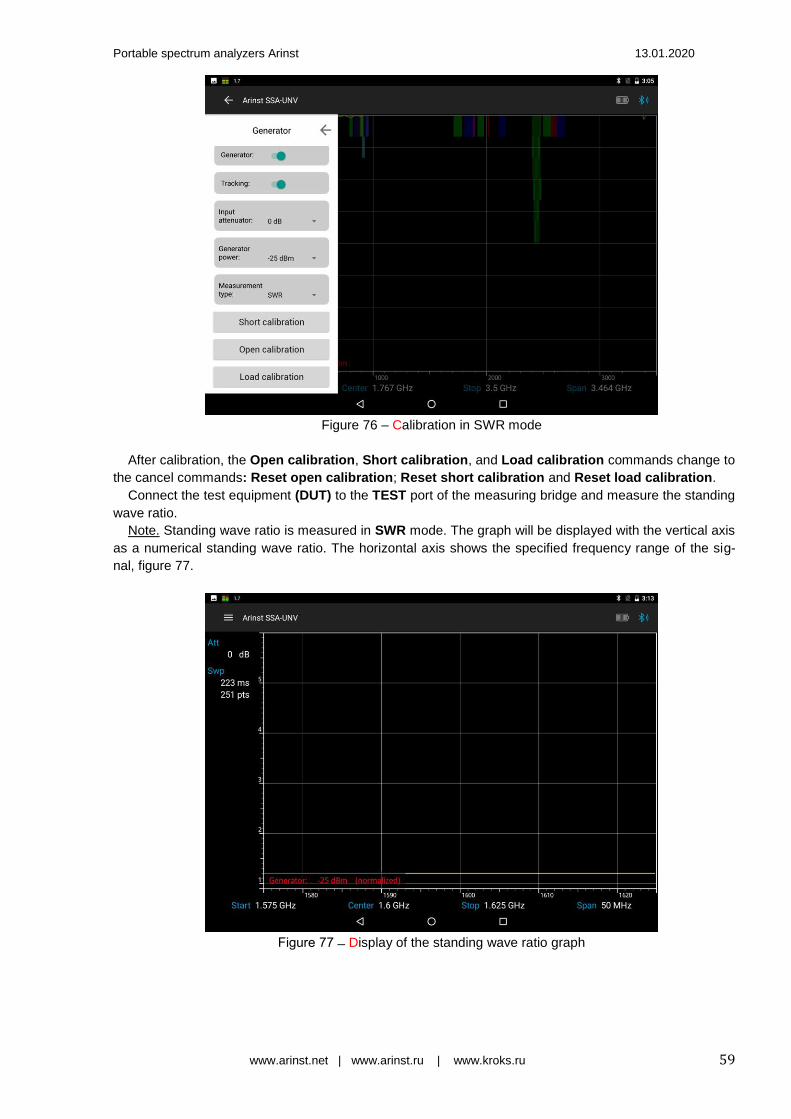
Portable spectrum analyzers Arinst 13.01.2020
www.arinst.net | www.arinst.ru | www.kroks.ru 59
Figure 76 – Calibration in SWR mode
After calibration, the Open calibration, Short calibration, and Load calibration commands change to
the cancel commands: Reset open calibration; Reset short calibration and Reset load calibration.
Connect the test equipment (DUT) to the TEST port of the measuring bridge and measure the standing
wave ratio.
Note. Standing wave ratio is measured in SWR mode. The graph will be displayed with the vertical axis
as a numerical standing wave ratio. The horizontal axis shows the specified frequency range of the sig-
nal, figure 77.
igure 77 Display of the standing wave ratio graph

Portable spectrum analyzers Arinst 13.01.2020
www.arinst.net | www.arinst.ru | www.kroks.ru 60
9.5. Displaying multiple frequency bands of signals
9.5.1. To simultaneously display several frequency bands on the tablet / smartphone screen, enter the
frequency range operating menu Frequency, and select the Frequency merges tab, figure 78.
igure 78 Selecting the “gluing” mode of ranges
9.5.2. Create a new list of simultaneously viewed frequency ranges by clicking the Create button, as
shown in Figure 79.
Figure 79 Creating a new range list
9.5.3. In the Name field, enter the name of the new range list, for example, Downlink, as shown in
figure 80.
Note. By default, the new lists of frequency ranges are automatically assigned the name "merge" with
an indication of the sequence number. For example, merge003.
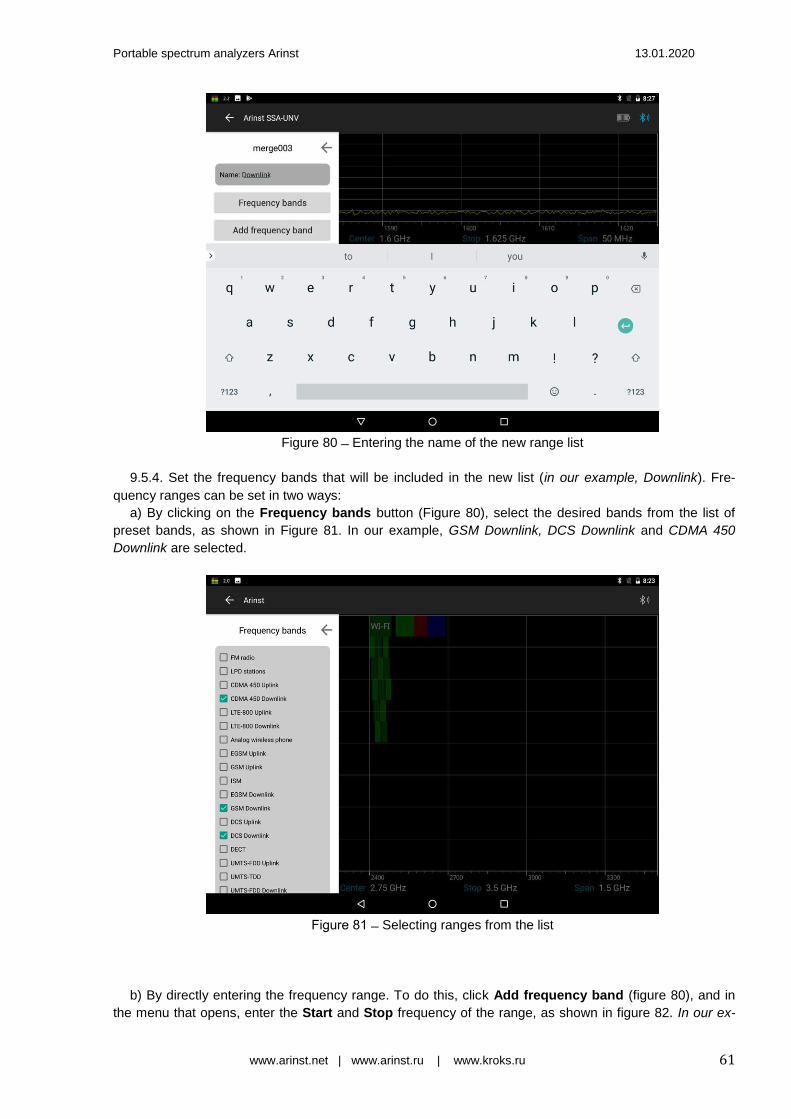
Portable spectrum analyzers Arinst 13.01.2020
www.arinst.net | www.arinst.ru | www.kroks.ru 61
Figure 80 Entering the name of the new range list
9.5.4. Set the frequency bands that will be included in the new list (in our example, Downlink). Fre-
quency ranges can be set in two ways:
a) By clicking on the Frequency bands button (Figure 80), select the desired bands from the list of
preset bands, as shown in Figure 81. In our example, GSM Downlink, DCS Downlink and CDMA 450
Downlink are selected.
igure 81 Selecting ranges from the list
b) By directly entering the frequency range. To do this, click Add frequency band (figure 80), and in
the menu that opens, enter the Start and Stop frequency of the range, as shown in figure 82. In our ex-

Portable spectrum analyzers Arinst 13.01.2020
www.arinst.net | www.arinst.ru | www.kroks.ru 62
ample, the frequency range UMTS-FDD Downlink is introduced. For inclusion in the list of the range of
input frequencies, click Add.
Figure 82 Input of the initial and final frequencies of the range
9.5.5. Go back to the Frequency merges menu and select the range list you created, as shown in
figure 83. In our example, the Downlink list. In the opened tab, in addition to the name of the list, a list
of frequency ranges is displayed.
igure 83 Created list of frequency ranges
9.5.6. To edit the list of frequency ranges (add new ranges or delete existing ones), click Edit, to close
the tab, click Close. To display frequency graphs from the created list of bands on the tablet / smartphone
screen, click Load.
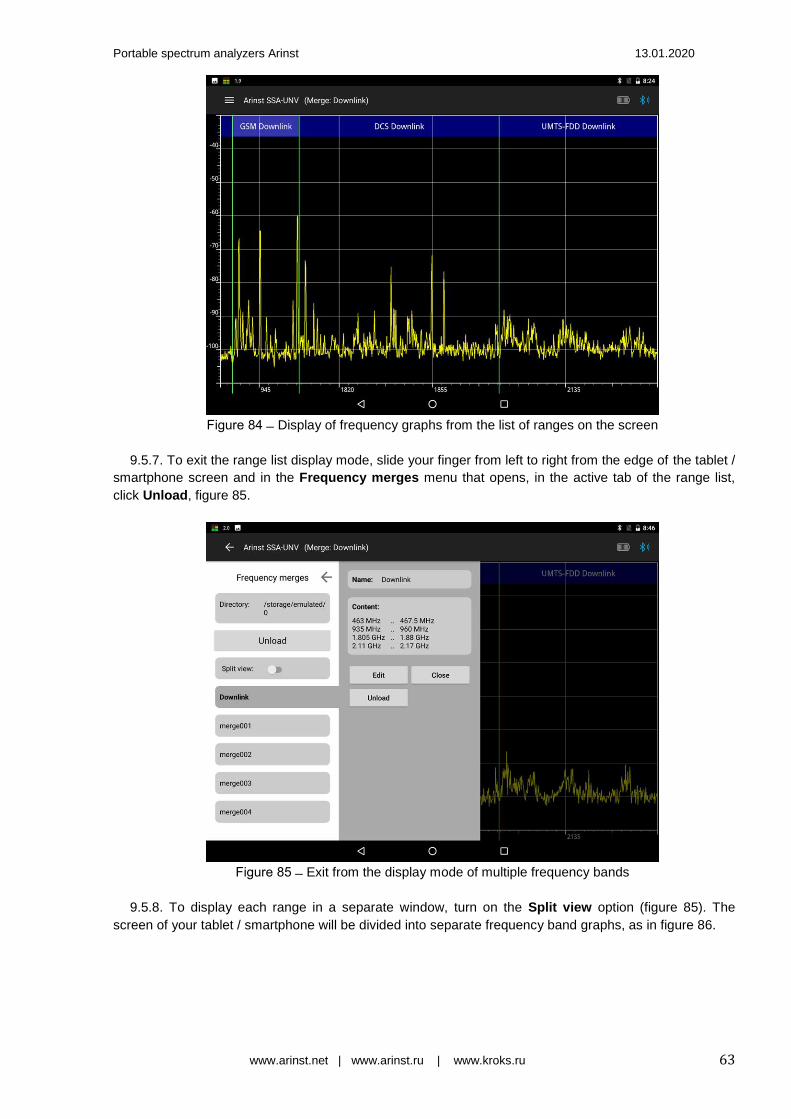
Portable spectrum analyzers Arinst 13.01.2020
www.arinst.net | www.arinst.ru | www.kroks.ru 63
igure 84 Display of frequency graphs from the list of ranges on the screen
9.5.7. To exit the range list display mode, slide your finger from left to right from the edge of the tablet /
smartphone screen and in the Frequency merges menu that opens, in the active tab of the range list,
click Unload, figure 85.
igure 85 Exit from the display mode of multiple frequency bands
9.5.8. To display each range in a separate window, turn on the Split view option (figure 85). The
screen of your tablet / smartphone will be divided into separate frequency band graphs, as in figure 86.

Portable spectrum analyzers Arinst 13.01.2020
www.arinst.net | www.arinst.ru | www.kroks.ru 64
igure 86 Display of frequency graphs from the list of ranges on the screen
9.6. Pointing of antennas using the device 9.6.1. In the process of installation of antennas with high gain, it is necessary to pay increased atten-
tion to the accuracy of pointing the antenna to the base station. Setting the angle and direction of the an-
tenna with a modem is often difficult because of the low data refresh rate and the low accuracy of the
modem's signal strength measurement. Accurate pointing of the antenna to the base station in the short-
est time is possible with the use of a spectrum analyzer. 9.6.2. Install the antenna on its mount. Preset the angle and direction of the antenna to the base sta-
tion. Fix the antenna in this position, but do not tighten the fasteners, thus ensuring that the antenna can
be moved for fine tuning.
igure 87 Setting the frequency range from the range list
9.6.3. Connect the antenna to the RF IN of the instrument. Turn on the device, connect the tablet /
smartphone to the device. Run the control program and enter the Frequency setting menu and set the

Portable spectrum analyzers Arinst 13.01.2020
www.arinst.net | www.arinst.ru | www.kroks.ru 65
frequency range. The frequency range is set either by choosing from the preset bands in the Frequency
bands menu (figure 87), or by entering the initial Start and final Stop frequency range, as in figure 88.
igure 88 Entering the frequency range of the signal overview
9.6.4. Enter the menu of statistical and mathematical processing of the displayed data Trace, set the
Max Hold mode to display the averaged maximum measurements as shown in figure 89. Use the "-" and
"+" buttons to set an infinite (∞) number of scans and click the Run button.
igure 89 Setting the number of scans for maximum display
9.6.5. On the tablet / smartphone screen, the average maximum signal level will be displayed in red,
figure 90.
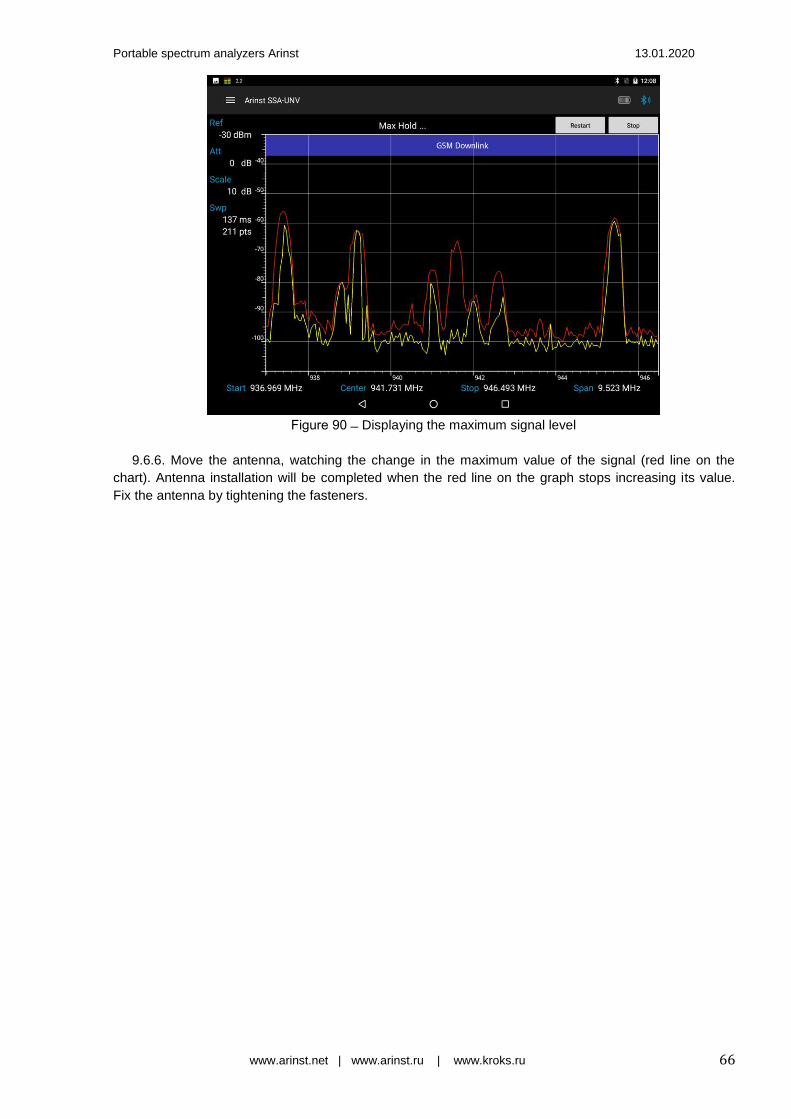
Portable spectrum analyzers Arinst 13.01.2020
www.arinst.net | www.arinst.ru | www.kroks.ru 66
igure 90 Displaying the maximum signal level
9.6.6. Move the antenna, watching the change in the maximum value of the signal (red line on the
chart). Antenna installation will be completed when the red line on the graph stops increasing its value.
Fix the antenna by tightening the fasteners.

Portable spectrum analyzers Arinst 13.01.2020
www.arinst.net | www.arinst.ru | www.kroks.ru 67
10. CARE AND MAINTENANCE 10.1. General care of the device 10.1.1. When working with the device, use the supplied adapters to protect the high-frequency con-
nectors of the device from excessive wear. 10.1.2. When measuring the frequency response of active devices (amplifiers, repeaters, converters),
use external attenuators (not supplied) to prevent damage to the input circuit of the device.
10.1.3. When working, do not allow water and dust to get inside the device 10.1.4. When you have finished working with the device, turn off the device, disconnect all connected
cables and connectors. Wipe the device with a clean rag. Remove heavy dirt with a rag moistened with
soapy water. To clean the device, it is recommended to use wet wipes for household purposes. Do not
use alcohol-based or petroleum-based solvents to clean the screen and body of the device! These liquids
can damage the outer cover of the screen and the case of the product.
10.1.5. Charge the device battery according to p. 10.2.
10.2. Accumulator charging 10.2.1. To charge the device, it is recommended to use a stabilized power supply with an output volt-
age of 5 V and a current of at least 500 mA. If you cannot use such a power source, charge the instru-
ment battery from a computer or laptop.
10.2.2. Connect the supplied power cable to the mini-USB (8) connector of the instrument. Connect
the second end of the cable to the USB connector of the power supply or USB connector of the computer
(laptop).
10.2.3. Turning on the LED indicator (7) «CHARGE» informs about the beginning of the battery charg-
ing process. The process of charging the battery will take about 5 hours.
Note. The device is allowed to operate while charging the battery. When you connect the device, using
a USB cable to a computer or other device (laptop, tablet), the battery will start charging automatically. 10.2.4. At the end of charging, the LED indicator (7) «CHARGE» will turn off, informing you of the
completion of the charging process. Note. Depending on the individual parameters of the controller built into the device battery, at the end
of charging LED indicator (7) «CHARGE» may not go out, and continue to glow or blink.
10.3. Battery replacement 10.3.1. After a certain period, the capacity of the Li-Ion battery is reduced, and long-term use of the
device without recharging becomes difficult. 10.3.2. Replacing the battery is necessary when the following symptoms occur: - the battery charges very quickly and discharges very quickly; - the battery takes a very long time to charge (more than 8 hours);
- battery does not accept charge; - the device does not turn on offline (with the charger cord disconnected). 10.3.3. For replacement, you must purchase a new Li-Ion battery with operating voltage 3.7 V, capaci-
ty not less than 2000 mA and overall dimensions not more than: height 4 mm, length 80 mm, width 50
mm (figure 91).
Note. When purchasing and installing a battery with a capacity other than the capacity installed at the
factory, you should take into account the fact that the battery charging time will also change in a larger or
smaller direction.
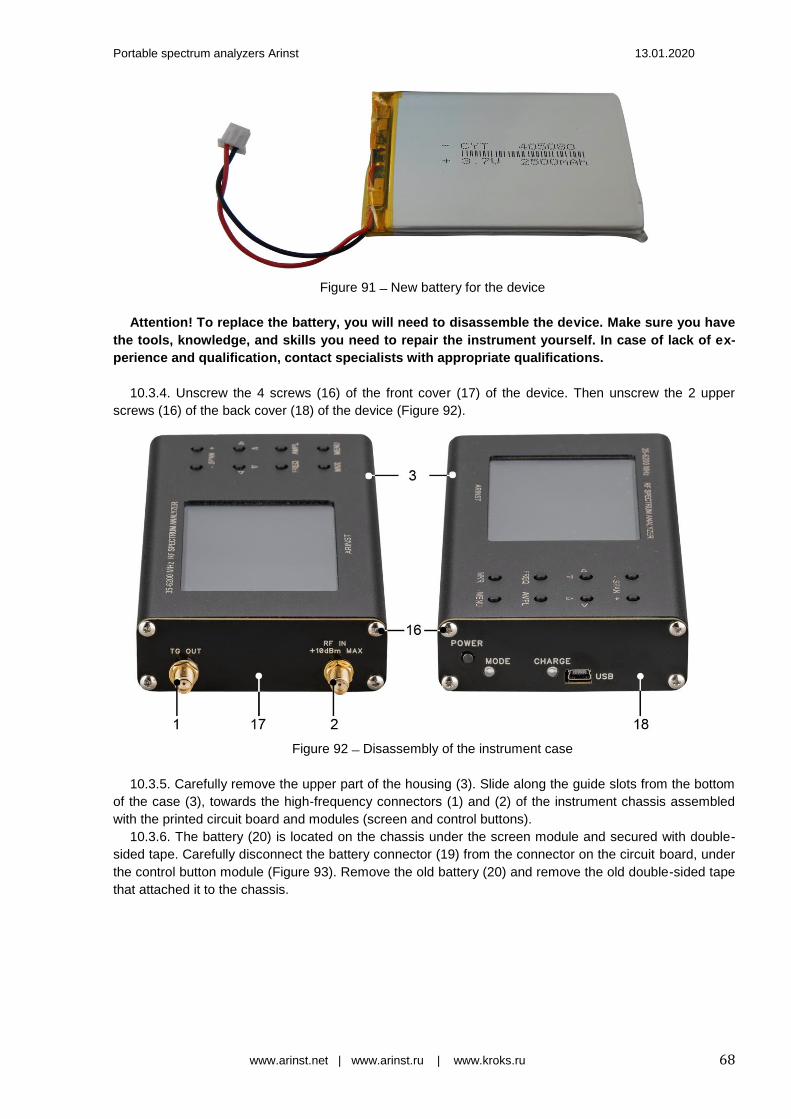
Portable spectrum analyzers Arinst 13.01.2020
www.arinst.net | www.arinst.ru | www.kroks.ru 68
Figure 91 New battery for the device
Attention! To replace the battery, you will need to disassemble the device. Make sure you have
the tools, knowledge, and skills you need to repair the instrument yourself. In case of lack of ex-
perience and qualification, contact specialists with appropriate qualifications.
10.3.4. Unscrew the 4 screws (16) of the front cover (17) of the device. Then unscrew the 2 upper
screws (16) of the back cover (18) of the device (Figure 92).
Figure 92 Disassembly of the instrument case
10.3.5. Carefully remove the upper part of the housing (3). Slide along the guide slots from the bottom
of the case (3), towards the high-frequency connectors (1) and (2) of the instrument chassis assembled
with the printed circuit board and modules (screen and control buttons).
10.3.6. The battery (20) is located on the chassis under the screen module and secured with double-
sided tape. Carefully disconnect the battery connector (19) from the connector on the circuit board, under
the control button module (Figure 93). Remove the old battery (20) and remove the old double-sided tape
that attached it to the chassis.

Portable spectrum analyzers Arinst 13.01.2020
www.arinst.net | www.arinst.ru | www.kroks.ru 69
Figure 93 Battery replacement
10.3.8. Apply a new double sided tape and attach a new battery (20) securely to it. Connect the battery
connector (19) to the connector on the board. Reassemble the instrument in reverse order.
10.3.9. After assembling the device, charge the battery according to paragraph 10.2. of this «Manual»
10.4. Storage and transportation 10.4.1. Store the appliance in a dry place at a positive temperature and relative humidity not exceeding
75%.
10.4.2. Before storing the appliance, charge the battery. 10.4.3. If stored for a long time, recharge the battery every 3 months. The ambient temperature at
which the instrument is stored can have a significant effect on the self-discharge rate of the battery.
10.4.4. Keep the device and its accessories out of the reach of children. 10.4.5. When transporting the device must be securely fastened. Shaking, knocking and dropping can
cause the device to fail.
10.5. The criterion of the limit state 10.5.1. The criterion of the limiting state of the device is a sign, or a set of signs, upon reaching which:
- further operation of the device is not allowed; - recovery to a healthy state is impossible or economically impractical. 10.5.2. Upon reaching the limit state, the device must be decommissioned and disposed of.
10.6. Utilization 10.6.1. The device, battery, cords and cables that have failed, should be transferred to special collec-
tion points for the disposal of electronic devices. Do not throw away broken appliances, batteries, cables
into household waste!
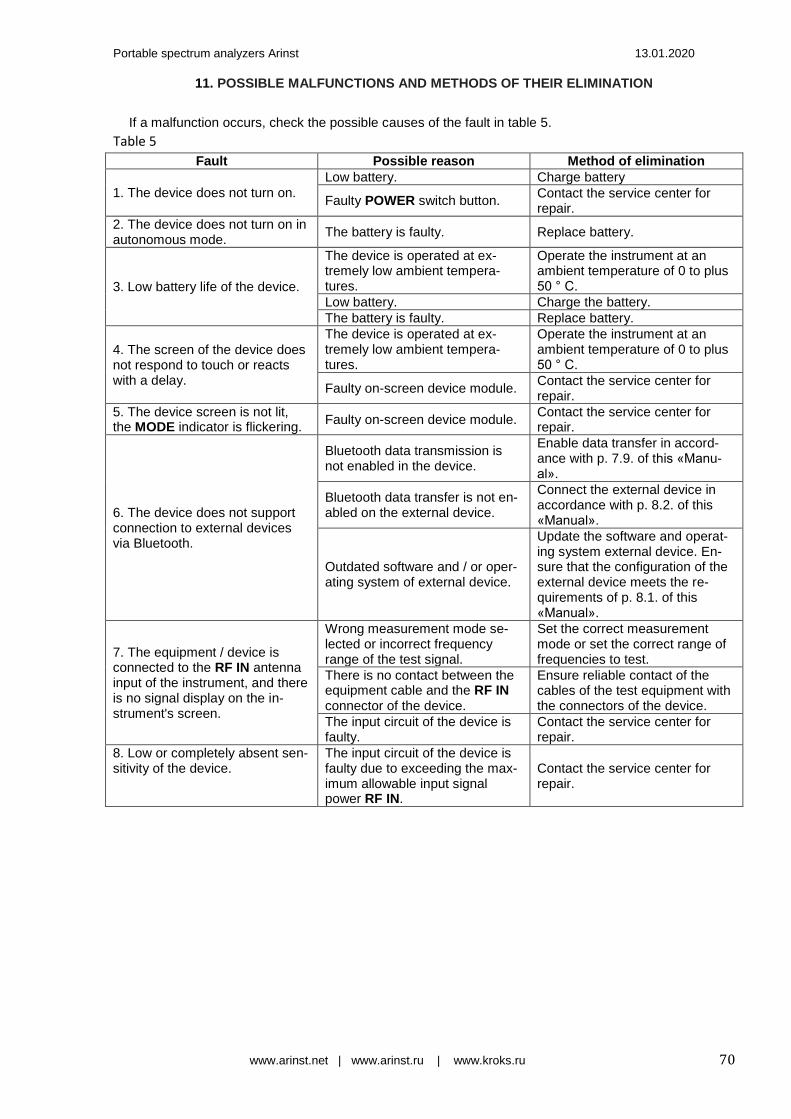
Portable spectrum analyzers Arinst 13.01.2020
www.arinst.net | www.arinst.ru | www.kroks.ru 70
11. POSSIBLE MALFUNCTIONS AND METHODS OF THEIR ELIMINATION
If a malfunction occurs, check the possible causes of the fault in table 5.
Table 5
Fault Possible reason Method of elimination
1. The device does not turn on. Low battery. Charge battery
Faulty POWER switch button. Contact the service center for repair.
2. The device does not turn on in autonomous mode.
The battery is faulty. Replace battery.
3. Low battery life of the device.
The device is operated at ex-tremely low ambient tempera-tures.
Operate the instrument at an ambient temperature of 0 to plus 50 ° C.
Low battery. Charge the battery. The battery is faulty. Replace battery.
4. The screen of the device does not respond to touch or reacts with a delay.
The device is operated at ex-tremely low ambient tempera-tures.
Operate the instrument at an ambient temperature of 0 to plus 50 ° C.
Faulty on-screen device module. Contact the service center for repair.
5. The device screen is not lit, the MODE indicator is flickering.
Faulty on-screen device module. Contact the service center for repair.
6. The device does not support connection to external devices via Bluetooth.
Bluetooth data transmission is not enabled in the device.
Enable data transfer in accord-ance with p. 7.9. of this «Manu-al».
Bluetooth data transfer is not en-abled on the external device.
Connect the external device in accordance with p. 8.2. of this «Manual».
Outdated software and / or oper-ating system of external device.
Update the software and operat-ing system external device. En-sure that the configuration of the external device meets the re-quirements of p. 8.1. of this «Manual».
7. The equipment / device is connected to the RF IN antenna input of the instrument, and there is no signal display on the in-strument's screen.
Wrong measurement mode se-lected or incorrect frequency range of the test signal.
Set the correct measurement mode or set the correct range of frequencies to test.
There is no contact between the equipment cable and the RF IN connector of the device.
Ensure reliable contact of the cables of the test equipment with the connectors of the device.
The input circuit of the device is faulty.
Contact the service center for repair.
8. Low or completely absent sen-sitivity of the device.
The input circuit of the device is faulty due to exceeding the max-imum allowable input signal power RF IN.
Contact the service center for repair.
Portable spectrum analyzers Arinst 13.01.2020
www.arinst.net | www.arinst.ru | www.kroks.ru 71
12. WARRANTY OBLIGATIONS
The manufacturer guarantees conformity of this product with technical characteristics given in this document.
The warranty period is 12 months from the date of sale. During this period, the manufacturer pro-vides free warranty service.
The warranty does not apply to the following cases: - the warranty period of the product from the date of sale has expired;
- the product intended for personal needs was used for commercial activities, as well as for other purposes that do not correspond to its intended purpose;
- violations of the rules and conditions outlined in the user Guide and other documentation trans-ferred to the Buyer included with the product;
- in the presence of the Product of the traces of improper repair or attempted opening outside of an authorized service center, but also because of tampering of the software;
- damage (defects) of the Goods caused by exposure to virus programs, interference with the soft-ware, or use of third-party software (non-original);
- defect caused by an act of force majeure (e.g., earthquake, fire, lightning, instability in the power grid), accidents, deliberate or reckless acts of consumer or third parties;
- mechanical damage (cracks, chips, holes) that occurred after the transfer of the product to the Buyer;
- damage caused by exposure to moisture, high or low temperatures, corrosion, oxidation, ingress of foreign objects, substances, liquids, insects;
- the defect has arisen due to the input connectors, terminal, housing signal that exceeds the allowa-ble for this Item values;
- the defect is caused by natural wear and tear of the Product (e.g. but not limited to: natural wear of the connectors due to frequent connection/disconnection of the adapters).
Warranty obligations apply only to defects caused by the fault of the manufacturer. Warranty service is performed by the manufacturer.
With warranty obligations acquainted ______________________________________________
(Buyer's signature)
Date of sale:________________ Seller _________________________________ (date) (store name or stamp)
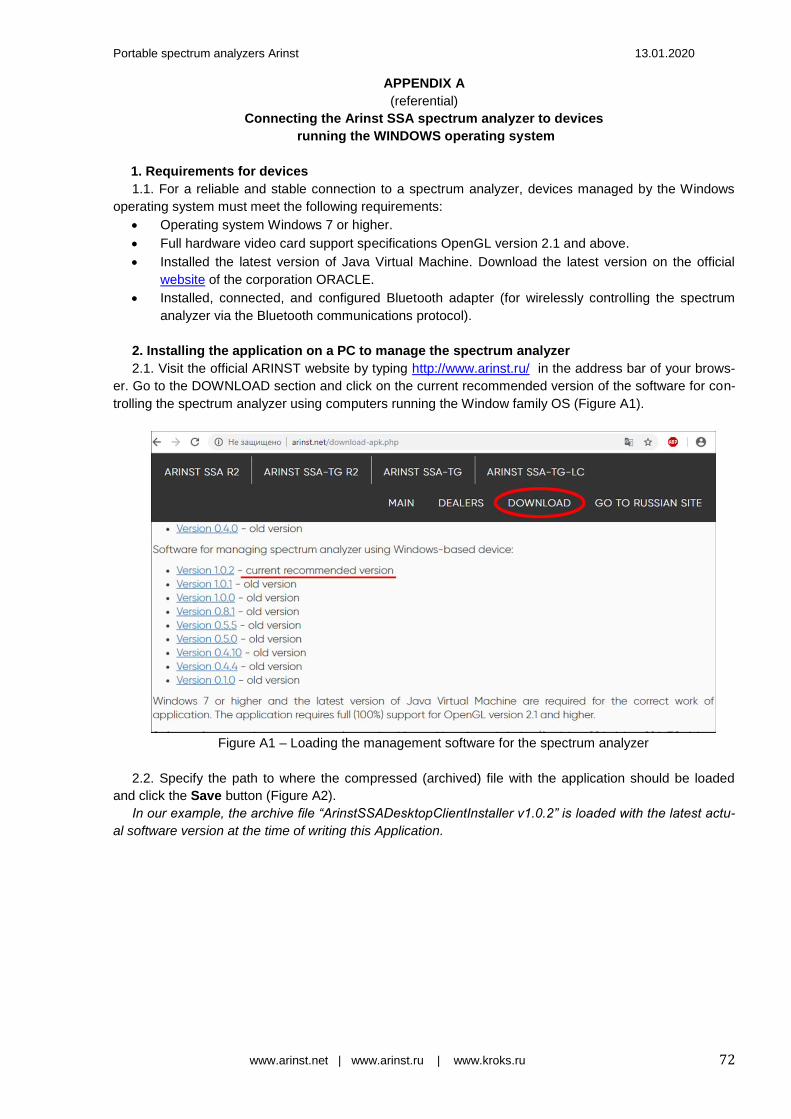
Portable spectrum analyzers Arinst 13.01.2020
www.arinst.net | www.arinst.ru | www.kroks.ru 72
APPENDIX A
(referential)
Connecting the Arinst SSA spectrum analyzer to devices
running the WINDOWS operating system
1. Requirements for devices
1.1. For a reliable and stable connection to a spectrum analyzer, devices managed by the Windows
operating system must meet the following requirements:
Operating system Windows 7 or higher.
Full hardware video card support specifications OpenGL version 2.1 and above.
Installed the latest version of Java Virtual Machine. Download the latest version on the official
website of the corporation ORACLE.
Installed, connected, and configured Bluetooth adapter (for wirelessly controlling the spectrum
analyzer via the Bluetooth communications protocol).
2. Installing the application on a PC to manage the spectrum analyzer
2.1. Visit the official ARINST website by typing http://www.arinst.ru/ in the address bar of your brows-
er. Go to the DOWNLOAD section and click on the current recommended version of the software for con-
trolling the spectrum analyzer using computers running the Window family OS (Figure A1).
Figure A1 – Loading the management software for the spectrum analyzer
2.2. Specify the path to where the compressed (archived) file with the application should be loaded
and click the Save button (Figure A2).
In our example, the archive file “ArinstSSADesktopClientInstaller v1.0.2” is loaded with the latest actu-
al software version at the time of writing this Application.
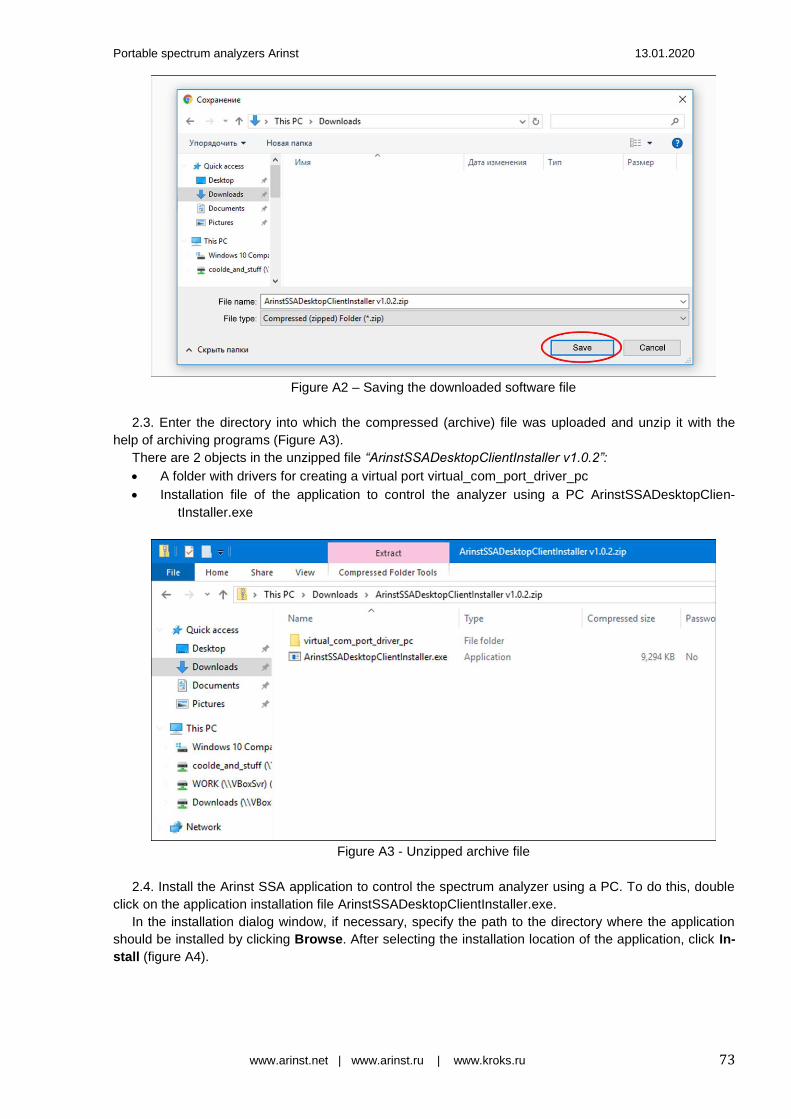
Portable spectrum analyzers Arinst 13.01.2020
www.arinst.net | www.arinst.ru | www.kroks.ru 73
Figure A2 – Saving the downloaded software file
2.3. Enter the directory into which the compressed (archive) file was uploaded and unzip it with the
help of archiving programs (Figure A3).
There are 2 objects in the unzipped file “ArinstSSADesktopClientInstaller v1.0.2”:
A folder with drivers for creating a virtual port virtual_com_port_driver_pc
Installation file of the application to control the analyzer using a PC ArinstSSADesktopClien-
tInstaller.exe
Figure A3 - Unzipped archive file
2.4. Install the Arinst SSA application to control the spectrum analyzer using a PC. To do this, double
click on the application installation file ArinstSSADesktopClientInstaller.exe.
In the installation dialog window, if necessary, specify the path to the directory where the application
should be installed by clicking Browse. After selecting the installation location of the application, click In-
stall (figure A4).

Portable spectrum analyzers Arinst 13.01.2020
www.arinst.net | www.arinst.ru | www.kroks.ru 74
Figure A4 - Installing the Arinst SSA Application
2.5. When the installation is complete, close the dialog window by clicking Close. On the desktop of
your PC will be a shortcut to start the application Arinst SSA.
2.6. Enter the folder with the drivers to create a virtual port virtual_com_port_driver_pc (Figure A5).
The folder contains drivers for 32-bit and 64-bit Windows operating systems.
Note – To determine which Windows operating system (32-bit or 64-bit) is installed on your PC, exe-
cute:
For Windows 7:
Click the Start button, right-click the Computer, and then select Properties.
In the System section, see which type of system is listed.
For Windows 8.1 and Windows 10:
Click the Start button and select: Settings → System → About system.
In the Device Features section, see which System Type is listed.
Figure A5 - Virtual port drivers

Portable spectrum analyzers Arinst 13.01.2020
www.arinst.net | www.arinst.ru | www.kroks.ru 75
2.7. Double-click on the driver file corresponding to your Windows operating system. The device driver
installation wizard will start (Figure A6). To continue the installation, click the Next button. To cancel the
installation, click Cancel.
Figure A6 - Driver installation wizard
2.8. Wait for the device driver installation wizard to complete. The window will show the name of the
driver (STMicroelectronics Virtual COM Port) and its status. Click Finish to exit the device driver instal-
lation wizard.
3. Connecting the spectrum analyzer to a PC via USB cable
3.1. Connect the spectrum analyzer to your PC running Windows using a mini-USB USB 2.0 cable.
Turn on the spectrum analyzer by pressing the button (5) POWER.
3.2. Launch the Arinst SSA application by double-clicking on the shortcut located on the desktop of
your PC.
Figure A7 - Connecting the spectrum analyzer to PC
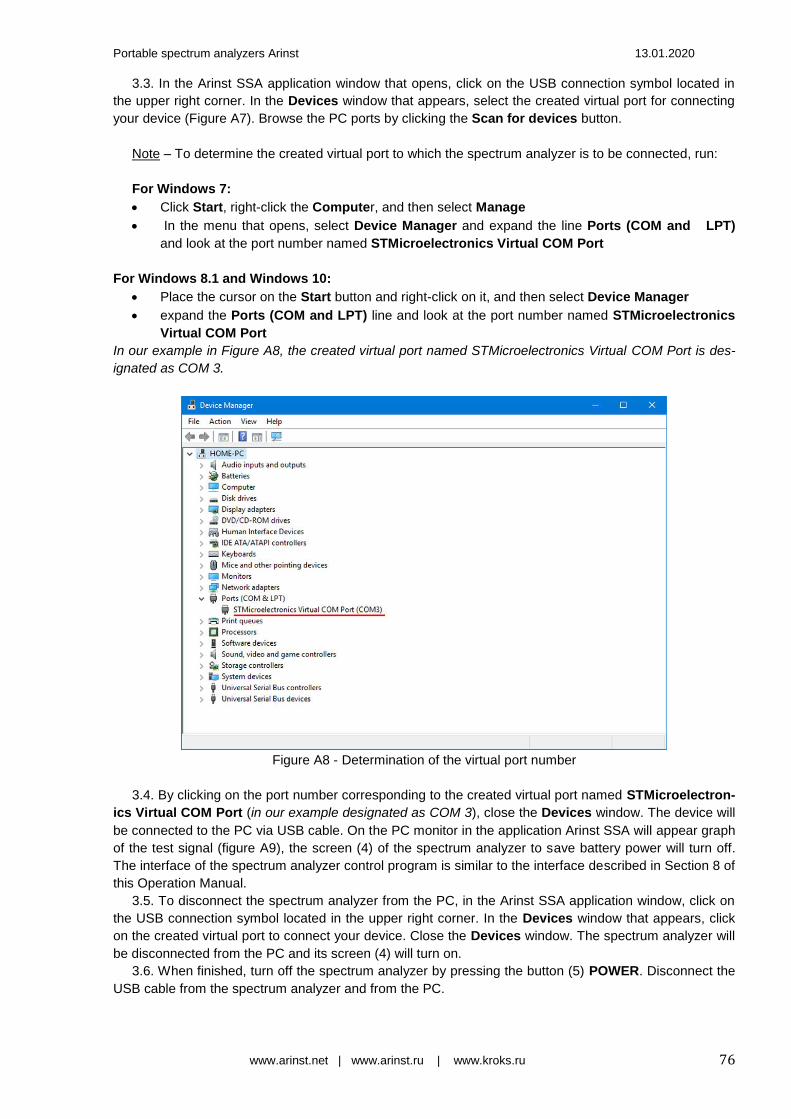
Portable spectrum analyzers Arinst 13.01.2020
www.arinst.net | www.arinst.ru | www.kroks.ru 76
3.3. In the Arinst SSA application window that opens, click on the USB connection symbol located in
the upper right corner. In the Devices window that appears, select the created virtual port for connecting
your device (Figure A7). Browse the PC ports by clicking the Scan for devices button.
Note – To determine the created virtual port to which the spectrum analyzer is to be connected, run:
For Windows 7:
Click Start, right-click the Computer, and then select Manage
In the menu that opens, select Device Manager and expand the line Ports (COM and LPT)
and look at the port number named STMicroelectronics Virtual COM Port
For Windows 8.1 and Windows 10:
Place the cursor on the Start button and right-click on it, and then select Device Manager
expand the Ports (COM and LPT) line and look at the port number named STMicroelectronics
Virtual COM Port
In our example in Figure A8, the created virtual port named STMicroelectronics Virtual COM Port is des-
ignated as COM 3.
Figure A8 - Determination of the virtual port number
3.4. By clicking on the port number corresponding to the created virtual port named STMicroelectron-
ics Virtual COM Port (in our example designated as COM 3), close the Devices window. The device will
be connected to the PC via USB cable. On the PC monitor in the application Arinst SSA will appear graph
of the test signal (figure A9), the screen (4) of the spectrum analyzer to save battery power will turn off.
The interface of the spectrum analyzer control program is similar to the interface described in Section 8 of
this Operation Manual.
3.5. To disconnect the spectrum analyzer from the PC, in the Arinst SSA application window, click on
the USB connection symbol located in the upper right corner. In the Devices window that appears, click
on the created virtual port to connect your device. Close the Devices window. The spectrum analyzer will
be disconnected from the PC and its screen (4) will turn on.
3.6. When finished, turn off the spectrum analyzer by pressing the button (5) POWER. Disconnect the
USB cable from the spectrum analyzer and from the PC.

Portable spectrum analyzers Arinst 13.01.2020
www.arinst.net | www.arinst.ru | www.kroks.ru 77
Figure A9 - Spectrum analyzer connected to PC via USB cable
4. Connecting the spectrum analyzer to a PC via Bluetooth
Attention! Before connecting the spectrum analyzer to a PC via a Bluetooth wireless connec-
tion, make sure that your PC is equipped with a Bluetooth adapter3.
4.1. Turn on the spectrum analyzer by pressing the button (5) POWER. Going to the device menu,
turn on the wireless data transfer via Bluetooth protocol in accordance with section 7.9. "Operation
Manual".
Figure A10 - Turning on PC-installed Bluetooth devices
4.2. Turn on Bluetooth on your PC.
To do this, click the Start button and select Settings → Devices.
Move the power-on slider of Bluetooth-installed devices to the PC. (Enabled). Then click Add Blue-
tooth or another device (Figure A10).
3 Hereinafter, it is assumed that the Bluetooth wireless module is installed on the PC and connected.

Portable spectrum analyzers Arinst 13.01.2020
www.arinst.net | www.arinst.ru | www.kroks.ru 78
4.3. Select the type of device you want to add to the list of devices that can be connected to your PC
(Figure A11).
Figure A11 – Selecting the type of device to add
4.4. The PC operating system will search for all active Bluetooth devices. The devices available for
connection will be displayed in the list (Figure A12).
Figure A12 - List of devices available for connection
4.5. Click on the name of your device that you want to connect to your PC using the Bluetooth com-
munication protocol. Enter the PIN (1234) and click the Connect button (Figure A13). The spectrum ana-
lyzer will interface with your PC.
In our example in Figure A13, the spectrum analyzer displayed as ARINST_SSA_UNV_3997 is con-
nected to the PC.
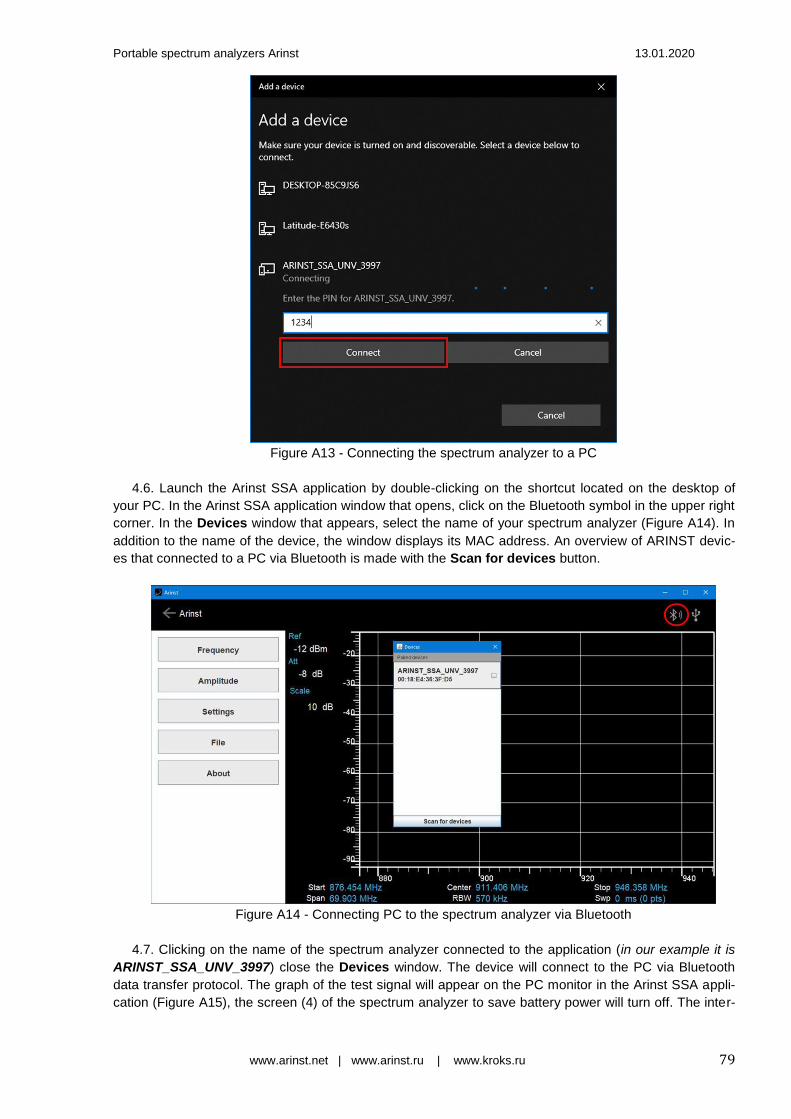
Portable spectrum analyzers Arinst 13.01.2020
www.arinst.net | www.arinst.ru | www.kroks.ru 79
Figure A13 - Connecting the spectrum analyzer to a PC
4.6. Launch the Arinst SSA application by double-clicking on the shortcut located on the desktop of
your PC. In the Arinst SSA application window that opens, click on the Bluetooth symbol in the upper right
corner. In the Devices window that appears, select the name of your spectrum analyzer (Figure A14). In
addition to the name of the device, the window displays its MAC address. An overview of ARINST devic-
es that connected to a PC via Bluetooth is made with the Scan for devices button.
Figure A14 - Connecting PC to the spectrum analyzer via Bluetooth
4.7. Clicking on the name of the spectrum analyzer connected to the application (in our example it is
ARINST_SSA_UNV_3997) close the Devices window. The device will connect to the PC via Bluetooth
data transfer protocol. The graph of the test signal will appear on the PC monitor in the Arinst SSA appli-
cation (Figure A15), the screen (4) of the spectrum analyzer to save battery power will turn off. The inter-
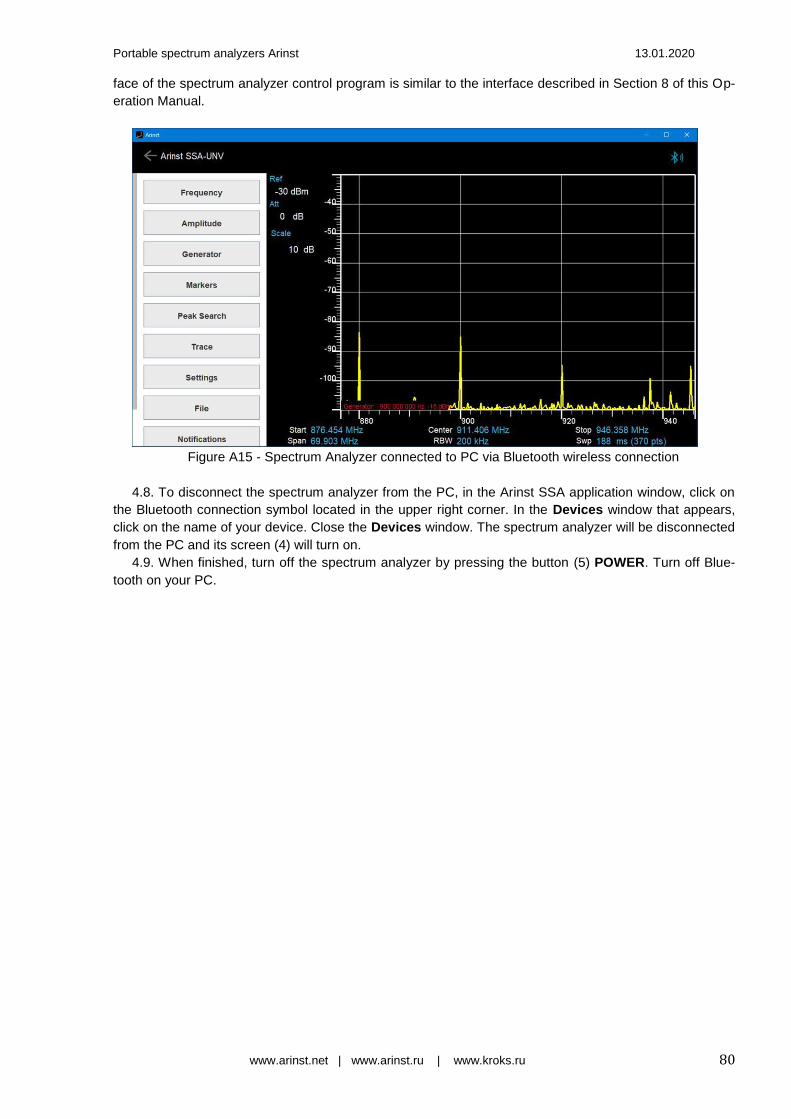
Portable spectrum analyzers Arinst 13.01.2020
www.arinst.net | www.arinst.ru | www.kroks.ru 80
face of the spectrum analyzer control program is similar to the interface described in Section 8 of this Op-
eration Manual.
Figure A15 - Spectrum Analyzer connected to PC via Bluetooth wireless connection
4.8. To disconnect the spectrum analyzer from the PC, in the Arinst SSA application window, click on
the Bluetooth connection symbol located in the upper right corner. In the Devices window that appears,
click on the name of your device. Close the Devices window. The spectrum analyzer will be disconnected
from the PC and its screen (4) will turn on.
4.9. When finished, turn off the spectrum analyzer by pressing the button (5) POWER. Turn off Blue-
tooth on your PC.
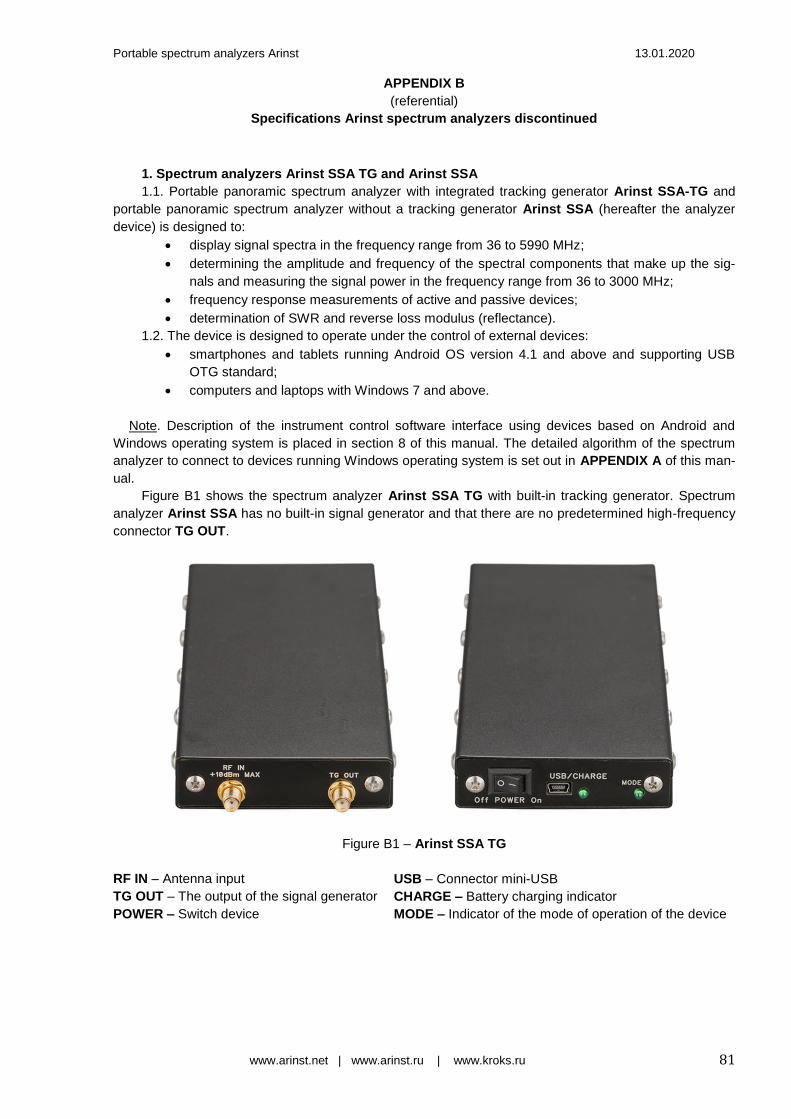
Portable spectrum analyzers Arinst 13.01.2020
www.arinst.net | www.arinst.ru | www.kroks.ru 81
APPENDIX B
(referential)
Specifications Arinst spectrum analyzers discontinued
1. Spectrum analyzers Arinst SSA TG and Arinst SSA
1.1. Portable panoramic spectrum analyzer with integrated tracking generator Arinst SSA-TG and
portable panoramic spectrum analyzer without a tracking generator Arinst SSA (hereafter the analyzer
device) is designed to:
display signal spectra in the frequency range from 36 to 5990 MHz;
determining the amplitude and frequency of the spectral components that make up the sig-
nals and measuring the signal power in the frequency range from 36 to 3000 MHz;
frequency response measurements of active and passive devices;
determination of SWR and reverse loss modulus (reflectance).
1.2. The device is designed to operate under the control of external devices:
smartphones and tablets running Android OS version 4.1 and above and supporting USB
OTG standard;
computers and laptops with Windows 7 and above.
Note. Description of the instrument control software interface using devices based on Android and
Windows operating system is placed in section 8 of this manual. The detailed algorithm of the spectrum
analyzer to connect to devices running Windows operating system is set out in APPENDIX A of this man-
ual.
Figure B1 shows the spectrum analyzer Arinst SSA TG with built-in tracking generator. Spectrum
analyzer Arinst SSA has no built-in signal generator and that there are no predetermined high-frequency
connector TG OUT.
Figure B1 – Arinst SSA TG
RF IN – Antenna input USB – Connector mini-USB
TG OUT – The output of the signal generator CHARGE – Battery charging indicator
POWER – Switch device MODE – Indicator of the mode of operation of the device

Portable spectrum analyzers Arinst 13.01.2020
www.arinst.net | www.arinst.ru | www.kroks.ru 82
Table B1 - Technical specifications of spectrum analyzers Arinst SSA TG and Arinst SSA
Name of parameter Arinst SSA TG Arinst SSA
Displayed frequency range 36-5990 MHz
Measured frequency range 36-3000 MHz
Dynamic range for 36-3000 MHz band 70 dB
Maximum bandwidth 1000 MHz
IF bandwidth (fixed) 250 kHz
Sweep speed with a span of more than 100 MHz 350 MHz/s
Sweep time of 100 MHz span < 0,3 s
Detectable signal duration at 10 MHz scan span 20 ms
Noise floor in the band 36-3000 MHz < -85 dBm
Input impedance 50 Ohm
SWR in the operating frequency range < 1,5
Internal attenuator 0-30 dB
Error of attenuation
up to 10 dB 2 dB
from 10 to 20 dB 5 dB
from 20 to 30 dB 8 dB
Frequency range of built-in tracking generator 36-5990 MHz -
Tracking generator output power -15 .. -25 dBm -
Accuracy of display of a signal within a dynamic range 2 dB
Maximum input power
with 0 dB attenuator + 10 dBm
with attenuator > 20 dB + 20 dBm
The measured maximum input signal + 10 dBm
Maximum RF input DC voltage 25 V
Maximum supply current
when running on battery 400 mA
when running on USB
(in charging mode) 500 mA
Battery capacity 2000 mAh
Continuous operation time from accumulator 2 h
Battery charging time ~7 h
Dimensions 170×80×22 mm
Weight 0,4 kg
Table B2 – Delivery sets of Arinst SSA TG and Arinst SSA
Name Arinst SSA TG Arinst SSA
Amount
Spectrum analyzer 1 pc. 1 pc.
Adapter SMA (male) – SMA (female) 2 pc. 1 pc.
Power cable mini-USB on USB 2.0 with data transfer 1 pc. 1 pc.
USB OTG cable mini-USB – micro-USB 1 pc. 1 pc.
Operation manual (passport) 1 pc. 1 pc.
Packaging 1 pc. 1 pc.
2. Spectrum analyzers Arinst SSA TG LC and Arinst SSA LC
2.1. Portable panoramic spectrum analyzer with integrated tracking generator Arinst SSA TG LC
and portable panoramic spectrum analyzer without a tracking generator Arinst SSA LC (hereafter the
analyzer device) is designed to:
display signal spectra in the frequency range from 36 to 5990 MHz;
determining the amplitude and frequency of the spectral components that make up the sig-
nals and measuring the signal power in the frequency range from 36 to 3000 MHz;
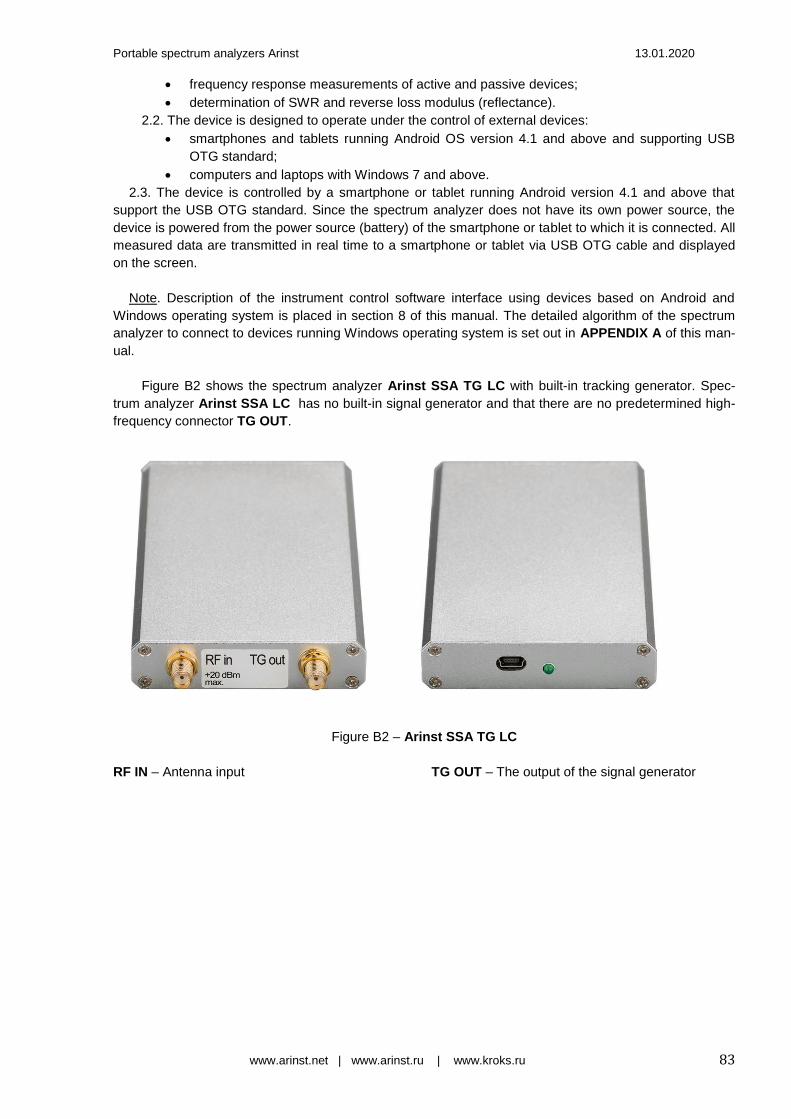
Portable spectrum analyzers Arinst 13.01.2020
www.arinst.net | www.arinst.ru | www.kroks.ru 83
frequency response measurements of active and passive devices;
determination of SWR and reverse loss modulus (reflectance).
2.2. The device is designed to operate under the control of external devices:
smartphones and tablets running Android OS version 4.1 and above and supporting USB
OTG standard;
computers and laptops with Windows 7 and above.
2.3. The device is controlled by a smartphone or tablet running Android version 4.1 and above that
support the USB OTG standard. Since the spectrum analyzer does not have its own power source, the
device is powered from the power source (battery) of the smartphone or tablet to which it is connected. All
measured data are transmitted in real time to a smartphone or tablet via USB OTG cable and displayed
on the screen.
Note. Description of the instrument control software interface using devices based on Android and
Windows operating system is placed in section 8 of this manual. The detailed algorithm of the spectrum
analyzer to connect to devices running Windows operating system is set out in APPENDIX A of this man-
ual.
Figure B2 shows the spectrum analyzer Arinst SSA TG LC with built-in tracking generator. Spec-
trum analyzer Arinst SSA LC has no built-in signal generator and that there are no predetermined high-
frequency connector TG OUT.
Figure B2 – Arinst SSA TG LC
RF IN – Antenna input TG OUT – The output of the signal generator
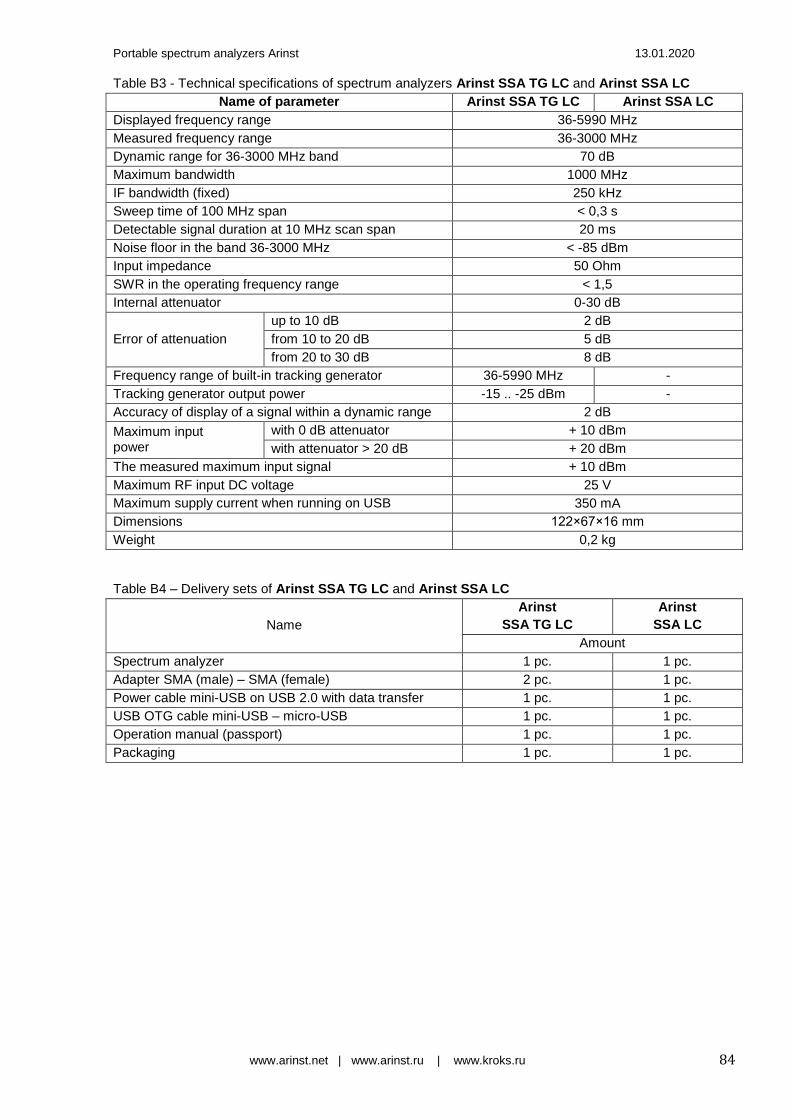
Portable spectrum analyzers Arinst 13.01.2020
www.arinst.net | www.arinst.ru | www.kroks.ru 84
Table B3 - Technical specifications of spectrum analyzers Arinst SSA TG LC and Arinst SSA LC
Name of parameter Arinst SSA TG LC Arinst SSA LC
Displayed frequency range 36-5990 MHz
Measured frequency range 36-3000 MHz
Dynamic range for 36-3000 MHz band 70 dB
Maximum bandwidth 1000 MHz
IF bandwidth (fixed) 250 kHz
Sweep time of 100 MHz span < 0,3 s
Detectable signal duration at 10 MHz scan span 20 ms
Noise floor in the band 36-3000 MHz < -85 dBm
Input impedance 50 Ohm
SWR in the operating frequency range < 1,5
Internal attenuator 0-30 dB
Error of attenuation
up to 10 dB 2 dB
from 10 to 20 dB 5 dB
from 20 to 30 dB 8 dB
Frequency range of built-in tracking generator 36-5990 MHz -
Tracking generator output power -15 .. -25 dBm -
Accuracy of display of a signal within a dynamic range 2 dB
Maximum input power
with 0 dB attenuator + 10 dBm
with attenuator > 20 dB + 20 dBm
The measured maximum input signal + 10 dBm
Maximum RF input DC voltage 25 V
Maximum supply current when running on USB 350 mA
Dimensions 122×67×16 mm
Weight 0,2 kg
Table B4 – Delivery sets of Arinst SSA TG LC and Arinst SSA LC
Name
Arinst
SSA TG LC
Arinst
SSA LC
Amount
Spectrum analyzer 1 pc. 1 pc.
Adapter SMA (male) – SMA (female) 2 pc. 1 pc.
Power cable mini-USB on USB 2.0 with data transfer 1 pc. 1 pc.
USB OTG cable mini-USB – micro-USB 1 pc. 1 pc.
Operation manual (passport) 1 pc. 1 pc.
Packaging 1 pc. 1 pc.