Port Emissions Toolkit - IMO UNDP, IMO or IAPH shall not be liable to any person or organisation for...
52
Transcript of Port Emissions Toolkit - IMO UNDP, IMO or IAPH shall not be liable to any person or organisation for...

Port Emissions ToolkitGuide No.2: Development of port
emissions reduction strategies
Published in 2018 by the GloMEEP Project Coordination Unit
International Maritime Organization 4 Albert Embankment
London SE1 7SR United Kingdom
and
International Association of Ports and Harbors (IAPH) 7th Floor, South Tower New Pier Takeshiba
1-16-1 Kaigan, Minato-ku, Tokyo 105-0022
Japan
© GEF-UNDP-IMO GloMEEP Project and IAPH
Cover Design by Viktoria Heisig, viktoriaheisig.com
Typeset by Eyetooth-Art.co.uk
Printed by Elephant Print, Lewes, East Sussex
Copyright Notice: All rights reserved. This document, or any part thereof, may not be photocopied, stored in any medium by electronic means or otherwise, published, transferred, reproduced or performed in public in any form or by any means without prior written permission from the copyright owner. Enquiries should be directed to the address above.
GEF, UNDP, IMO or IAPH shall not be liable to any person or organisation for any loss, damage or expense caused by reliance on the information or advice in this document or howsoever provided.
Please cite this document as: GEF-UNDP-IMO GloMEEP Project and IAPH, 2018: Port Emissions Toolkit, Guide No.2, Development of port emissions reduction strategies.
The GloMEEP Project is a cooperative initiative of the Global Environment Facility (GEF), the United Nations Development Programme (UNDP) and the International Maritime Organization (IMO) to assist developing countries in the uptake and implementation of energy efficiency measures for shipping, with the aim of reducing greenhouse gas emissions and preventing air pollution from ships. For more information, please visit http://glomeep.imo.org
The International Association of Ports and Harbors (IAPH) is a global alliance representing over 180 members ports and 140 port related businesses in 90 countries. The principal aim of IAPH revolves around promotion of the interests of Ports worldwide, building strong member relationships and sharing best practices among our members. For more information, please visit https://www.iaphworldports.org/
page | v
ContentsList of figures . . . . . . . . . . . . . . . . . . . . . . . . . . . . . . . . . . . . . . . . . . . . . . . . . . . . . . . . . . . . . . . . . . . . . . . . . viiList of tables . . . . . . . . . . . . . . . . . . . . . . . . . . . . . . . . . . . . . . . . . . . . . . . . . . . . . . . . . . . . . . . . . . . . . . . . . . viiList of abbreviations. . . . . . . . . . . . . . . . . . . . . . . . . . . . . . . . . . . . . . . . . . . . . . . . . . . . . . . . . . . . . . . . . . . viiiAcknowledgements . . . . . . . . . . . . . . . . . . . . . . . . . . . . . . . . . . . . . . . . . . . . . . . . . . . . . . . . . . . . . . . . . . . xiPreface . . . . . . . . . . . . . . . . . . . . . . . . . . . . . . . . . . . . . . . . . . . . . . . . . . . . . . . . . . . . . . . . . . . . . . . . . . . . . . . xiii
1 Introduction . . . . . . . . . . . . . . . . . . . . . . . . . . . . . . . . . . . . . . . . . . . . . . . . . . . . . . . . . . . . . . . . . . . . . . . . 11.1 Undertake an emissions inventory . . . . . . . . . . . . . . . . . . . . . . . . . . . . . . . . . . . . . . . . . . . . . 11.2 Growing awareness of the need to reduce port-related emissions. . . . . . . . . . . . . . . . 11.3 Port-related mobile sources. . . . . . . . . . . . . . . . . . . . . . . . . . . . . . . . . . . . . . . . . . . . . . . . . . . . 21.4 Emissions reduction challenges and opportunities . . . . . . . . . . . . . . . . . . . . . . . . . . . . . . 2
2 Developing an emissions reduction strategies plan . . . . . . . . . . . . . . . . . . . . . . . . . . . . 52.1 Build support . . . . . . . . . . . . . . . . . . . . . . . . . . . . . . . . . . . . . . . . . . . . . . . . . . . . . . . . . . . . . . . . . 62.2 Determine pollutants to be reduced . . . . . . . . . . . . . . . . . . . . . . . . . . . . . . . . . . . . . . . . . . . . 62.3 Set pollutant reduction goals . . . . . . . . . . . . . . . . . . . . . . . . . . . . . . . . . . . . . . . . . . . . . . . . . . 82.4 Evaluate emissions inventory data . . . . . . . . . . . . . . . . . . . . . . . . . . . . . . . . . . . . . . . . . . . . . 82.5 Review programmes implemented by others. . . . . . . . . . . . . . . . . . . . . . . . . . . . . . . . . . . . 92.6 Identify and assess candidate measures . . . . . . . . . . . . . . . . . . . . . . . . . . . . . . . . . . . . . . . . 102.7 Develop an implementation approach . . . . . . . . . . . . . . . . . . . . . . . . . . . . . . . . . . . . . . . . . . 11
2.7.1 Claims of technology vendors . . . . . . . . . . . . . . . . . . . . . . . . . . . . . . . . . . . . . . . . . . . . . 112.7.2 Administrative approach. . . . . . . . . . . . . . . . . . . . . . . . . . . . . . . . . . . . . . . . . . . . . . . . . . 122.7.3 Coordination and collaboration with stakeholders . . . . . . . . . . . . . . . . . . . . . . . . . . 122.7.4 Evaluatingcosteffectiveness . . . . . . . . . . . . . . . . . . . . . . . . . . . . . . . . . . . . . . . . . . . . . . 122.7.5 Modelling, monitoring and reporting. . . . . . . . . . . . . . . . . . . . . . . . . . . . . . . . . . . . . . . 132.7.6 Review and adjustment cycles. . . . . . . . . . . . . . . . . . . . . . . . . . . . . . . . . . . . . . . . . . . . . 13
3 Overview of emissions control measures . . . . . . . . . . . . . . . . . . . . . . . . . . . . . . . . . . . . . . . . 153.1 Equipment measures . . . . . . . . . . . . . . . . . . . . . . . . . . . . . . . . . . . . . . . . . . . . . . . . . . . . . . . . . . 17
3.1.1 Seagoing vessels . . . . . . . . . . . . . . . . . . . . . . . . . . . . . . . . . . . . . . . . . . . . . . . . . . . . . . . . . 173.1.2 Domesticvessels,harbourcraftandinlandwaterwayvessels . . . . . . . . . . . . . . . . 183.1.3 Cargo handling equipment . . . . . . . . . . . . . . . . . . . . . . . . . . . . . . . . . . . . . . . . . . . . . . . . 193.1.4 On-road trucks . . . . . . . . . . . . . . . . . . . . . . . . . . . . . . . . . . . . . . . . . . . . . . . . . . . . . . . . . . 203.1.5 Locomotives. . . . . . . . . . . . . . . . . . . . . . . . . . . . . . . . . . . . . . . . . . . . . . . . . . . . . . . . . . . . . 20
3.2 Energy measures . . . . . . . . . . . . . . . . . . . . . . . . . . . . . . . . . . . . . . . . . . . . . . . . . . . . . . . . . . . . . . 203.2.1 Seagoing vessels . . . . . . . . . . . . . . . . . . . . . . . . . . . . . . . . . . . . . . . . . . . . . . . . . . . . . . . . . 213.2.2 Domesticvessels,harbourcraftandinlandwaterwayvessels . . . . . . . . . . . . . . . . 223.2.3 Cargo handling equipment . . . . . . . . . . . . . . . . . . . . . . . . . . . . . . . . . . . . . . . . . . . . . . . . 233.2.4 On-road trucks . . . . . . . . . . . . . . . . . . . . . . . . . . . . . . . . . . . . . . . . . . . . . . . . . . . . . . . . . . 24
Page

Guide No.2: Development of port emissions reduction strategies
vi | page
3.3 Operational measures . . . . . . . . . . . . . . . . . . . . . . . . . . . . . . . . . . . . . . . . . . . . . . . . . . . . . . . . . 243.3.1 Seagoing vessels . . . . . . . . . . . . . . . . . . . . . . . . . . . . . . . . . . . . . . . . . . . . . . . . . . . . . . . . . 243.3.2 Landside operational improvements. . . . . . . . . . . . . . . . . . . . . . . . . . . . . . . . . . . . . . . 25
3.4 Conclusion . . . . . . . . . . . . . . . . . . . . . . . . . . . . . . . . . . . . . . . . . . . . . . . . . . . . . . . . . . . . . . . . . . . . 25
4 Resources . . . . . . . . . . . . . . . . . . . . . . . . . . . . . . . . . . . . . . . . . . . . . . . . . . . . . . . . . . . . . . . . . . . . . . . . . . . 27
Annex 1 – Port emissions reduction strategy plan checklist . . . . . . . . . . . . . . . . . . . . . . . . 29
Annex 2 – Cost-effectiveness analysis . . . . . . . . . . . . . . . . . . . . . . . . . . . . . . . . . . . . . . . . . . . . . . . . . 33
Page
page | vii
List of figuresFigure 2.1: Steps for developing an emissions reduction strategies plan . . . . . . . . . . . . . . . . . . . . . . . . . 5
Page
List of tablesTable 1.1: Port-related mobile source categories and energy types . . . . . . . . . . . . . . . . . . . . . . . . . . . . . 2Table 2.1: Port-relatedpollutants,sourcesandhealthandenvironmentaleffects . . . . . . . . . . . . . . . . 6Table 2.2: Selected ports engaged in development and implementation
of emissions reduction strategies . . . . . . . . . . . . . . . . . . . . . . . . . . . . . . . . . . . . . . . . . . . . . . . . . . 10Table 2.3: Potential candidate emissions control measures . . . . . . . . . . . . . . . . . . . . . . . . . . . . . . . . . . . . 11Table 3.1: Environmentaltechnologyverificationresources . . . . . . . . . . . . . . . . . . . . . . . . . . . . . . . . . . . . 16
Page

viii | page
List of abbreviationsARFVTP Alternative and Renewable Fuel and Vehicle and Technology Program
CAAP Clean Air Action Plan
CARB California Air Resources Board
CEA CostEffectivenessAnalysis
CH4 Methane
CHE Cargo Handling Equipment
CNG Compressed Natural Gas
CO Carbon Monoxide
CO2 Carbon Dioxide
DEF Diesel Exhaust Fluid
DOC Diesel Oxygenation Catalyst
DPF Diesel Particulate Filter
DPM Diesel Particulate Matter
ECT Emissions Control Technology
EGR Exhaust Gas Recirculation
ERS Emissions Reduction Strategy
ESI Environmental Ship Index
ETV EUEnvironmentalTechnologyVerification
EU European Union
GEF Global Environment Facility
GHG Greenhouse Gases
GloMEEP GlobalMaritimeEnergyEfficiencyPartnershipsProject
HC Hydrocarbon
HFO Heavy Fuel Oil
IAPH International Association of Ports and Harbors
ICCT International Council on Clean Transportation
IMO International Maritime Organization
LF Load Factor
LNG LiquefiedNaturalGas
LPG LiquefiedPetroleumGas
MW Megawatts
NOX Nitrogen Oxides
OGV Ocean-Going Vessel
OPS Onshore Power Supply
PANYNJ Port Authority of New York & New Jersey
List of abbreviations
page | ix
PM Particulate MatterPOLA Port of Los AngelesPOLB Port of Long BeachRTG Rubber-tyred gantry craneSCR Selective Catalytic ReductionSOx Sulphur OxidesSPBP San Pedro Bay PortsTEU Twenty-Foot-Equivalent UnitUNDP United Nations Development ProgrammeUS United StatesUS EPA United States Environmental Protection AgencyVOC Volatile Organic CompoundsVSR Vessel Speed ReductionWPCI World Ports Climate Initiative (IAPH)

page | xi
AcknowledgementsThisGuide is theproductofacollaborationbetween theGEF-UNDP-IMOGlobalMaritimeEnergyEfficiencyPartnerships (GloMEEP) Project and the International Association of Ports and Harbors (IAPH).
The content of this Guide was developed by the Starcrest Consultancy Group (Bruce Anderson, Paul Johansen, Lauren Dunlap, Archana Agrawal, Joe Ray, Denise Anderson, Melissa Silva, Sarah Flagg, Guiselle Aldrete and Jill Morgan), under a contractual agreement with IAPH.
Great thanks are also due to the GloMEEP Project Coordination Unit (Astrid Dispert and Minglee Hoe), the IMO Marine Environment Division and Leigh Mazany who provided invaluable contributions to the development of this Guide.
Great thanks are also due to IAPH (Fer van de Laar) who provided important input and support.
For further information please contact:
GloMEEP Project Coordination Unit Marine Environment Division International Maritime Organization 4 Albert Embankment London SE1 7SR United Kingdom Web: http://glomeep.imo.org
International Association of Ports and Harbors (IAPH) 7th Floor, South Tower New Pier Takeshiba 1-16-1 Kaigan, Minato-ku Tokyo 105-0022 Japan Web: https://www.iaphworldports.org/


page | xiii
PrefaceMaritime ports are major hubs of economic activity and are usually located in the vicinity of highly populated areas. The growth of global trade has resulted in a corresponding rapid increase in the amount of goods being shipped by sea. Despite the enormous growth of the marine shipping sector, in many parts of the worldpollutionpreventioneffortshavenotfocusedonport-relatedsources.Asmoreattentionisfocusedonreducing emissions from the marine shipping sector, ports are driven to understand the magnitude of the air emissions impact from their operations on the local and global community and to develop strategies to reduce this impact.
Thekeytothiseffortistoprovideasystematicapproachtotheassessmentofairpollutantemissionsfromport-related sources through the development of port emissions inventories that provide the basic building block to the development of a port emissions reduction strategy. Without an emissions inventory, it may be difficulttodeterminewheretobestfocusresourcestoreduceemissions.Further,withoutabaselineemissionsinventory,andsubsequentupdates,itwillbedifficulttomonitortheeffectivenessofanyemissionsreductionstrategy that is implemented.
This Port Emissions Toolkit, therefore, includes two individual guides as follows:
Guide No.1: Assessment of port emissions
This guide is intended to serve as a resource guide for ports intending to develop or improve their air pollutant and/or GHG emissions assessments. This guide builds on and updates previous work of IAPH and its members, incorporating the latest emissions inventory methods and approaches.
Recognising that ships do not operate independently from shore-based entities in the maritime transportation system, port emissions considerations therefore must extend beyond the ships themselves to include all port-related emissions sources including: seagoing vessels, domestic vessels, cargo handling equipment, heavy-duty vehicles, locomotives and electrical grid.
This guide is intended to be relevant to users at differentlevels of experience, from those just beginning the emissions inventory process, to those having extensive experience with developing port-related emissions assessments.
This guide focuses on planning and key decision steps related to port emissions assessments. As the technical methods for estimating activity levels and related emissions from port-related sources continue to be updated and improved, this guide also points the reader to those organisations and ports that are at the forefront of emissions inventories, metrics and forecasts and, through their published work, provide up-to-date methods and proxy data for the development of port emissions assessments.
Guide No.2: Development of port emissions reduction strategies
xiv | page
Guide No.2: Development of port emissions reduction strategiesThis guide is intended to serve as a resource guide for ports intending to develop an emissions reduction strategy (ERS) for port-related emissions sources. This guide builds on the principles discussed in Guide No.1 and describes the approaches and methods that can be used by ports to develop, evaluate, implement and track voluntary emissions control measures that go beyond regulatory requirements.
This guide focuses on measures to be considered as part of an ERS plan for those port-related mobile emissions sources that are associated with cargo movement. This guide highlights key elements that ports should consider when developing an ERS, which includes evaluating, planning and implementing mobile source emissions control measures as part of an overall ERS. This guide also contains links to resources that provide further detailsintospecificareas.
page | 1
1 IntroductionThis Guide is for ports interested in developing an emissions reduction strategy (ERS) plan that will guide its voluntary efforts to reduce air pollutant and/or greenhouse gas (GHG) emissions beyond regulatoryrequirements.
An ERS plan contains measures a port will undertake that go beyond regulatory requirements, because everythingelseisjustcompliance.Emissionscontrolsvoluntarilyadoptedbyaport,bydefinitiongobeyondregulation – including where there is no regulation. Undertaking GHG emissions reductions when there is only a long-term national or regional goal, but no short-term emissions regulation, also goes beyond regulation. Measures solely undertaken to meet regulatory requirements belong in a compliance plan. Compliance plans are not the subject of this Guide.
This Guide focuses on measures to be considered as part of an ERS plan for port-related mobile emissions sources that are associated with cargo movement. This document highlights key elements that ports should consider when developing an ERS, which includes evaluating, planning and implementing mobile source emissions control measures as part of an overall ERS. The document also contains links to resources that providefurtherdetailsintospecificareas.
1.1 Undertake an emissions inventory
Before developing an emissions reduction strategy, it is recommended that an emissions inventory be conducted. An emissions inventory is the basic building block of a port emissions assessment, which is the subject of Port Emissions Toolkit, Guide No.1: Assessment of port emissions. Without an emissions inventory, it maybedifficulttodeterminewheretobestfocusresourcestoreduceemissions.Further,withoutabaselineemissionsinventory,andsubsequentupdates,itwillbedifficulttomonitortheeffectivenessofanyERSthatisimplemented.
1.2 Growing awareness of the need to reduce port-related emissions
The global logistics chain relies primarily, at present, on fossil fuels for its energy needs. These fuels produce harmful air pollutant and GHG emissions. Ports are multi-modal nodes within the logistics chain where the various modes of cargo movement come together. Ports are therefore concentrated areas of high fuel oil and diesel fuelled activities, producing air pollutants that have direct health impacts on local and regional populations.
Over the past two decades, the pressures applied to ports to reduce port-related emissions have been increasing across the globe. With growth in international trade, port-related activities have increased dramatically in some parts of the world.1 With this growth and emissions reduction strategies already implemented for non-port sourcesinmanypartsoftheworld,suchaslightdutyvehiclefleetandpublictransportationandforstationarysources such as power plants, the relative contributions of port-related air pollutant and GHG emissions have increased.Whilegrowthintradehaspositiveeconomicbenefitsforportcitiesandtheirsurroundingregions,this growth has also put surrounding communities under pressure through increased health risks associated with air pollution from port operations. Port communities are seeking solutions to reduce these risks. Addressingthispressure ischallengingsincereducingemissionsrequiressignificantfinancial investmentoroperationalmodificationsandwithoutregulationofport-relatedmobileemissionssources,whichislimitedinmany jurisdictions, there is not much interest on the part of the operators to reduce emissions.
1 Sharma DC. Ports in a Storm; Environmental Health Perspectives. 2006; 114(4): A222-A231.
Guide No.2: Development of port emissions reduction strategies
2 | page
In addition to the historical concern about air pollutants, concern about GHG emissions has significantlyincreased over the past decade. The entire logistics chain has come under pressure to reduce its associated carbon footprint. The IMO, in April 2018, adopted an Initial IMO Strategy on reduction of GHG emissions from shipsthatconfirmsIMO’scommitmenttoreducingGHGemissionsfrominternationalshippingand,asamatterofurgency,tophasingthemoutassoonaspossibleinthiscentury.TheInitialStrategyenvisagesforthefirsttime a reduction in total GHG emissions from international shipping which, it says, should peak as soon as possible and reduce the total annual GHG emissions by at least 50% by 2050 compared to 2008, while, at the same time,pursuingefforts towardsphasing themout. TheStrategy sendsa strong signal to the shippingsector as a whole of the need to stimulate investments in the development of low-carbon and zero-carbon fuels and innovative energy-efficient technologies. The Strategy recognises, as possible short-term furtheraction to reduce GHG emissions, the consideration and analysis of measures to encourage port developments and activities globally to facilitate reduction of GHG emissions from shipping, including provision of ship and shoreside/onshore power supply from renewable sources, infrastructure to support supply of alternative low-carbon and zero-carbon fuels, and to further optimise the logistics chain and its planning, including ports.
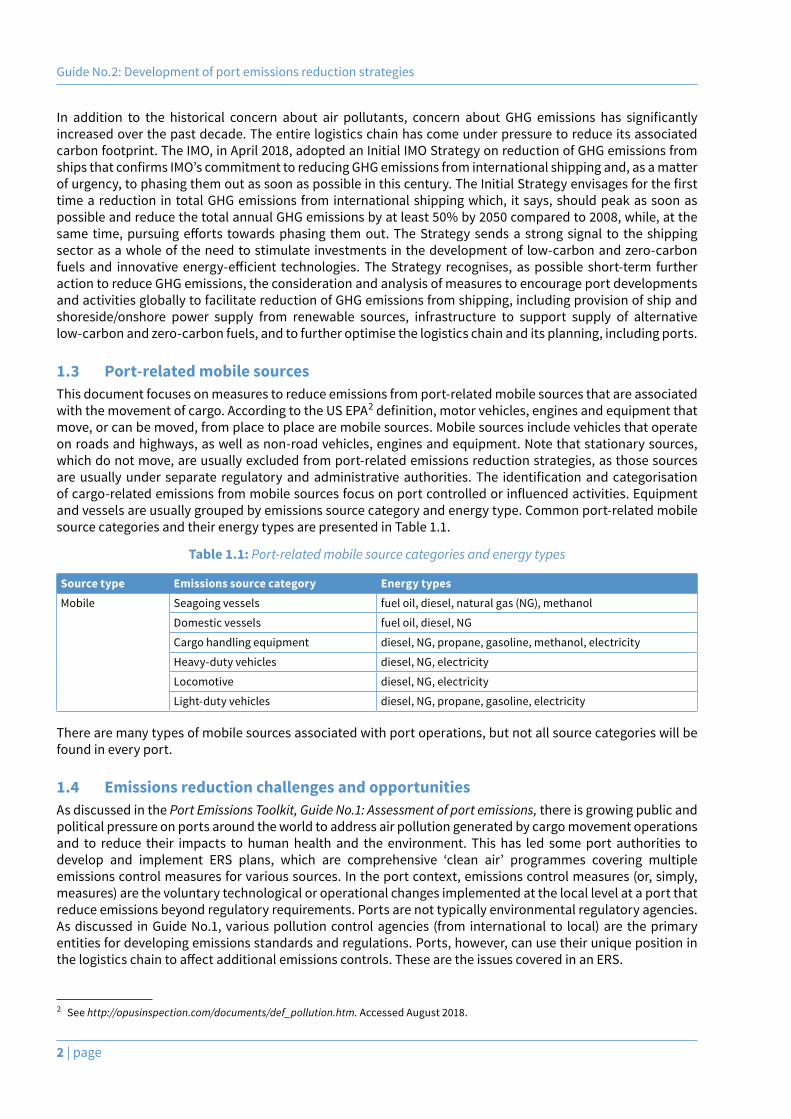
1.3 Port-related mobile sourcesThis document focuses on measures to reduce emissions from port-related mobile sources that are associated with the movement of cargo. According to the US EPA2definition,motorvehicles,enginesandequipmentthatmove, or can be moved, from place to place are mobile sources. Mobile sources include vehicles that operate on roads and highways, as well as non-road vehicles, engines and equipment. Note that stationary sources, which do not move, are usually excluded from port-related emissions reduction strategies, as those sources areusuallyunder separate regulatoryandadministrativeauthorities.The identificationandcategorisationofcargo-relatedemissionsfrommobilesourcesfocusonportcontrolledorinfluencedactivities.Equipmentand vessels are usually grouped by emissions source category and energy type. Common port-related mobile source categories and their energy types are presented in Table 1.1.
Table 1.1: Port-related mobile source categories and energy types
Source type Emissions source category Energy typesMobile Seagoing vessels fuel oil, diesel, natural gas (NG), methanol
Domestic vessels fuel oil, diesel, NG
Cargo handling equipment diesel, NG, propane, gasoline, methanol, electricity
Heavy-duty vehicles diesel, NG, electricity
Locomotive diesel, NG, electricity
Light-duty vehicles diesel, NG, propane, gasoline, electricity
There are many types of mobile sources associated with port operations, but not all source categories will be found in every port.
1.4 Emissions reduction challenges and opportunitiesAs discussed in the Port Emissions Toolkit, Guide No.1: Assessment of port emissions, there is growing public and political pressure on ports around the world to address air pollution generated by cargo movement operations and to reduce their impacts to human health and the environment. This has led some port authorities to develop and implement ERS plans, which are comprehensive ‘clean air’ programmes covering multipleemissions control measures for various sources. In the port context, emissions control measures (or, simply, measures) are the voluntary technological or operational changes implemented at the local level at a port that reduce emissions beyond regulatory requirements. Ports are not typically environmental regulatory agencies. As discussed in Guide No.1, various pollution control agencies (from international to local) are the primary entities for developing emissions standards and regulations. Ports, however, can use their unique position in thelogisticschaintoaffectadditionalemissionscontrols.ThesearetheissuescoveredinanERS.
2 See http://opusinspection.com/documents/def_pollution.htm. Accessed August 2018.

1 Introduction
page | 3
For ports in some regions of the world, existing regulations on port-related emissions sources are not enough to address the specific community and political pressures faced by the local port, so additionalemissions reduction strategies beyond regulation need to be explored. As discussed in the Guide No.1, the reasonsdrivingaporttoconsideranERScanrangefromhealtheffectsstudiesshowingsignificantimpactsfrom port-related emissions, the threat of a proposed regulation to reduce port-related emissions from an environmentalregulatoryagency,orsimplytomeettheport’sowncorporatesocialresponsibilitygoal.Forthepurposesofthisdocument,anERSplanwillbedefinedasthosegoalsandemissionscontrolmeasuresthat go beyondregulatoryrequirements.Theemissionsreductionsachievedbythesestrategiesare‘surplus’toexistingregulations.EmissionscontrolmeasuresinanERSplanshouldbequantifiable–thosemeasuresthat demonstrate emissions reductions through actions that go beyond baseline conditions (which includes all applicableregulatoryrequirements).WhilequalitativemeasurescanbeincludedinanERS,sincetheirbenefitsaredifficulttomeasure,documentingsuccessofemissionsreductionsisdifficult.
Emissions control measures can target air pollutants such as particulate matter (PM), sulphur oxides (SOx) and oxides of nitrogen (NOx). They can also target GHGs, primarily carbon dioxide (CO2). Emissions inventories are usedtoidentifyemissionsreductionopportunitiesandtohelpquantifythebenefitsofthosestrategies.


page | 5
2 Developing an emissions reduction strategies planThere are several steps to follow when developing an ERS plan. These steps are illustrated in Figure 2.1 and further discussed in the following sections.
Build support
Determine pollutants to be reduced
Set pollutant reduction goals
Review programmes implemented by others
Evaluate emissions inventory data
Identify and assess candidate control measures
Develop an implementation approach
Figure 2.1: Steps for developing an emissions reduction strategies plan
Additional information on each of these steps is presented below.
Guide No.2: Development of port emissions reduction strategies
6 | page
2.1 Build supportAll successful environmental projects and programmes have at least one thing in common: support from institutional leadership. Similarly, when undertaking an ERS plan, commitment from port management and its governing body are critical to ensure that the ERS is successful.
DevelopmentofanERSplanwillrequireportresources,includingstafftimeacrossvariousdepartmentsand,depending on the scope, funding for external analytical and consulting work. Working with other stakeholders interested in reducing emissions, such as pollution control agencies, non-governmental organisations, community groups and trade organisations, is essential to build necessary support for the project. Engagement with privately owned companies that operate in the port area, in particular shipping lines and terminal operators, is critical, as most ports do not have direct control over these operations. Successful implementation of any ERS will likely rely on a strong partnership with privately owned companies to implement emissions reduction efforts,especiallysincetheemissionscontrolmeasuresintheERSgoaboveandbeyondexistingregulations.
Withinaport’sinternalteam,aprojectmanagerfortheERSshouldbeappointed.Thispositionshouldbefullysupported by port management, including the provision of adequate funding and decision-making authority. The project manager will coordinate all stakeholder involvement in the development and implementation of the ERS plan. Developing an understanding of the objectives and concerns of each stakeholder group, as well as providing a structure for the stakeholders to discuss these matters in a neutral and constructive manner, areoftenoverlookedelementsnecessarytobuildsupportforanERS.Frequently,theprojectmanagerwillbecalledupontoresolveconflictswithinthestakeholdercommunityandtofindacompromisethataddressestheissues raised while maintaining clear sight of the goals of the ERS. The project manager will also be responsible for reporting progress to port management and maintaining the overall ERS plan project schedule and budget.
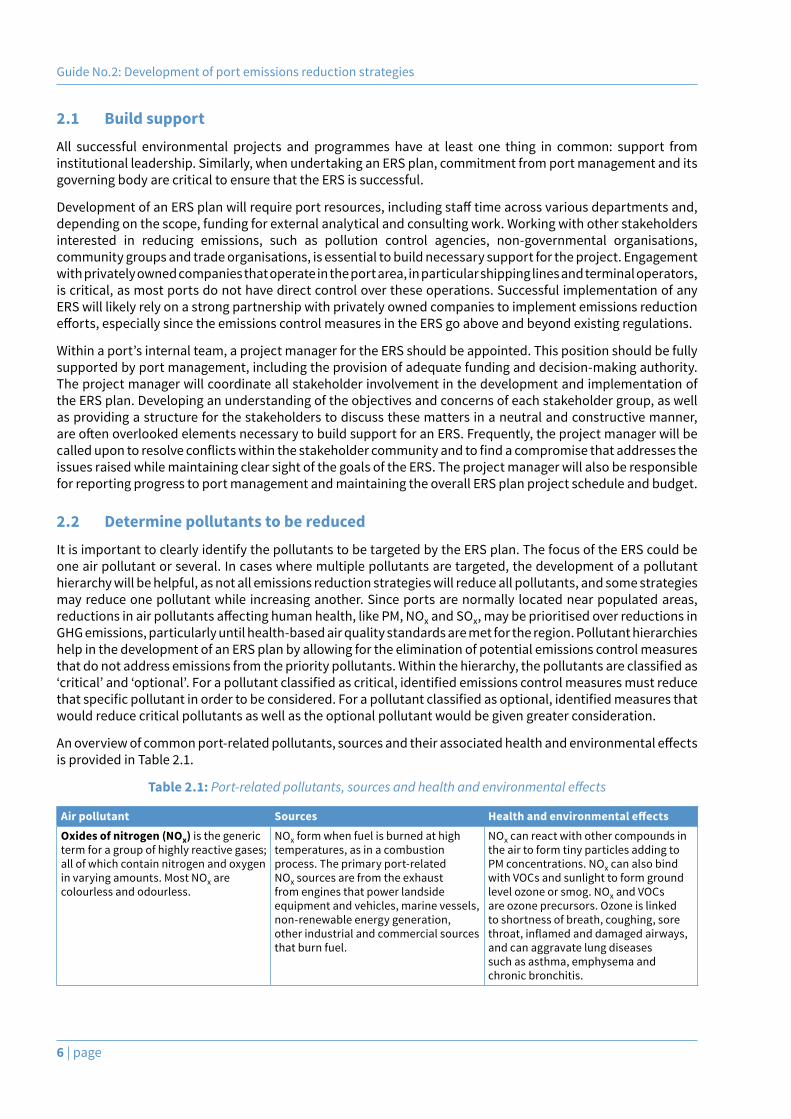
2.2 Determine pollutants to be reducedIt is important to clearly identify the pollutants to be targeted by the ERS plan. The focus of the ERS could be one air pollutant or several. In cases where multiple pollutants are targeted, the development of a pollutant hierarchy will be helpful, as not all emissions reduction strategies will reduce all pollutants, and some strategies may reduce one pollutant while increasing another. Since ports are normally located near populated areas, reductionsinairpollutantsaffectinghumanhealth,likePM,NOx and SOx, may be prioritised over reductions in GHG emissions, particularly until health-based air quality standards are met for the region. Pollutant hierarchies help in the development of an ERS plan by allowing for the elimination of potential emissions control measures thatdonotaddressemissionsfromtheprioritypollutants.Withinthehierarchy,thepollutantsareclassifiedas‘critical’and‘optional’.Forapollutantclassifiedascritical,identifiedemissionscontrolmeasuresmustreducethatspecificpollutantinordertobeconsidered.Forapollutantclassifiedasoptional,identifiedmeasuresthatwould reduce critical pollutants as well as the optional pollutant would be given greater consideration.
Anoverviewofcommonport-relatedpollutants,sourcesandtheirassociatedhealthandenvironmentaleffectsis provided in Table 2.1.
Table 2.1: Port-related pollutants, sources and health and environmental effects
Air pollutant Sources Health and environmental effectsOxides of nitrogen (NOx) is the generic term for a group of highly reactive gases; all of which contain nitrogen and oxygen in varying amounts. Most NOx are colourless and odourless.
NOx form when fuel is burned at high temperatures, as in a combustion process. The primary port-related NOx sources are from the exhaust from engines that power landside equipment and vehicles, marine vessels, non-renewable energy generation, other industrial and commercial sources that burn fuel.
NOx can react with other compounds in the air to form tiny particles adding to PM concentrations. NOx can also bind with VOCs and sunlight to form ground level ozone or smog. NOx and VOCs are ozone precursors. Ozone is linked to shortness of breath, coughing, sore throat,inflamedanddamagedairways,and can aggravate lung diseases such as asthma, emphysema and chronic bronchitis.
2 Developing an emissions reduction strategies plan
page | 7
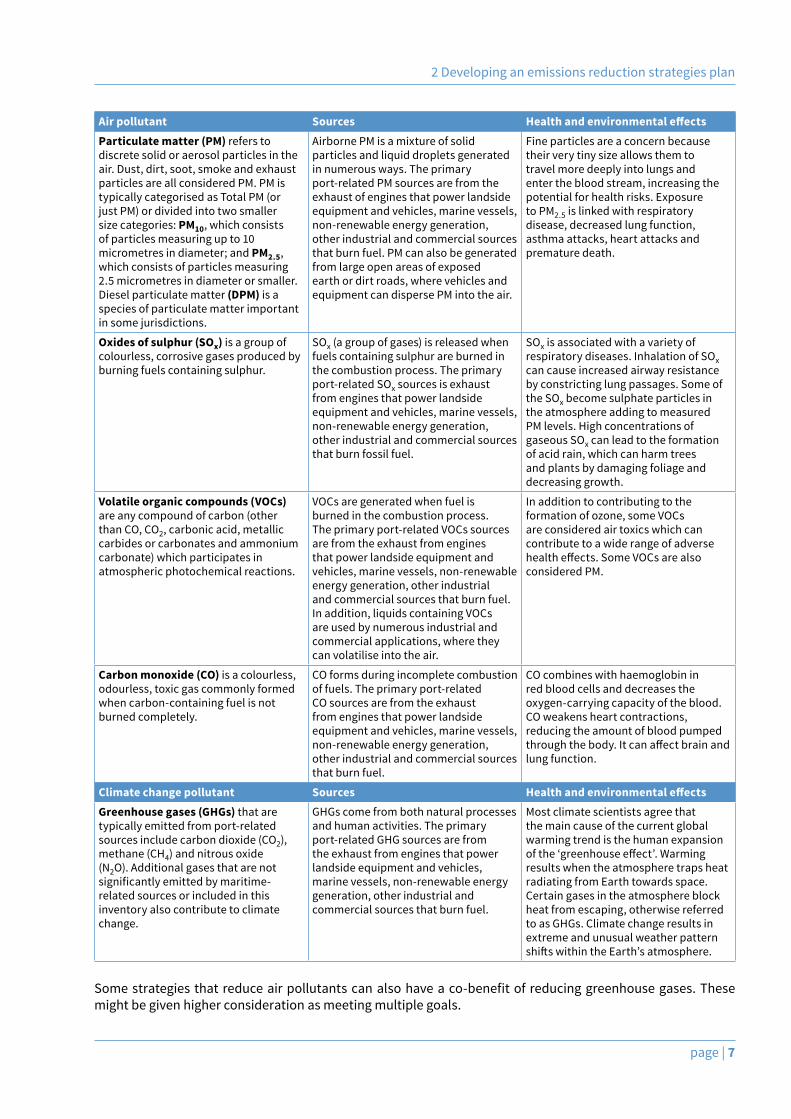
Air pollutant Sources Health and environmental effectsParticulate matter (PM) refers to discrete solid or aerosol particles in the air. Dust, dirt, soot, smoke and exhaust particles are all considered PM. PM is typically categorised as Total PM (or just PM) or divided into two smaller size categories: PM10, which consists of particles measuring up to 10 micrometres in diameter; and PM2.5, which consists of particles measuring 2.5 micrometres in diameter or smaller. Diesel particulate matter (DPM) is a species of particulate matter important in some jurisdictions.
Airborne PM is a mixture of solid particles and liquid droplets generated in numerous ways. The primary port-related PM sources are from the exhaust of engines that power landside equipment and vehicles, marine vessels, non-renewable energy generation, other industrial and commercial sources that burn fuel. PM can also be generated from large open areas of exposed earth or dirt roads, where vehicles and equipment can disperse PM into the air.
Fine particles are a concern because their very tiny size allows them to travel more deeply into lungs and enter the blood stream, increasing the potential for health risks. Exposure to PM2.5 is linked with respiratory disease, decreased lung function, asthma attacks, heart attacks and premature death.
Oxides of sulphur (SOx) is a group of colourless, corrosive gases produced by burning fuels containing sulphur.
SOx (a group of gases) is released when fuels containing sulphur are burned in the combustion process. The primary port-related SOx sources is exhaust from engines that power landside equipment and vehicles, marine vessels, non-renewable energy generation, other industrial and commercial sources that burn fossil fuel.
SOx is associated with a variety of respiratory diseases. Inhalation of SOx can cause increased airway resistance by constricting lung passages. Some of the SOx become sulphate particles in the atmosphere adding to measured PM levels. High concentrations of gaseous SOx can lead to the formation of acid rain, which can harm trees and plants by damaging foliage and decreasing growth.
Volatile organic compounds (VOCs) are any compound of carbon (other than CO, CO2, carbonic acid, metallic carbides or carbonates and ammonium carbonate) which participates in atmospheric photochemical reactions.
VOCs are generated when fuel is burned in the combustion process. The primary port-related VOCs sources are from the exhaust from engines that power landside equipment and vehicles, marine vessels, non-renewable energy generation, other industrial and commercial sources that burn fuel. In addition, liquids containing VOCs are used by numerous industrial and commercial applications, where they can volatilise into the air.
In addition to contributing to the formation of ozone, some VOCs are considered air toxics which can contribute to a wide range of adverse healtheffects.SomeVOCsarealsoconsidered PM.
Carbon monoxide (CO) is a colourless, odourless, toxic gas commonly formed when carbon-containing fuel is not burned completely.
CO forms during incomplete combustion of fuels. The primary port-related CO sources are from the exhaust from engines that power landside equipment and vehicles, marine vessels, non-renewable energy generation, other industrial and commercial sources that burn fuel.
CO combines with haemoglobin in red blood cells and decreases the oxygen-carrying capacity of the blood. CO weakens heart contractions, reducing the amount of blood pumped throughthebody.Itcanaffectbrainandlung function.
Climate change pollutant Sources Health and environmental effectsGreenhouse gases (GHGs) that are typically emitted from port-related sources include carbon dioxide (CO2), methane (CH4) and nitrous oxide (N2O). Additional gases that are not significantlyemittedbymaritime-related sources or included in this inventory also contribute to climate change.
GHGs come from both natural processes and human activities. The primary port-related GHG sources are from the exhaust from engines that power landside equipment and vehicles, marine vessels, non-renewable energy generation, other industrial and commercial sources that burn fuel.
Most climate scientists agree that the main cause of the current global warming trend is the human expansion ofthe‘greenhouseeffect’.Warmingresults when the atmosphere traps heat radiating from Earth towards space. Certain gases in the atmosphere block heat from escaping, otherwise referred to as GHGs. Climate change results in extreme and unusual weather pattern shiftswithintheEarth’satmosphere.
Somestrategies that reduceairpollutantscanalsohaveaco-benefitof reducinggreenhousegases.Thesemight be given higher consideration as meeting multiple goals.
Guide No.2: Development of port emissions reduction strategies
8 | page
2.3 Set pollutant reduction goals
An ERS plan should include emissions reduction objectives and targets. These are the goals the plan strives to achieve. These should be targets that can be tracked and measured. In cases where the goals are set based on the use of emerging and not yet proven technologies, it may be helpful to set interim targets to help measure the progress and status of the emerging technology.
A target may be set for one or more of the pollutants. For instance, a port might set itself a goal to reduce PM by 85% from a baseline within 10 years. This goal could be applied across all source categories. Emissions controlmeasureswouldneedtobedevelopedthataimedtoachievesignificantreductionsinPMfromthosesource categories responsible for highest emissions of PM. Alternatively, a goal may be set for a particular emissions source category. For example, a port might set itself a target to convert all diesel-powered cargo handling equipment to electric. This kind of goal would be applied to a particular source category and may not necessarilyincludeaspecificpollutantreductiongoal.Thisapproachmightresultinseveralgoals,oneforeachsource category.
A key consideration in goal setting is the feasibility of technological and operational changes, as well as the availability of funding to make the required investments. Failure to properly consider these elements canimpedesuccessful implementationoftheERS.Oftenit istemptingtosetover-ambitiousgoalswiththeintention of sending a signal to encourage private investment in technology development. This approach is usuallyonly successful if theporthasadominantmarketpositionandprovides significant funding for thedevelopment and demonstration of technologies. Another key consideration is the scope of operations the goals are meant to target. Most ports do not own or operate the majority of emissions sources, instead leasing facilities to private operators. Third parties almost always control seagoing vessels. A successful ERS should clearly delineate which scopes of operation (i.e. only emissions sources under direct port control vs. emissions sources under tenant or third-party control) are targeted, and should consider the challenges associated with settingemissionsreductiongoalsforoperationsoutsideoftheport’sdirectcontrol.
2.4 Evaluate emissions inventory data
Understanding port-related emissions sources and their operational profiles is key to the evaluation ofpotential emissions control measures for inclusion in an ERS plan. A detailed emissions inventory is one of the best ways to gain understanding of both emissions sources and their operations. With the pollutants selected andahierarchyset,reviewoftheemissionsinventoryleadstotheidentificationoftheequipmentandvesselsthataresignificantcontributorstoeithertotalorindividualsourcecategoryemissions.
Key information that should be reviewed from the emissions inventory include, but are not limited to: emissions source type, energy consumption (typically in kilowatt-hours or kWh), engine age, engine size (typically in kilowatts or kW), fuel type, population, owner/operator, residence time at the port, determination if the equipment or vessel is berthed at the port or just visits the port on a periodic basis, and associated emissions. A common metric used to assess emissions sources is emissions per kWh (e.g. tonnes PM/kWh, tonnes NOx/kWh, etc.). Further information on these key data elements is provided below:
■ Emissions source categories and types are important for aggregating emissions for further evaluation. Reductionstrategiesaretypicallyapplicabletoonlyspecificemissionssourcetypes.Port-relatedmobileemissions source categories include: seagoing vessels, domestic vessels, cargo handling equipment, on-road trucks, locomotives and terminal vehicles. Based on their operations within each of these source categories the mobile emissions sources can be further divided into following types:
■ Seagoing vessels – auto carrier, bulk (bulk self-load, bulk wood-chips, etc.), container, general cargo,liquidbulk(crude,product,asphalt,etc.),roll-on/roll-off,etc.
■ Domestic vessels–assisttugboats,tugboats,pushboats,pilotboats,tenders,police,fire,etc.
■ Cargo handling equipment – bulldozers, yard hostlers, cranes (rubber-tyred gantries, rail mountedgantries,quay,tracked,etc.),toppicks,sidepicks,forklifts,etc.
2 Developing an emissions reduction strategies plan
page | 9
■ Trucks – large trucks (that move loads or containers on-road), delivery trucks (smaller trucks delivering service goods), etc.
■ Locomotives – switching, line-haul, etc.
■ Terminal vehicles – pickup trucks, sedans, etc.
■ Energy consumption identifieswhich emissions sources are working themost; pollutant emissionsprovide information on which emissions sources generate the most emissions; and emissions per energy consumptionmetricprovidesinsightonrelativeemissionsefficiencyamongstemissionssources.Itisalso important to note the type of energy each equipment or vessel is using, since emissions reductions strategiesmaybelimitedtospecificenergytypes.
■ Engine age is typically an indicator of emissions level, since the older the engine, the more polluting it will be. Care should be taken to document both engine age and equipment age, since there are instances where these are not the same.
■ Engine size and technology can be critical when identifying candidate strategies, as strategies may only be applicable within certain rated engine power bandwidths (typically expressed in kW ratings), stroke (e.g. 2-stroke, 4-stroke, etc.), and engine technologies (e.g. mechanical, electronic control, etc.). Engine size also determines the amount of work. Bigger engines are capable of producing more work.
■ Fueltypes(oftendiesel,butcanincludeheavyfueloil,kerosene,marinedistillateoil,marinegasoil,naturalgas,methanol,electricity,etc.)havedifferentairpollutantandGHGemissionsprofiles.Thesemay vary across and within source categories. For diesel fuels, sulphur content (expressed as per cent sulphur) is an important parameter as it has direct implications for sulphur and PM emissions.
■ Population is important as it has direct ramifications on complexity, costs and effectiveness of anindividual control measure. Equipment and vessels can be categorised by type or subtype, and population counts of each are useful. For seagoing vessels, it is also important to assess the number ofcallsbyvesseltoidentifythefrequentcallerswithinthefleet(population)astheremightbeneedto consider a distinction in the application of control measures between frequent and non-frequent callers.
■ Data on the owner/operator of each emissions source is important as it will identify if the port has ownership/control over the targeted source or if it is the under control of a tenant or third party. This has implications on stakeholder outreach and the design and implementation of individual control measures.
■ Residence time at port is an important consideration since equipment and vessels can be either home-ported or transient. There are cases where equipment or vessels are moved between terminals or to differentportsoverthecourseofayearorseveralyears.Itisnotoptimaltoimplementanemissionscontrolmeasureonpiecesofequipmentthatarelikelytobemovedfromtheportaftertheinvestmentismade.Thisisoneofthemostsignificantchallengesforship-basedcontrolmeasuresandcanbeasignificantissuefortheothersourcecategoriesaswell.
2.5 Review programmes implemented by othersOncethepollutantprioritiesareidentifiedandgoalsareset,itisadvantageoustoevaluatetheworkofotherports, particularly those that have addressed similar pollution problems. In addition to reviewing other port emissions reduction programmes that are publicly available, it is strongly recommended that outreach be madetofindotherportsthatmaybeundertakinganERSthatmaynotyetbepublic.Theseeffortscanprovideopportunities to learn about best practices in goal setting, evaluation of candidate strategies, lessons learned, and other key elements in the success or failure of the implementation of an ERS plan. This information both helps in the implementation of mobile source emissions control measures and helps avoid poor results. It is important to understand that not all emissions control measures implemented at ports have been successful in meeting the stated emissions reduction goals, and that best-practice sharing among ports can increase the rate of successful ERS implementation.
Guide No.2: Development of port emissions reduction strategies
10 | page
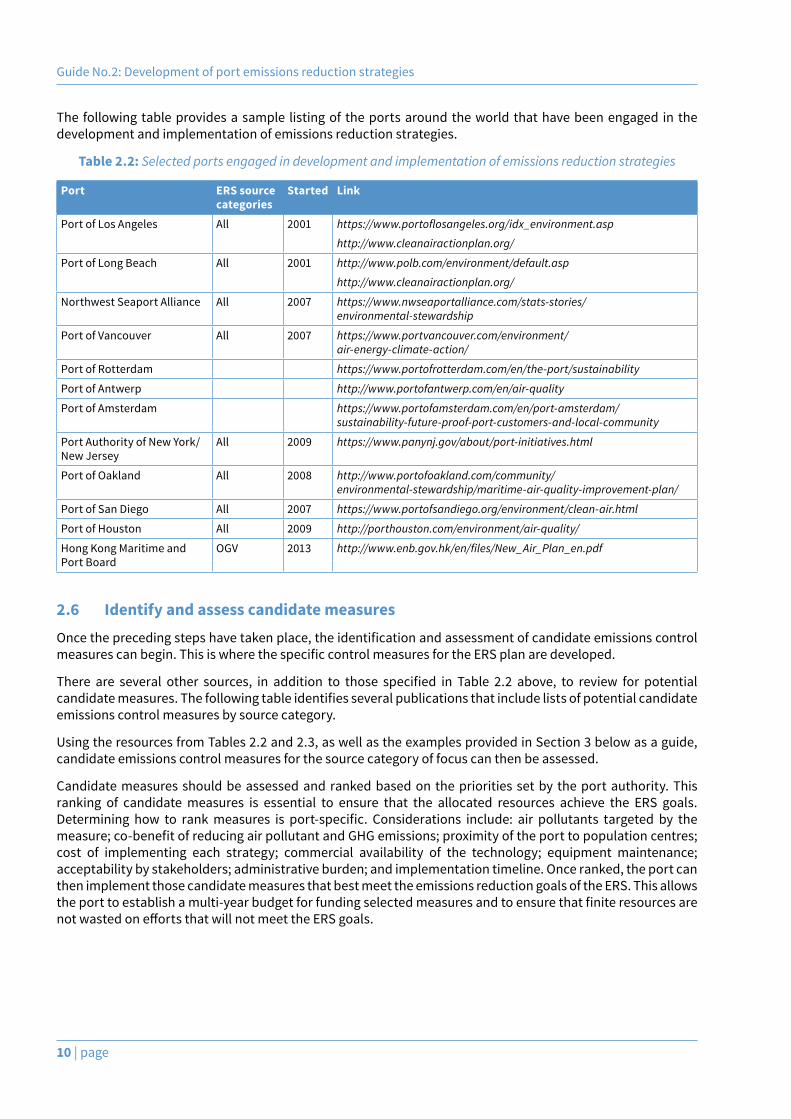
The following table provides a sample listing of the ports around the world that have been engaged in the development and implementation of emissions reduction strategies.
Table 2.2: Selected ports engaged in development and implementation of emissions reduction strategies
Port ERS source categories
Started Link
Port of Los Angeles All 2001 https://www.portoflosangeles.org/idx_environment.asp
http://www.cleanairactionplan.org/
Port of Long Beach All 2001 http://www.polb.com/environment/default.asp
http://www.cleanairactionplan.org/
Northwest Seaport Alliance All 2007 https://www.nwseaportalliance.com/stats-stories/environmental-stewardship
Port of Vancouver All 2007 https://www.portvancouver.com/environment/air-energy-climate-action/
Port of Rotterdam https://www.portofrotterdam.com/en/the-port/sustainability
Port of Antwerp http://www.portofantwerp.com/en/air-quality
Port of Amsterdam https://www.portofamsterdam.com/en/port-amsterdam/sustainability-future-proof-port-customers-and-local-community
Port Authority of New York/New Jersey
All 2009 https://www.panynj.gov/about/port-initiatives.html
Port of Oakland All 2008 http://www.portofoakland.com/community/environmental-stewardship/maritime-air-quality-improvement-plan/
Port of San Diego All 2007 https://www.portofsandiego.org/environment/clean-air.html
Port of Houston All 2009 http://porthouston.com/environment/air-quality/
Hong Kong Maritime and Port Board
OGV 2013 http://www.enb.gov.hk/en/files/New_Air_Plan_en.pdf
2.6 Identify and assess candidate measuresOncetheprecedingstepshavetakenplace,theidentificationandassessmentofcandidateemissionscontrolmeasurescanbegin.ThisiswherethespecificcontrolmeasuresfortheERSplanaredeveloped.
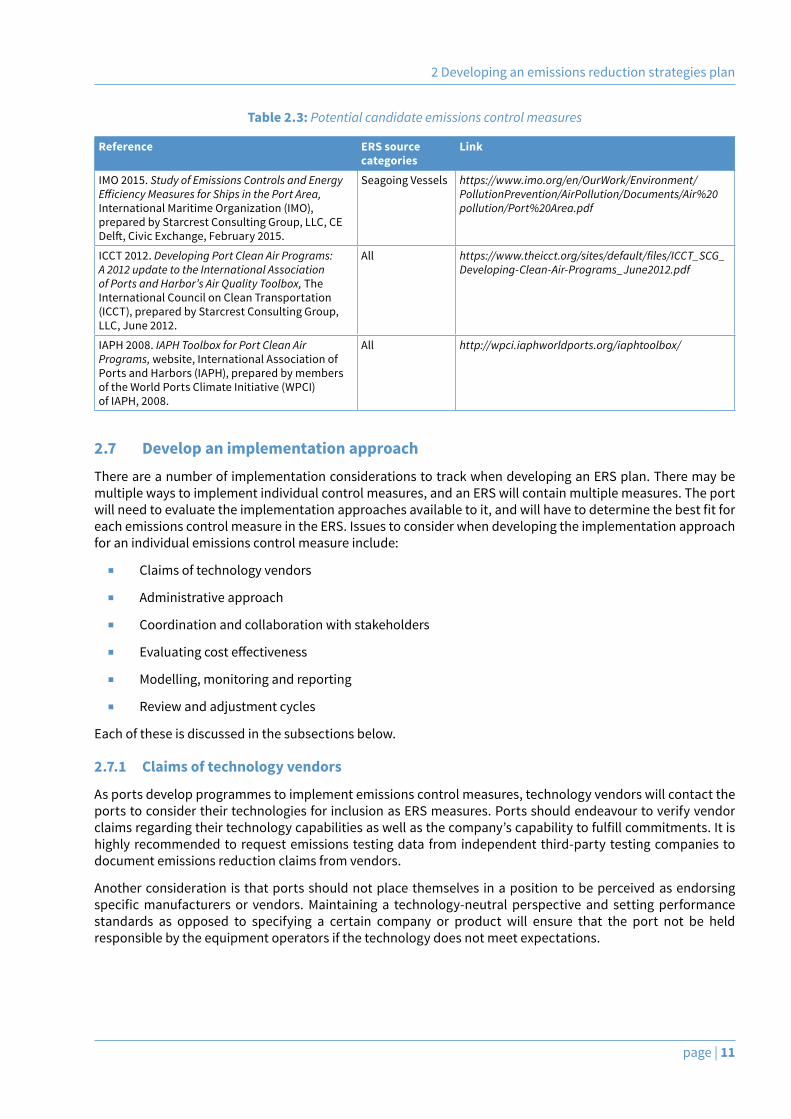
There are several other sources, in addition to those specified in Table 2.2 above, to review for potentialcandidatemeasures.Thefollowingtableidentifiesseveralpublicationsthatincludelistsofpotentialcandidateemissions control measures by source category.
Using the resources from Tables 2.2 and 2.3, as well as the examples provided in Section 3 below as a guide, candidate emissions control measures for the source category of focus can then be assessed.
Candidate measures should be assessed and ranked based on the priorities set by the port authority. This ranking of candidate measures is essential to ensure that the allocated resources achieve the ERS goals. Determining how to rankmeasures is port-specific. Considerations include: air pollutants targeted by themeasure;co-benefitofreducingairpollutantandGHGemissions;proximityoftheporttopopulationcentres;cost of implementing each strategy; commercial availability of the technology; equipment maintenance; acceptability by stakeholders; administrative burden; and implementation timeline. Once ranked, the port can then implement those candidate measures that best meet the emissions reduction goals of the ERS. This allows theporttoestablishamulti-yearbudgetforfundingselectedmeasuresandtoensurethatfiniteresourcesarenotwastedoneffortsthatwillnotmeettheERSgoals.
2 Developing an emissions reduction strategies plan
page | 11
Table 2.3: Potential candidate emissions control measures
Reference ERS source categories
Link
IMO 2015. Study of Emissions Controls and Energy Efficiency Measures for Ships in the Port Area, International Maritime Organization (IMO), prepared by Starcrest Consulting Group, LLC, CE Delft,CivicExchange,February2015.
Seagoing Vessels https://www.imo.org/en/OurWork/Environment/PollutionPrevention/AirPollution/Documents/Air%20pollution/Port%20Area.pdf
ICCT 2012. Developing Port Clean Air Programs: A 2012 update to the International Association of Ports and Harbor’s Air Quality Toolbox, The International Council on Clean Transportation (ICCT), prepared by Starcrest Consulting Group, LLC, June 2012.
All https://www.theicct.org/sites/default/files/ICCT_SCG_Developing-Clean-Air-Programs_June2012.pdf
IAPH 2008. IAPH Toolbox for Port Clean Air Programs, website, International Association of Ports and Harbors (IAPH), prepared by members of the World Ports Climate Initiative (WPCI) of IAPH, 2008.
All http://wpci.iaphworldports.org/iaphtoolbox/
2.7 Develop an implementation approachThere are a number of implementation considerations to track when developing an ERS plan. There may be multiple ways to implement individual control measures, and an ERS will contain multiple measures. The port willneedtoevaluatetheimplementationapproachesavailabletoit,andwillhavetodeterminethebestfitforeach emissions control measure in the ERS. Issues to consider when developing the implementation approach for an individual emissions control measure include:
■ Claims of technology vendors
■ Administrative approach
■ Coordination and collaboration with stakeholders
■ Evaluatingcosteffectiveness
■ Modelling, monitoring and reporting
■ Review and adjustment cycles
Each of these is discussed in the subsections below.
2.7.1 Claims of technology vendors
As ports develop programmes to implement emissions control measures, technology vendors will contact the ports to consider their technologies for inclusion as ERS measures. Ports should endeavour to verify vendor claimsregardingtheirtechnologycapabilitiesaswellasthecompany’scapabilitytofulfillcommitments.Itishighly recommended to request emissions testing data from independent third-party testing companies to document emissions reduction claims from vendors.
Another consideration is that ports should not place themselves in a position to be perceived as endorsing specificmanufacturers or vendors.Maintaining a technology-neutral perspective and setting performancestandards as opposed to specifying a certain company or product will ensure that the port not be held responsible by the equipment operators if the technology does not meet expectations.
Guide No.2: Development of port emissions reduction strategies
12 | page
2.7.2 Administrative approach
The ERS plan should address both the technical and administrative approaches necessary to reduce emissions from port operations. The technical approaches are the various emissions control measures that can be applied toequipmentoroperations,whichareidentifiedandevaluatedasdiscussedinsection2.6.Theadministrativeapproaches are the various ways that the emissions control measures in the ERS plan are implemented.
Portsaroundtheworldhavedifferentadministrativeorganisations.Someareprivatelyoperatedbusinesses.Some ports are government run, with or without regulatory powers. Others are public-private partnerships. Some generate revenue that they then control to be used for operational or environmental programmes, while others generate revenue that is transferred to the state, which then controls allocation of funding for operations.Eachofthesedifferentbusinessmodelsrequiresadifferentadministrativeapproach.
Some of the implementation approaches employed by other ports around the world include:
■ Terminallease/agreementmodifications
■ Tariffchanges
■ Incentives/disincentives
■ Voluntary adoption
Eachportwilldeterminethemosteffectiveadministrativeapproachesfortheimplementationoftheindividualemissions controlmeasures. Thesedifferent implementation approaches shouldbe assessed early on anddiscussed in the ERS plan. A combination of approaches will probably be necessary to implement the various measures in the plan, particularly if multiple source categories are involved.
The Port of Los Angeles and the Port of Long Beach have stated in their Clean Air Action Plan “that the most effective combination of implementation strategies includes a mix of lease requirements, tariff changes,incentives, grants, and voluntary efforts with an ultimate backstop of regulatory requirements. Thiscombinationprovidesredundancyinimplementingthe[goals]shouldanyoneoftheotherspecificstrategiesfail to be applied.”3
IftheERSplanhasbeendevelopedinsufficientdetail,implementationoftheemissionsreductionstrategyisa straightforward process. That is not to say that it is easy. Implementing emissions control measures will take substantialtimeandeffortinvolvingstaff,customers,equipmentmanufacturersandowners.Itisimportanttounderstandthatasignificantamountofworkwillbeneeded,inboththeshortandlongterm,toensurethatplan goals are met and maintained. These challenges drive the need for periodic evaluation, adjustment, and updates of the ERS plan.
2.7.3 Coordination and collaboration with stakeholders
A communication plan will specify how the ERS plan is to be explained to various audiences and will determine keymessaging.Dependingonhowtheport isorganised,themessagemayneedtobeadaptedtodifferentgroups within the organisation. The same applies to communicating with stakeholders outside of the port administration – customers, tenants, business partners, local residents and the port community.
2.7.4 Evaluating cost effectiveness
Cost-effectivenessanalysis(CEA)isanevaluationapproachthatprovidesport,governmentandenvironmentalpollution control agencies with a tool to compare the relative costs of two or more emissions control measures andtheireffects,oroutcomes.CEAisparticularlyhelpfulwhencomparingcontrolmeasuresassociatedwithan individual source category.
3 SPBP 2010. San Pedro Bay Ports Clean Air Action Plan, 2010 Update; jointly prepared by the Port of Los Angeles and Port of Long Beach, October 2010.
2 Developing an emissions reduction strategies plan
page | 13
Theeffectsofacontrolmeasurearequantifiedintermsoftheamountofpollutantsreduced,inunitsofgrams,kilograms,pounds,tons,metrictonnes,etc.Costeffectivenessisusuallyevaluatedinratioofmonetaryunit/pollutant mass ($/ton, €/tonne, £/tonne), but some agencies prefer to compare measures using a pollutant mass/monetary unit ratio (pound/$, kilogram/€) or other variations including $/metric tonne for greenhouse gas reductions.Cost-effectivenessanalysisallowscompetingmeasurestoberankedbytheamountofemissionsreductionrelativetothefundinginvestment.Themostcost-effectivemeasuresarerankedasthebestchoice.
Important in this decision-making process, however, is the acknowledgement that while a measure might rankbelowothermeasuresbecause it is not themost cost-effective, the impactof themeasure stillmustbe considered when the measure stands on its own. If one measure out of a group of measures has a cost effectivenessof$1,000,000/ton(inotherwords,thecost is$1millionforeverytonofemissionsreduced), itwouldnotnormallybeimplementedwithoutsignificantqualitativejustification,sincethereareothermeasuresthathave cost effectiveness farbelow this level.However, if this is theonly controlmeasureavailableandfeasibletoaddressasignificantacutehealthriskaffectingasubstantialpopulation, itmightbeconsideredanyway.
Note that CEA as discussed herein is considered to be “prospective”, or an analysis that is undertaken in advance of selecting and implementing a measure. An evaluation approach that returns to the measure at its conclusion to assess actual measure results would prove useful to check measure results against original assumptions and expectations.Ifsubstantivelydifferent,lessonslearnedcanbeappliedinfutureimplementationefforts.
Refer to Annex 2 for a detailed discussion and sample calculations for CEA.
2.7.5 Modelling, monitoring and reporting
Itcanbehelpful tomodel thepotentialemissionsbenefitsexpectedfromtheERSplan.Usingthebaselineemissionsinventoryandapplyingcontrolmeasureassumptionsbasedonthespecificmeasuresandidentifiedtimeframes,onecanproduceanestimateofexpectedbenefits fromprogramme implementation.Thiswillserve as additional benchmarking for the programme.
In order to monitor the success of the various measures that are ultimately implemented, a system that is designed to track progress is essential. A tracking system that manages the ERS plan measure implementation will help ensure that the ERS plan targets are achieved over the assigned timeframe. As measures are implemented their effectiveness can be evaluated against predictions and expectations and, if necessary,modificationscanbemadetoimprovetheeffectivenessofthemeasures.Theabilitytofeedreal-worldresultsback into the ERS plan will enhance its chance for success.
Reporting is also helpful to document programme ERS plan progress and effectiveness for stakeholders.Reports on ERS plan implementation efforts, including both successful strategies and lessons learned areparticularly important so that other ports can learn about the strategies and assess if they can be replicated at theirportwiththesameeffectiveness.
2.7.6 Review and adjustment cycles
During implementation of the ERS plan, challenges will be encountered, and inevitably one or more measures will be delayed or only be partially implemented. These challenges should be documented, and a process should be developed to identify other ways to achieve the underlying goals of the ERS plan. The following steps generally take place:
■ Use a tracking system to monitor the progress of the ERS plan.
■ Evaluate how well the ERS plan is operating under the measures that have been established.
■ Measure the results of the emissions control measures.
■ Quantify the emissions that have been reduced and where operational performances have improved.
Information from the tracking system should be analysed at regular intervals. These intervals should be set up on a reasonable schedule. Committing to an overly aggressive schedule of updates may be counter-productive

Guide No.2: Development of port emissions reduction strategies
14 | page
in that theywill require staff resources.Milestonesand interimgoals shouldbe set toassessprogressandeffectiveness of each emissions controlmeasure. Fine-tuning ormajor changes can thenbe introduced asneeded to further improve the ERS plan. As measures are implemented, targets may need to be adjusted (e.g. once all trucks meet newer, stricter emissions standards, a new target could be implemented that focuses on advanced technologies, such as zero-emissions vehicles).
More broadly, periodic updates to the emissions inventory (for example, on an annual or biennial basis) providestheabilitytoobjectivelyreviewprogressandhighlightthemosteffectiveemissionscontrolmeasuresfor the ERS plan.
page | 15
3 Overview of emissions control measuresBuildingofftheemissionscontrolstrategyframeworksdevelopedintheIMO’sAirPollutionandEnergyEfficiencyStudies, Volume 2, Study of Emissions Control and Energy EfficiencyMeasures for Ships in the Port Area,4 the IAPH Environmental Ship Index (ESI),5 the Port of Long Beach (POLB) and Port of Los Angeles (POLA) San Pedro Bay Ports (SPBP) Clean Air Action Plan (CAAP),6 and other port-related emissions reduction strategies implemented by IAPH member ports, emissions control measures can be grouped into the following categories:
■ Equipment – physical changes to existing machinery and equipment or the replacement of older, dirtier equipmentwithnewer,cleanerandmoreefficientequipment,including:
■ Engine technologies
■ Boiler technologies
■ Emissionsreductiontechnologies(pre-andafter-treatment)
■ Equipment/engine replacement
■ Energy – measures related to the energy sources used by vessels and port equipment:
■ Energy sources and fuel types
■ Alternative power supply
■ Hybridisation
■ Operational–measuresrelatedtooperationalefficiencyimprovements:
■ Emissionssourceoperationalefficiencies
■ Terminaloperationalefficiencies
■ Portwideoperationalefficiencies
Measurescanbeimplementedindifferentways,includingnewpurchase,replacement,repowerandretrofit.
■ New purchase: A new ship, piece of equipment, or terminal infrastructure is designed with cleaner emissions and/or energy efficiencies inmind. Additions to a fleet aremade such that the cleanestavailable design is selected for the new purchase. A new purchase is sometimes referred to as a “new build”, and depending on the equipment type can sometimes be a lower cost approach, compared to repowerorretrofittoreduceemissions.Theusefulnessofthenewpurchaseapproachisthatavailabilityis limited by manufacturer schedules and the long lead-time necessary to place a new unit in service.
4 IMO 2015. Study of Emissions Controls and Energy Efficiency Measures for Ships in the Port Area; International Maritime Organization (IMO), prepared by Starcrest Consulting Group, LLC, CE Delft, Civic Exchange, February 2015, See http://www.imo.org/en/OurWork/Environment/PollutionPrevention/AirPollution/Documents/Air%20pollution/Port%20Area.pdf, cited February 2018. 5 IAPH 2018. Environmental Ship Index; website, International Association of Ports and Harbors (IAPH), prepared by members of the World Ports Sustainability Program (WPSP) of IAPH, 2018. See http://www.esi.wpci.nl/Public/Home, cited February 2018. 6 SPBP 2017. 2017 San Pedro Bay Ports Clean Air Action Plan Update; jointly prepared by the Port of Los Angeles and the Port of Long Beach, November 2017. See http://www.cleanairactionplan.org/, cited February 2018.
Guide No.2: Development of port emissions reduction strategies
16 | page
■ Replacement: Replacement expands the new purchase approach to include the removal of a similar vehicleorequipmentfromthefleet(i.e.theoldunitisrelocated,retiredorscrapped),inadditiontothepurchase of the cleaner replacement unit.
■ Repower: For a repower, the older, existing engine in a piece of equipment or vessel is removed from the unit and is replaced by a newer, cleaner engine or power plant that has reduced emissions.
■ Retrofit: Retrofitmeansthatemissionsreductionandenergyefficiencytechnologiesareaddedontoexistingpiecesofequipment,ships,etc.toreduceemissions.Retrofitsdonotinvolveremovaloftheengineasisdoneinarepower.Forvessels,retrofitsmaybemoreexpensivethannewbuildssinceitisdifficulttomodifyexistingvesselstoreduceemissions(verylimitedengineroomspace,compatibilityissues, etc.).However, for applicationswhere retrofits are feasible (suchason-roadequipment andsomenon-roadequipment),theapproachcanbefasterandprovidesimilarbenefitsasnewbuilds.
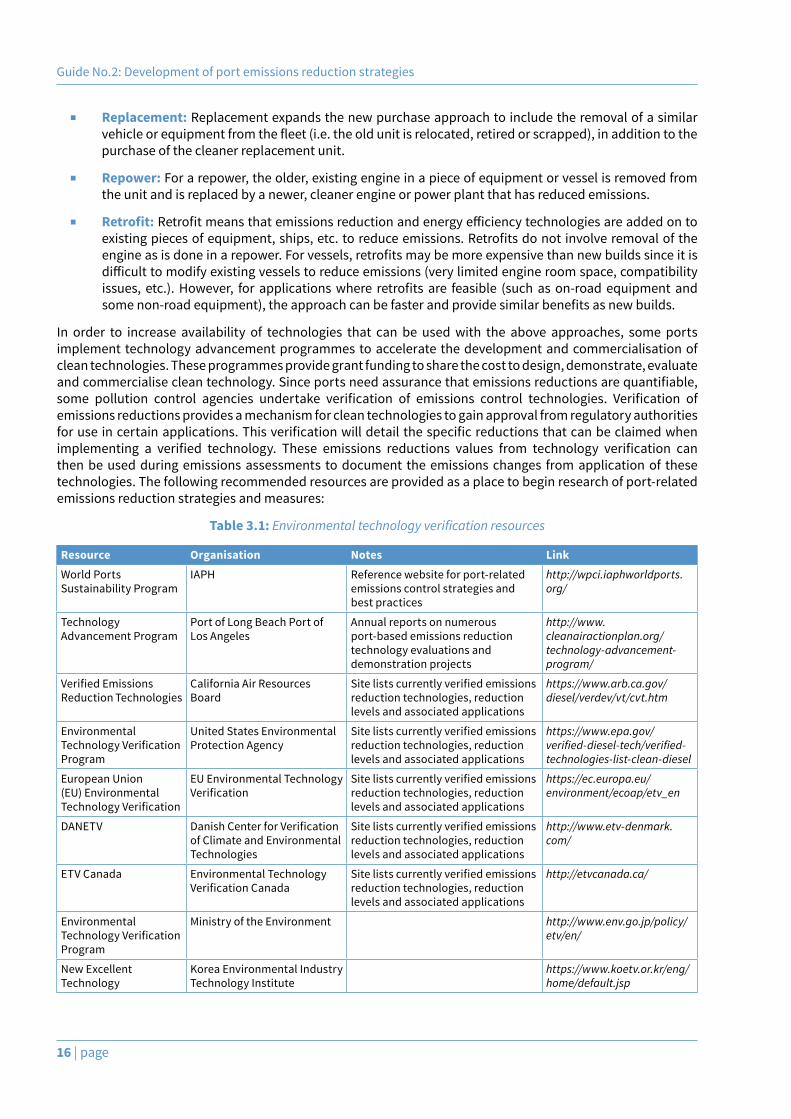
In order to increase availability of technologies that can be used with the above approaches, some ports implement technology advancement programmes to accelerate the development and commercialisation of clean technologies. These programmes provide grant funding to share the cost to design, demonstrate, evaluate andcommercialisecleantechnology.Sinceportsneedassurancethatemissionsreductionsarequantifiable,some pollution control agencies undertake verification of emissions control technologies. Verification ofemissions reductions provides a mechanism for clean technologies to gain approval from regulatory authorities foruseincertainapplications.Thisverificationwilldetailthespecificreductionsthatcanbeclaimedwhenimplementing a verified technology. These emissions reductions values from technology verification canthen be used during emissions assessments to document the emissions changes from application of these technologies. The following recommended resources are provided as a place to begin research of port-related emissions reduction strategies and measures:
Table 3.1: Environmental technology verification resources
Resource Organisation Notes LinkWorld Ports Sustainability Program
IAPH Reference website for port-related emissions control strategies and best practices
http://wpci.iaphworldports.org/
Technology Advancement Program
Port of Long Beach Port of Los Angeles
Annual reports on numerous port-based emissions reduction technology evaluations and demonstration projects
http://www.cleanairactionplan.org/technology-advancement-program/
VerifiedEmissionsReduction Technologies
California Air Resources Board
Sitelistscurrentlyverifiedemissionsreduction technologies, reduction levels and associated applications
https://www.arb.ca.gov/diesel/verdev/vt/cvt.htm
Environmental TechnologyVerificationProgram
United States Environmental Protection Agency
Sitelistscurrentlyverifiedemissionsreduction technologies, reduction levels and associated applications
https://www.epa.gov/verified-diesel-tech/verified-technologies-list-clean-diesel
European Union (EU) Environmental TechnologyVerification
EU Environmental Technology Verification
Sitelistscurrentlyverifiedemissionsreduction technologies, reduction levels and associated applications
https://ec.europa.eu/environment/ecoap/etv_en
DANETV DanishCenterforVerificationof Climate and Environmental Technologies
Sitelistscurrentlyverifiedemissionsreduction technologies, reduction levels and associated applications
http://www.etv-denmark.com/
ETV Canada Environmental Technology VerificationCanada
Sitelistscurrentlyverifiedemissionsreduction technologies, reduction levels and associated applications
http://etvcanada.ca/
Environmental TechnologyVerificationProgram
Ministry of the Environment http://www.env.go.jp/policy/etv/en/
New Excellent Technology
Korea Environmental Industry Technology Institute
https://www.koetv.or.kr/eng/home/default.jsp
3 Overview of emissions control measures
page | 17
3.1 Equipment measures
Due to the dominance of diesel fuelled equipment usage in port-related operations, port-related equipment emissions reduction measures commonly focus on reducing emissions from diesel fuel oil and diesel fuelled enginesandboilersthrough improvements inengineandboiler technologies, installationofpre-andafter-treatment engine emissions reduction technologies, and the replacement of older, dirtier engines with newer, cleaner engines. Note that equipment measures can sometimes lead to significant reductions in certaintargeted pollutant emissions while potentially increasing other pollutant emissions. For instance, selective catalytic reduction units can significantly reduce NOx emissions at the expense of energy consumption and increased GHG emissions. In addition, some technologies are only effective under certain operatingconditions/duty cycles; therefore, it is important to ensure compatibility not only between the technology and the equipment, but also between the technology and the duty cycles under which the equipment operates (i.e. load, engine temperature, etc.).
Equipment measures are usually developed for a specific type of equipment within an emissions sourcecategoryandtheytargetspecificpollutantemissions.Enginemeasuresareofteninitiallydesignedforaspecificemissions source category and are then adapted and transferred to other emissions source categories. For example,dieselparticulatefilters,whichareanafter-treatmenttechnology,weredevelopedforsmallerdiesel-powered cargo handling equipment and then re-engineered to work on larger cargo handling equipment, on-road trucks, and locomotive diesel engines, all having a wide range of engine power ratings and duty cycles.
Below is a selection of examples, by emissions source category, of equipment control measures that have been successfully implemented at ports:
3.1.1 Seagoing vessels
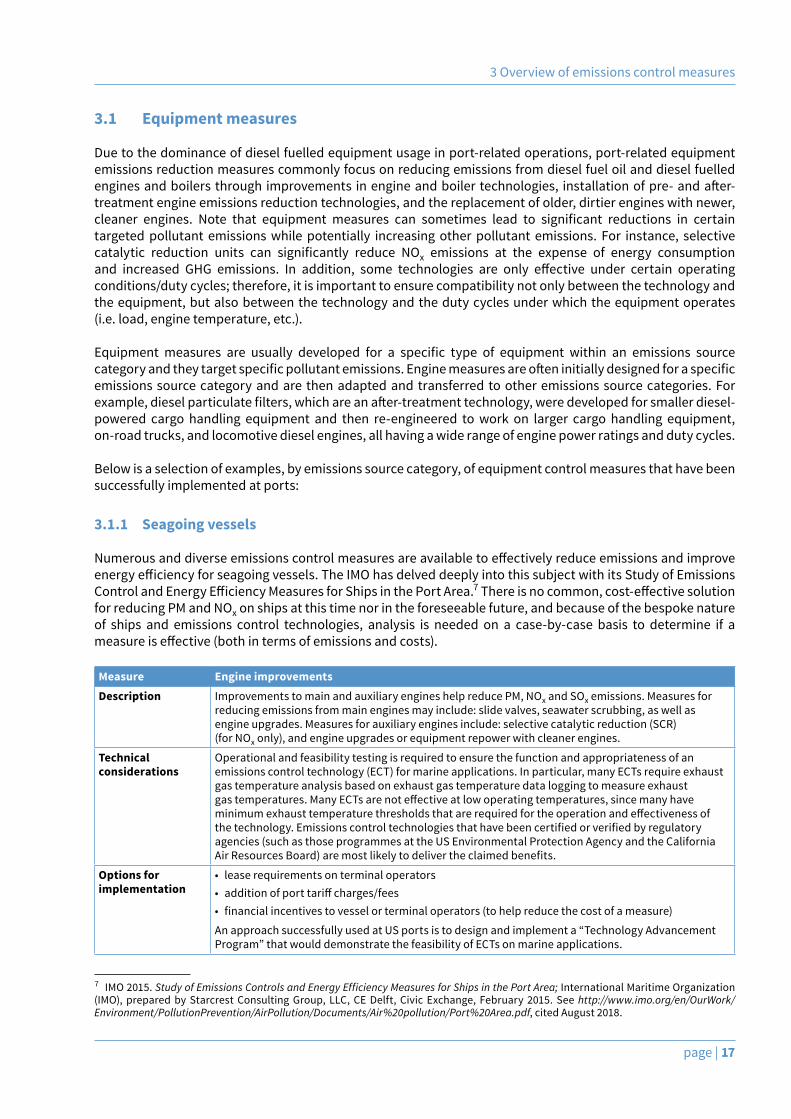
Numerousanddiverseemissionscontrolmeasuresareavailabletoeffectivelyreduceemissionsandimproveenergyefficiencyforseagoingvessels.TheIMOhasdelveddeeplyintothissubjectwithitsStudyofEmissionsControlandEnergyEfficiencyMeasuresforShipsinthePortArea.7Thereisnocommon,cost-effectivesolutionfor reducing PM and NOx on ships at this time nor in the foreseeable future, and because of the bespoke nature of ships and emissions control technologies, analysis is needed on a case-by-case basis to determine if a measureiseffective(bothintermsofemissionsandcosts).
Measure Engine improvementsDescription Improvements to main and auxiliary engines help reduce PM, NOx and SOx emissions. Measures for
reducing emissions from main engines may include: slide valves, seawater scrubbing, as well as engine upgrades. Measures for auxiliary engines include: selective catalytic reduction (SCR) (for NOx only), and engine upgrades or equipment repower with cleaner engines.
Technical considerations
Operational and feasibility testing is required to ensure the function and appropriateness of an emissions control technology (ECT) for marine applications. In particular, many ECTs require exhaust gas temperature analysis based on exhaust gas temperature data logging to measure exhaust gastemperatures.ManyECTsarenoteffectiveatlowoperatingtemperatures,sincemanyhaveminimumexhausttemperaturethresholdsthatarerequiredfortheoperationandeffectivenessofthetechnology.Emissionscontroltechnologiesthathavebeencertifiedorverifiedbyregulatoryagencies (such as those programmes at the US Environmental Protection Agency and the California AirResourcesBoard)aremostlikelytodelivertheclaimedbenefits.
Options for implementation
• lease requirements on terminal operators • additionofporttariffcharges/fees• financialincentivestovesselorterminaloperators(tohelpreducethecostofameasure)
An approach successfully used at US ports is to design and implement a “Technology Advancement Program” that would demonstrate the feasibility of ECTs on marine applications.
7 IMO 2015. Study of Emissions Controls and Energy Efficiency Measures for Ships in the Port Area; International Maritime Organization (IMO), prepared by Starcrest Consulting Group, LLC, CE Delft, Civic Exchange, February 2015. See http://www.imo.org/en/OurWork/Environment/PollutionPrevention/AirPollution/Documents/Air%20pollution/Port%20Area.pdf, cited August 2018.
Guide No.2: Development of port emissions reduction strategies
18 | page
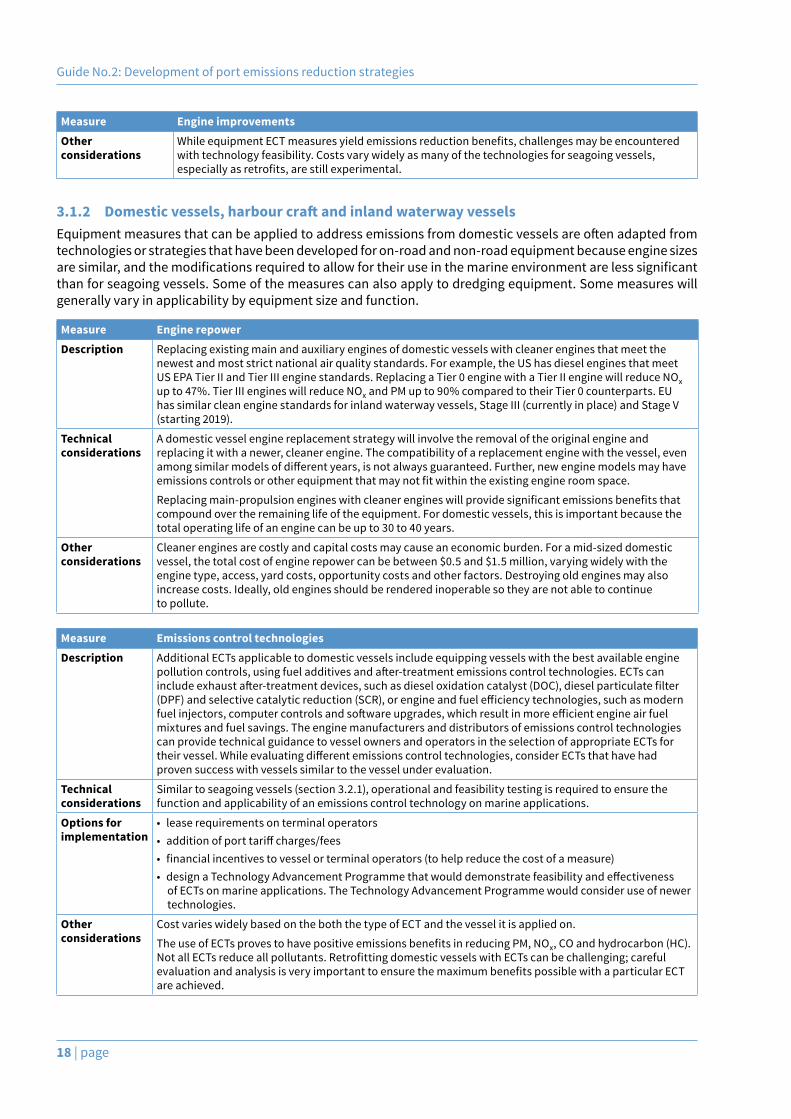
Measure Engine improvementsOther considerations
WhileequipmentECTmeasuresyieldemissionsreductionbenefits,challengesmaybeencounteredwith technology feasibility. Costs vary widely as many of the technologies for seagoing vessels, especiallyasretrofits,arestillexperimental.
3.1.2 Domestic vessels, harbour craft and inland waterway vesselsEquipmentmeasuresthatcanbeappliedtoaddressemissionsfromdomesticvesselsareoftenadaptedfromtechnologies or strategies that have been developed for on-road and non-road equipment because engine sizes aresimilar,andthemodificationsrequiredtoallowfortheiruseinthemarineenvironmentarelesssignificantthan for seagoing vessels. Some of the measures can also apply to dredging equipment. Some measures will generally vary in applicability by equipment size and function.
Measure Engine repowerDescription Replacing existing main and auxiliary engines of domestic vessels with cleaner engines that meet the
newest and most strict national air quality standards. For example, the US has diesel engines that meet US EPA Tier II and Tier III engine standards. Replacing a Tier 0 engine with a Tier II engine will reduce NOx up to 47%. Tier III engines will reduce NOx and PM up to 90% compared to their Tier 0 counterparts. EU has similar clean engine standards for inland waterway vessels, Stage III (currently in place) and Stage V (starting 2019).
Technical considerations
A domestic vessel engine replacement strategy will involve the removal of the original engine and replacing it with a newer, cleaner engine. The compatibility of a replacement engine with the vessel, even amongsimilarmodelsofdifferentyears,isnotalwaysguaranteed.Further,newenginemodelsmayhaveemissionscontrolsorotherequipmentthatmaynotfitwithintheexistingengineroomspace.
Replacingmain-propulsionengineswithcleanerengineswillprovidesignificantemissionsbenefitsthatcompound over the remaining life of the equipment. For domestic vessels, this is important because the total operating life of an engine can be up to 30 to 40 years.
Other considerations
Cleaner engines are costly and capital costs may cause an economic burden. For a mid-sized domestic vessel, the total cost of engine repower can be between $0.5 and $1.5 million, varying widely with the engine type, access, yard costs, opportunity costs and other factors. Destroying old engines may also increase costs. Ideally, old engines should be rendered inoperable so they are not able to continue to pollute.
Measure Emissions control technologiesDescription Additional ECTs applicable to domestic vessels include equipping vessels with the best available engine
pollutioncontrols,usingfueladditivesandafter-treatmentemissionscontroltechnologies.ECTscanincludeexhaustafter-treatmentdevices,suchasdieseloxidationcatalyst(DOC),dieselparticulatefilter(DPF)andselectivecatalyticreduction(SCR),orengineandfuelefficiencytechnologies,suchasmodernfuelinjectors,computercontrolsandsoftwareupgrades,whichresultinmoreefficientengineairfuelmixtures and fuel savings. The engine manufacturers and distributors of emissions control technologies can provide technical guidance to vessel owners and operators in the selection of appropriate ECTs for theirvessel.Whileevaluatingdifferentemissionscontroltechnologies,considerECTsthathavehadproven success with vessels similar to the vessel under evaluation.
Technical considerations
Similar to seagoing vessels (section 3.2.1), operational and feasibility testing is required to ensure the function and applicability of an emissions control technology on marine applications.
Options for implementation
• lease requirements on terminal operators• additionofporttariffcharges/fees• financialincentivestovesselorterminaloperators(tohelpreducethecostofameasure)• designaTechnologyAdvancementProgrammethatwoulddemonstratefeasibilityandeffectiveness
of ECTs on marine applications. The Technology Advancement Programme would consider use of newer technologies.
Other considerations
Cost varies widely based on the both the type of ECT and the vessel it is applied on.
TheuseofECTsprovestohavepositiveemissionsbenefitsinreducingPM,NOx, CO and hydrocarbon (HC). NotallECTsreduceallpollutants.RetrofittingdomesticvesselswithECTscanbechallenging;carefulevaluationandanalysisisveryimportanttoensurethemaximumbenefitspossiblewithaparticularECTare achieved.
3 Overview of emissions control measures
page | 19
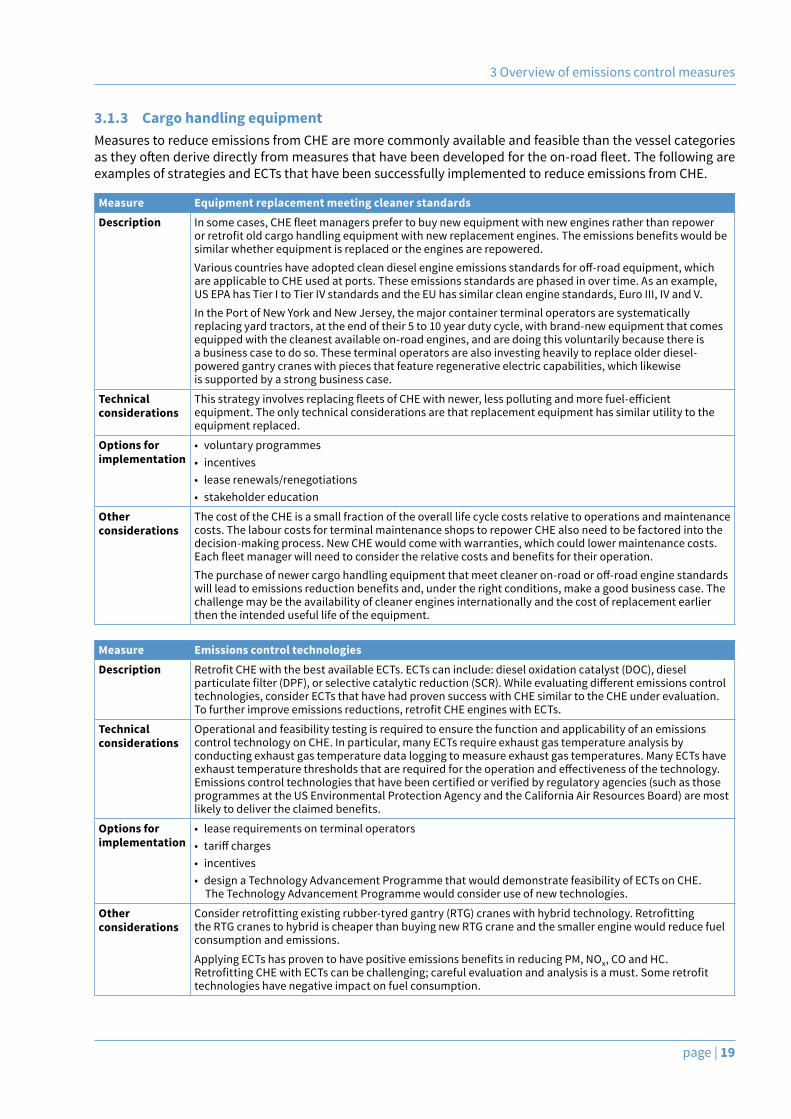
3.1.3 Cargo handling equipmentMeasures to reduce emissions from CHE are more commonly available and feasible than the vessel categories astheyoftenderivedirectlyfrommeasuresthathavebeendevelopedfortheon-roadfleet.Thefollowingareexamples of strategies and ECTs that have been successfully implemented to reduce emissions from CHE.
Measure Equipment replacement meeting cleaner standardsDescription Insomecases,CHEfleetmanagersprefertobuynewequipmentwithnewenginesratherthanrepower
orretrofitoldcargohandlingequipmentwithnewreplacementengines.Theemissionsbenefitswouldbesimilar whether equipment is replaced or the engines are repowered.Variouscountrieshaveadoptedcleandieselengineemissionsstandardsforoff-roadequipment,whichare applicable to CHE used at ports. These emissions standards are phased in over time. As an example, US EPA has Tier I to Tier IV standards and the EU has similar clean engine standards, Euro III, IV and V.In the Port of New York and New Jersey, the major container terminal operators are systematically replacing yard tractors, at the end of their 5 to 10 year duty cycle, with brand-new equipment that comes equipped with the cleanest available on-road engines, and are doing this voluntarily because there is a business case to do so. These terminal operators are also investing heavily to replace older diesel-powered gantry cranes with pieces that feature regenerative electric capabilities, which likewise is supported by a strong business case.
Technical considerations
ThisstrategyinvolvesreplacingfleetsofCHEwithnewer,lesspollutingandmorefuel-efficientequipment. The only technical considerations are that replacement equipment has similar utility to the equipment replaced.
Options for implementation
• voluntary programmes• incentives• lease renewals/renegotiations• stakeholder education
Other considerations
The cost of the CHE is a small fraction of the overall life cycle costs relative to operations and maintenance costs. The labour costs for terminal maintenance shops to repower CHE also need to be factored into the decision-making process. New CHE would come with warranties, which could lower maintenance costs. Eachfleetmanagerwillneedtoconsidertherelativecostsandbenefitsfortheiroperation.Thepurchaseofnewercargohandlingequipmentthatmeetcleaneron-roadoroff-roadenginestandardswillleadtoemissionsreductionbenefitsand,undertherightconditions,makeagoodbusinesscase.Thechallenge may be the availability of cleaner engines internationally and the cost of replacement earlier then the intended useful life of the equipment.
Measure Emissions control technologiesDescription RetrofitCHEwiththebestavailableECTs.ECTscaninclude:dieseloxidationcatalyst(DOC),diesel
particulatefilter(DPF),orselectivecatalyticreduction(SCR).Whileevaluatingdifferentemissionscontroltechnologies, consider ECTs that have had proven success with CHE similar to the CHE under evaluation. Tofurtherimproveemissionsreductions,retrofitCHEengineswithECTs.
Technical considerations
Operational and feasibility testing is required to ensure the function and applicability of an emissions control technology on CHE. In particular, many ECTs require exhaust gas temperature analysis by conducting exhaust gas temperature data logging to measure exhaust gas temperatures. Many ECTs have exhausttemperaturethresholdsthatarerequiredfortheoperationandeffectivenessofthetechnology.Emissionscontroltechnologiesthathavebeencertifiedorverifiedbyregulatoryagencies(suchasthoseprogrammes at the US Environmental Protection Agency and the California Air Resources Board) are most likelytodelivertheclaimedbenefits.
Options for implementation
• lease requirements on terminal operators• tariffcharges• incentives• design a Technology Advancement Programme that would demonstrate feasibility of ECTs on CHE.
The Technology Advancement Programme would consider use of new technologies.
Other considerations
Considerretrofittingexistingrubber-tyredgantry(RTG)craneswithhybridtechnology.Retrofittingthe RTG cranes to hybrid is cheaper than buying new RTG crane and the smaller engine would reduce fuel consumption and emissions.
ApplyingECTshasproventohavepositiveemissionsbenefitsinreducingPM,NOx, CO and HC. RetrofittingCHEwithECTscanbechallenging;carefulevaluationandanalysisisamust.Someretrofittechnologies have negative impact on fuel consumption.
Guide No.2: Development of port emissions reduction strategies
20 | page
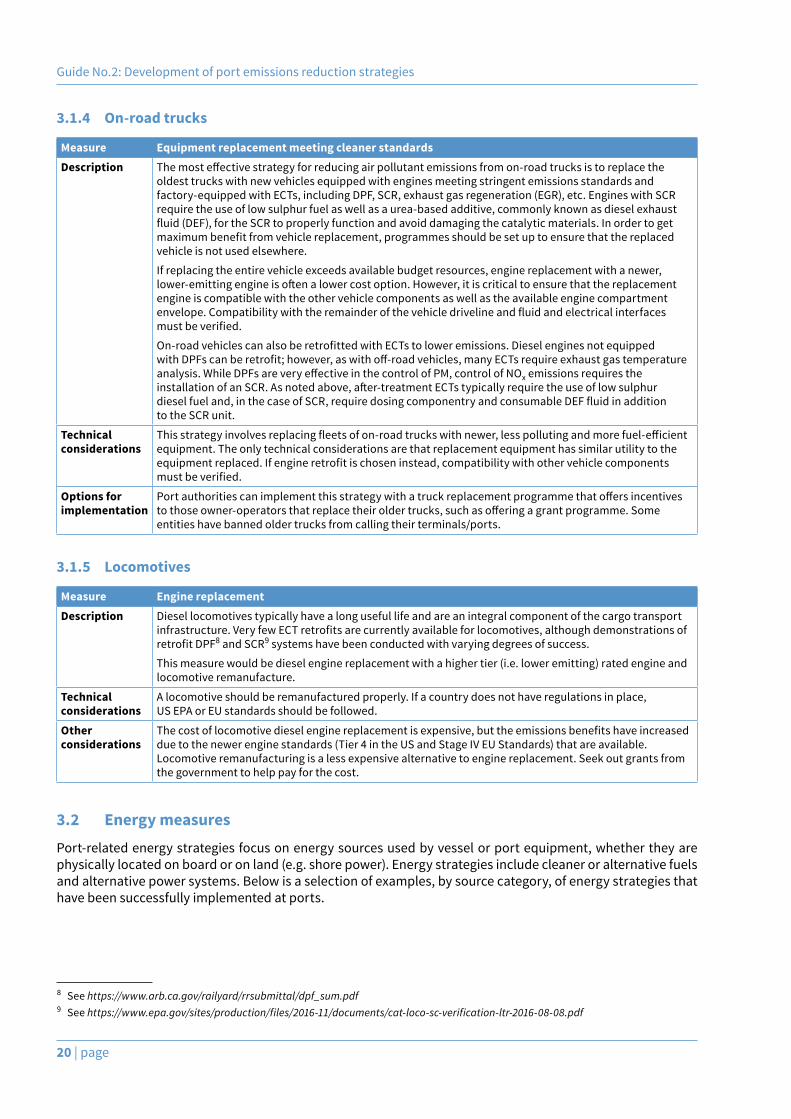
3.1.4 On-road trucks
Measure Equipment replacement meeting cleaner standardsDescription Themosteffectivestrategyforreducingairpollutantemissionsfromon-roadtrucksistoreplacethe
oldest trucks with new vehicles equipped with engines meeting stringent emissions standards and factory-equipped with ECTs, including DPF, SCR, exhaust gas regeneration (EGR), etc. Engines with SCR require the use of low sulphur fuel as well as a urea-based additive, commonly known as diesel exhaust fluid(DEF),fortheSCRtoproperlyfunctionandavoiddamagingthecatalyticmaterials.Inordertogetmaximumbenefitfromvehiclereplacement,programmesshouldbesetuptoensurethatthereplacedvehicle is not used elsewhere.
If replacing the entire vehicle exceeds available budget resources, engine replacement with a newer, lower-emittingengineisoftenalowercostoption.However,itiscriticaltoensurethatthereplacementengine is compatible with the other vehicle components as well as the available engine compartment envelope.Compatibilitywiththeremainderofthevehicledrivelineandfluidandelectricalinterfacesmustbeverified.
On-roadvehiclescanalsoberetrofittedwithECTstoloweremissions.DieselenginesnotequippedwithDPFscanberetrofit;however,aswithoff-roadvehicles,manyECTsrequireexhaustgastemperatureanalysis.WhileDPFsareveryeffectiveinthecontrolofPM,controlofNOx emissions requires the installationofanSCR.Asnotedabove,after-treatmentECTstypicallyrequiretheuseoflowsulphur dieselfueland,inthecaseofSCR,requiredosingcomponentryandconsumableDEFfluidinaddition to the SCR unit.
Technical considerations
Thisstrategyinvolvesreplacingfleetsofon-roadtruckswithnewer,lesspollutingandmorefuel-efficientequipment. The only technical considerations are that replacement equipment has similar utility to the equipmentreplaced.Ifengineretrofitischoseninstead,compatibilitywithothervehiclecomponentsmustbeverified.
Options for implementation
Portauthoritiescanimplementthisstrategywithatruckreplacementprogrammethatoffersincentivestothoseowner-operatorsthatreplacetheiroldertrucks,suchasofferingagrantprogramme.Someentities have banned older trucks from calling their terminals/ports.
3.1.5 Locomotives
Measure Engine replacementDescription Diesel locomotives typically have a long useful life and are an integral component of the cargo transport
infrastructure.VeryfewECTretrofitsarecurrentlyavailableforlocomotives,althoughdemonstrationsofretrofitDPF8 and SCR9 systems have been conducted with varying degrees of success.
This measure would be diesel engine replacement with a higher tier (i.e. lower emitting) rated engine and locomotive remanufacture.
Technical considerations
A locomotive should be remanufactured properly. If a country does not have regulations in place, US EPA or EU standards should be followed.
Other considerations
Thecostoflocomotivedieselenginereplacementisexpensive,buttheemissionsbenefitshaveincreaseddue to the newer engine standards (Tier 4 in the US and Stage IV EU Standards) that are available. Locomotive remanufacturing is a less expensive alternative to engine replacement. Seek out grants from the government to help pay for the cost.
3.2 Energy measuresPort-related energy strategies focus on energy sources used by vessel or port equipment, whether they are physically located on board or on land (e.g. shore power). Energy strategies include cleaner or alternative fuels and alternative power systems. Below is a selection of examples, by source category, of energy strategies that have been successfully implemented at ports.
8 See https://www.arb.ca.gov/railyard/rrsubmittal/dpf_sum.pdf 9 See https://www.epa.gov/sites/production/files/2016-11/documents/cat-loco-sc-verification-ltr-2016-08-08.pdf
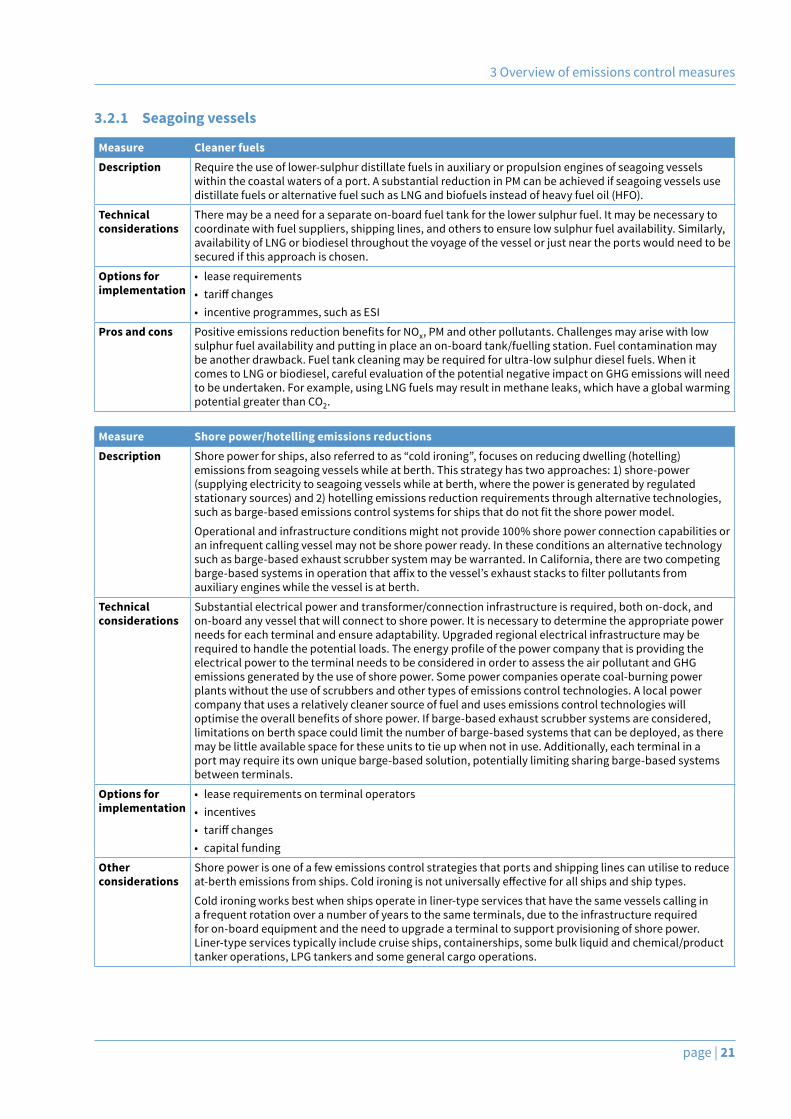
3 Overview of emissions control measures
page | 21
3.2.1 Seagoing vessels
Measure Cleaner fuelsDescription Require the use of lower-sulphur distillate fuels in auxiliary or propulsion engines of seagoing vessels
within the coastal waters of a port. A substantial reduction in PM can be achieved if seagoing vessels use distillate fuels or alternative fuel such as LNG and biofuels instead of heavy fuel oil (HFO).
Technical considerations
There may be a need for a separate on-board fuel tank for the lower sulphur fuel. It may be necessary to coordinate with fuel suppliers, shipping lines, and others to ensure low sulphur fuel availability. Similarly, availability of LNG or biodiesel throughout the voyage of the vessel or just near the ports would need to be secured if this approach is chosen.
Options for implementation
• lease requirements • tariffchanges• incentive programmes, such as ESI
Pros and cons PositiveemissionsreductionbenefitsforNOx, PM and other pollutants. Challenges may arise with low sulphur fuel availability and putting in place an on-board tank/fuelling station. Fuel contamination may be another drawback. Fuel tank cleaning may be required for ultra-low sulphur diesel fuels. When it comes to LNG or biodiesel, careful evaluation of the potential negative impact on GHG emissions will need to be undertaken. For example, using LNG fuels may result in methane leaks, which have a global warming potential greater than CO2.
Measure Shore power/hotelling emissions reductionsDescription Shore power for ships, also referred to as “cold ironing”, focuses on reducing dwelling (hotelling)
emissions from seagoing vessels while at berth. This strategy has two approaches: 1) shore-power (supplying electricity to seagoing vessels while at berth, where the power is generated by regulated stationary sources) and 2) hotelling emissions reduction requirements through alternative technologies, suchasbarge-basedemissionscontrolsystemsforshipsthatdonotfittheshorepowermodel.
Operational and infrastructure conditions might not provide 100% shore power connection capabilities or an infrequent calling vessel may not be shore power ready. In these conditions an alternative technology such as barge-based exhaust scrubber system may be warranted. In California, there are two competing barge-basedsystemsinoperationthataffixtothevessel’sexhauststackstofilterpollutantsfromauxiliary engines while the vessel is at berth.
Technical considerations
Substantial electrical power and transformer/connection infrastructure is required, both on-dock, and on-board any vessel that will connect to shore power. It is necessary to determine the appropriate power needs for each terminal and ensure adaptability. Upgraded regional electrical infrastructure may be requiredtohandlethepotentialloads.Theenergyprofileofthepowercompanythatisprovidingtheelectrical power to the terminal needs to be considered in order to assess the air pollutant and GHG emissions generated by the use of shore power. Some power companies operate coal-burning power plants without the use of scrubbers and other types of emissions control technologies. A local power company that uses a relatively cleaner source of fuel and uses emissions control technologies will optimisetheoverallbenefitsofshorepower.Ifbarge-basedexhaustscrubbersystemsareconsidered,limitations on berth space could limit the number of barge-based systems that can be deployed, as there may be little available space for these units to tie up when not in use. Additionally, each terminal in a port may require its own unique barge-based solution, potentially limiting sharing barge-based systems between terminals.
Options for implementation
• lease requirements on terminal operators• incentives• tariffchanges• capital funding
Other considerations
Shore power is one of a few emissions control strategies that ports and shipping lines can utilise to reduce at-berthemissionsfromships.Coldironingisnotuniversallyeffectiveforallshipsandshiptypes.
Cold ironing works best when ships operate in liner-type services that have the same vessels calling in a frequent rotation over a number of years to the same terminals, due to the infrastructure required for on-board equipment and the need to upgrade a terminal to support provisioning of shore power. Liner-type services typically include cruise ships, containerships, some bulk liquid and chemical/product tanker operations, LPG tankers and some general cargo operations.
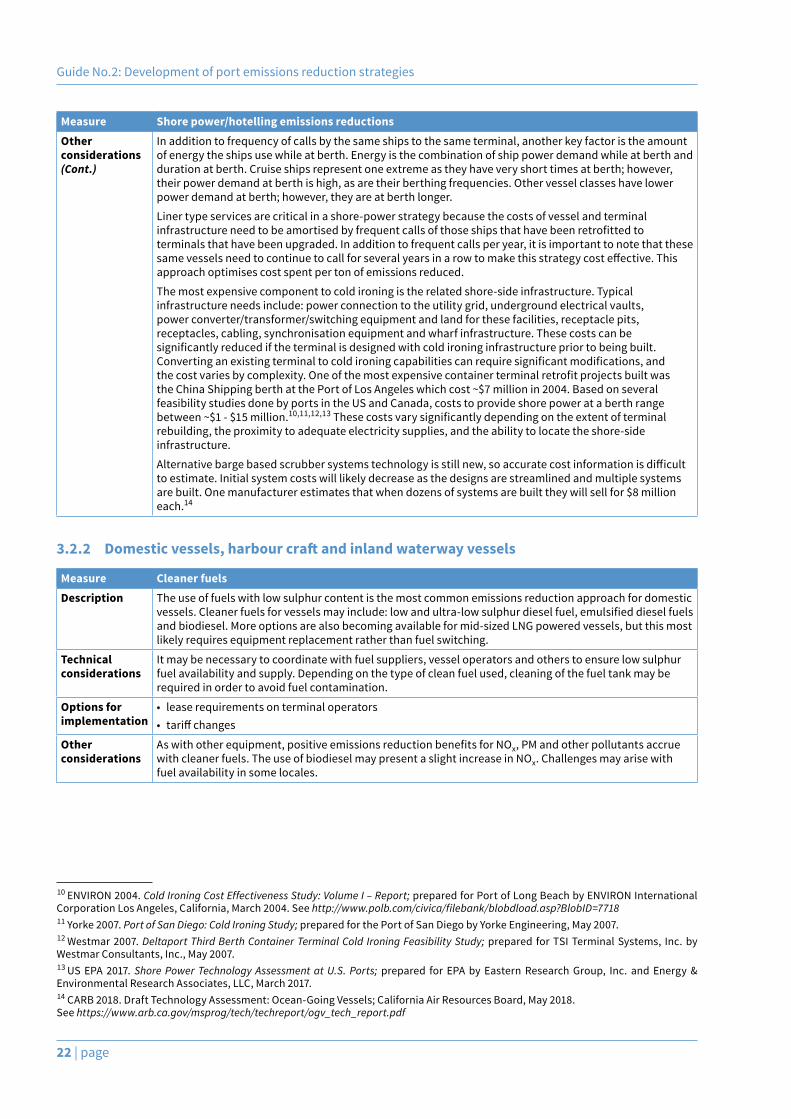
Guide No.2: Development of port emissions reduction strategies
22 | page
Measure Shore power/hotelling emissions reductionsOther considerations (Cont.)
In addition to frequency of calls by the same ships to the same terminal, another key factor is the amount of energy the ships use while at berth. Energy is the combination of ship power demand while at berth and duration at berth. Cruise ships represent one extreme as they have very short times at berth; however, their power demand at berth is high, as are their berthing frequencies. Other vessel classes have lower power demand at berth; however, they are at berth longer.
Liner type services are critical in a shore-power strategy because the costs of vessel and terminal infrastructureneedtobeamortisedbyfrequentcallsofthoseshipsthathavebeenretrofittedtoterminals that have been upgraded. In addition to frequent calls per year, it is important to note that these samevesselsneedtocontinuetocallforseveralyearsinarowtomakethisstrategycosteffective.Thisapproach optimises cost spent per ton of emissions reduced.
The most expensive component to cold ironing is the related shore-side infrastructure. Typical infrastructure needs include: power connection to the utility grid, underground electrical vaults, power converter/transformer/switching equipment and land for these facilities, receptacle pits, receptacles, cabling, synchronisation equipment and wharf infrastructure. These costs can be significantlyreducediftheterminalisdesignedwithcoldironinginfrastructurepriortobeingbuilt.Convertinganexistingterminaltocoldironingcapabilitiescanrequiresignificantmodifications,andthecostvariesbycomplexity.Oneofthemostexpensivecontainerterminalretrofitprojectsbuiltwasthe China Shipping berth at the Port of Los Angeles which cost ~$7 million in 2004. Based on several feasibility studies done by ports in the US and Canada, costs to provide shore power at a berth range between ~$1 - $15 million.10,11,12,13Thesecostsvarysignificantlydependingontheextentofterminalrebuilding, the proximity to adequate electricity supplies, and the ability to locate the shore-side infrastructure.
Alternativebargebasedscrubbersystemstechnologyisstillnew,soaccuratecostinformationisdifficultto estimate. Initial system costs will likely decrease as the designs are streamlined and multiple systems are built. One manufacturer estimates that when dozens of systems are built they will sell for $8 million each.14
3.2.2 Domestic vessels, harbour craft and inland waterway vessels
Measure Cleaner fuelsDescription The use of fuels with low sulphur content is the most common emissions reduction approach for domestic
vessels.Cleanerfuelsforvesselsmayinclude:lowandultra-lowsulphurdieselfuel,emulsifieddieselfuelsand biodiesel. More options are also becoming available for mid-sized LNG powered vessels, but this most likely requires equipment replacement rather than fuel switching.
Technical considerations
It may be necessary to coordinate with fuel suppliers, vessel operators and others to ensure low sulphur fuel availability and supply. Depending on the type of clean fuel used, cleaning of the fuel tank may be required in order to avoid fuel contamination.
Options for implementation
• lease requirements on terminal operators• tariffchanges
Other considerations
Aswithotherequipment,positiveemissionsreductionbenefitsforNOx, PM and other pollutants accrue with cleaner fuels. The use of biodiesel may present a slight increase in NOx. Challenges may arise with fuel availability in some locales.
10 ENVIRON 2004. Cold Ironing Cost Effectiveness Study: Volume I – Report; prepared for Port of Long Beach by ENVIRON International Corporation Los Angeles, California, March 2004. See http://www.polb.com/civica/filebank/blobdload.asp?BlobID=7718 11 Yorke 2007. Port of San Diego: Cold Ironing Study; prepared for the Port of San Diego by Yorke Engineering, May 2007. 12 Westmar 2007. Deltaport Third Berth Container Terminal Cold Ironing Feasibility Study; prepared for TSI Terminal Systems, Inc. by Westmar Consultants, Inc., May 2007. 13 US EPA 2017. Shore Power Technology Assessment at U.S. Ports; prepared for EPA by Eastern Research Group, Inc. and Energy & Environmental Research Associates, LLC, March 2017. 14 CARB 2018. Draft Technology Assessment: Ocean-Going Vessels; California Air Resources Board, May 2018. See https://www.arb.ca.gov/msprog/tech/techreport/ogv_tech_report.pdf
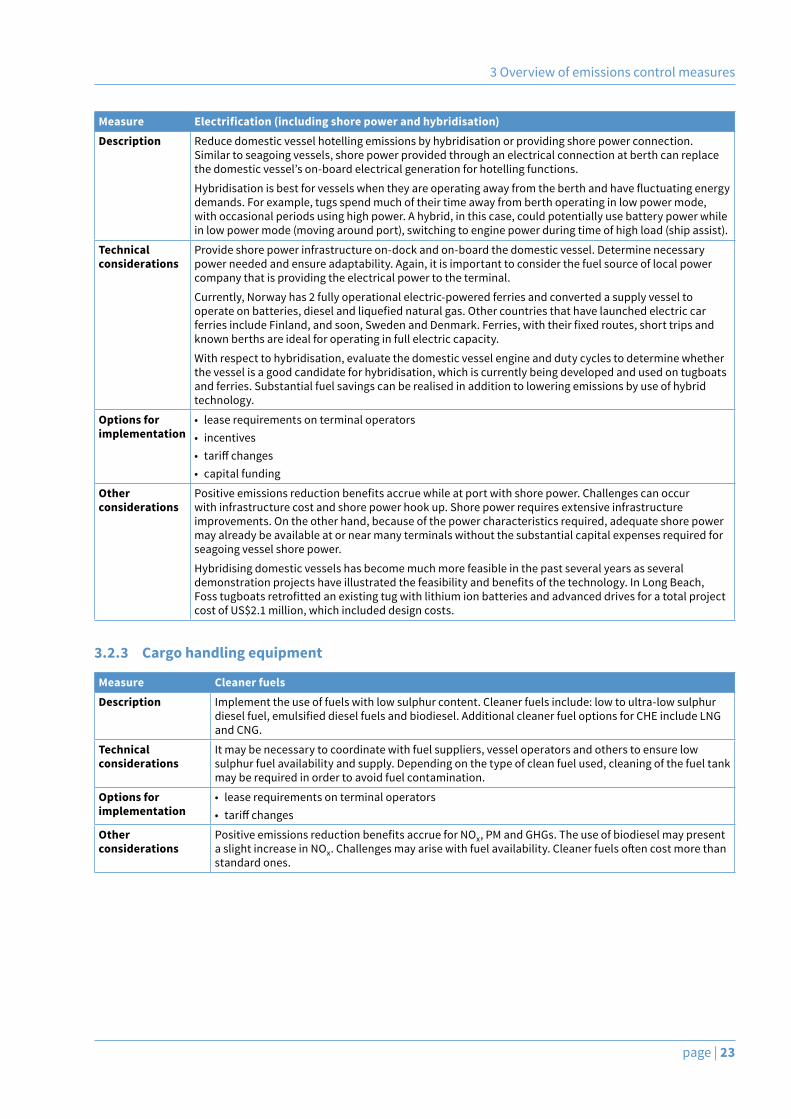
3 Overview of emissions control measures
page | 23
Measure Electrification (including shore power and hybridisation)Description Reduce domestic vessel hotelling emissions by hybridisation or providing shore power connection.
Similar to seagoing vessels, shore power provided through an electrical connection at berth can replace thedomesticvessel’son-boardelectricalgenerationforhotellingfunctions.
Hybridisationisbestforvesselswhentheyareoperatingawayfromtheberthandhavefluctuatingenergydemands. For example, tugs spend much of their time away from berth operating in low power mode, with occasional periods using high power. A hybrid, in this case, could potentially use battery power while in low power mode (moving around port), switching to engine power during time of high load (ship assist).
Technical considerations
Provide shore power infrastructure on-dock and on-board the domestic vessel. Determine necessary power needed and ensure adaptability. Again, it is important to consider the fuel source of local power company that is providing the electrical power to the terminal.
Currently, Norway has 2 fully operational electric-powered ferries and converted a supply vessel to operateonbatteries,dieselandliquefiednaturalgas.OthercountriesthathavelaunchedelectriccarferriesincludeFinland,andsoon,SwedenandDenmark.Ferries,withtheirfixedroutes,shorttripsandknown berths are ideal for operating in full electric capacity.
With respect to hybridisation, evaluate the domestic vessel engine and duty cycles to determine whether the vessel is a good candidate for hybridisation, which is currently being developed and used on tugboats and ferries. Substantial fuel savings can be realised in addition to lowering emissions by use of hybrid technology.
Options for implementation
• lease requirements on terminal operators• incentives• tariffchanges• capital funding
Other considerations
Positiveemissionsreductionbenefitsaccruewhileatportwithshorepower.Challengescanoccurwith infrastructure cost and shore power hook up. Shore power requires extensive infrastructure improvements. On the other hand, because of the power characteristics required, adequate shore power may already be available at or near many terminals without the substantial capital expenses required for seagoing vessel shore power.
Hybridising domestic vessels has become much more feasible in the past several years as several demonstrationprojectshaveillustratedthefeasibilityandbenefitsofthetechnology.InLongBeach, Fosstugboatsretrofittedanexistingtugwithlithiumionbatteriesandadvanceddrivesforatotalprojectcost of US$2.1 million, which included design costs.
3.2.3 Cargo handling equipment
Measure Cleaner fuelsDescription Implement the use of fuels with low sulphur content. Cleaner fuels include: low to ultra-low sulphur
dieselfuel,emulsifieddieselfuelsandbiodiesel.AdditionalcleanerfueloptionsforCHEincludeLNGand CNG.
Technical considerations
It may be necessary to coordinate with fuel suppliers, vessel operators and others to ensure low sulphur fuel availability and supply. Depending on the type of clean fuel used, cleaning of the fuel tank may be required in order to avoid fuel contamination.
Options for implementation
• lease requirements on terminal operators• tariffchanges
Other considerations
PositiveemissionsreductionbenefitsaccrueforNOx, PM and GHGs. The use of biodiesel may present a slight increase in NOx.Challengesmayarisewithfuelavailability.Cleanerfuelsoftencostmorethanstandard ones.

Guide No.2: Development of port emissions reduction strategies
24 | page
3.2.4 On-road trucks
Measure Cleaner fuelsDescription Implement the use of cleaner fuels with low sulphur content. Cleaner fuels include: low to ultra-low
sulphurdieselfuel,emulsifieddieselfuelsandbiodiesel.Additionalcleanfueloptionsforon-roadtrucksincludenaturalgas,bothcompressed(CNG)andliquefied(LNG),andliquefiedpetroleumgas(LPG, propane).
Technical considerations
AlternativefuelssuchasCNGandLNGrequiresubstantialmodificationstoon-roadtruckenginesandfuelsystems as well as infrastructure required to store, condition, and dispense the fuel.
Options for implementation
• lease requirements on terminal operators• tariffchanges
Other considerations
PositiveemissionsreductionbenefitsaccrueforNOx, PM and GHGs. The use of biodiesel may present a slight increase in NOx.Challengesmayarisewithfuelavailability.Cleanerfuelsoftencostmorethanstandard ones.
3.3 Operational measuresOperationalmeasures primarily affect and focus on reducing emissions from the operation of the vessel,terminalorport.Thiscantaketheformofoperationalefficiencyimprovementonboard,attheterminaland/orattheport.Operationalmeasuresincludethefollowinggroups:shipoperationalefficienciesandport/terminaloperationalefficiencies.Thefollowingsectionpresentsoperationalmeasures,astheyaresuitedspecificallytoseagoing vessels and landside operations.
3.3.1 Seagoing vessels
Measure Vessel speed reduction (VSR)Description Slower vessels have lower emissions per mile than faster moving vessels. A VSR programme is aimed at
reducing emissions from seagoing vessels by slowing vessels when they are in the vicinity of populated areas around ports. This would include a speed reduction down to 10-12 knots when OGVs are within the coastal waters and approaches to a port area.
Technical considerations
No operational changes are required of the vessel engine(s) as low speeds are already frequently used for navigation and operational purposes. Technical considerations may include updating existing radars and communication devices to communicate with local navigation and communication centres. There is limited data on the vessel speed at which net emissions are lowest. However, at least one study15 concluded that there was approximately 61% reduction in CO2, 56% reduction in NOx and 69% reduction in PM2.5byreducingvesselspeedsfromcruiseto12knotsorless.TheparticularVSRbenefitsarelikelytovary with engine type.
Options for implementation
• tariffreductionincentives• lease requirements for renewed lease agreements• voluntary programmes
Other considerations
Overall reductions in fuel consumption bring net reductions in NOx, PM and other air quality pollutants. These can be implemented with net negative costs over time if structured correctly. VSR savings are balanced by a range of additional operational costs and have to be managed for broader supply chain effectsifthereisanyincreaseintransportationtimes.Followingtheeconomicdownturnin2008,manycarriers used VSR as a means of reducing operational costs. Mandatory VSR programmes have been put in place on the East Coast of the United States to protect endangered whale species. Voluntary and incentivised programmes are increasingly being used around busy ports to reduce ship emissions.
15 CARB 2012. In-use Emissions Test Program at VSR Speeds for Oceangoing Container Ship; prepared by University of California, Riverside, College of Engineering-Center for Environmental Research and Technology for the California Air Resources Board, June 2012.
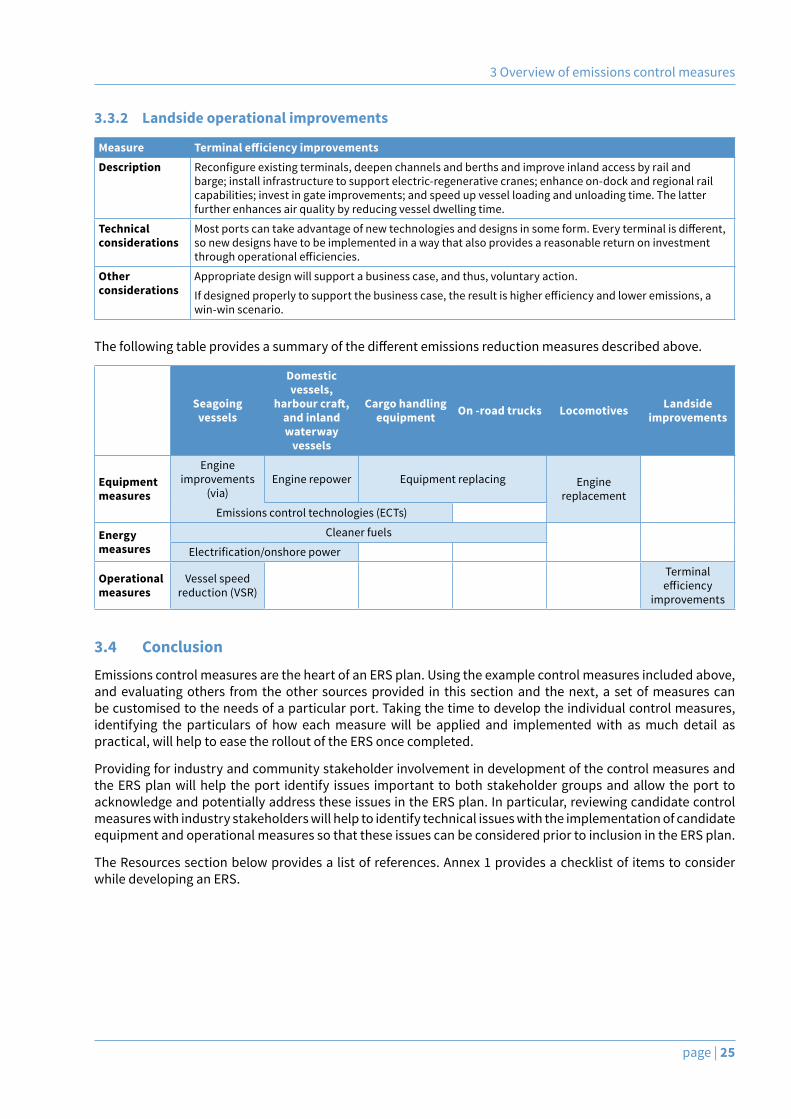
3 Overview of emissions control measures
page | 25
3.3.2 Landside operational improvements
Measure Terminal efficiency improvementsDescription Reconfigureexistingterminals,deepenchannelsandberthsandimproveinlandaccessbyrailand
barge; install infrastructure to support electric-regenerative cranes; enhance on-dock and regional rail capabilities; invest in gate improvements; and speed up vessel loading and unloading time. The latter further enhances air quality by reducing vessel dwelling time.
Technical considerations
Mostportscantakeadvantageofnewtechnologiesanddesignsinsomeform.Everyterminalisdifferent,so new designs have to be implemented in a way that also provides a reasonable return on investment throughoperationalefficiencies.
Other considerations
Appropriate design will support a business case, and thus, voluntary action.
Ifdesignedproperlytosupportthebusinesscase,theresultishigherefficiencyandloweremissions,awin-win scenario.
Thefollowingtableprovidesasummaryofthedifferentemissionsreductionmeasuresdescribedabove.
Seagoing vessels
Domestic vessels,
harbour craft, and inland waterway
vessels
Cargo handling equipment On -road trucks Locomotives Landside
improvements
Equipment measures
Engine improvements
(via)Engine repower Equipment replacing Engine
replacementEmissions control technologies (ECTs)
Energy measures
Cleaner fuels
Electrification/onshorepower
Operational measures
Vessel speed reduction (VSR)
Terminal efficiency
improvements
3.4 ConclusionEmissions control measures are the heart of an ERS plan. Using the example control measures included above, and evaluating others from the other sources provided in this section and the next, a set of measures can be customised to the needs of a particular port. Taking the time to develop the individual control measures, identifying the particulars of how each measure will be applied and implemented with as much detail as practical, will help to ease the rollout of the ERS once completed.
Providing for industry and community stakeholder involvement in development of the control measures and the ERS plan will help the port identify issues important to both stakeholder groups and allow the port to acknowledge and potentially address these issues in the ERS plan. In particular, reviewing candidate control measures with industry stakeholders will help to identify technical issues with the implementation of candidate equipment and operational measures so that these issues can be considered prior to inclusion in the ERS plan.
The Resources section below provides a list of references. Annex 1 provides a checklist of items to consider while developing an ERS.

page | 27
4 ResourcesThis section provides a list of resources that were used in the writing of this guide.
■ CARB 2018. Draft Technology Assessment: Ocean-Going Vessels; California Air Resources Board, May 2018.16
■ CARB 2012. In-use Emissions Test Program at VSR Speeds for Oceangoing Container Ship; prepared by University of California, Riverside, College of Engineering-Center for Environmental Research and Technology for the California Air Resources Board, June 2012.
■ ENVIRON 2004. Cold Ironing Cost Effectiveness Study: Volume I – Report; prepared for Port of Long Beach by ENVIRON International Corporation Los Angeles, California, March 2004.17
■ IAPH 2018. IAPH Toolbox for Port Clean Air Programs; website, International Association of Ports and Harbors (IAPH), prepared by members of the World Ports Climate Initiative (WPCI) of IAPH, 2018.18
■ ICCT 2012. Developing Port Clean Air Programs: A 2012 update to the International Association of Ports and Harbor’s Air Quality Toolbox; The International Council on Clean Transportation (ICCT), prepared by Starcrest Consulting Group, LLC, June 2012.19
■ SPBP 2006. 2006 San Pedro Bay Ports Clean Air Action Plan – Technical Report; jointly prepared by the Port of Los Angeles and the Port of Long Beach, November 2006.20
■ SPBP 2010. 2010 San Pedro Bay Ports Clean Air Action Plan Update; jointly prepared by the Port of Los Angeles and the Port of Long Beach, October 2010.21
■ SPBP 2017. 2017 San Pedro Bay Ports Clean Air Action Plan Update; jointly prepared by the Port of Los Angeles and the Port of Long Beach, November 2017.22
■ PANYNJ 2014. A Clean Air Strategy for the Port of New York & New Jersey – 2014 Update; the Port of NY & NJ, 2014.23
■ IMO 2015. Study of Emissions Controls and Energy Efficiency Measures for Ships in the Port Area; InternationalMaritimeOrganization(IMO),preparedbyStarcrestConsultingGroup,LLC,CEDelft,CivicExchange, February 2015.24
■ Sharma DC. Ports in a Storm; Environmental Health Perspectives. 2006; 114(4):A222-A231.
■ US EPA 2017. Shore Power Technology Assessment at U.S. Ports; prepared for EPA by Eastern Research Group, Inc. and Energy & Environmental Research Associates, LLC, March 2017.
■ Westmar 2007. Deltaport Third Berth Container Terminal Cold Ironing Feasibility Study; prepared for TSI Terminal Systems, Inc. by Westmar Consultants, Inc., May 2007.
■ Yorke 2007. Port of San Diego: Cold Ironing Study; prepared for the Port of San Diego by Yorke Engineering, May 2007.
16 See https://www.arb.ca.gov/msprog/tech/techreport/ogv_tech_report.pdf 17 See http://www.polb.com/civica/filebank/blobdload.asp?BlobID=7718 18 See http://wpci.iaphworldports.org/iaphtoolbox/, cited April 2018 19 See https://www.theicct.org/sites/default/files/ICCT_SCG_Developing-Clean-Air-Programs_June2012.pdf, cited April 2018. 20 See https://www.cleanairactionplan.org/documents/2006-clean-air-action-plan-update-tech-report.pdf, cited April 2018. 21 See https://www.cleanairactionplan.org/documents/2010-final-clean-air-action-plan-update.pdf, cited March 2018. 22 See https://www.cleanairactionplan.org/documents/final-2017-clean-air-action-plan-update.pdf, cited April 2018. 23 See https://www.panynj.gov/about/pdf/PANYNJ_CAS_2014_FINAL2.pdf, cited April 2018. 24 See https://www.imo.org/en/OurWork/Environment/PollutionPrevention/AirPollution/Documents/Air%20pollution/Port%20Area.pdf, cited March 2018.

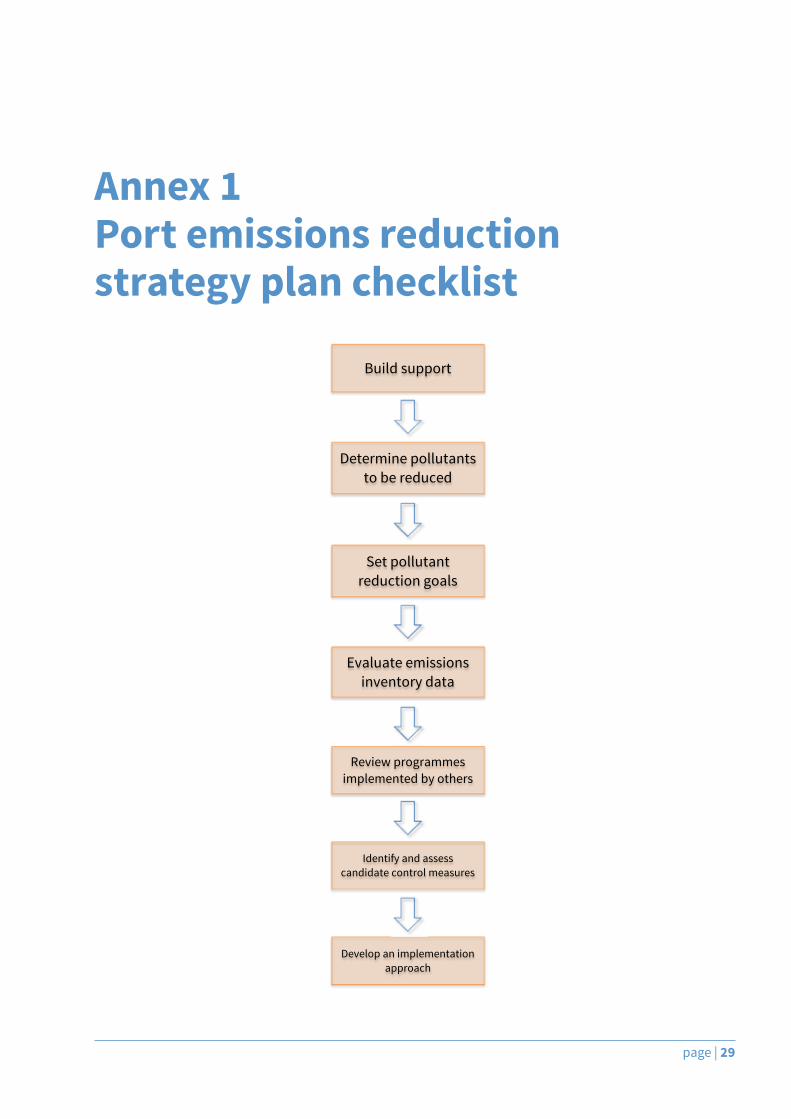
page | 29
Annex 1 Port emissions reduction strategy plan checklist
Build support
Determine pollutants to be reduced
Set pollutant reduction goals
Review programmes implemented by others
Evaluate emissions inventory data
Identify and assess candidate control measures
Develop an implementation approach
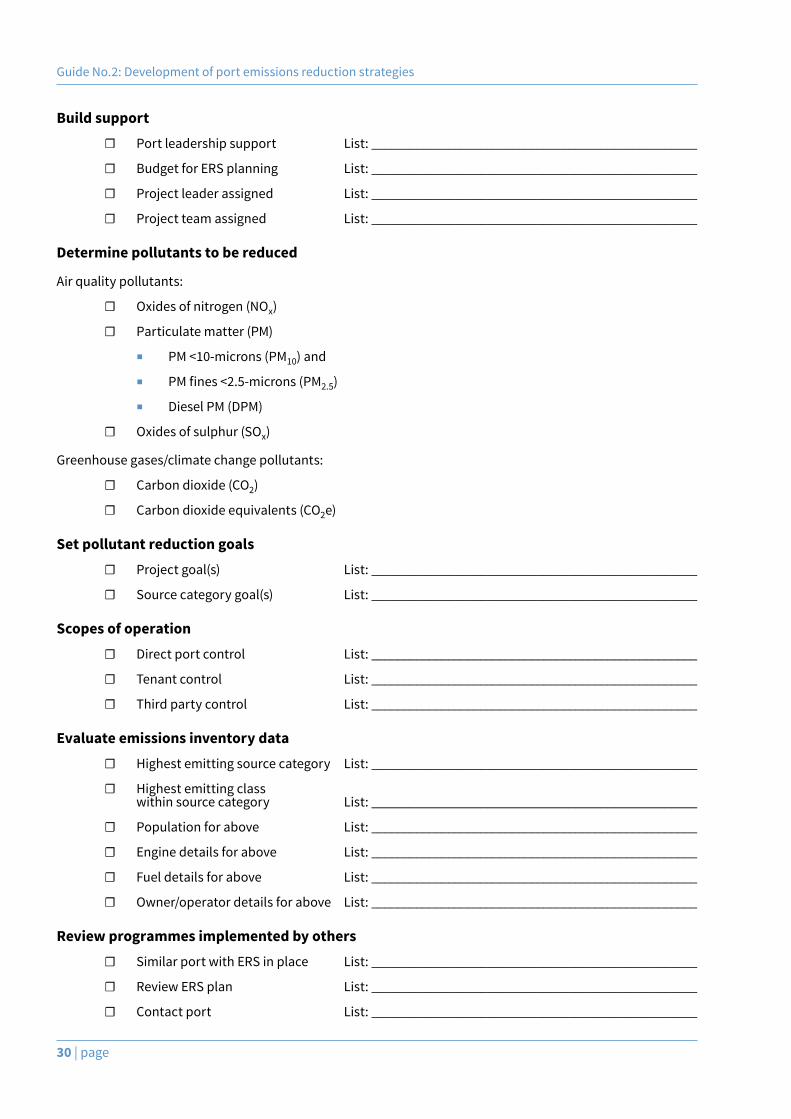
Guide No.2: Development of port emissions reduction strategies
30 | page
Build support☐ Portleadershipsupport List:___________________________________________________
☐ BudgetforERSplanning List:___________________________________________________
☐ Projectleaderassigned List:___________________________________________________
☐ Projectteamassigned List:___________________________________________________
Determine pollutants to be reduced
Air quality pollutants:
☐ Oxidesofnitrogen(NOx)
☐ Particulatematter(PM)
■ PM <10-microns (PM10) and
■ PMfines<2.5-microns(PM2.5)
■ Diesel PM (DPM)
☐ Oxidesofsulphur(SOx)
Greenhouse gases/climate change pollutants:
☐ Carbondioxide(CO2)
☐ Carbondioxideequivalents(CO2e)
Set pollutant reduction goals☐ Projectgoal(s) List:___________________________________________________
☐ Sourcecategorygoal(s) List:___________________________________________________
Scopes of operation☐ Directportcontrol List:___________________________________________________
☐ Tenantcontrol List:___________________________________________________
☐ Thirdpartycontrol List:___________________________________________________
Evaluate emissions inventory data☐ Highestemittingsourcecategory List:___________________________________________________
☐ Highestemittingclass withinsourcecategory List:___________________________________________________
☐ Populationforabove List:___________________________________________________
☐ Enginedetailsforabove List:___________________________________________________
☐ Fueldetailsforabove List:___________________________________________________
☐ Owner/operatordetailsforabove List:___________________________________________________
Review programmes implemented by others☐ SimilarportwithERSinplace List:___________________________________________________
☐ ReviewERSplan List:___________________________________________________
☐ Contactport List:___________________________________________________
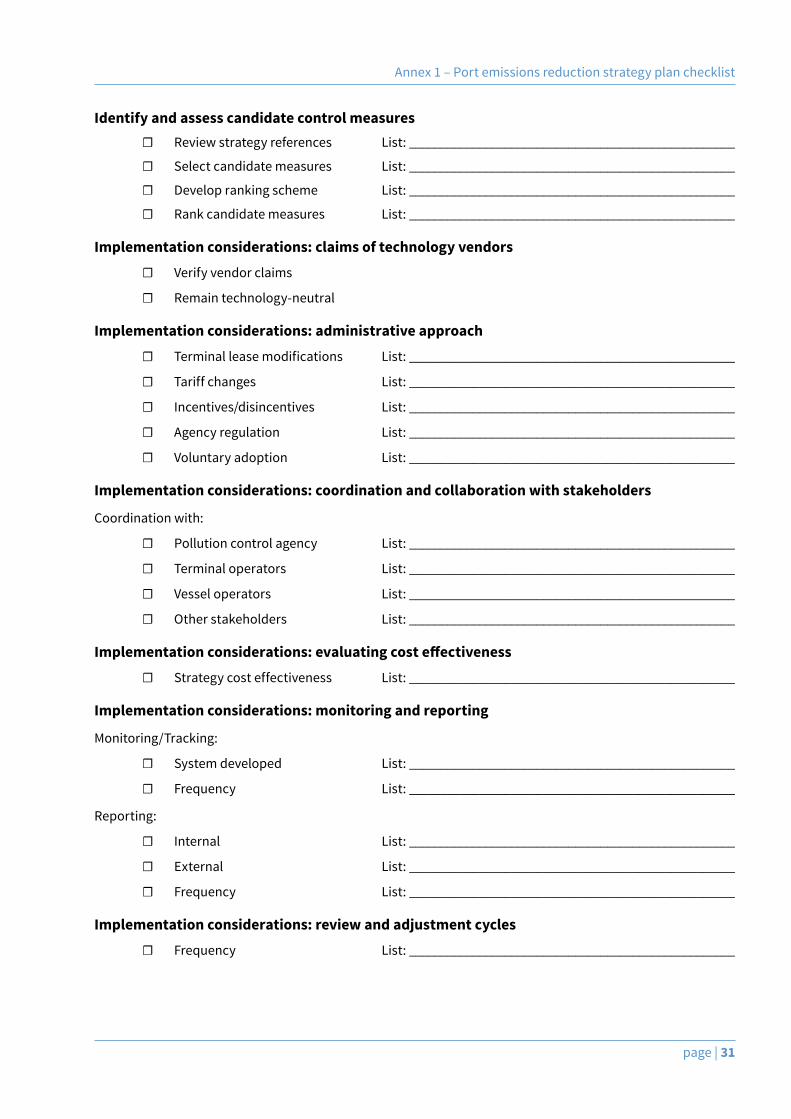
Annex 1 – Port emissions reduction strategy plan checklist
page | 31
Identify and assess candidate control measures☐ Reviewstrategyreferences List:___________________________________________________
☐ Selectcandidatemeasures List:___________________________________________________
☐ Developrankingscheme List:___________________________________________________
☐ Rankcandidatemeasures List:___________________________________________________
Implementation considerations: claims of technology vendors
☐ Verifyvendorclaims
☐ Remaintechnology-neutral
Implementation considerations: administrative approach
☐ Terminalleasemodifications List:___________________________________________________
☐ Tariffchanges List:___________________________________________________
☐ Incentives/disincentives List:___________________________________________________
☐ Agencyregulation List:___________________________________________________
☐ Voluntaryadoption List:___________________________________________________
Implementation considerations: coordination and collaboration with stakeholders
Coordination with:
☐ Pollutioncontrolagency List:___________________________________________________
☐ Terminaloperators List:___________________________________________________
☐ Vesseloperators List:___________________________________________________
☐ Otherstakeholders List:___________________________________________________
Implementation considerations: evaluating cost effectiveness
☐ Strategycosteffectiveness List:___________________________________________________
Implementation considerations: monitoring and reporting
Monitoring/Tracking:
☐ Systemdeveloped List:___________________________________________________
☐ Frequency List:___________________________________________________
Reporting:
☐ Internal List:___________________________________________________
☐ External List:___________________________________________________
☐ Frequency List:___________________________________________________
Implementation considerations: review and adjustment cycles
☐ Frequency List:___________________________________________________


page | 33
Annex 2 Cost-effectiveness analysisAsdiscussedinsection2.7.4,cost-effectivenessanalysis(CEA)isanevaluationapproachthatprovidesport,government and environmental pollution control agencies with a tool to compare the relative costs of two or moreemissionscontrolmeasuresandtheireffects,oroutcomes.CEAisparticularlyhelpfulwhencomparingcontrol measures associated with an individual source category.
Theeffectsofacontrolmeasurearequantifiedintermsoftheamountofpollutantsreduced,inunitsofgrams,kilograms,pounds,tons,metrictonnes,etc.Costeffectivenessisusuallyevaluatedinratioofmonetaryunit/pollutant mass ($/ton, €/tonne, £/tonne), but some agencies prefer to compare measures using a pollutant mass/monetary unit ratio (pound/$, kilogram/€) or other variations including $/metric tonne for greenhouse gas reductions.Cost-effectivenessanalysisallowscompetingmeasurestoberankedbytheamountofemissionsreductionrelativetothefundinginvestment.Themostcost-effectivemeasuresarerankedasthebestchoice.
Important in this decision-making process, however, is the acknowledgement that while a measure might rankbelowothermeasuresbecause it is not themost cost effective, the impactof themeasure stillmustbe considered when the measure stands on its own. If one measure out of a group of measures has a cost effectivenessof$1,000,000/ton(inotherwords,thecost is$1millionforeverytonofemissionsreduced), itwouldnotnormallybeimplementedwithoutsignificantqualitativejustification,sincethereareothermeasuresthathave cost effectiveness farbelow this level.However, if this is theonly controlmeasureavailableandfeasibletoaddressasignificantacutehealthriskaffectingasubstantialpopulation, itmightbeconsideredanyway.
Note that CEA as discussed herein is considered to be “prospective”, or an analysis that is undertaken in advance of selecting and implementing a measure. An evaluation approach that returns to the measure at its conclusion to assess actual measure results would prove useful to check measure results against original assumptions and expectations.Ifsubstantivelydifferent,lessonslearnedcanbeappliedinfutureimplementationefforts.
A note about lifecycle cost analysis
Asdiscussedabove,CEA ismostoftenusedtocompareemissionscontrolmeasureswhendecidinghowtoallocatefinancialresources.CEAisasimplifiedapproachtocomparemeasures,consideringinitialcapitalcostsandassociatedemissionsreductionbenefits.Amoredetailedcomparisonapproachtoselecttheemissionsreductionstrategiesisoftenusedbyregulatorswhenassessinganewregulationorrequirement.Thisdeeperanalysisoftenincludesanassessmentofaproposedregulation’slifecycleemissionsandeconomicimpacts,environmental justice considerations as well as an evaluation of alternatives. Lifecycle cost analysis considers allbenefitsandcostsoverameasure’slifetime.Itappliesadiscountratetoallmeasurebenefitsandcoststobring them to a present value for “apples-to-apples” comparison. Lifecycle is a complete evaluation approach, but it is much more complex than the simple CEA methodology summarised below. Basic CEA provides a good basis to compare similar emissions reduction measures to each other for the purpose of ranking them in priority order.
CEA methodology examples
Below are highlights of programmes that utilise CEA as a key selection criterion. Not every detail of each programme is summarised, but links are provided if additional information is of interest.
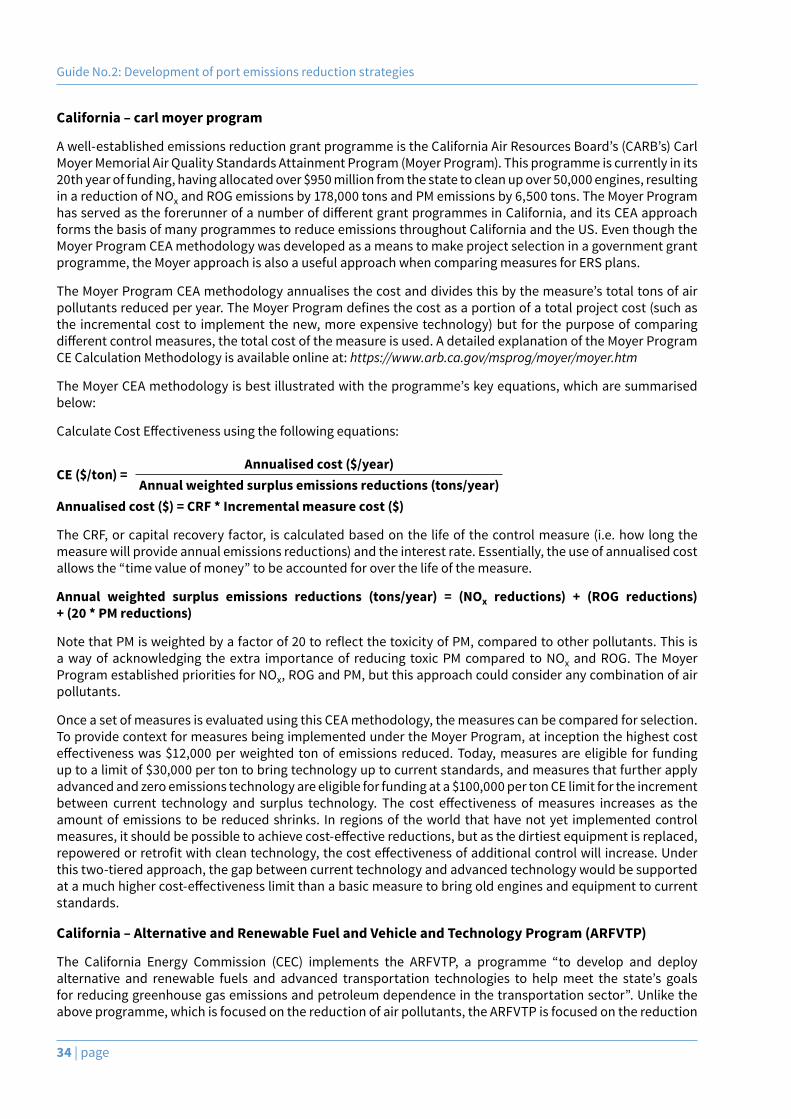
Guide No.2: Development of port emissions reduction strategies
34 | page
California – carl moyer program
Awell-establishedemissionsreductiongrantprogrammeistheCaliforniaAirResourcesBoard’s(CARB’s)CarlMoyer Memorial Air Quality Standards Attainment Program (Moyer Program). This programme is currently in its 20th year of funding, having allocated over $950 million from the state to clean up over 50,000 engines, resulting in a reduction of NOx and ROG emissions by 178,000 tons and PM emissions by 6,500 tons. The Moyer Program hasservedastheforerunnerofanumberofdifferentgrantprogrammesinCalifornia,anditsCEAapproachforms the basis of many programmes to reduce emissions throughout California and the US. Even though the Moyer Program CEA methodology was developed as a means to make project selection in a government grant programme, the Moyer approach is also a useful approach when comparing measures for ERS plans.
TheMoyerProgramCEAmethodologyannualisesthecostanddividesthisbythemeasure’stotaltonsofairpollutantsreducedperyear.TheMoyerProgramdefinesthecostasaportionofatotalprojectcost(suchasthe incremental cost to implement the new, more expensive technology) but for the purpose of comparing differentcontrolmeasures,thetotalcostofthemeasureisused.AdetailedexplanationoftheMoyerProgramCE Calculation Methodology is available online at: https://www.arb.ca.gov/msprog/moyer/moyer.htm
TheMoyerCEAmethodologyisbestillustratedwiththeprogramme’skeyequations,whicharesummarisedbelow:
CalculateCostEffectivenessusingthefollowingequations:
CE ($/ton) =Annualised cost ($/year)
Annual weighted surplus emissions reductions (tons/year)Annualised cost ($) = CRF * Incremental measure cost ($)
The CRF, or capital recovery factor, is calculated based on the life of the control measure (i.e. how long the measure will provide annual emissions reductions) and the interest rate. Essentially, the use of annualised cost allows the “time value of money” to be accounted for over the life of the measure.
Annual weighted surplus emissions reductions (tons/year) = (NOx reductions) + (ROG reductions) + (20 * PM reductions)
NotethatPMisweightedbyafactorof20toreflectthetoxicityofPM,comparedtootherpollutants.Thisisa way of acknowledging the extra importance of reducing toxic PM compared to NOx and ROG. The Moyer Program established priorities for NOx, ROG and PM, but this approach could consider any combination of air pollutants.
Once a set of measures is evaluated using this CEA methodology, the measures can be compared for selection. To provide context for measures being implemented under the Moyer Program, at inception the highest cost effectivenesswas$12,000perweighted tonofemissions reduced.Today,measuresareeligible for fundingup to a limit of $30,000 per ton to bring technology up to current standards, and measures that further apply advanced and zero emissions technology are eligible for funding at a $100,000 per ton CE limit for the increment between current technology and surplus technology. The cost effectiveness ofmeasures increases as theamount of emissions to be reduced shrinks. In regions of the world that have not yet implemented control measures,itshouldbepossibletoachievecost-effectivereductions,butasthedirtiestequipmentisreplaced,repoweredorretrofitwithcleantechnology,thecosteffectivenessofadditionalcontrolwillincrease.Underthis two-tiered approach, the gap between current technology and advanced technology would be supported atamuchhighercost-effectivenesslimitthanabasicmeasuretobringoldenginesandequipmenttocurrentstandards.
California – Alternative and Renewable Fuel and Vehicle and Technology Program (ARFVTP)
The California Energy Commission (CEC) implements the ARFVTP, a programme “to develop and deploy alternative and renewable fuels and advanced transportation technologies to helpmeet the state’s goalsfor reducing greenhouse gas emissions and petroleum dependence in the transportation sector”. Unlike the above programme, which is focused on the reduction of air pollutants, the ARFVTP is focused on the reduction
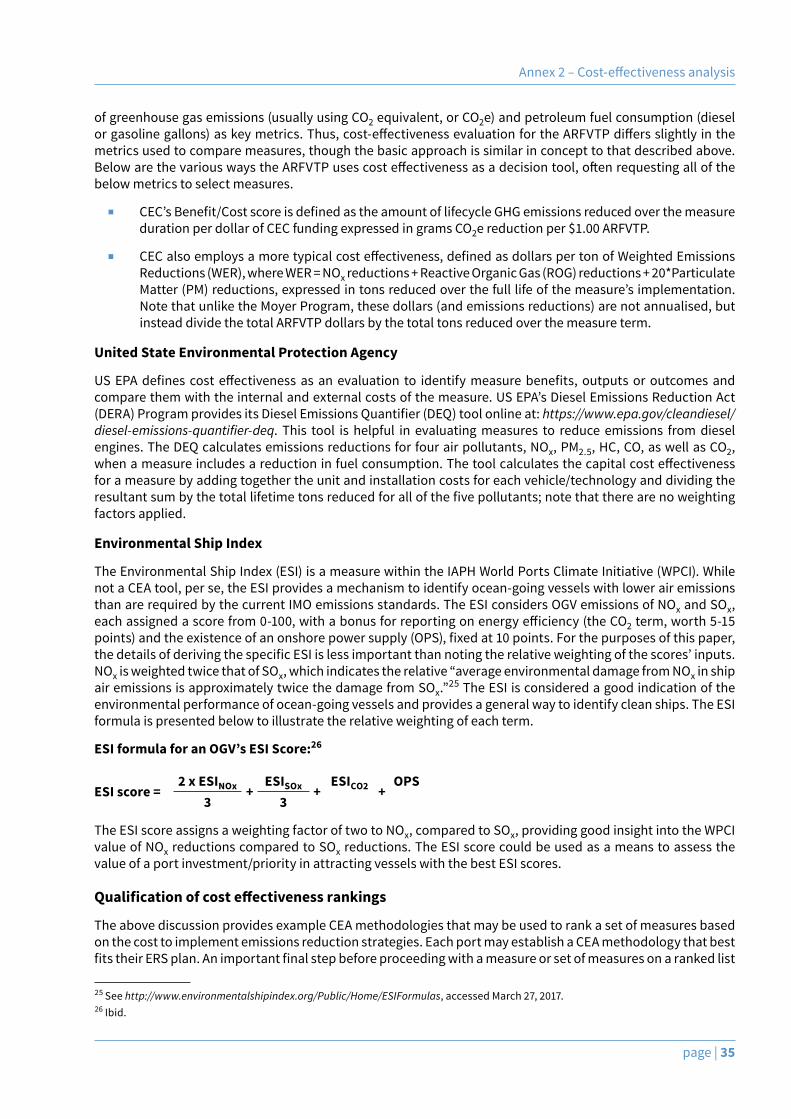
Annex2–Cost-effectivenessanalysis
page | 35
of greenhouse gas emissions (usually using CO2 equivalent, or CO2e) and petroleum fuel consumption (diesel orgasolinegallons)askeymetrics.Thus,cost-effectivenessevaluationfortheARFVTPdiffersslightlyinthemetrics used to compare measures, though the basic approach is similar in concept to that described above. BelowarethevariouswaystheARFVTPusescosteffectivenessasadecisiontool,oftenrequestingallofthebelow metrics to select measures.
■ CEC’sBenefit/CostscoreisdefinedastheamountoflifecycleGHGemissionsreducedoverthemeasureduration per dollar of CEC funding expressed in grams CO2e reduction per $1.00 ARFVTP.
■ CECalsoemploysamoretypicalcosteffectiveness,definedasdollarspertonofWeightedEmissionsReductions (WER), where WER = NOx reductions + Reactive Organic Gas (ROG) reductions + 20*Particulate Matter(PM)reductions,expressedintonsreducedoverthefulllifeofthemeasure’simplementation.Note that unlike the Moyer Program, these dollars (and emissions reductions) are not annualised, but instead divide the total ARFVTP dollars by the total tons reduced over the measure term.
United State Environmental Protection Agency
USEPAdefines cost effectivenessasanevaluation to identifymeasurebenefits, outputsoroutcomesandcomparethemwiththeinternalandexternalcostsofthemeasure.USEPA’sDieselEmissionsReductionAct(DERA)ProgramprovidesitsDieselEmissionsQuantifier(DEQ)toolonlineat:https://www.epa.gov/cleandiesel/diesel-emissions-quantifier-deq. This tool is helpful in evaluating measures to reduce emissions from diesel engines. The DEQ calculates emissions reductions for four air pollutants, NOx, PM2.5, HC, CO, as well as CO2, whenameasureincludesareductioninfuelconsumption.Thetoolcalculatesthecapitalcosteffectivenessfor a measure by adding together the unit and installation costs for each vehicle/technology and dividing the resultantsumbythetotallifetimetonsreducedforallofthefivepollutants;notethattherearenoweightingfactors applied.
Environmental Ship Index
The Environmental Ship Index (ESI) is a measure within the IAPH World Ports Climate Initiative (WPCI). While not a CEA tool, per se, the ESI provides a mechanism to identify ocean-going vessels with lower air emissions than are required by the current IMO emissions standards. The ESI considers OGV emissions of NOx and SOx, eachassignedascorefrom0-100,withabonusforreportingonenergyefficiency(theCO2 term, worth 5-15 points)andtheexistenceofanonshorepowersupply(OPS),fixedat10points.Forthepurposesofthispaper,thedetailsofderivingthespecificESIislessimportantthannotingtherelativeweightingofthescores’inputs.NOx is weighted twice that of SOx, which indicates the relative “average environmental damage from NOx in ship air emissions is approximately twice the damage from SOx.”25 The ESI is considered a good indication of the environmental performance of ocean-going vessels and provides a general way to identify clean ships. The ESI formula is presented below to illustrate the relative weighting of each term.
ESI formula for an OGV’s ESI Score:26
ESI score =2 x ESINOx +
ESISOx +ESICO2 +
OPS3 3
The ESI score assigns a weighting factor of two to NOx, compared to SOx, providing good insight into the WPCI value of NOx reductions compared to SOx reductions. The ESI score could be used as a means to assess the value of a port investment/priority in attracting vessels with the best ESI scores.
Qualification of cost effectiveness rankings
The above discussion provides example CEA methodologies that may be used to rank a set of measures based on the cost to implement emissions reduction strategies. Each port may establish a CEA methodology that best fitstheirERSplan.Animportantfinalstepbeforeproceedingwithameasureorsetofmeasuresonarankedlist
25 See http://www.environmentalshipindex.org/Public/Home/ESIFormulas, accessed March 27, 2017. 26 Ibid.

Guide No.2: Development of port emissions reduction strategies
36 | page
istoqualifythosemeasuresintermsoftheefficacyoftheinvestment.Itispossiblethatasetofmeasurescanberanked,buteventhebest-rankedmeasuremaynotbeacost-efficientinvestmenttoaffectthemostbenefit.Proceeding with such a measure might still be undertaken, however, if the health concerns or non-monetary considerations,suchaslocalpolicy/politics,jobcreationinitiativesorotherqualifierssupportmovingforwardat all costs.