
PORT DEVELOPMENT OPTIONS . I THE AUCKLAND … Port Development Options.… · compare and assess...
46
, I - I.; ' I I . I I 11 ' ' : I ' i FINAL REPORT PORT DEVELOPMENT OPTIONS FOR THE AUCKLAND REGION June 1999 ·· PORTS O.f ··AUCKLAND
Transcript of PORT DEVELOPMENT OPTIONS . I THE AUCKLAND … Port Development Options.… · compare and assess...
, I -
I.;
'
~ I
I
. I I
11 ' '
: I ' i
FINAL REPORT
PORT DEVELOPMENT OPTIONS FOR
THE AUCKLAND REGION
June 1999
·· PORTS O.f ··AUCKLAND
I
1.
2.
3.
4.
' '~''' .,,1
.I '·"'
5.
::I ''!
,.,,
i
TABLE OF CONTENTS
INTRODUCTION
1.1 Background 1.2 Approach Adopted 1.3 Report Structure
BACKGROUND INFORMATION
DESIGN CRITERIA
ALTERNATIVE SITES
4.1 Background 4.2 Upgrade Existing Port Facilities
4.2.1 Fergusson Terminal 4.2.2 Bledisloe Terminal
4.3 Upper Waitemata Harbour 4.4 Karepiro Bay (Northeastern Coastline) 4.5 Wairoa Bay (Central Eastern Coastline) 4.6 Ponui Options (Southeastern Coastline)
4.6.1 Option A - Ponui Island 4.6.2 Option B - Ponui Offshore Port
4.7 Puhinui (Manukau Harbour) 4.8 Muriwai Offshore Port (Northwestern Coastline) 4.9 Kaipara Harbour 4.10 Southwestern Coastline
COST COMPARISON
5.1 5.2 5.3
Introduction Assumptions Results of the Cost Comparison
5.3.1 5.3.2 5.3.3
Net Present Value Sensitivity of Results Conclusion
-.PORTS OF "%:=:'AUCKLAND
Page
1
1 1 2
3
5
8
8 8
8 11
11 12 14 14
14 17
19 21 21 21
23
23 23 27
27 28 29
i . I
6.
! . '
···I
I
7.
I
8.
9 . . I
ii
ENVIRONMENTAL EVALUATION
6.1 Potential Environmental Effects 6.2 Option Evaluation
6.2.1 Dredging and Disposal 6.2.2 Transportation 6.2.3 Hydraulic Effects 6.2.4 People /Recreation 6.2.5 Visual and Natural Character 6.2.6 Ecology 6.2.7 Urban Growth Strategy 6.2.8 Conflicts with Other Land Uses 6.2.9 Amenity Effects 6.2.10Cultural
EVALUATION OF OPTIONS
CONSULTATION
CONCLUSION
.O.PORTS OF -;.,AUCKLAND
30
30 30
30 31 32 33 33 34 35 36 36 37
38
40
41
I
4.1
4.2
4.3
4.4
4.5
4.6
4.7
4.8
5.1
1.1
5.1
5.2
5.3
5.4
5.5
7.1
7.2
ili
LIST OF FIGURES
Location of Possible Port Sites
The Current Layout of the Fergusson and Bledisloe Terminals
Port Concept Design - Karepiro Bay
Port Concept Design- Wairoa Bay
Port Concept Design - Ponui Island
Port Concept Design - Ponui Offshore Port
Port Concept Design - Puhinui
Port Concept Design - Muriwai Offshore Port
Cargo Growth and Capacity
LIST OF TABLES
Project Team and their Areas of Expertise
Cargo Growth Rates, Annual Percentage Growth in TEUEQ
Years in Which Port Capacity is Reached
Capital Cost Summary for Altemative Port Options $M (1997)
Discounted Cost of Altemative Port Options compared against Expansion at FOAL's Existing Site
Sensitivity of Additional Cost per TEUEQ to Changes in Input Assumptions for Ponui Island Option
Possible Port Development Options and Rating of Environmental Effects
Possible Port Development Options and Ranking of Environmental Effects
~PORTS OF "'%:="AUCKLAND
9
w·
13
15
16
18
20
22
25
1
24
24
26
28
28
38
39
' ,._.,
1
1. INTRODUCTION
1.1 BACKGROUND
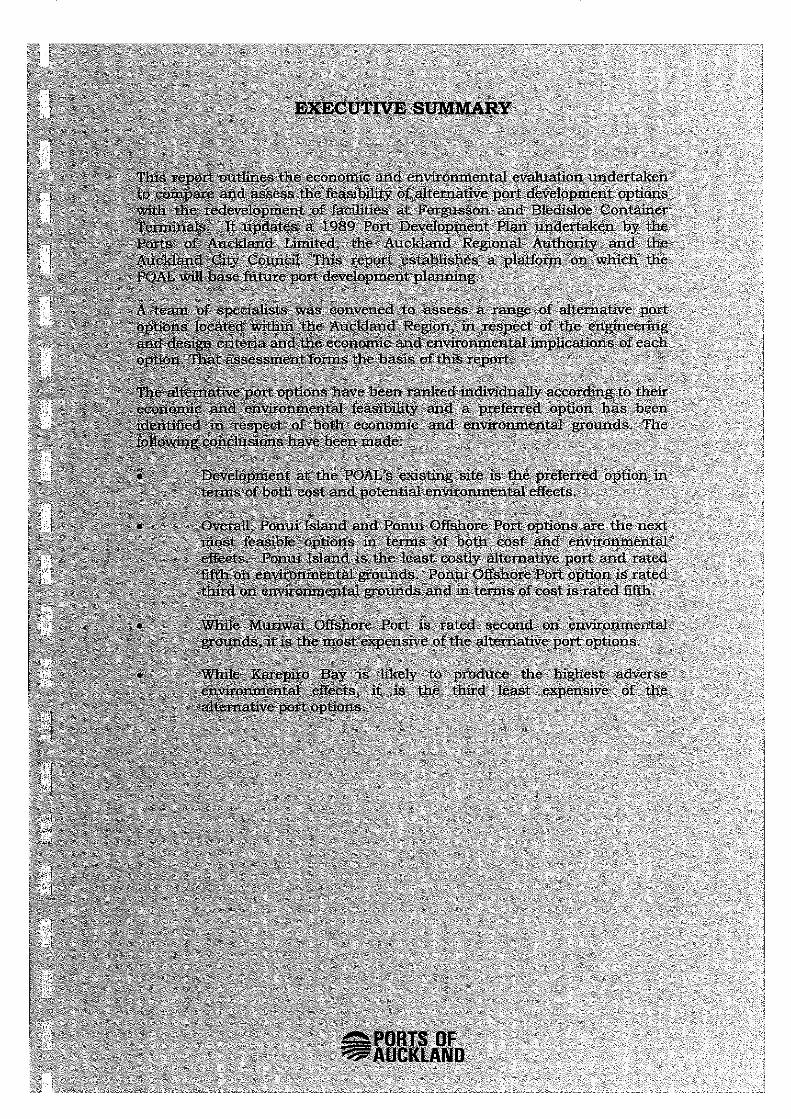
This report outlines the economic and environmental evaluation undertaken to compare and assess the feasibility of alternative port development options with . the redevelopment of facilities at Fergusson and Bledisloe Container Terminals. It updates a 1989 Port Development Plan undertaken by the Ports of Auckland Limited ("POAL''), the Auckland Regional Authority and the Auckland City Council The 1989 Port Development Plan, while containing useful factual information, was prepared prior to the enactment of the Resource Management Act 1991 ("RMA"). As such, it is necessary to reevaluate the various alternatives against the changed environmental legislative regime and identify any new sites.
This report describes the key elements of each of the alternative port development options, sets out the broad design criteria and evaluates the economic and environmental implications of each option. The options have been ranked individually according to their economic and environmental feasibility and a preferred option has been identified in respect of both economic and environmental grounds. As such, this report establishes a platform on which POAL will base future development planning.
The development of plans for the alternative sites was broad and conceptual, in order to present representative options for comparative purposes. This study does not extend to detailed engineering assessments.
1.2 APPROACH ADOPTED
The evaluation of alternative port options is an exercise requ=g a multidisciplinary approach. In this regard, a team of specialists was convened to assess the various port options. Details of the Project Team are described in Table 1.1.
Table 1.1: Project Team and their Areas of Expertise
Individual
Dr Phi! Mitchell
Mr Stephen Priestley
Mr Rob Gee
Mr Alan Bradbourne
Mr Paul Kennedy
Ms Mary Buckland
Organisation
Mitchell Partnerships Ltd
Beca Carter Hollings & Ferner Ltd
Consultant Planner
Alan Bradbourne Partners
Kingett Mitchell & Associates Ltd
LA4
.O.PORTS OF 'l.;o' AUCKLAND
Role
Overall environmental assessment
Engineering and financial assessments
Planning assessments
Planning assessments
Ecological issues
Visual/landscape issues

,-:.-.1
2
As an initial stage, the conceptual layouts were prepared and quantification of development costs were carried out for alternative port sites within the Auckland region. It is stressed that no attempt was made to identify the specific site for each option, as. it was considered that an assessment of the issues could be undertaken robustly without the need for such detailed planning.
Once the fmancial and engineering parameters of the options were developed, the Project Team met to consider the options and to assess collectively the environmental issues associated with each option.
The above information forms the basis of this report.
1.3 REPORT STRUCTURE
Following this introduction, the report is set out in seven sections. These are:
• Section 2 - briefly outlines the ability of POAL's existing site to meet the level of demand for container capacity predicted by market trends.
• Section 3 - outlines the design criteria that must be satisfied by any alternative port option, to ensure that the facility will be both viable and able to function effectively.
• Section 4- outlines the methodology used to identify alternative port sites. The alternative port sites and their respective development scenarios are then discussed.
• Section 5 - outlines the assessment and comparison of costs likely to be incurred as a result of future development at the alternative port sites.
• Section 6 - outlines the potential environmental effects arising from future port development at the alternative port sites.
•
•
Section 7 - evaluates all of the alternative port options (including the proposed expansion of the POAL's existing site) in respect of potential environmental effects and capital expenditure required.
Section 8 - Briefly outlines feedback received from some interested parties.
• Section 9 - provides a summary of the report's fmdings, and proposes the preferred development option .
.O.PORTS OF ~AUCKLAND
,I
'
I , I
'
'i ·!'il
3
2. BACKGROUND INFORMATION
The ability of existing and alternative sites to meet future growth in the port industry has been considered by POAL. The following background information is relevant:
• FOAL's existing site is located in the lower Waitemata Harbour and includes both the Fergusson Container Terminal and the Bledisloe Terminal.
• Fergusson Container Terminal is POAL's current specialist container terminal. It has a capacity of approximately 300,000 Twenty Foot Equivalent Units ("TEUEQ").
•
•
•
•
•
The total container capacity of FOAL's existing general cargo site is currently limited to about 700,000 TEUEQ. The current throughput is approximately 620,000 TEUEQ per year. Recent trends and projections indicate that additional facilities are required if POAL is to meet future demand.
The options for providing these additional facilities range from expansion of the facilities at POAL's existing site to the establishment of a new port at various locations throughout the Auckland region.
The expansion of Fergusson and Bledisloe Terminals, generally in line with the 1989 Port Plan, would provide an ultimate capacity of 1.25 million TEUEQ at the FOAL's existing general cargo site. The proposed development of these sites incorporates the addition of one berth and back-up land at the Fergusson Container Terminal and further berths and back-up land at the Bledisloe Terminal. The development of these facilities will be staged in order to proceed in parallel with the projected demand for container facilities. This development forms the basis of the comparison between FOAL's existing site and the development at alternative port sites.
Once the capacity of FOAL's existing site is exceeded, a number of alternative actions must be considered. Broadly these are:
Further major expenditure at a second port site; Productivity gains identified and implemented at FOAL's existing sitG:; The diversion of excess trade to an existing port in another region.
Growth in cargo throughput over the past 10 years has been approximately 9% per annum. There has been an accompanying productivity gain of approximately 6.5% per annum in the utilisation of the site. This has resulted in a 2.5% (9%- 6.5%) net growth in the capacity requirements. These rates of growth and productivity improvements are high by historical standards and were partly the result of deregulation in the port industry. In the future, more
~PORTS OF ~AUCKLAND

' i
4
moderate rates of growth are expected and further productivity gains are likely to be more moderate.
• Future cargo growth will be focussed on the container trade with the conventional bulk and break-bulk cargo expected to grow at a more modest rate.
~PORTS OF "%;:"AUCKLAND

I • I
I .I
5
3. DESIGN CRITERIA
In order for an alternative port option to be viable and function effectively, it must satisfy a number of broad design criteria. These criteria are described below:
Number of Berths and Land Area
•
•
The alternative port facility is eventually to be able to accommodate six container-capable berths. Each berth would be approximately 300 metres long with a 20 metre wide wharf and backup land of nine hectares per berth for container stacking. An additional area of eight hectares would also be required for rail and. road exchanges, administration and cargo handling facilities. The minimum total area that is required for an alternative port site is approximately 66 hectares, and provides for an approximate port capacity of 1 million TEUEQ.
To allow for a comparison with the proposed Fergusson Container Terminal and Bledisloe Terminal expansions, it has been assumed that any alternative port option would be developed in two stages. Stage One development would consist of the construction of a breakwater system, if necessary to protect the ultimate six berth layout, and sufficient back up areas for three berths. Initially, only the first of the three Stage One berths would be constructed (together with the necessary structures and mechanical plant), and the two other berths would be constructed as the demand on port capacity requires. Stage Two consists of the provision of three further berths, together with the additional cargo handling equipment for their operation.
• The cost comparison and environmental assessment of the alternative port options has been based on a Stage One development. This allows for a comparative assessment between an ultimate development of the existing site (with a capacity of 1.25 million TEJJEQ), and the existing site and a three berth alternative port (with a capacity of 0.7 + 0.5 = 1.2 million TEUEQ).
Dredging Depth
• The initial dredged depth would be similar to that provided by POAL's existing site, which is approximately 12 metres below Chart Datum. The berth areas will be dredged to 13.5 metres. This level of dredging would provide safe navigation at both the berthing facilities, the entrance and approach channels. A width of 250 metres would be required for the movement of vessels within the navigation channeL
-..PORTS OF ~AUCKLAND

6
Wave Protection
• Wave protection would be required for the location of any new port on an exposed site. Rubble-mound breakwaters would be constructed to ensure there was no damage occurring under a 50 year design wave (for the 10 percentile wave), while caisson-type breakwaters would be constructed to ensure stability under the 200' year wave conditions. It is envisaged that wave heights within the port area would be limited to 0.5 metres on the beam and one metre on the bow.
Plant and Equipment Requirements
• Each new container berth would require two container cranes and 12 straddle carriers. Regular and long term maintenance of this equipment would be carried out on site.
Road and Rail Transportation Links
• A two lane state highway-equivalent road would be required from any new port to the nearest existing state highway. Grade separated intersections would only be provided at major locations. A single line rail track would also be required from the port to the North Island Main Trunk line and wherever feasible, intersections with the existing road network would be grade separated.
Construction Period
• The construction period of the Stage One development would last approximately four years, with the aim being to have some part of the facility operational within three years.
Construction Methodology
•
•
Wherever practicable dredged material should be stabilised and used as fill for the reclamation. Any fme silt material that cannot be used within the reclamation would be dumped beyond the territorial sea limits. Dredging of clean sand will be avoided, but where this is not practicable the material would be placed back into the coastal environment rather than used in the reclamation.
For design waves over three metres it is likely that a concrete armour unit would be necessary, and these would be. similar to accropod or tetrapod proprietary units. Locally available rock would be used for all other breakwater material.
• Rock, stabilised dredgings or other suitable material will be used for the reclamation fill. Depending on the geotechnical properties of the seabed, some surficial bed sediments would be dredged and
-.PORTS OF "%::='AUCKLAND

!
.•1
t.l
7
stabilised to avoid long term settlement. The foundation designs would be determined following site-specific geotechnical investigations.
~PORTS OF "%:="AUCKLAND

8
4. ALTERNATIVE SITES
4.1 BACKGROUND
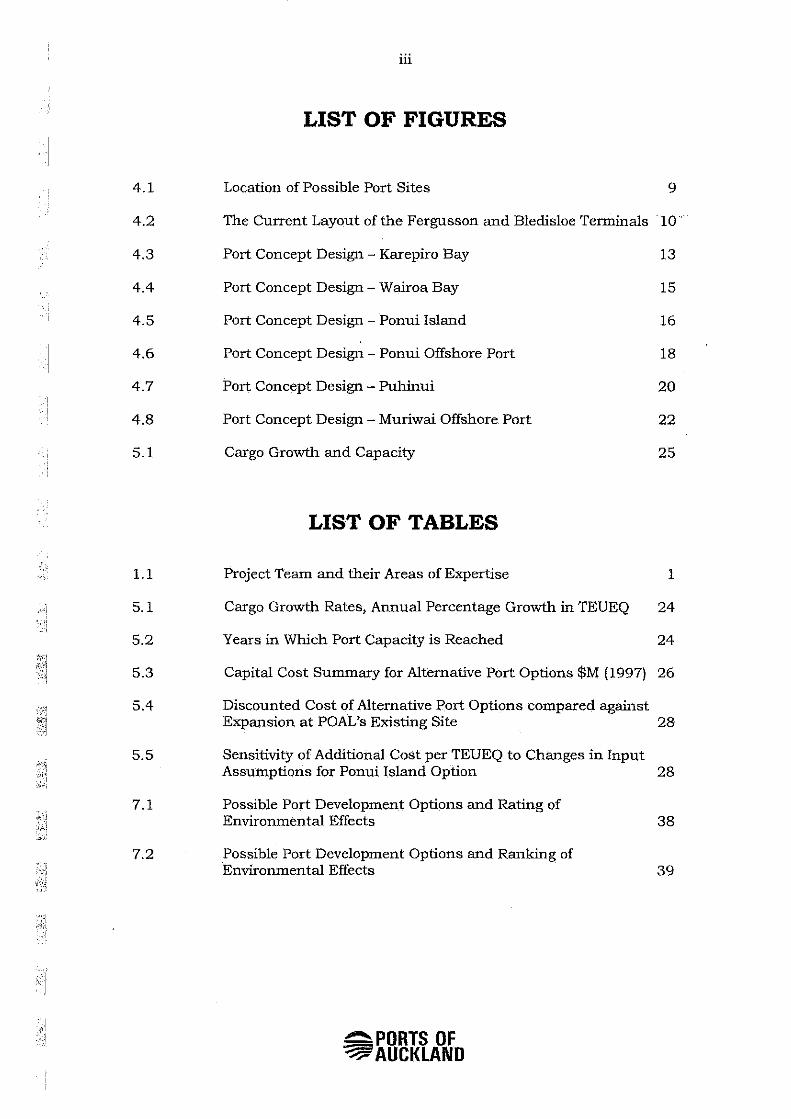
To identify the potehtial alternative port sites, the Auckland coastline was categorised into eight blocks with a potential port site identified in each. The. eight coastal blocks and potential port sites are shown in Figure 4.1. The coastal blocks were identified as:
• Upper Waitemata Harbour (Block E2- above the Harbour Bridge). • Northeastern Coastline (Block El- Karepiro Bay site). • Central Eastern Coastline (Block E3 - Wairoa Bay site). • Southeastern Coastline (Block E4 - Ponui Offshore Port and Ponui
Island sites). • Manukau Harbour (Block W2 - Puhinui site). • Northwestern Coastline (Block W3- Muriwai Offshore Port site). • Kaipara Harbour (Block W4 - no site). • Southwestern Coastline (Block Wl- no site).
The representative option for each block was selected on the basis that it was a typical potehtial port site for that part of the coastline, and that it could satisfy the design criteria set out in Section 3. While it is acknowledged that there may be more optimal solutions within each block, the selected options highlight the key environmental and economic implications associated with a potential port development in each part of the coastline.
The following sections describe the broad development scenarios for the various alternative options and for the proposed upgrade at FOAL's existing site.
4.2 UPGRADING EXISTING PORT FACILITIES
4.2.1 Fergusson Terminal
The Fergusson Container Terminal is located at FOAL's existing site in the lower Waitemata Harbour. FOAL's site is bounded by the Fergusson Terminal to the east and the Bledisloe Terminal to the west, and is located near road and rail transportation links. Fergusson Container Terminal currently comprises two berths, which are serviced by five container cranes and 17.6 hectares of back-up land available for container stacking. Figure 4.2 illustrates the current layout of the Fergusson and Bledisloe Terminals.
The Fergusson Container Terminal has grown incrementally in the lee of the eastern breakwater, and has developed into a dedicated container handling facility over the past 25 years. However, POAL have predicted, based on the
~PORTS OF ~AUCKLAND
FERGUSSON CONTAINER TERMINAL
ROAD EXCHANGE AREAS
'
1,------------------------------, I
The Current Layout of the Fergusson and Bledisloe Terminals Figure 4.2
.· i
I
..• I
11
current growth rates, that the capacity of the existing Fergusson Container Terminal will be reached in the near future. Moreover, FOAL has concluded that within approximately the next four years, all container capable areas at FOAL's existing site will be at capacity.
The proposed upgrade includes an extension to the existing Fergusson Terminal and the creation, by way of reclamation, of an additional 13.5 metre·· deep berth and back-up land. The proposed berth will be 320 metres long and would be in addition to the existing 590 metre north-sou.th berth. The proposal seeks the creation of a further nine hectares of back-up land in order to store the expected additional 180,000 TEUEQ, which the new berth will attract. This extension would increase the existing general cargo port capacity to 880,000 TEUEQ.
The proposed development would be achieved by the reclamation of nine hectares of seabed to the north and east of the existing facility. In order to expedite this, removal of 200,000 m3 of marine sediment will be required so that solid foundations for the bund walls can be created, as well as allowing for the berthing of vessels alongside the proposed wharf structure. The new berth would be constructed as a piled quay structure along the northem face of the completed reclamation.
4.2.2 Bledisloe Terminal
']'he Bledisloe Terminal marks the beginning of the "Eastem Reclamation" or the eastem part of the co=ercial port where FOAL's modem containercapable facilities are located. Bledisloe Terminal currently comprises three berths and approximately 13.3 hectares of back-up land. The terminal currently handles "roll-on/roll-off'' vessels and other vessels with mixed container and breakbulk cargo.
The 1989 Port Development Plan envisaged both the .extensions· of the Fergusson and Bledisloe Terminals as necessary to meet future cargo demands. As part of this assessment it is assumed that, in addition to the expansion of the Fergusson Container Terminal, a similar type Qf port extension would occur at Bledisloe Terminal, generally in accordance with the 1989 Port Development Plan. The creation of two berths with the accompanying backup land would increase the existing port general cargo capacity to 1.25 million TEUEQ.
It is important to note that the proposed development of the Fergusson Container Terminal and Bledisloe Terminal are not altematives, but are both considered essential to meet the capacity potential of FOAL's existing site. The costs. of the proposed expansions at both of the 'l'erminals are used in the comparison of the· discounted costs of altemative options.
4.3 UPPER WAITEMATA HARBOUR
The lower Waitemata Harbom· contains FOAL's existing site and the. Devonport Naval Base. The upper harbour (above the Harbour Bridge) has been previously considered as an altemative port site for Auckland in the 1989 Port
""""' PORTS OF ??'AUCKLAND
12
Development Plan. However, the upper Waitemata Harbour is now considered to be unsuitable as a port site, as modem container vessels (those in excess of 2000+ TEUEQ capacity) which presently visit the POAL site cannot pass under the existing Harbour Bridge. Therefore, as long as the Harbour Bridge remains, this option is fatally flawed and has not been considered further in this report.
Recently, studies have been carried out on the feasibility of relocating the Devonport Naval Base to either Whangarei or Marlborough Sounds. The outcome of that study is unknown and confidential. The Naval Base has available about 10 hectares of backup land, which is elongated in shape with an approximate width of 100 metres. Significant additional backup land would be required, in addition to the 10 hectares, to create a c;ommercial port that is both viable and functional. As suc:h, this alternative has not been investigated further at this stage. This is because it is the only Naval Defence Base in New Zealand. Also, significant reclamation of the foreshore and expensive road and rail transport links would be necessary to create a new commercial port.
4.4 KAREPIRO BAY (NORTHEASTERN COASTLINE)
The representative option of Karepiro Bay is situated between the Weiti River and the Okura River just south of the Whangaparaoa Peninsula. The Weiti River is an important environmental area, a commercial waterway, and has a mooring for several hundred recreational boats. The Okura River is a small tidal estuary, and its intertidal flats are important wildlife feeding areas. The southern shoreline of the area also extends near the residential areas of North Shore City.
Karepiro Bay is very sheltered from the prevailing winds, and provides sheltered anchorage along the southern shore of the Whangaparaoa Peninsula. The concept layout for this option is shown in Figure 4.3. The development comprises a single reclamation, which would extend out from the northern side of the Okura River. The berths would be aligned in a southwest-northeast direction, which aligns with the predominant wind directions.
To minimise the amount of dredging required, the three outer berths would be constructed in the Stage One development with only the outer basin being dredged. A narrow reclamation would extend from the Stage One development to the shoreline to provide access to the site.
The design wave for this site is about 4.5 metres. Concrete armour units would be provided on the exposed outer half of the reclamation. An entrance channel would be dredged extending 1.5 kilometres into the Hauraki Gulf. The sediment deposition rate in the new port is expected to be about 50 millimetres per year. Because of the extensive dredging required and the fme nature of the material in the area, any dredged material not utilised in the reclamation would need to be disposed of beyond the territorial sea limits
New rail and road access would be required for this site with tunnelling required for the rail access.
-.PORTS OF -::._.,.AUCKLAND
I I
I
CONCRETE ARMOUR UNITS
,. 300m
I
SECTION A
5m
CONCRETE ARMOUR UNITS
CAISSON
·14m
CHANNEL DREDGED T0·12mCD
--
::2::11 10
Port Concept Design Karepiro Bay
Figure 4.3
I I
14
4.5 WAIROA BAY (CENTRAL EASTERN COASTLINE)
This coastal block contains Waibeke Island and the coastline between the Tamaki River and the Wairoa River. The area is relatively shallow, with a maximum depth of seven metres in the Tamaki Straight. The area has a high recreational use. The altemative port development option is located in the lee of the Whakakaiwhara Point near the mouth of the Wairoa River, and uses the' existing shoreline as a boundary for the reclamation. The berths would be aligned with the predominant southwest-northeast winds.
The concept design for an altemative port option at Wairoa Bay is shown in Figure 4.4. The port could be easily staged by constructing the outer three berths and dredging the outer half of the basin, as Stage One, A caisson would be used to form the quay, and material dredged from the port basin would be stabilised for use in the reclamation.
Protection from the northwesterly waves in Tamaki Strait would be provided by Whakakaiwhara Point. Rock armour on the outer end of the reclamation would be provided for a design wave height of about 1.5 metres across the Strait.
An entrance channel would be dredged to 12 metres in depth extending six kilometres across Tamaki Strait to Waibeke Channel, between Waibeke and Ponui Islands. A large proportion of the material dredged from the port and the channel would be silt or mudstone. The reclamation could accept about 20% of this but the remainder would need to be disposed of probably beyond the territorial sea limits. Because of the location of the port near the Wairoa River significant volumes of silt will accumulate in the port basin and require continual monitoring and dredging.
Road and rail access would be via the Wairoa River valley, while sea access would be through Waiheke Channel and a dredged channel across Tamaki Strait.
4.6 PONUI OPTIONS (SOUTHEASTERN COASTLINE)
4.6.1 Option A ~ Ponui Island
The southeastem coast is a relatively undeveloped length of coastline with significant lines of cliffs interspersed with pocket beaches becoming gravely towards the south. Ponui Island is a privately owned island that has been farmed by members of the same family since the early 18.50s. The island is presently isolated, and contains areas of pasture, native bush and unspoilt coastline. Option A would be nestled into the southeastem comer of Ponui Island.
The conceptual layout of the option is shown in Figure 4.5 and would comprise two reclamations. The more exposed, northem reclamation would be constructed as the Stage One development. The berths would be aligned in a
-.PORTS OF -::::).!§'AUCKLAND
I
I CHANNEL I DREDGED TO· 12m CO
I _L-f-.L.--L-..<J~j //
I
/~' I I
/
I
/
~ --------- / ~ / --------I
I
\~ // \ / '-/
MIN300m
SECTION A
CAISSON
EXISTING BED LEVEL
Port Concept Design Wairoa Bay
Figure 4.4
THIRD BAY
PONUI ISLAND
I
I
-12m
\
300m
PAVEMENT
DECKED WHARF Sm
SECTION A
•
r
I
/~ 6 x 300m BERTHS
CONCRETE ARMOUR UNITS
OT0-12m
Port Concept Design Ponui Island
Figure 4.5
:'I ,,
i I
I
17
northwest-southeast direction, which being unfavourable for prevailing winds would require increased mooring capacity.
The design wave for this site is about four metres and wave protection would be provided by concrete armour units. Stub breakwaters at the port entrance would also be provided by concrete armour units and would provide protection from the southeastern waves generated in the Firth of Thames.
The port entrance would be located at about the 12 metre depth contour and no dredging would be required in the access channel. However, a large volume of dredging would be required for the port basin. It has been assumed that this would be mostly mudstone material, which could be stabilised for use in the reclamation. Annual deposition in the port basins would be in the order of 50 millimetres per year. It is assumed that the top two metres of the existing seabed sedirnents would need to be removed prior to forming the reclamation bunds.
A six kilometre bridge structure would be required to connect the port facility with the mainland at Waitawa Bay. The bridge structure would present a navigational restriction although this could be overcome to some extent by having an elevated bridge. Both road and rail corridors would be required through the Wairoa River valley.
4.6.2 Option B - Ponui Offshore Port
As mentioned in Section 4.6.1, the southeastern coast is predominantly cliffed and hence a U-shaped offshore port concept has been considered an appropriate option. This is shown in Figure 4.6.
The offshore port concept has been proposed in this area, as it requires no dredging and has the least potential effect on the coastal processes and hydraulics. As it is approximately six kilometre offshore, port-related activities such as lights, noise and visual effects should be reduced.
The northern reclamation and entire outer breakwater, which provides shdter to the berths, would be constructed in the Stage One development.
The design wave height is about five metres for this site. Wave protection would be provided by concrete armour units, with the U-shaped layout also protecting the berths from the northern waves through to southeasterly waves.
No capital dredging would be required to establish the depth of the port basin, however it is assumed that there would be one metre of soft seabed sediments that would require stabilisation. Large amounts of fill are required for this option.
The offshore port would be connected by bridge to the coastline at Orere Point. It would require substantial road and rail infrastructure to connect into existing transport links.
~PORTS OF ~AUCKLAND

-12m
\ \
DECKED WHARF
6): 300rn BERTHS
"\ "\
"\ \
\ \
\ \
PAVEMENT
SECTION B
SECTION A
CONCRETE ARMOUR UNITS
CONCRETE ARMOUR UNITS
Port Concept Design Ponui Offshore Port
Figure 4.6
19
4. 7 PUHINUI (MANUKAU HARBOUR)
The Manukau Harbour entrance is dominated by a bar that consists of continually moving sandbanks and extends approximately eight kilometres into the Tasman Sea. Filling and draining of the Manukau Harbour on each tidal cycle causes channels to be cut through the sandbanks and allows limited shipping to access the inner harbour.
POAL. maintains a signal station at South Head, the entrance of the harbour, where a signal man is permanently stationed in order to advise of the conditions of the bar. Entrance into the Manukau Harbour is currently restricted to approximately 4.5 metres below Chart Datum and hence navigation through this bar can be tide dependent.
Any port development option within Manukau Harbour would require reclamation, coupled with dredging of one of the main natural channels to provide a safe and reliable channel through the existing bar. With these constraints in mind a site has been selected at Puhinui, on the eastem side of the Papakura Channel, which is also located near both road and rail links and adjacent to the existing Auckland Airport.
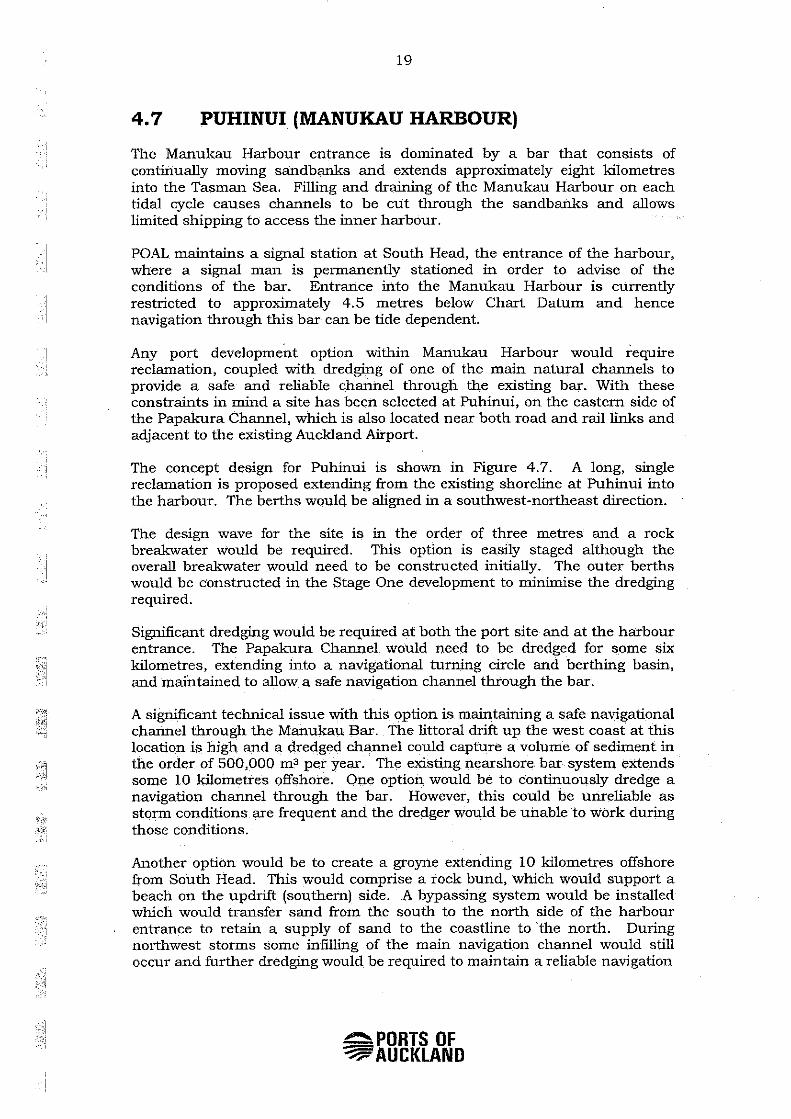
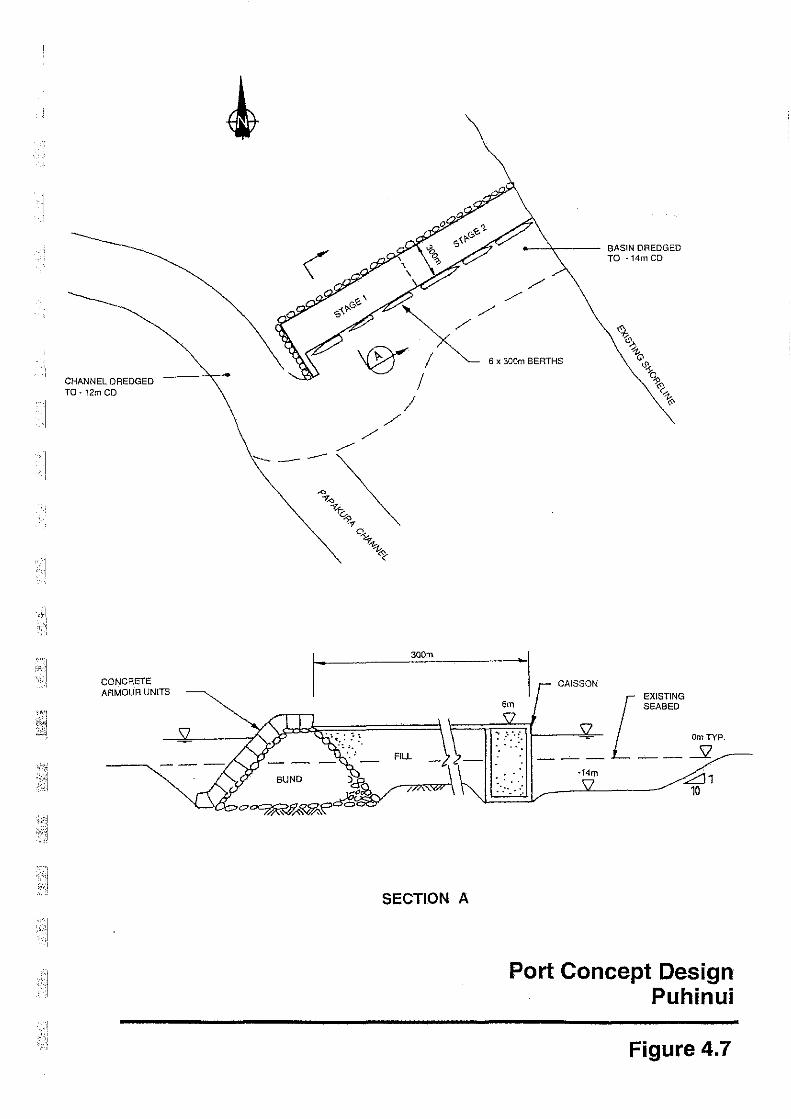
The concept design for Puhinui is shown in Figure 4.7. A long, sing)e reclamation is proposed extending from the existing shoreline at Puhinui into the harbour. The berths woulq be aligned in a southwest-northeast direction.
The design wave for the site is in the order of three metres· and a rock breakwater would be required. This option is easily staged although the overall breakwater would need to be constructed initially. The outer berths would be constructed in the Stage One development to minimise the dredging required.
Significant dredging would be required at both the port site and at the harbour entrance. The Papakura Channel would need to be dredged for some six kilometres, extending into a navigational turning circle and berthing basin, and maintained to allow a safe navigation channel through the bar.
A significant technical issue with this option is. maintaining a safe navigational channel through the Manukau Bar. The littoral drift up the west coast at this location is high and a dredged channel could capture a volume of sediment in the order of 500,000 ma per year. The existing nearshore bar system extends some 10 kilometres offshore. One option would be to continuously dredge a navigation channel through the bar. However, this could be unreliable as storm conditions are frequent and the dredger would be unable to work during those conditions.
Another option would be to create a groyne extending 10 kilometres offshore from South Head. This would comprise a rock bund, which would support a beach on the updrift (southem) side. A bypassing system would be installed which would transfer sand from the south to the north side of the harbour entrance to retain a supply of sand to the coastline to the north. During northwest storms some infilling of the main navigation channel would still occur and further dredging would be required to maintain a reliable navigation
.0. PORTS OF "'%;:::'AUCKLAND
I I
... I
CHANNEL DREDGED T0+12mCD
CONCRETE ARMOUR UNITS
300m
SECTION A
CAISSON
Port Concept Design Puhinui
Figure 4.7

':1
21
channel. Even with this complex bypassing system, some closures could still be expected during extreme storms and the risk associated with having an unreliable entrance channel would be moderate to high.
4.8 MURIWAI OFFSHORE PORT (NORTHWESTERN COASTLINE)
This length of coastline comprises mainly sandy beaches interspersed with rocey headlands. It has an extremely high energy wave environment which presents a major difficulty in determining any site within this block.
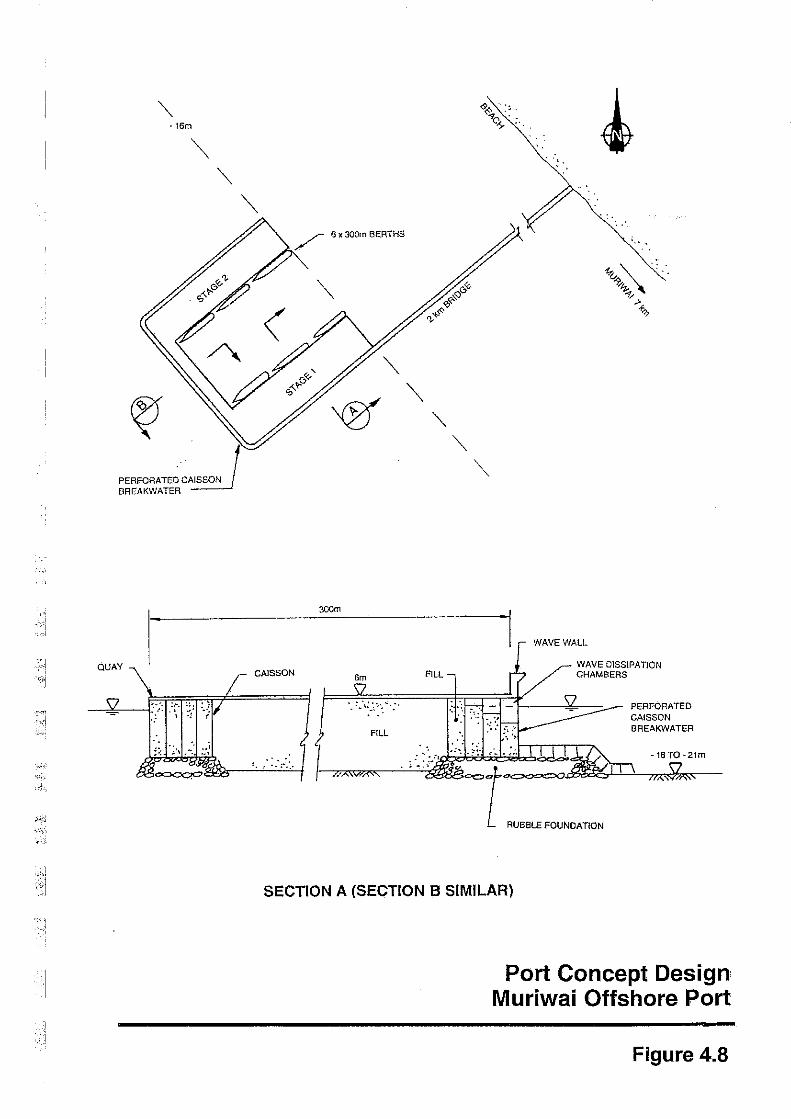
A site near Muriwai has been selected as representative of the coastal block, and the proposed option would be developed as an offshore port in order to avoid long-term maintenance dredging and minimise the impacts on the natural beach system. A conceptual layout for this option is shown in Figure 4.8.
The offshore port would be located approximately seven kilometres from Muriwai and would be connected to the coastline via a two kilometre bridge. A transport corridor would extend up through the valley from Muriwai Beach to the Main Trunk Railway and State Highway 16 at Woodhill.
This option would comprise a U-shaped development with an outer perforated caisson breakwater, and a three-berth reclamation forming the Stage One development. The berths would be aligned in a southwest-northeast direction in line with the predominant winds of the area.
The design wave height for the caisson breakwater would be about 18 metres. The port location would be subject to a high energy wave environment with a swell of up to four metres experienced very frequently and extreme waves of up to 11 metres expected. A significant risk would be associated with the construction of a port and the provisions of safe navigation in this environment.
4.9 KAIPARA HARBOUR
Any port option within the Kaipara Harbour would encounter the same navigational problems associated with Manukau Harbour (i.e. crossing the bar at the harbour entrance). As these problems are mutual and any Kaipara option would require longer transport links to the existing system, no option has been identified in this block.
4.10 SOUTHWESTERN COASTLINE
This length of coastline encompasses the Awhitu Peninsula. It receives a large influx of sediment from the Waikato River and is also subject to significant coastal erosion. Almost the entire coast comprises cliffs, which would make access to an alternative port site impractical. Therefore, no option has been identified in this block.
~PORTS OF ""%:='"AUCKLAND
''i
i!
·16m
PERFORATE~GAISSON I BREAKWATER
QUAY CAISSON
""'
300m
6m FILL
·,
''
""'0.. '$/z. .,/ > f,
WAVE WALL
WAVE DISSIPATION CHAMBERS
f==co~~-.'7.-.===rn~=:=r~~--£?.--=~ PERFORATED • • CAISSON
FILL BREAKWATER
RUBBLE FOUNDATION
SECTION A (SECTION 8 SIMILAR)
Port Concept Design Muriwai Offshore Port
Figure 4.8
I f
>f
23
5. COST COMPARISON
5.1 INTRODUCTION
An assessment of the cost of the alternative port sites and the upgrade of FOAL's existing site have been undertaken. This assessment included the,. quantification of the capital, operating and maintenance costs of the various alternative port options and compared these results with the costs anticipated as a result of the proposed upgrade of FOAL's existing site.
The costs are broad estimates but are adequate for the purpose of option comparison. Sensitivity testing shows which of these cost elements are the most important and this will guide any further refinement of the castings.
5.2 ASSUMPTIONS
In preparing cost comparisons the following factors have been assumed or derived:
a) Basis of Comparison Evaluation Period and Discount Rate
A 30 year period has been used for the analysis and a discount rate of 10%, with sensitivity testing to 7.5% and 12.5%. All costs are expressed in 1997 dollar values. The analysis accounts for the cost to the port developer and for additional infrastructure costs likely to be encountered. It has been assumed that with hubbing of the main shipping lines to one or two ports of call in New Zealand, the location of the second. port would not. significantly affect shipping operators' costs.
b) Cargo Volume Growth and Productivity Improvements
Growth in throughput over the past 10 years has been approximately 9% per annum. There has been an accompanying productivity improvement of approximately 6.5% per annum in the utilisation of the general cargo port area, resulting in net growth in capacity requirements of 2.5%. The growth rate and productivity improvement is historically high and partly the result of deregulation in the port industry. ln the future, more moderate rates of demand growth are expected and productivity improvement will also be lower on average.
While predicting gro"\Vih rates and likely productivity improvement is difficult, this is necessary to estimate the timing and need for a second port. Based on current market trends and moderate levels of productivity improvements, growth within the next five or so years may reach 7% per annum. Longer-term growth is likely to be lower, probably within the. range of 2 - 4% per annum.
In the long term, it is predicted that net growth rates are likely to remain at or below the current levels, and for the purpose of this study have been assumed to range between 1 - 4%. This implies that as throughput increases, so do productivity improvements. This is also what has historically happened. Possible growth rates are contained in Table 5 .1.
.O.PORTS OF ??AUCKLAND
24
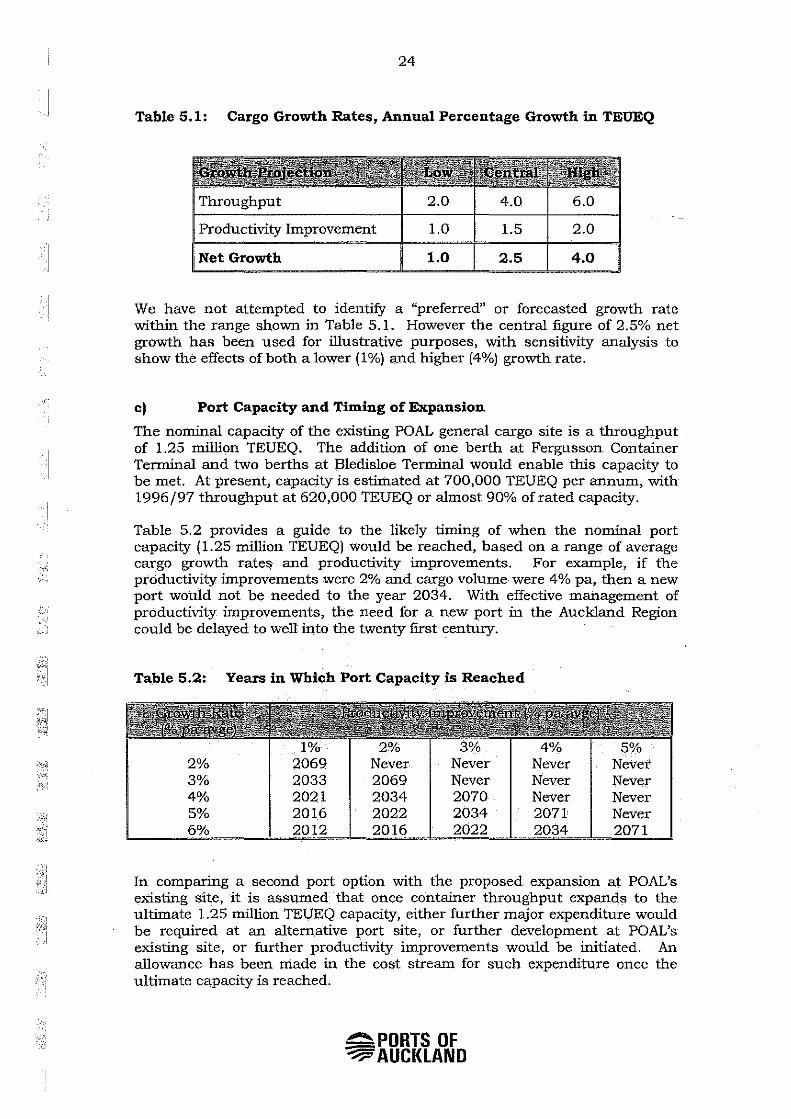
Table 5.1: Cargo Growth Rates, Annual Percentage Growth in TEUEQ
Throughput 2.0 4.0 6.0
Productivity Improvement 1.0 1.5 2.0
Net Growth 1.0 2.5 4.0
We have not attempted to identify a "preferred" or forecasted growth rate within the range shown in Table 5.1. However the central figure of 2.5% net growth has been used for illustrative purposes, with sensitivity analysis to show the effects of both a lower (1 %) and higher (4%) growth rate.
c) Port Capacity and Timing of Expansion
The nominal capacity of the existing POAL general cargo site is a throughput of 1.25 million TEUEQ. The addition of one berth at Fergusson Container Terminal and two berths at Bledisloe Terminal would enable this capacity to be met. At present, capacity is estimated at 700,000 TEUEQ per annum, with 1996/97 throughput at 620,000 TEUEQ or almost 90% of rated capacity.
Table 5.2 provides a guide to the likely timing of when the nominal port capacity (1.25 million TEUEQ) would be reached, based on a range of average cargo growth ratel;l and productivity improvements. For example, if the productivity improvements were 2% and cargo volume were 4% pa, then a new port would not be needed to the year 2034. With effective management of productivity improvements, the need for a new port in the Auckland Region could be delayed to well into the twenty frrst century.
Table 5.2: Years in Which Port Capacity is Reached
1% 2% 2069 Never Never Never Never 3% 2033 2069 Never Never Never 4% 2021 2034 2070 Never Never 5% 2016 2022 2034 2071 Never
2022
In comparing a second port option with the proposed expansion at POAL's existing site, it is assumed that once container throughput expands to the ultimate 1.25 million TEUEQ capacity, either further major expenditure would be required at an alternative port site, or further development at POAL's existing site, or further productivity improvements would be initiated. An allowance has been made in the cost stream for such expenditure once the ultimate capacity is reached.
-.PORTS OF ~AUCKLAND
I
·:•1
25
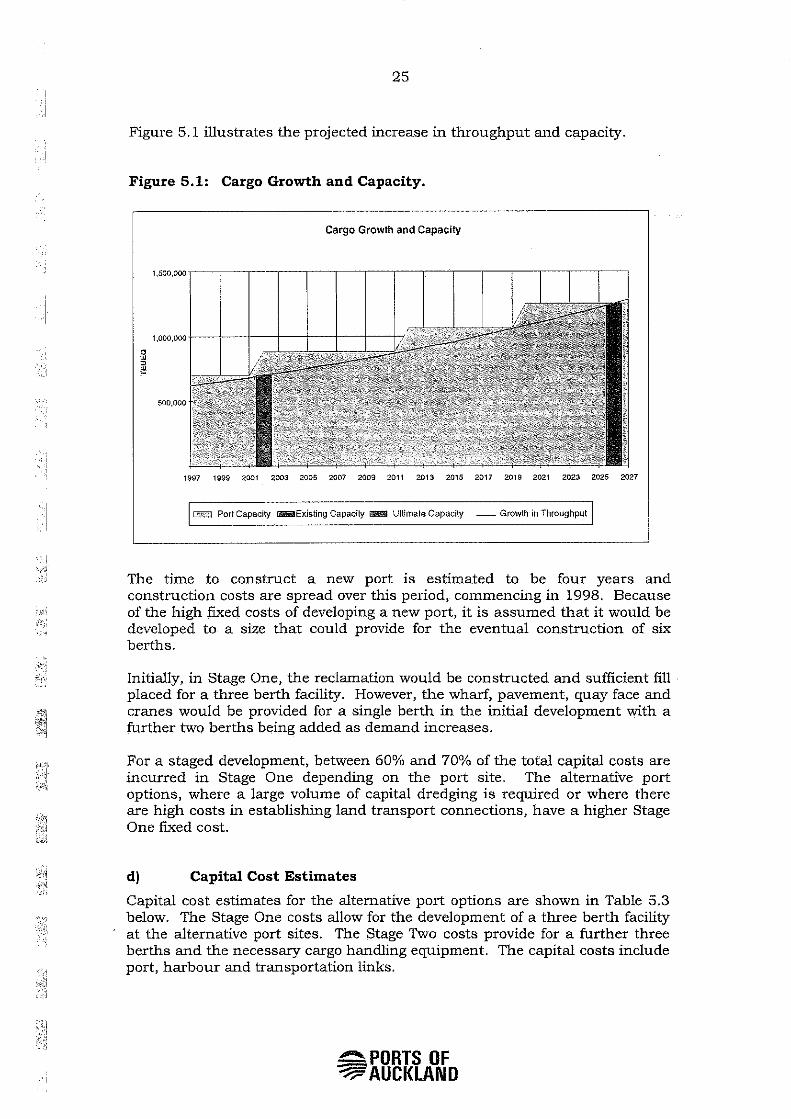
Figure 5.1 illustrates the projected increase in throughput and capacity.
Figure 5.1: Cargo Growth and Capacity.
Cargo Growth and Capacity
1997 1999 2001 2003 2005 2007 2009 2011 2013 2015 2017 2019 2021 2023 2025 2027
13::3 Port Capacity i.iiiiiilii~Existing Capacity illi!lli!il Ultimate Capacity - Growth in Throughput
The time to construct a new port is estimated to be four years and construction costs are spread over this period, commencing in 1998. Because of the high fixed costs of developing a new port, it is assumed that it would be developed to a size that could provide for the eventual construction of six berths.
Initially, in Stage One, the reclamation would be constructed and sufficient fill placed for a three berth facility. However, the wharf, pavement, quay face and cranes would be provided for a single berth in the initial development with a further two berths being added as demand increases.
For a staged development, between 60% and 70% of the total capital costs are incurred in Stage One depending on the port site. The alternative port options, where a large volume of capital dredging is required or where there are high costs in establishing land transport connections, have a higher Stage One fixed cost.
d) Capital Cost Estimates
Capital cost estimates for the alternative port options are shown in Table 5.3 below. The Stage One costs allow for the development of a three berth facility at the alternative port sites. The Stage Two costs provide for a further three berths and the necessary cargo handling equipment. The capital costs include port, harbour and transportation links.
-PORTS OF ~AUCKLAND

·.1
26
Table 5.3: Capital Cost Summary for Alternative Port Options, $M (1997)
Karepiro Bay 1,205 655 1,860
Ponui Island 1,235 660 1,895
WairoaBay 1,440 580 2,020
Ponui Offshore Port 1,480 650 2,130
Muriwai Offshore Port 1,600 765 2,365
Puhinui 1,785 655 2,440
Based on the capital costs shown in Table 5.3, the following preliminary conclusions can be made:
• The Karepiro Bay option has the lowest capital cost requirement of the alternative port options, with the Ponui Island option being attributed the second least expensive costing.
• The capital costs associated with the Muriwai Offshore Port option and the Puhinui option are substantially more expensive than all other options.
e) Port Maintenance and Operating Costs
Annual maintenance costs of basic civil infrastructure have been calculated at 0.5% per annum of the capital cost. For cargo handling equipment, the repair and maintenance costs together with capital depreciation have been assumed at 5% per annum of the capital cost for container cranes and 15% per annum for straddle carriers. As the port's. operating activities will be similar for all options, these costs are common and have been excluded from the analysis. In some options there is a need for an annual maintenance cost for channel dredging which has been estimated on a quantity and rate basis.
If a second port were developed, POAL would incur further ftxed annual overhead costs due to the split operation, as there would be a need for additional staff and administrative services, increased communication costs between the two operations and less opportunity for sharing resources. An allowance of $1.5 million per annum has been included in the costing.
f) Inland Distribution Costs
For inland distribution, costs have been estimated for road transport to or from a central distribution location, assumed to be the Penrose/Mt Wellington area. For rail transport, the majority of trafftc will be to and from points south of Auckland. The transport costs have been compared to a common point where the southernmost option would link to the North Island Main Trunk rail line at Papakura.
""""" PORTS OF "%:=='AUCKLAND

·'I i
'
''i
I
.,.1
27
Inland transport costs by road or rail comprise a fixed cost per container and a variable cost based mainly on distance. Only the variable component is included in the castings, as the fixed cost is common to all port alternatives.
Additional road costs have been based on the number of containers that would be diverted to a second port, the additional kilometres travelled, and a variable cost estimated to be $1.50 per container per kilometre. A basic annual·· maintenance cost of $10,000 per kilometre per annum has been assumed for the link road to the new port. All other pavement maintenance costs are assumed to be accounted for through road user charges, which are part of the distance-variable transport cost.
Rail costs have been calculated similarly, using a distance-variable cost of $0.50 per container per kilometre. A further allowance is made for maintenance of the additional track and signalling for the rail link of $15,000 per kilometre per annum.
5.3 RESULTS OF THE COST COMPARISON
5.3.1 Net Present Value
The cost comparison has resulted in a ranking of the proposed development options, according to the capital, operating and maintenance costs associated with the additional port facilities and the associated land transport costs. Table 5.4 shows the additional total discounted cost of a new port facility, over and above the cost associated with the expansion at POAL's existing site.
Also shown is the cost per TEUEQ throughput across the alternative port options. This figure represents the additional cost per TEUEQ (based on a net growth rate of 2.5%) that would need to be recovered through additional port and transportation charges. Sensitivity analysis of the lower ( 1 %) and higher (4%) net growth rates are shown in Table 5.5.
Based on the discounted operational and capital costs shown in Table 5.4 the following preliminary conclusions can be made:
• The discounted cost of the upgrade of POAL's existing site. is significantly less than any of the alternative port options, with the least cost alternative estimated to cost an additional $720 million.
• While the Ponui Island option has relatively high development costs for the infrastructure works and land transport connections, over a 30 year period this option has the lowest discounted costs.
• The Karepiro Bay and Wairoa Bay are the next lowest cost alternative port options, with Ponui Offshore Port, Puhinui and Muriwai Offshore Port all experiencing significant additional costs.
-.PORTS OF ~AUCKLAND

I
I
. I
I
i
I
28
Table 5.4: Discounted Cost of Alternative Port Options Compared Against Expansion at POAL's Existing Site ($M)
Ponui Island 720 650
Karepiro Bay 760 690
WairoaBay 770 700
Ponui Offshore Port 900 820
P:uhinui 1,150 1,070
Muriwai Offshore Port
Note: $/TEUEQ refers to the total additional capital and operating costs (above and beyond the cost of upgrading POAL's existing site) divided by the number of TEUEQ through the alternative port options discounted over a 30 year period.
5.3.2 Sensitivity of the Results
The sensitivity of the results to variation in cargo growth rate, discount rate and inland transport costs are shown in Table 5.5 for the lowest cost altemative port option (Ponui Island).
Table 5.5: Sensitivity of Additional Cost per TEUEQ to Changes in Input Assumptions for Ponui Island Option
~PORTS OF ?7AUCKLANO
,] I
. !
29
The cost per TEUEQ is most sensitive to the cargo growth rate, particularly if this were to be lower than 2.5%. A lower growth rate would cause the altemative port option, as a second regional port, to be under-utilised, the fixed cost having to be spread over a smaller throughput. An increase in cargo growth above the projected growth rate would result in a cost reduction per container, but to a lesser extent. This indicates that the development of an· altemative port option, as a second regional port, carries a significant risk if cargo demand is low. Any shortfall in cargo throughput would also have the effect of raising costs for the use of the facilities, which is also likely to further dampen demand .
The cost per TEUEQ is neither sensitive nor insensitive to variation in the capital cost or the discount rate. That is, a 1% change in either of the factors produces close to ·a 1% change in the cost per TEUEQ.
The cost per TEUEQ is insensitive to variations in the inland transport costs, as they comprise a relatively small proportion of total costs of the Ponui Island option.
Another variation was to include developing a second regional port (based on the Ponui Island option costs) in year 28 of the cost analysis. Such a development would reduce the cost per TEUEQ from $650 to $600, a reduction of 8%.
5.3.3 Conclusion
Of all the altemative port options investigated, the Ponui Island option is likely to result in the least costs, although this option is still significantly more expensive than the redevelopment of POAL's existing site.
-.PORTS OF ~AUCKLAND
, I I
30
6. ENVIRONMENTAL EVALUATION
6.1 POTENTIAL ENVIRONMENTAL EFFECTS
The potential environmental effects of the alternative port options are outlined in the following sections. This assessment is used as the basis for determining, the best alternative port option on environmental grounds. The effects range from physical environmental effects such as dredging and the construction of reclamations, to the socio-economic effects such as the impacts on transportation networks and the proposed regional growth strategy.
The RMA controls the effects of activities on the environment. The alternative port options must therefore comply with the requirements of the RMA. The New Zealand Coastal Policy Statement 1994 ("NZCPS") was promulgated under the RMA and controls activities undertaken in the coastal marine area. The proposed options must also comply with the requirements of the NZCPS.
6.2 OPTION EVALUATION
6.2.1 Dredging and Disposal The dredging and disposal issues associated with the proposed options include the effects of capital and maintenance dredging and the disposal of dredged materials.
The volume of capital dredging required for each of the options varies from no dredging for the offshore island options to 4,000,000 ms for the Ponui Island option, and 25,000,000 m3 for the Wairoa Bay option. While the Wairoa Bay option is most significant in terms of the 25,000,000 ms of capital dredging for its Tamaki Strait access, when both capital and maintenance dredging are considered the Puhinui option is likely to have the most significant effects. Unlike the 35,000 m 3 to 195,000 m 3 of maintenance dredging required per annum for the other options, the maintenance dredging required for the Puhinui option could be in the order of 1,000,000 msper annum.
The annual maintenance dredging at the existing POAL site is about 40,000 m3. Currently, this is disposed of beyond the territorial sea limits. While the proposed Fergusson Container Terminal extension would require a small amount of capital dredging to create a 13.5 metre deep berth, any additional berth is unlikely to require significant maintenance dredging as it would be located in the main tidal stream in which tidal currents are sufficient to maintain a deep water berth.
At Karepiro Bay, capital dredging of over 17,000,000 ms would be required to create a new port with annual maintenance dredging in the order of 100,000 m3.
The capital dredging requirements for the Wairoa Bay option are 25,000,000 m3. This option requires a dredged channel across Tamaki Strait. Maintenance dredging for the long navigational approach channel and the port basin is estimated to be 190,000 m3 per year.
~PORTS OF "%:='AUCKLAND
31
Ponui Island requires 4,000,000 m3 of capital dredging, most of which could be re-used as stabilised reclamation fill. It is estimated that lohger term maintenance dredging would be in the order of 35,000 m3 per year of fme material. This material would be dumped beyond the territorial sea limits.
No dredging is envisaged at the Ponui Offshore Port option, and this is one of the reasons for the promotion of a port island option. It is also anticipated, that long term maintenance dredging will be minimal.
At Puhinui, capital dredging of 14,000,000 m3 of :fme material would be required to create the port, and a further 21,000,000 m3 of sand would be dredged from the Papakura Charmel and the entrance charmel through the Manukau Bar. Longer-term maintenance dredging requirements are assessed to be over 1,000,000 m3 per year. The silt material, which would be deposited within the port area, will need to be dumped in deep·water in the Tasman Sea. The sand material at the bar would be bypassed to the northern side to maintain the sediment supply to the northern beaches.
As with the Ponui Offshore Port option there is not expected to be any dredging associated with construction and operation of the Muriwai Offshore Port option.
6.2.2 Transportation The potential transportation effects of the alternative port options include the effects of the construction and operation of new road and rail links and increased use of the existing links. The options which require the construction of longer link roads and rail connections are likely to have the most significant potential impacts together with those that pass through more ecologically sensitive areas.
Redevelopment of FOAL's existing site is likely to have the least significant transportation impacts. In recognition of the need to improve current transport links to downtown Auckland as the port expands, Transit New Zealand and FOAL are planning a direct link from Stanley Street to the port site. This is expected to mitigate the potential transport impacts of the existing facility.
Development at Karepiro Bay will necessitate additional road and rail access to the site .in an area. Significant impacts will be associated with both the rail and road access to the site in an area which currently has a bush and forest cover and which is also relatively steep. A long rail link will also be required out towards Kaukapakapa.
A relatively long road and rail link is required for the Ponui Island option extending from the southern motorway through the Wairoa Valley. Both the road and rail links will have a significant effect on the mainly rural local community.
The Ponui Offshore Port option's transportation route is similar to the Ponui Island option for most of its length, and is likely to produce the same scale and intensity of environmental effects.
~PORTS OF --..?AUCKLAND
. )
32
Part of the route required to service the Wairoa Bay option is similar to the Ponui options, however the distance is a little less. The scale and significance of the potential transportation effects of the Wairoa Bay option are considered to be similar to the Ponui options.
The Muriwai Offshore Port option was selected because a transport corridor could be created along an existing valley and only a moderate length of both" road and rail are required to join the state highway and main trunk rail system at Waimauku. The potential environmental effects of this transport option are expected to be relatively minor.
With the Puhinui option, existing road and rail corridors are located nearby and it is anticipated that the necessary links can be created relatively easily. Because the area is urbanised and industrial in nature, this option is not expected to result ·m any significant adverse transportation effects. The transportation associated with this option is expected to have the least significant environmental effects .
6.2.3 Hydraulic Effects The proposed extension of POAL's existing site is not expected to result in any significant adverse hydraulic effects. The proposal would extend into the main tidal channel of the Waitemata Harbour. The effects on both tidal flows and sedimentation have been assessed and are considered to be relatively minor.
The creation of the large approach channels and the port reclamation required as part of the development of the Karepiro Bay option will alter the tidal and. sedimentation regimes in both the Weiti and Okura Rivers.
The dredging of the port basin at the Wairoa Bay option would significantly affect the flow and sediment regime near the mouth of the Wairoa River. The entrance channel could also alter the tidal flows in Tamaki Strait and the Waiheke Channel.
Local tidal currents and navigation around the southern end of Ponui Island would be affected by the Ponui Island option. However, this option would also offer further wave protection to the Kawakawa Bay area and is not expected to have a significant hydraulic effect.
The Ponui Offshore Port option would create a minor localised increase in tidal currents, possibly extending to Titokarua Reef. The wave shadow in the lee of the port would have a minor and generally beneficial effect on shoreline beach processes.
The Puhinui option is likely to result in the most significant hydraulic effects. The proposed reclamation and the dredged port basin would significantly affect the flow and se.diment regimes in the adjacent Pukaki Creek and Puhinui Creek. The deepening of the Papakura Channel could also alter the tidal regime of the Pahurehure Inlet. The opening of a deep entrance channel across the Manukau Bar would allow increased wave energy into the harbour area, which could affect the coastline near the harbour entrance.
-.PORTS OF -:::::~AUCKLAND
. :.j .
33
The Muriwai Offshore Port option is unlikely to result in any significant hydraulic effects. However, the island has potential to create a partial tombola or salient along the coastline, and the beach could accrete in the lee of the port which would partially interrupt any sediment movement along the coast.
6.2.4 People/Recreation The option with the least potential impact on people and recreation is redevelopment of POAL's existing site. While the Bledisloe and Fergusson Terminal extensions would have a cumulative effect on the water space available for boating and sailing, this is much less than the potential adverse effects associated with the development and operation of the alternative port options.
Of the alternative port options the Karepiro Bay option is likely to have the most potential effects on people and recreation due to the close proximity of this site to the Weiti and Okura Rivers. The Weiti and Okura Rivers are restricted water areas that are regularly used by recreational boaters.
There should be little interference with recreational fishing and boating as a result of the Muriwai Offshore Port option, as it will be located two kilometres off the coast. However, there may be minimal interruption to land based passive recreation as a result of the access pier to the island .
The Ponui Offshore Port, the Ponui Island and the Wairoa Bay options may have an impact on the waters around the sites that are used for recreational fishing and boating.
The water space surrounding the Puhinui option is not heavily used, compared with the east coast waters, although recreational fishing may be slightly affected by this option.
6.2.5 Visual and Natural Character The visual impact assessment of the proposed options has been based on site visits to all hut one of the sites, and on the Urban Coastal Landscape Assessment carried out for the Auckland Regional Council, the Auckland Regional Policy Statement ("RPS"), the Regional Plan.- Coastal and the 1984 Regional Landscape Study. The RPS and the Regional Plan- Coastal require that for landscapes with a '6' or '7' rating, priority is given to the protection of the landscape unit as a whole, Whereas for landscapes with a '5' rating, the policy is to protect features, elements and patterns which contribute to the landscape quality and value.
Of the proposed options the development of POAL's existing site is expected to have the least significant effect on the existing landscape. While POAL's existing site is identified as an outstanding landscape in its own right (though this has been challenged by POAL and a final decision has not been reached), this option would have significantly less visual effect than other options.
The Muriwai Offshore Port and the Ponui Offshore Port are located in landscapes with the potential to be most significantly affected by the
~PORTS OF "'~AUCKLAND
'I ·"i I
34
development of a port. The proposed port and bridge would have implications for the broader Thames estuary landscape and for adjacent local and regional parks. The landscape is regionally significant and the port would impact heavily on the generally undisturbed and undeveloped landscape and the small number of residential and holiday homes located in the area. The transport corridor associated with this option would have visual and natural character implications for the coastline and the Clevedon area.
The bridge and transport corridor proposed at Muriwai would significantly reduce the characteristics of 'wildemess' and 'remoteness' that attract people to this area. This proposal would have visual implications for holidaymakers and users of the West Coast beach. The transport corridor would also pass through part of the Woodhill Forest.
A port facility at Ponui Island would have landscape implications and is only slightly less significant than the Ponui Offshore Port option. This proposal would be partially screened by Ponui Island, but it would affect the adjacent outstanding landscapes and would have implications for the wider Hauraki Gulf landscape. The islands are generally undeveloped, consisting of pasture, bush and hill ranges with small clusters of houses. The proposed transport corridor across the water would also have significant effects on the Hauraki Gulf landscape.
The Karepiro Bay and Wairoa Bay (Duders Point) landscapes would be less visually exposed than the Muriwai and Ponui sites in terms of their visual catchments, but more people would see these sites. Duders Point, which is sited immediately north of the port option, is a regional park and is a regionally significant landscape. However, the visual effects in this landscape are likely to be less than the Ponui Island option because of landform screening.
Parts of Karepiro Bay are an outstanding landscape. A port development in this area would affect the Okura landscape and the natural character around the two river mouths. The proposal would also have a significant impact on the residential areas that overlook the bay.
Although the Puhinui option is located within a very sensitive estuary landscape and is identified as regionally significant because of this, this option is likely to produce less adverse effects on the landscape of the surrounding area because of the existing industrial, port and airport development in this area. This option would be the next preferred option to POAL's existing site terms of effects on visual quality and natural character.
6.2.6 Ecology The potential ecological issues associated with the development of altemative port options include the effects of construction and operation of the port on coastal bird species, natural land forms, marine life, plant and animal habitats, mangroves, intertidal mudflats, bethnic resources and other natural geological and ecological features. Certain areas are also identified as coastal protection areas in the Proposed Regional Coastal Plan ("PRCP") .
.O.PORTS OF ~AUCKLAND
: , I
I '
35
Karepiro Bay is the most ecologically significant site and is identified in the PRCP as 'Coastal Protection Area 2' and as an area of conservation value, The adjacent Long Bay shoreline is also gazetted as marine reserve. The works associated with the port, and in particular approach dredging, are likely to be incompatible with the purposes of the reserve. The significant ecological features of the area include sand spits consisting of shell-sand cheniers overlying fossil estuarine shell beds, a number of coastal bird species, and a. sizeable area of mangroves, some salt marsh and coastal forest.
Ponui Island is the second most sensitive site, with slightly less significance than the Karepiro Bay site. This is mainly because of the proximity of the construction of the accessway to Pakihi Island, which is gazetted as a wildlife refuge. Parts of Ponui Island are identified as Coastal Protection Areas.
The Puhinui, Ponui Offshore Port and Wairoa Bay sites are all of similar ecological value. While the ecological context varies vary from site to site there is nothing about any one site that warrants it being considered more significant than another. However, these sites are less significant than the Karepiro Bay or Ponui Island sites. The intertidal mudflats at Puhinui are extensively utilised by a large number of wading bird species with the shellbanks at Puhinui used as a high tide roost. There are also some high quality areas of saltmarsh, which support a range of plant, animal and bird species. The Wairoa Estuary area contains a wide variety of habitats and natural resources as a consequence of the development of shellbanks and tidal flats.
While the Muriwai area, comprises a regionally important geological feature and provides habitat for coastal birds, the ecological effects of constructing an off shore port are unlikely to be significant there.
Overall, redevelopment of the existing site is identified as the least ecologically significant of the options. The proposed redevelopment is unlikely to result in any cumulative adverse ecological effects.
6.2.7 Urban Growth Strategy The Proposed Auckland Regional Policy Statement sets out the urban growth strategy for the Auckland region. The overall objectives of the urban growth strategy, are to contain development within the existing metropolitan limits, focus development in areas that will not place pressure on expansion of the urban limits and improve the efficiency and effectiveness of the existing urban infrastructure. Expansion of POAL's existing site is the only option that is within the existing metropolitan ilrban limits. The remaining options are all outside the existing urban limits.
'I'he Karepiro Bay option would place pressure on development in North Shore City and the Hibiscus Coast and could have a significant impact on the urban growth strategies for this part of the Auckland Region. A new port development in this locality could lead to the development of a continuous urban area from North Shore City to the Hibiscus Coast.
-.PORTS OF "%?"AUCKLAND

>I
36
A port development in Muriwai area would represent a significant new urban feature in a natural area of unique character. It could result in urban growth pressure at Helensville and from Kumeu to Waimauk:u.
Ponui Island, Ponui Offshore Port and Wairoa Bay options would result in urban activity in a largely undeveloped coastal area. The new transport linkages could generate expansion at places like Clevedon, Clevedon Valley· and Ponui Island.
While Puhinui is also outside the metropolitan urban area, extension of the urban boundaries in this locality would not be inconsistent with the current development pattern, given that the port would be close to the Wiri industrial area.
6.2.8 Conflicts with Other Land Uses Redevelopment of FOAL's existing site is consistent with surrounding landuses and has the least significant potential adverse effects of all the options.
The potential conflict with other land uses as a result of the Puhinui, Ponui Island, Ponui Offshore Port, Muriwai Offshore Port and Wairoa Bay options will be more significant than the upgrade of FOAL's existing site because they are all located in relatively rural locations.
The Karepiro Bay option is likely to produce the most conflict as this option is surrounded by well-established residential areas and a regional reserve, and has the potential for future urban growth to the south. The relatively large rural populations could also be affected by the rail link proposed with this option. There may also be significant conflicts with the surrounding marine areas which are identified in the PRCP.
6.2.9 Amenity Effects Redevelopment of FOAL's existing site and the Puhinui option are likely to have the least sig:riificant amenity effects. Given the close proximity of FOAL's existing site to the central city and existing residential areas, the cumulative increase in effects such as noise, glare and dust as a result of the expansion at FOAL's existing. site are not expected to. be significant. However, the Fergusson and Bledisloe extensions may have a visual impact on North Shore residents. ·
Due to the isolated location of the Puhinui site the. amenity effects are expected to be off-set by distance, although glare may be visible from Weymouth.
The development of the Karepiro Bay option is likely to produce significant effects on the amenity values of the area. The new port would be highly visible and may compromises the natural setting ofKarepiro Bay.
The potential amenity effects of the Ponui Island, Ponui Offshore Port and Muriwai Offshore Port options are all expected to be of a similar scale. The
-.PORTS OF '%:='AUCKLAND

' '
i I
37
proposed road and rail links are expected to be tbe main amenity effects in tbese areas.
The effects of tbe W airoa Bay option are expected to be similar to tbe effects of tbe Muriwai Offshore Port and Ponui options but may be significant given tbe proximity of this site to a greater concentration of rural and rural-residential land. Noise is potentially a greater concem in tbis locality.
6.2.10 Cultural The project team did not undertake any specialist cultural assessment of options. This is because there are a large number of different Iwi holding Tangata Whenua status witbin tbe study area. For a study such as this, it would be impossible to involve all lwi and hence tbe project team relied on advice given to POAL by different Iwi groups and on tbe team's own experiences in tbe region. Such an approach cannot hope to be fully representative of lwi concerns and furtber lwi input would be required if a more definitive view was required.
In discussions witb Huakina Development Trust, Ngati te Ata, Ngati Paoa Whanau Trust Board and Ngai Tai Ki Tamaki Tribal Trust a preference was expressed for development at POAL's existing site. In the case of Ngati te Ata tbis statement was specific to tbe comparison witb tbe Puhinui site as tbe otber sites in tbe study were outside tbeir area of influence.
-.PORTS OF "%::="AUCKLAND
38
7. EVALUATION OF OPTIONS
The specialists convened for this assessment have evaluated the alternative port options against the design criteria stipulated in Section 3 of this report, within their particular areas of expertise. The results of this exercise are discussed below.
The project team concluded that the redevelopment of POAL's existing site would have significantly fewer adverse effects than any of the other port development options. Importantly, the option with the next lowest effect (Muriwai Offshore Port) has a score more than twice that of the redevelopment of the POAL's existing site.
Table 7.1 illustrates the rating of each option according to the potential environmental effects. For the purpose of reaching a preferred option, each category was ascribed a score in the range 0 to 10, with 0 signifying no adverse effect and 10 a very significant adverse effect.
Table 7.1: Possible Port Development Options and Rating of Environmental Effects
V-~
... _ .... _ ., .... p.,..pt../ M..,.• Cultutal ......... ., --· ,.,.,., ... ...........
Exp...!= •• FOAL's Edstill.g Site
Karepi>;o .. , 1'4uriwai Offshore Port
Puhiunl
Ponul ldu.d
Panni Off•hore Port
WairoaBay
• ....... c ........
0 10
3
7
8
5
8
9
7
a..- wJtt. othe .. . ~ ... ...... .,. Land....,
1 0 3 3
9 9 7 6
4 9 4 3
6 3 4 4
7 7 4 5
6 7 4 5
6 7 5 4
No effect Very significant advt,>rse effect
"""'-"""' E.IToc:t. • . ........ 0 5 3 2 2
0 10 8 5 8
3 10 4 0 4
4 10 3 10 1
2 10 4 4 7
2 10 4 0 7
1 10 5 7 5
The evaluation shown in Table 7.1 is a simple form of analysis, and assumes that all of the effects within the categories have equal importance. It relies on the total of the category scores. to determine the most appropriate option.
Given this simplicity, further analysis of the scoring was undertaken to ensure that the results presented in Table 7.1 were a true representation of the intensity of adverse effects.
-.PORTS OF ~AUCKLAND
1
5
1
10
3
1
6
''"~
23
74
50
60
61
55
63
I
39
Firstly, as the ratings for the cultural effects were assumed at each site on the basis of the assessment team's appreciation of Iwi's reaction to this type of development, we have also compared the redevelopment of POAL's existing site with other options taking a more conservative approach to the rating. The cultural effect of undertaking the redevelopment at POAL's existing site has been given a rating of 5; the other sites a rating of 10. If it were to assumed that the cultural effects on all of the options was 10, the development of POAL's existing site would still have an environmental effect rating 80% less than the next lowest ranked option. It was concluded that Iwi concems would only affect the final ranking if there was cross-Iwi consensus as to the preferred option and it was given paramount importance in the overall effects assessment.
To minimise any inconsistency that could arise when taking the sum total of all the categories (as was done in Table 7.1), the individual environmental effect ratings were compared against the effect ratings of other options and assigned a rank or placing. Assigning an option a 1st indicated that it was the preferred option in terms of the least potential for adverse environmental effects and similarly, assigning an option 7m indicated that it was ranked lowest. Table 7.2 illustrates the results of this analysis.
Table 7.2: Possible Port Development Options and Ranking of Environmental Effects
.... d rieo1oa ... _
"'""'" People/ """"" c ...... Am.enlty ......... T ...... port R7draullu
• . .....,. .... ....... - c........w ....... • ........ stnteu ""'"' ._.. ChUiiocte1' """'~
Exp.....,n •• 1• 1• 1• 1"' 1= 1• 1"' 1• 3" 2•• POAL'Ji ~Sit.e
K:al"ep&'o 3• 7• 6• 7• 7• 1• 2- 7• s• ,. Bay
Marlwd 5= 2M 6• 2= 1= 6" 2= 3= 1• 3• Offshore Port
hhlnui 2M 3• 2•' 2· 3• 7" 2· 1• 7" 1"'
Ponui 5• 6" 3= 2• 5• 4• 2- 3· 4" 5= bland
._ .. 7• 3- 3• 2= .. 4• 2_;, 3= 1• 5-Offslaore Pod
Walroa B~y 3• 3• 3• 6" 3• 3•• 2= 6" 6lli 4"
Note: Preferred opUon ln terms of minimising environmental effects' Least preferred option in tenns of minimisiri.g environmental effects
The ranking approach of Table 7.2 also confirms that the redevelopment of POAL's existing site is the preferred development option (with nine firsts), and the next best option is Muriwai Offshore Port with three firsts.
~PORTS OF ~AUCKLAND
1•
s•
1•
7"
4"
1•
6"
"·-,..,.,...
1.3
5.2
2.9
3.4
3.9
.
3.3
4.1
,···: ,,
40
8. CONSULTATION
In February 1999, a meeting was held with officers of the following organisations to discuss a draft report.
• • • •
Auckland City Council . Auckland Regional Council. Department of Conservation . Ministry for the Environment .
As a general outcome, it was agreed that the main conclusions of the report were reasonable. Any future development, however, would require resource consents which would be the appropriate opportunity to update the issues and deal with matters in more detail.
It was confirmed that, unlike the 1989 Port Plan which dealt with the entire port area, this report focussed on the main commercial port area, east of Bledisloe Wharf. It is the intention of POAL, as part of its long term port plan, to continue to use Captain Cook, Queens and Wynyard Wharves as provided for in the Auckland Region Plan: Coastal. lf any of these wharves were to be used for other non-commercial port purposes, equivalent facilities would need to be developed elsewhere.
.0:. PORTS OF "%:='AUCKLAND

I
. i
. I
I
41
9. CONCLUSION
The following conclusions are made in respect of the proposed options:
•
•
Development at POAL's existing site is the preferred option in terms of both cost and potential environmental effects .
Overall, Ponui Island and Ponui Offshore Port options are the next most feasible options in terms of both cost and environmental effects. Ponui Island is the least costly alternative port and rated ftfth on environmental grounds. Ponui Offshore Port option is rated third on environmental grounds and in terms of cost is rated fifth.
• While Muriwai Offshore Port is rated second on environmental grounds, it is the most expensive of the alternative port options .
• While Karepiro Bay is likely to produce the highest adverse environmental effects, it is the third least expensive of the alternative port options.
,-.PORTS OF '%='AUCKLAND