Port Cooperation Agreements Propelling Capital Projectsaapa.files.cms-plus.com/2018Seminars... ·...
37
1 Port Cooperation Agreements Propelling Capital Projects AAPA Capital Projects Seminar Norfolk, VA May 9, 2018
Transcript of Port Cooperation Agreements Propelling Capital Projectsaapa.files.cms-plus.com/2018Seminars... ·...
1
Port Cooperation Agreements Propelling
Capital Projects
AAPA Capital Projects Seminar
Norfolk, VA
May 9, 2018
2
Andy Hecker Chief Financial Officer
PortMiami
Dakota ChamberlainChief Facilities
Development Officer
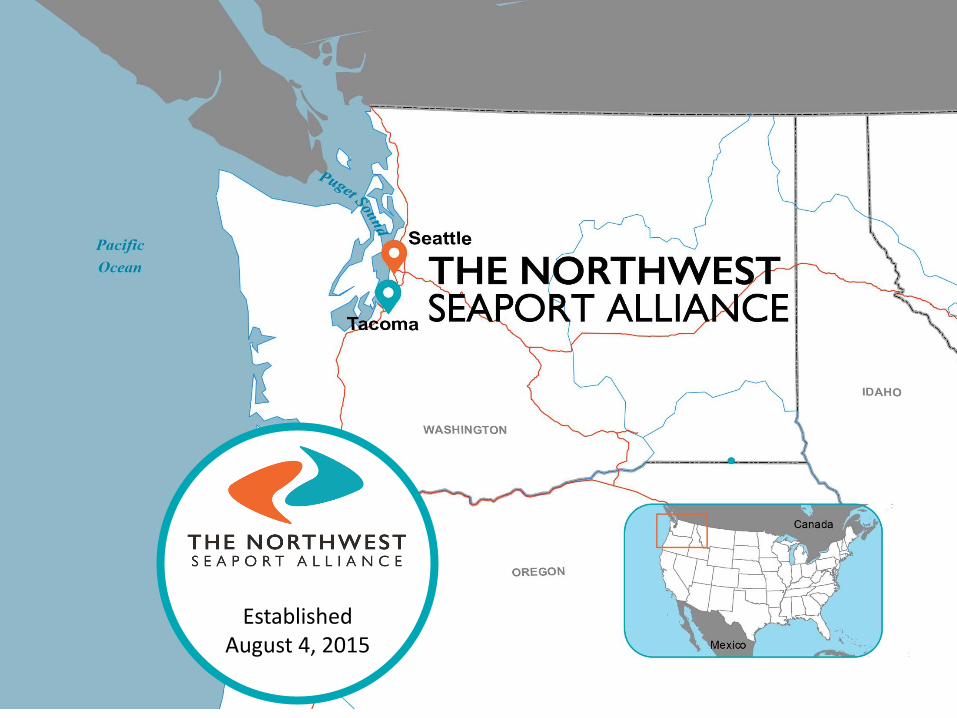
Northwest Seaports
Alliance
3
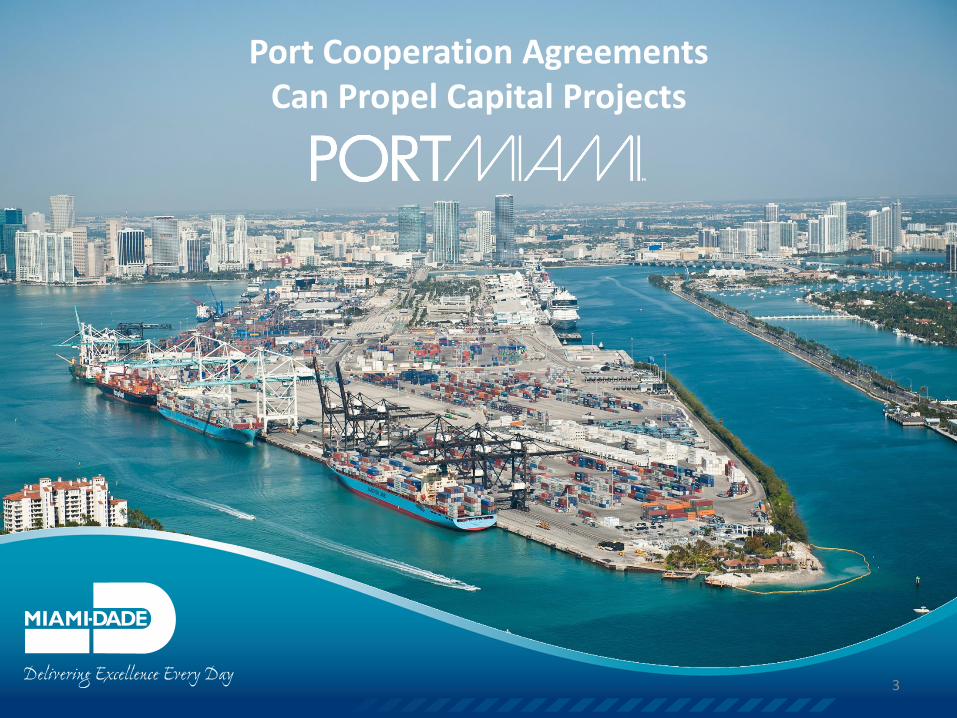
Port Cooperation Agreements Can Propel Capital Projects
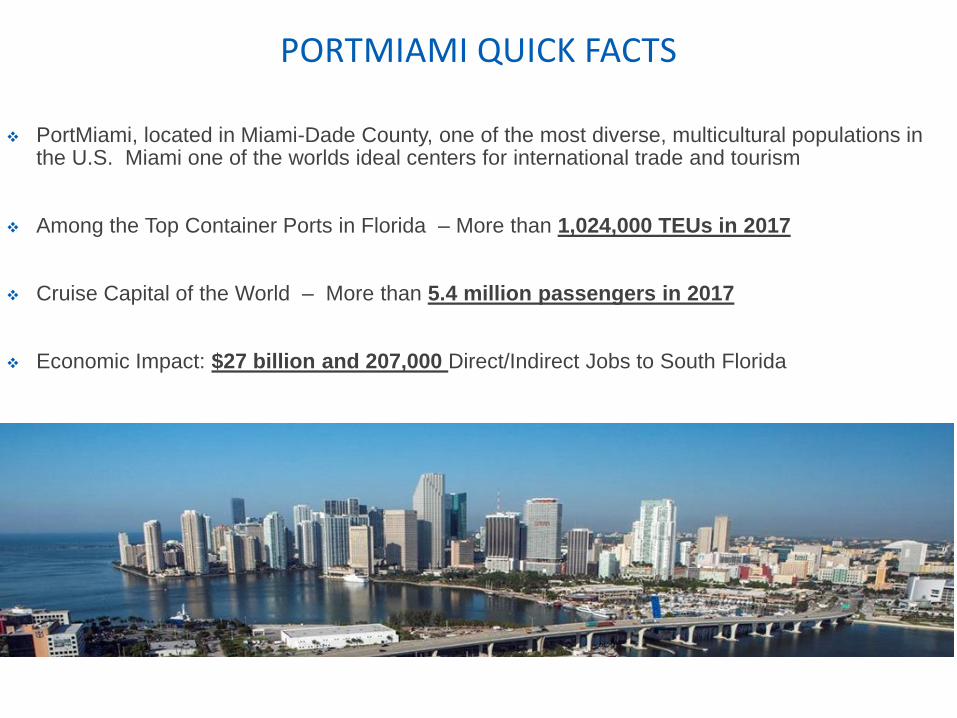
PORTMIAMI QUICK FACTS
❖ PortMiami, located in Miami-Dade County, one of the most diverse, multicultural populations in the U.S. Miami one of the worlds ideal centers for international trade and tourism
❖ Among the Top Container Ports in Florida – More than 1,024,000 TEUs in 2017
❖ Cruise Capital of the World – More than 5.4 million passengers in 2017
❖ Economic Impact: $27 billion and 207,000 Direct/Indirect Jobs to South Florida
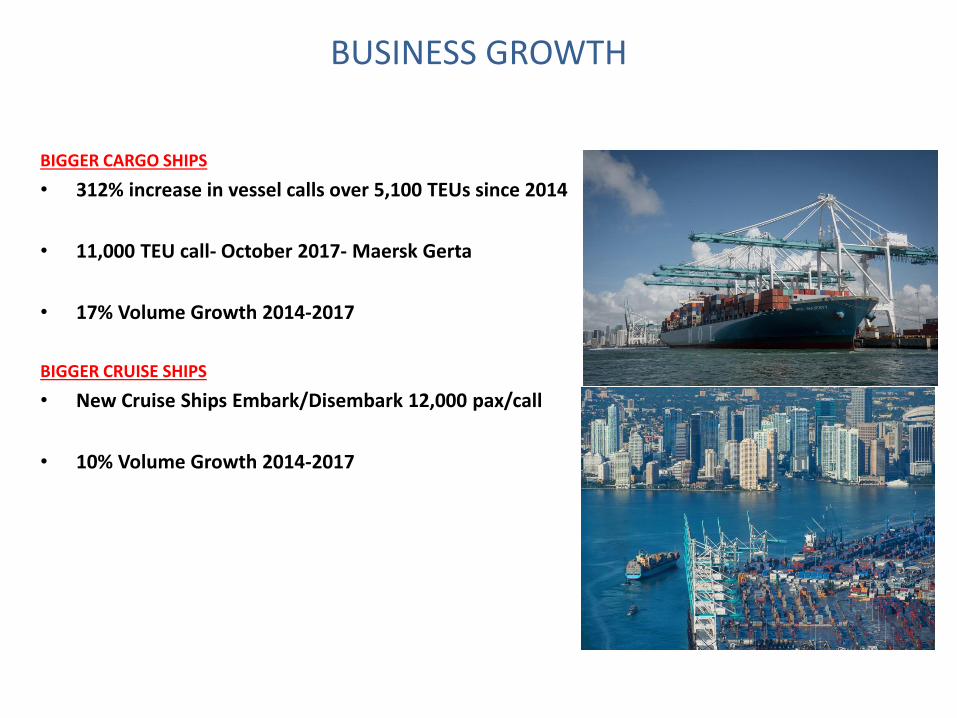
BUSINESS GROWTH
BIGGER CARGO SHIPS
• 312% increase in vessel calls over 5,100 TEUs since 2014
• 11,000 TEU call- October 2017- Maersk Gerta
• 17% Volume Growth 2014-2017
BIGGER CRUISE SHIPS
• New Cruise Ships Embark/Disembark 12,000 pax/call
• 10% Volume Growth 2014-2017
Ft. Pierce
e
Miami
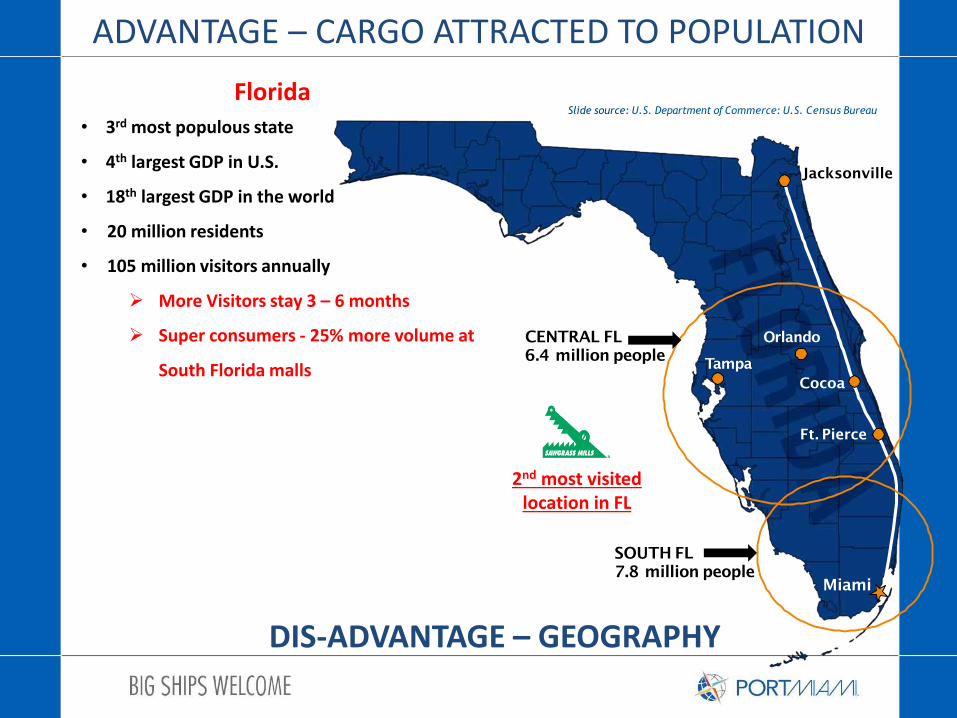
SOUTH FL
7.8 million people
Jacksonville
Cocoa
Slide source: U.S. Department of Commerce: U.S. Census Bureau
CENTRAL FL
6.4 million people
Orlando
Tampa
ADVANTAGE – CARGO ATTRACTED TO POPULATION
Florida• 3rd most populous state
• 4th largest GDP in U.S.
• 18th largest GDP in the world
• 20 million residents
• 105 million visitors annually
➢ More Visitors stay 3 – 6 months
➢ Super consumers - 25% more volume at
South Florida malls
2nd most visited location in FL
DIS-ADVANTAGE – GEOGRAPHY
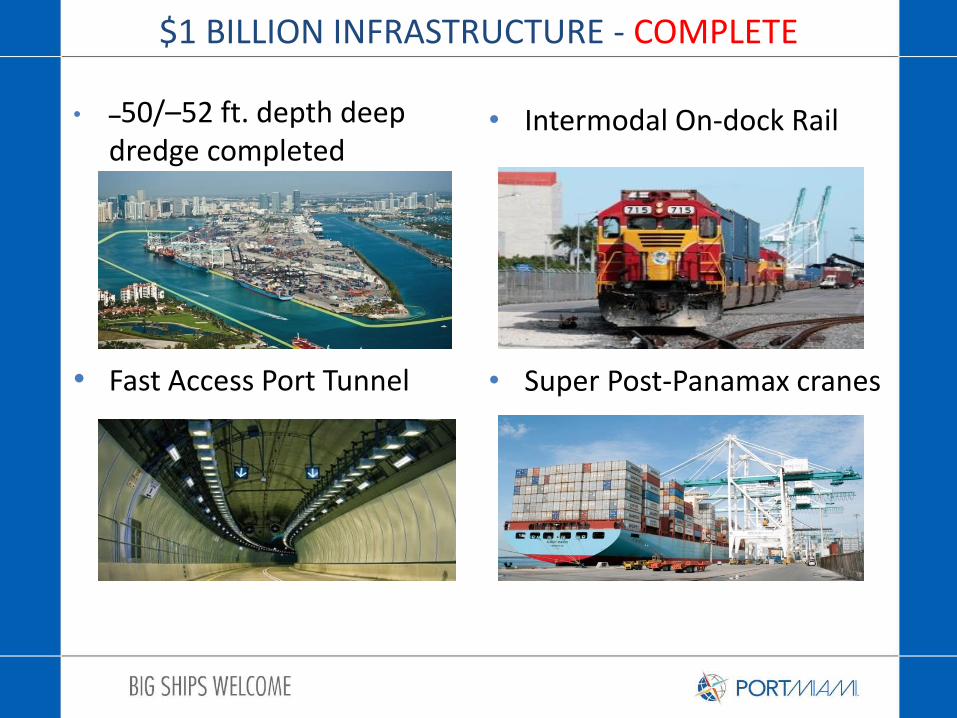
• –50/–52 ft. depth deep dredge completed
• Fast Access Port Tunnel
• Intermodal On-dock Rail
• Super Post-Panamax cranes
$1 BILLION INFRASTRUCTURE - COMPLETE
• Framework for Joint Participation
• Shared Objectives
• Outcomes that Override Competitive Forces
COOPERATION
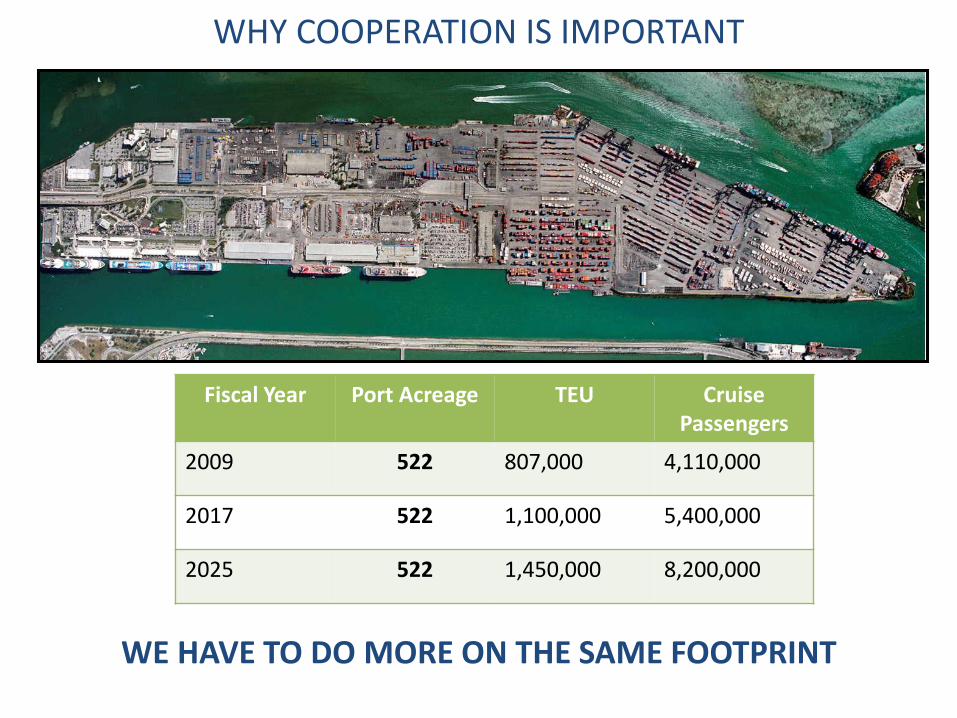
Fiscal Year Port Acreage TEU Cruise Passengers
2009 522 807,000 4,110,000
2017 522 1,100,000 5,400,000
2025 522 1,450,000 8,200,000
WHY COOPERATION IS IMPORTANT
WE HAVE TO DO MORE ON THE SAME FOOTPRINT
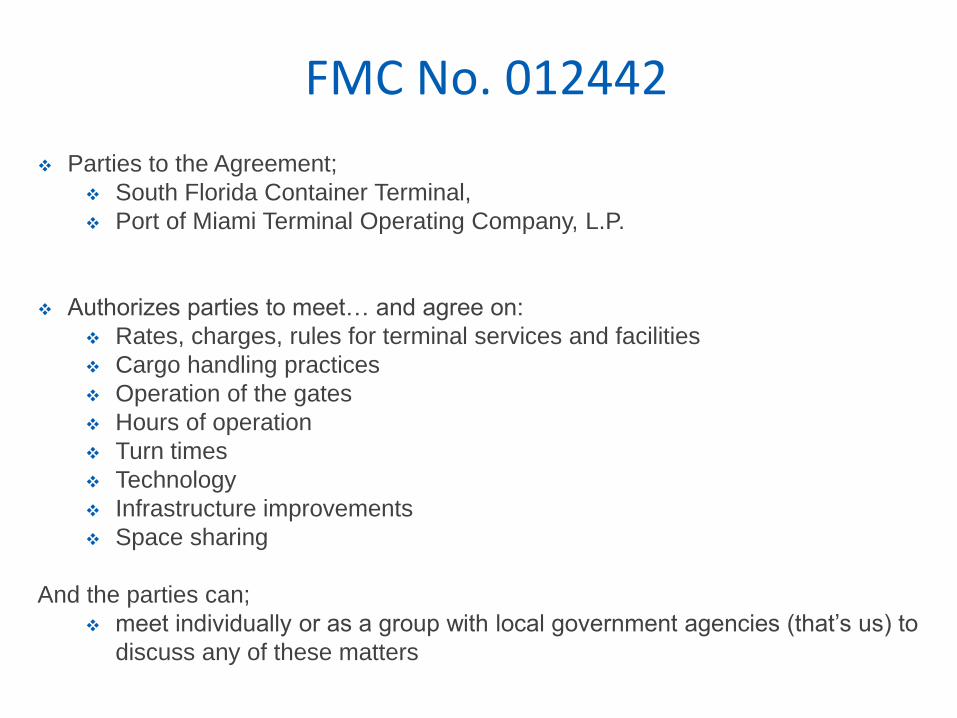
FMC No. 012442
❖ Parties to the Agreement;
❖ South Florida Container Terminal,
❖ Port of Miami Terminal Operating Company, L.P.
❖ Authorizes parties to meet… and agree on:
❖ Rates, charges, rules for terminal services and facilities
❖ Cargo handling practices
❖ Operation of the gates
❖ Hours of operation
❖ Turn times
❖ Technology
❖ Infrastructure improvements
❖ Space sharing
And the parties can;
❖ meet individually or as a group with local government agencies (that’s us) to
discuss any of these matters
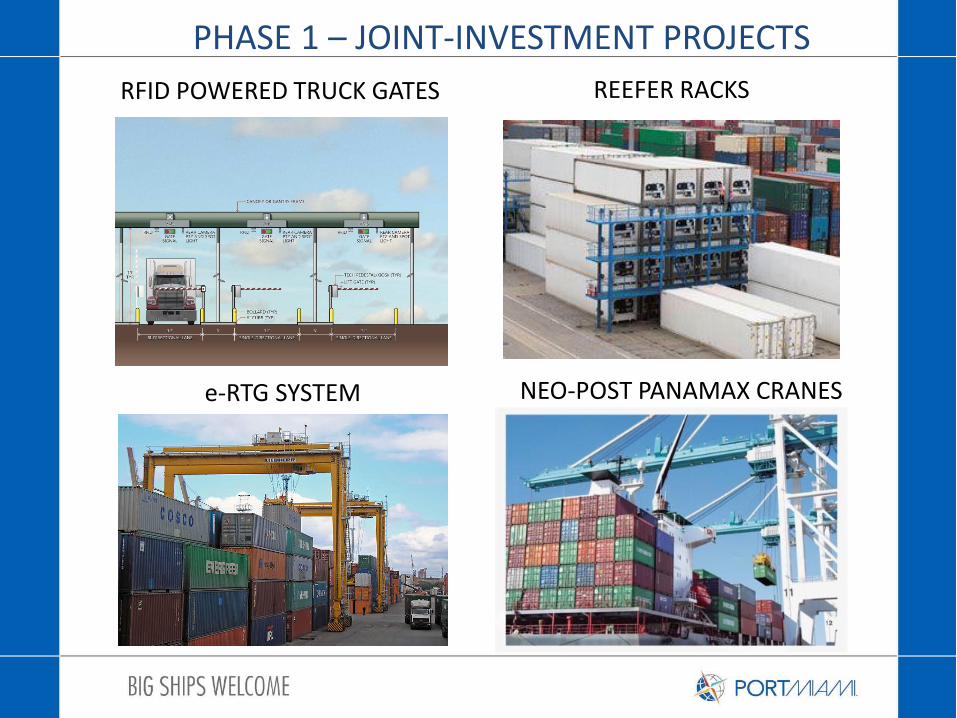
PHASE 1 – JOINT-INVESTMENT PROJECTS
RFID POWERED TRUCK GATES REEFER RACKS
NEO-POST PANAMAX CRANESe-RTG SYSTEM
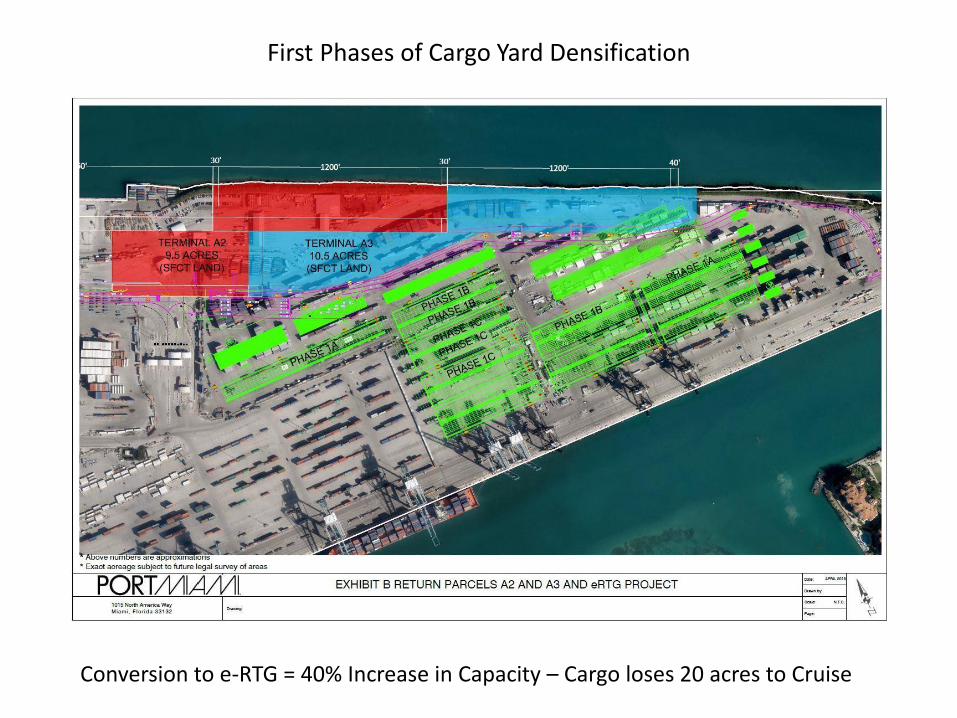
First Phases of Cargo Yard Densification
Conversion to e-RTG = 40% Increase in Capacity – Cargo loses 20 acres to Cruise
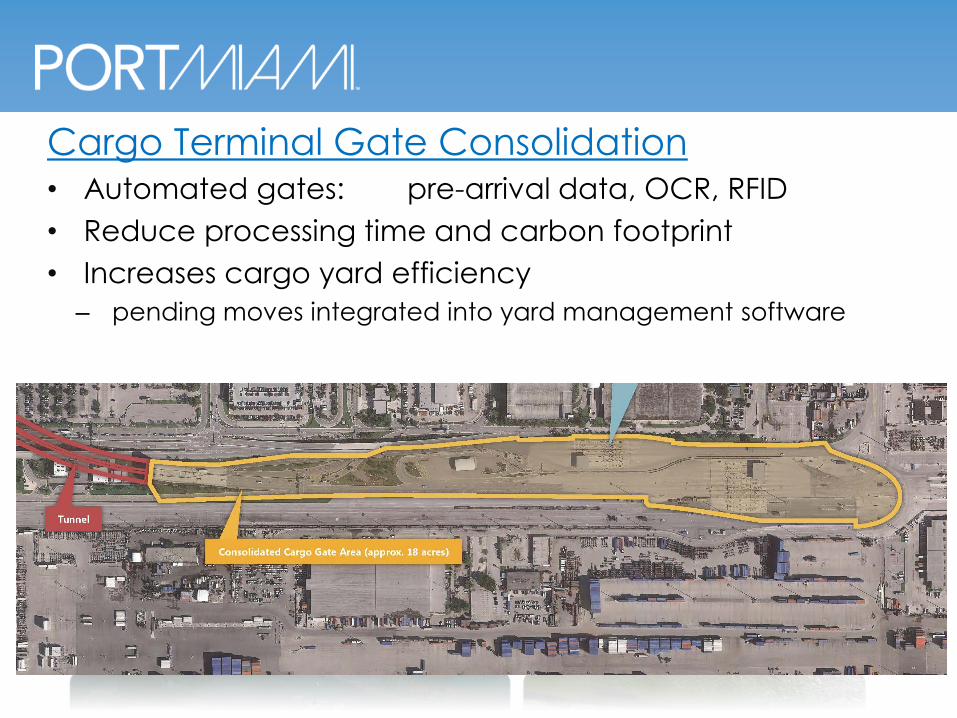
Cargo Terminal Gate Consolidation• Automated gates: pre-arrival data, OCR, RFID
• Reduce processing time and carbon footprint
• Increases cargo yard efficiency
– pending moves integrated into yard management software
After Cooperation; The Agreement
• The real Work Begins
– Financial Participation of the Parties
– Design Agreement
– Construction Schedules
– Responsibilities for Unforeseen Cost & Delay
– Maintain Daily Operations During Construction
– Volume Increase Guarantees Post-Construction
• Achieving ROI
Can Cooperation Agreements Propel Capital Projects?
• Not Simply with Signatures on Paper
• Yes,
– With the Required Effort,
– and Diligence to,
– Leverage the Platform the Agreement Affords
American Association ofPort Authorities
May 9, 2018
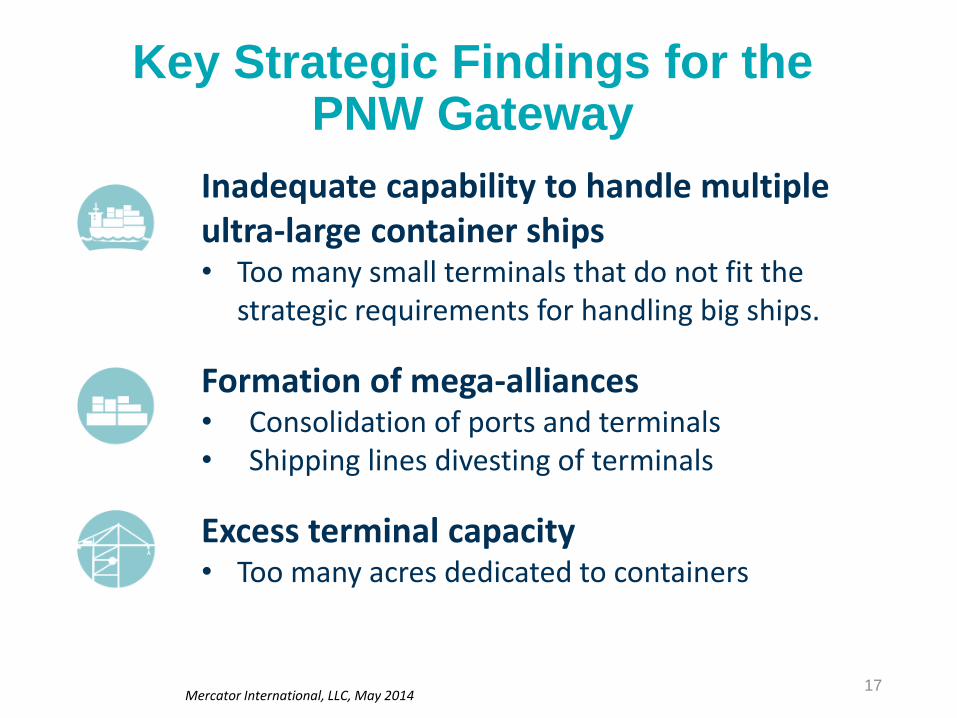
Inadequate capability to handle multiple ultra-large container ships• Too many small terminals that do not fit the
strategic requirements for handling big ships.
Formation of mega-alliances• Consolidation of ports and terminals• Shipping lines divesting of terminals
Excess terminal capacity• Too many acres dedicated to containers
Mercator International, LLC, May 201417
Key Strategic Findings for the PNW Gateway
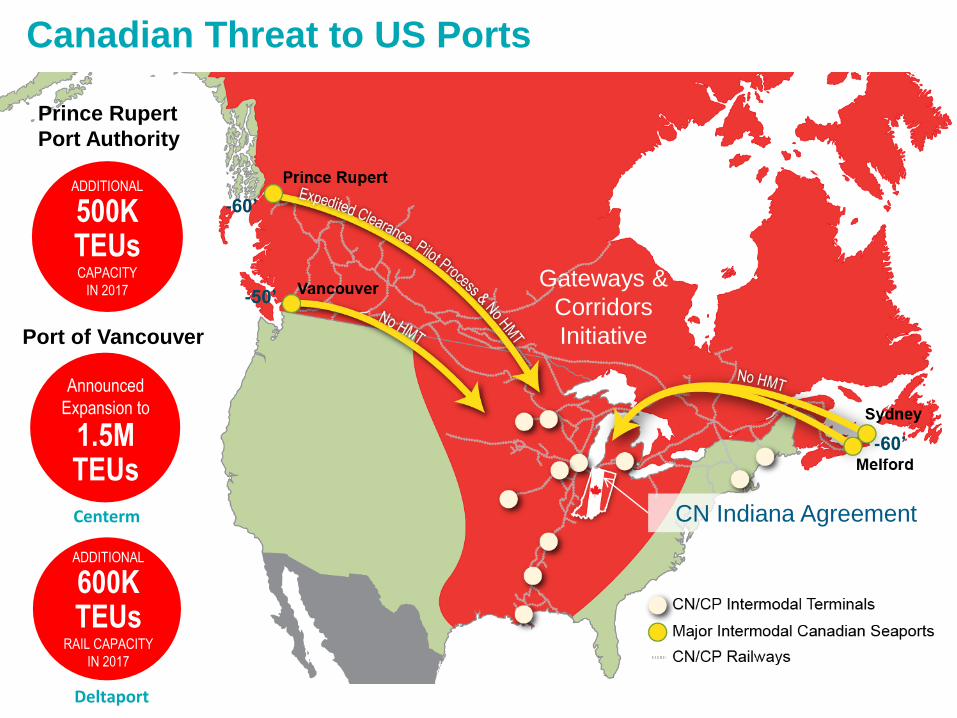
Canadian Threat to US Ports
CN Indiana Agreement
Gateways &
Corridors
Initiative
-60’
-60’
-50’
ADDITIONAL
600K TEUs
RAIL CAPACITY
IN 2017
Port of Vancouver
Deltaport
Announced
Expansion to
1.5M TEUs
Centerm
Prince Rupert
Port Authority
ADDITIONAL
500K TEUsCAPACITY
IN 2017
19
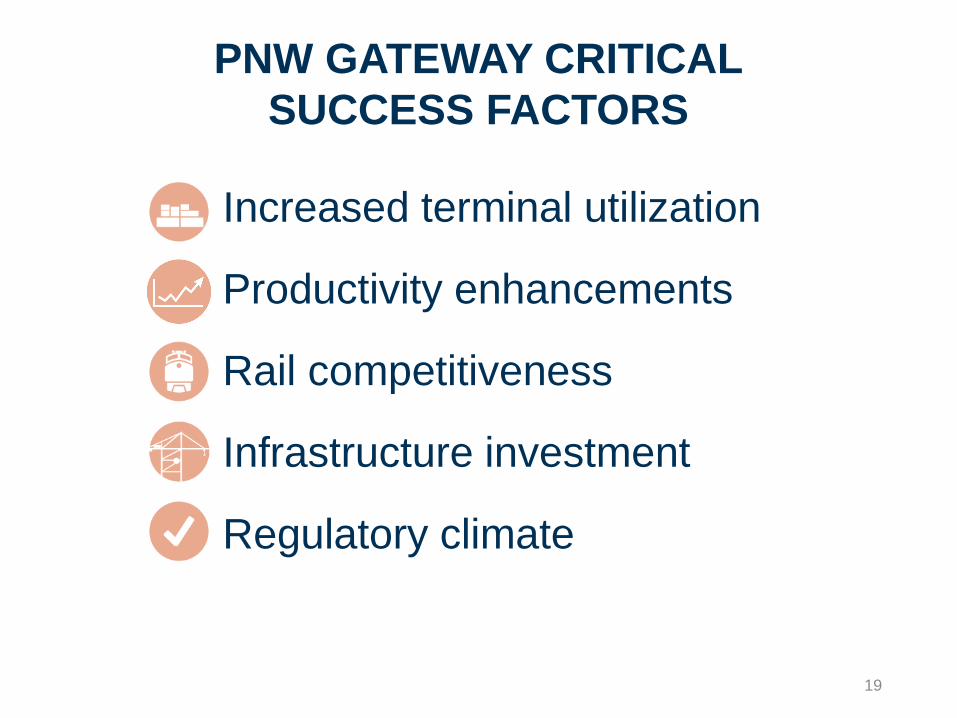
Increased terminal utilization
Productivity enhancements
Rail competitiveness
Infrastructure investment
Regulatory climate
PNW GATEWAY CRITICAL
SUCCESS FACTORS
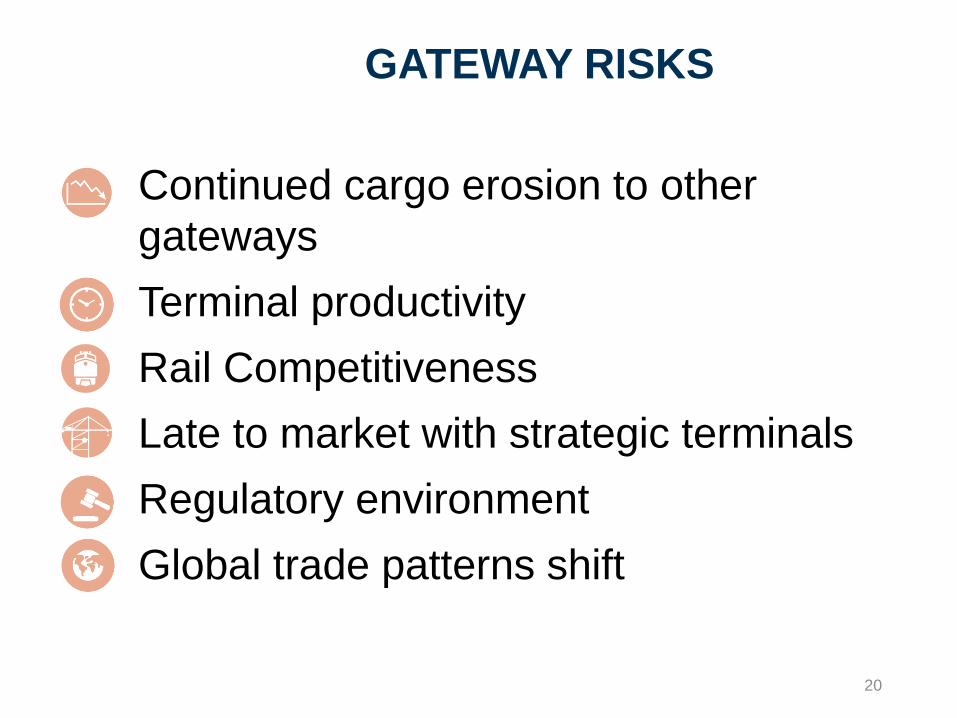
GATEWAY RISKS
20
Continued cargo erosion to other
gateways
Terminal productivity
Rail Competitiveness
Late to market with strategic terminals
Regulatory environment
Global trade patterns shift
/
Established August 4, 2015
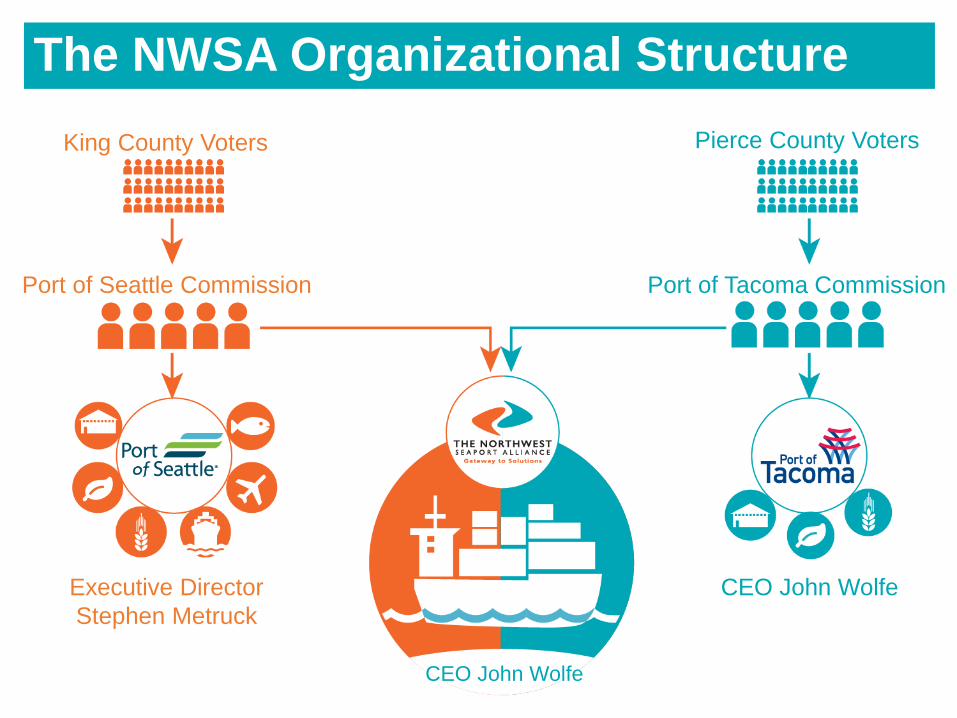
King County Voters Pierce County Voters
Port of Seattle Commission Port of Tacoma Commission
Executive Director
Stephen Metruck
CEO John Wolfe
CEO John Wolfe
The NWSA Organizational Structure
22
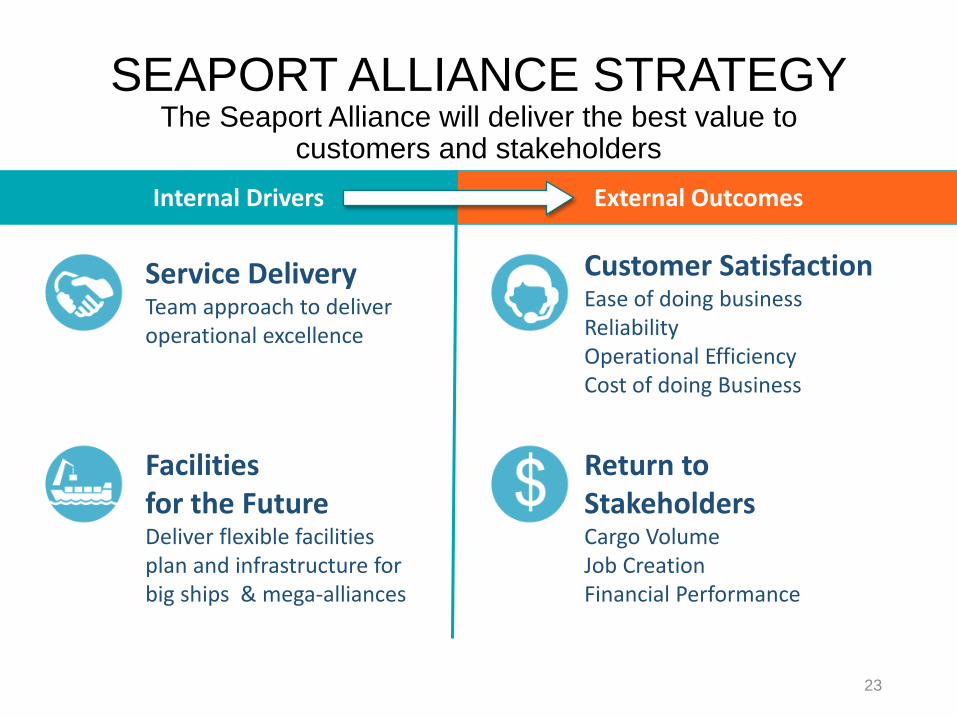
SEAPORT ALLIANCE STRATEGYThe Seaport Alliance will deliver the best value to
customers and stakeholders
23
Service DeliveryTeam approach to deliver operational excellence
Facilitiesfor the FutureDeliver flexible facilities plan and infrastructure for big ships & mega-alliances
Customer SatisfactionEase of doing businessReliabilityOperational EfficiencyCost of doing Business
Return to StakeholdersCargo VolumeJob CreationFinancial Performance
External OutcomesInternal Drivers
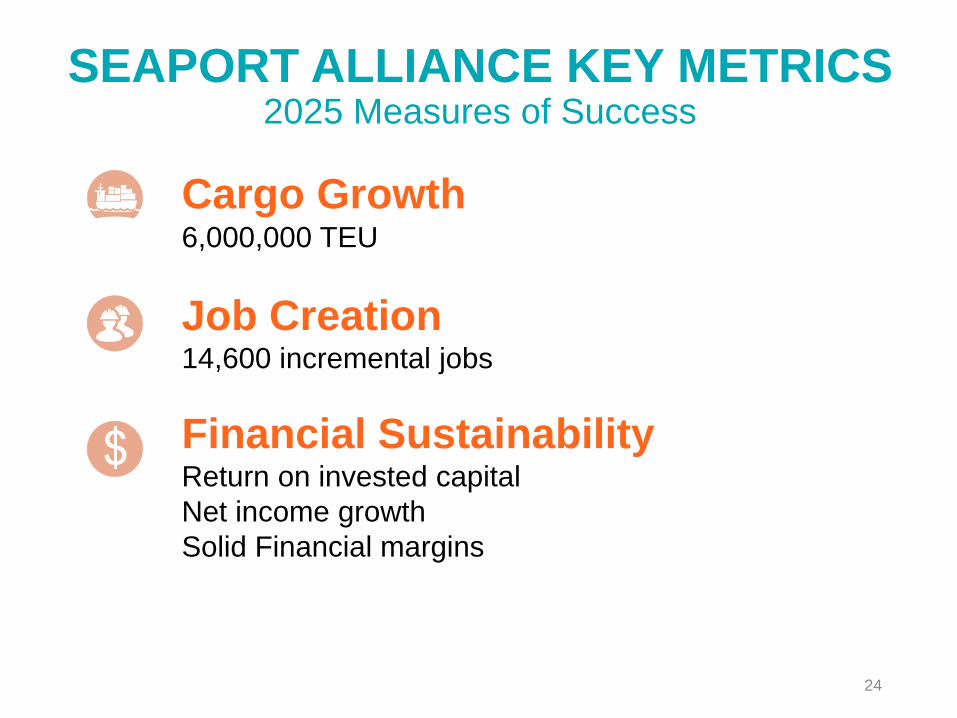
SEAPORT ALLIANCE KEY METRICS2025 Measures of Success
24
Cargo Growth6,000,000 TEU
Job Creation 14,600 incremental jobs
Financial SustainabilityReturn on invested capital
Net income growth
Solid Financial margins
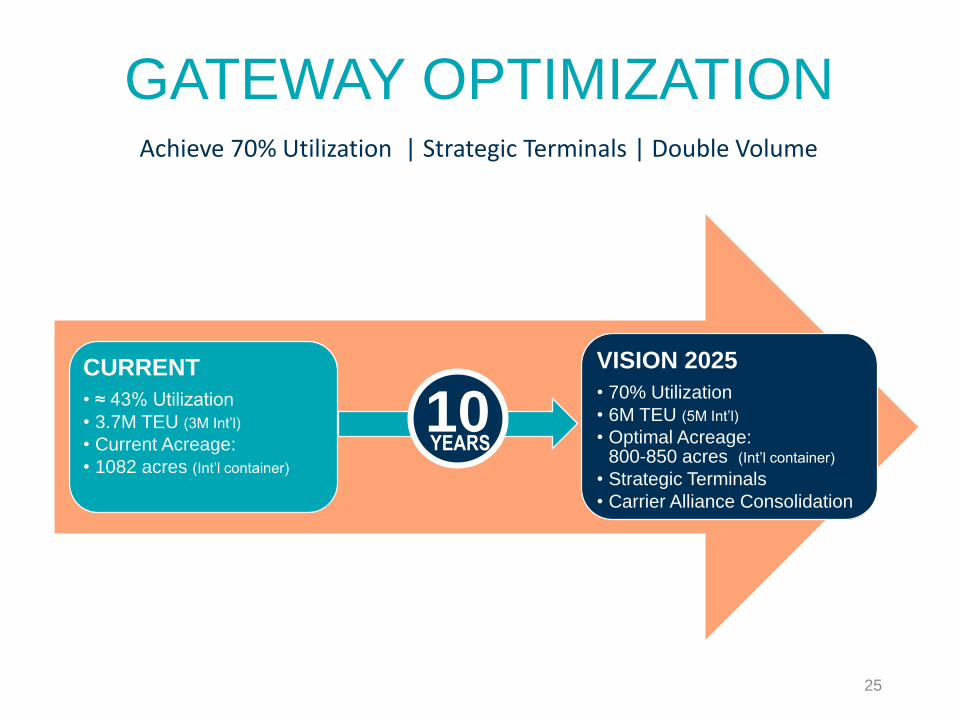
GATEWAY OPTIMIZATION
25
Achieve 70% Utilization | Strategic Terminals | Double Volume
CURRENT
• ≈ 43% Utilization
• 3.7M TEU (3M Int’l)
• Current Acreage:
• 1082 acres (Int’l container)
VISION 2025
• 70% Utilization
• 6M TEU (5M Int’l)
• Optimal Acreage: 800-850 acres (Int’l container)
• Strategic Terminals
• Carrier Alliance Consolidation
YEARS10
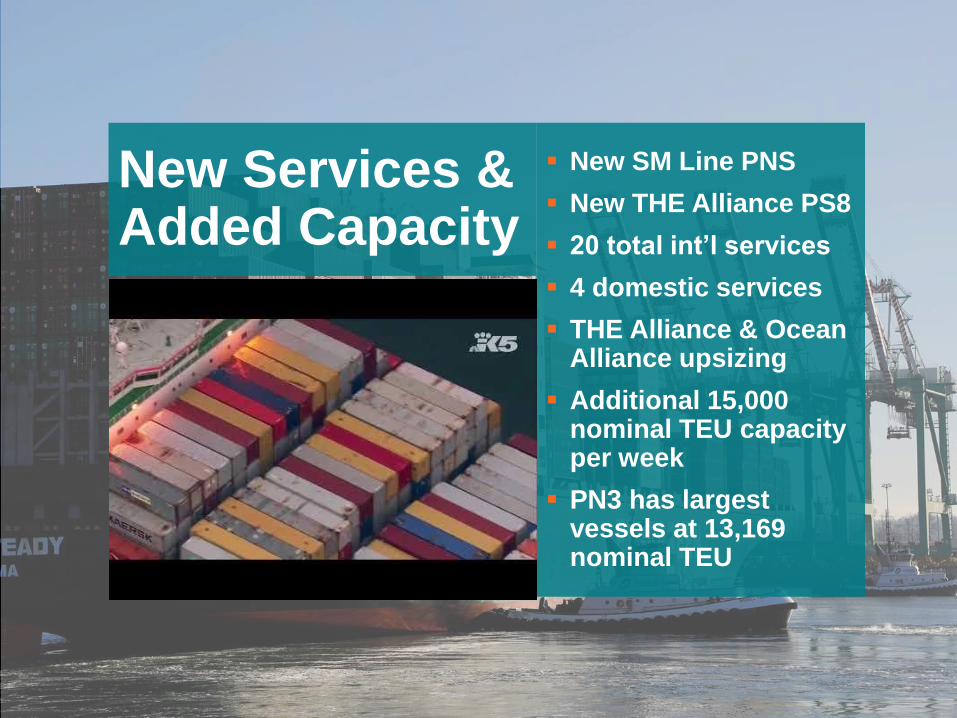
New Services & Added Capacity
▪ New SM Line PNS
▪ New THE Alliance PS8
▪ 20 total int’l services
▪ 4 domestic services
▪ THE Alliance & Ocean Alliance upsizing
▪ Additional 15,000 nominal TEU capacity per week
▪ PN3 has largest vessels at 13,169 nominal TEU
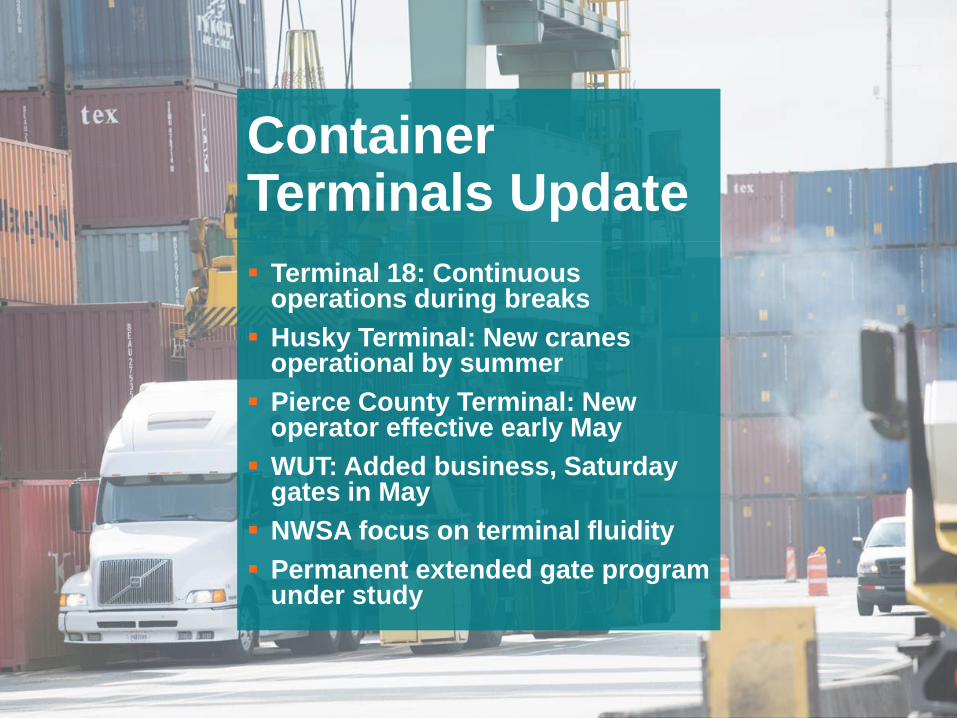
Container Terminals Update
▪ Terminal 18: Continuous operations during breaks
▪ Husky Terminal: New cranes operational by summer
▪ Pierce County Terminal: New operator effective early May
▪ WUT: Added business, Saturday gates in May
▪ NWSA focus on terminal fluidity
▪ Permanent extended gate program under study
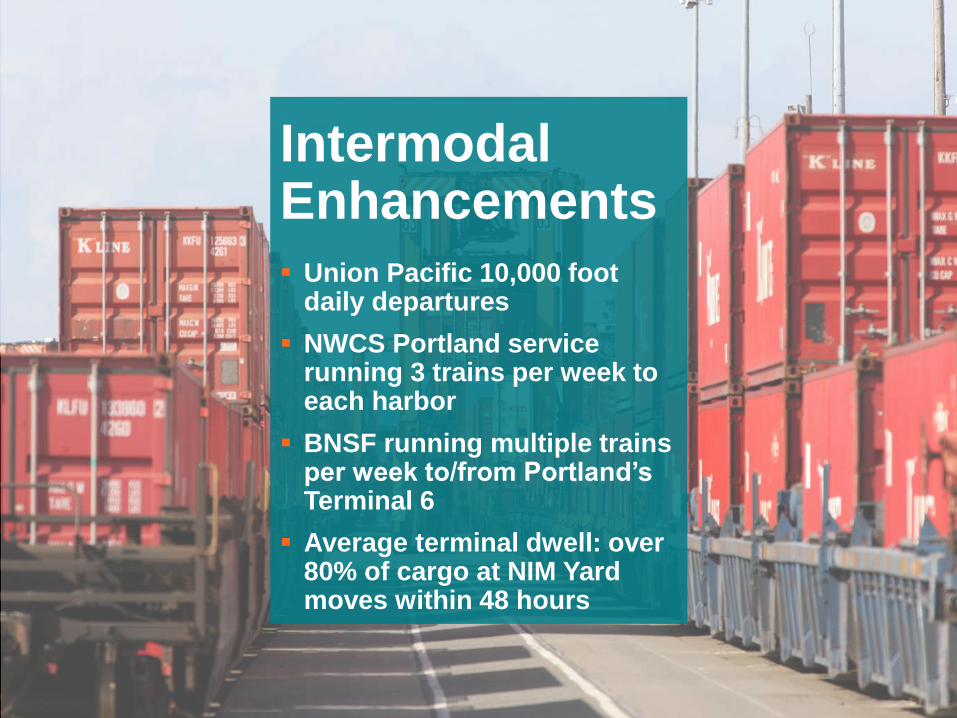
Intermodal Enhancements
▪ Union Pacific 10,000 foot daily departures
▪ NWCS Portland service running 3 trains per week to each harbor
▪ BNSF running multiple trains per week to/from Portland’s Terminal 6
▪ Average terminal dwell: over 80% of cargo at NIM Yard moves within 48 hours
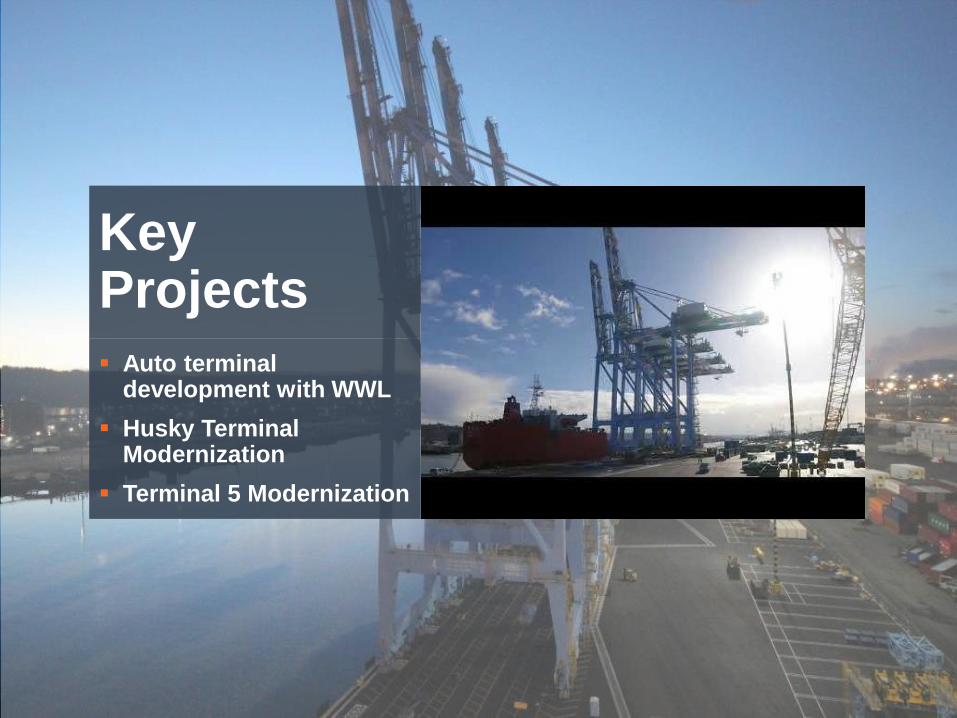
KeyProjects
▪ Auto terminal development with WWL
▪ Husky Terminal Modernization
▪ Terminal 5 Modernization
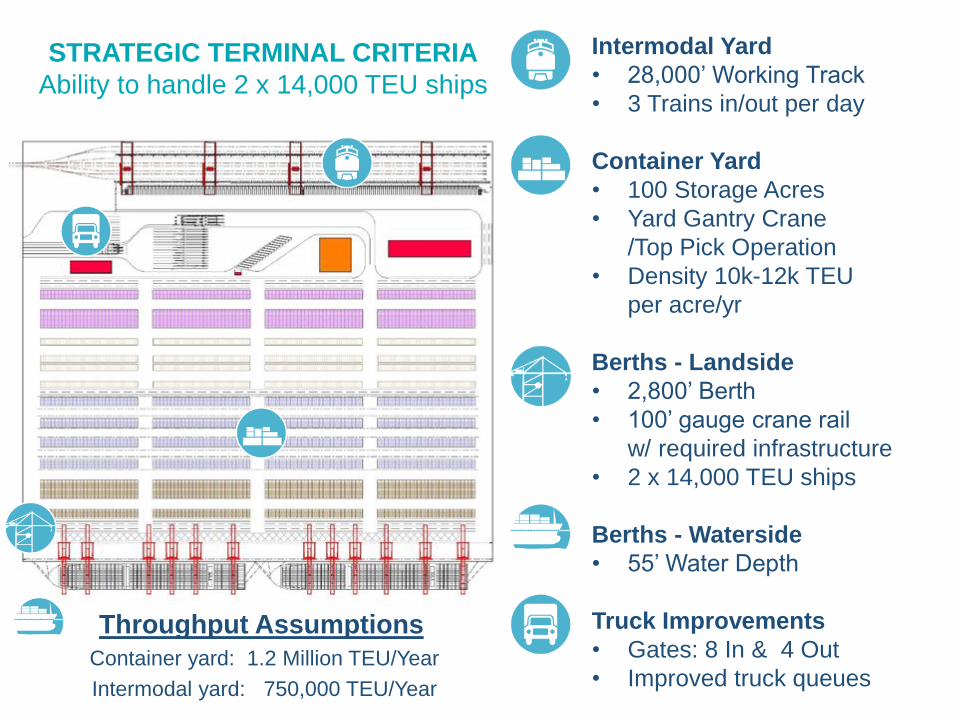
STRATEGIC TERMINAL CRITERIA
Ability to handle 2 x 14,000 TEU ships
Intermodal Yard
• 28,000’ Working Track
• 3 Trains in/out per day
Container Yard
• 100 Storage Acres
• Yard Gantry Crane
/Top Pick Operation
• Density 10k-12k TEU
per acre/yr
Berths - Landside
• 2,800’ Berth
• 100’ gauge crane rail
w/ required infrastructure
• 2 x 14,000 TEU ships
Berths - Waterside
• 55’ Water Depth
Truck Improvements
• Gates: 8 In & 4 Out
• Improved truck queues
Throughput Assumptions
Container yard: 1.2 Million TEU/Year
Intermodal yard: 750,000 TEU/Year
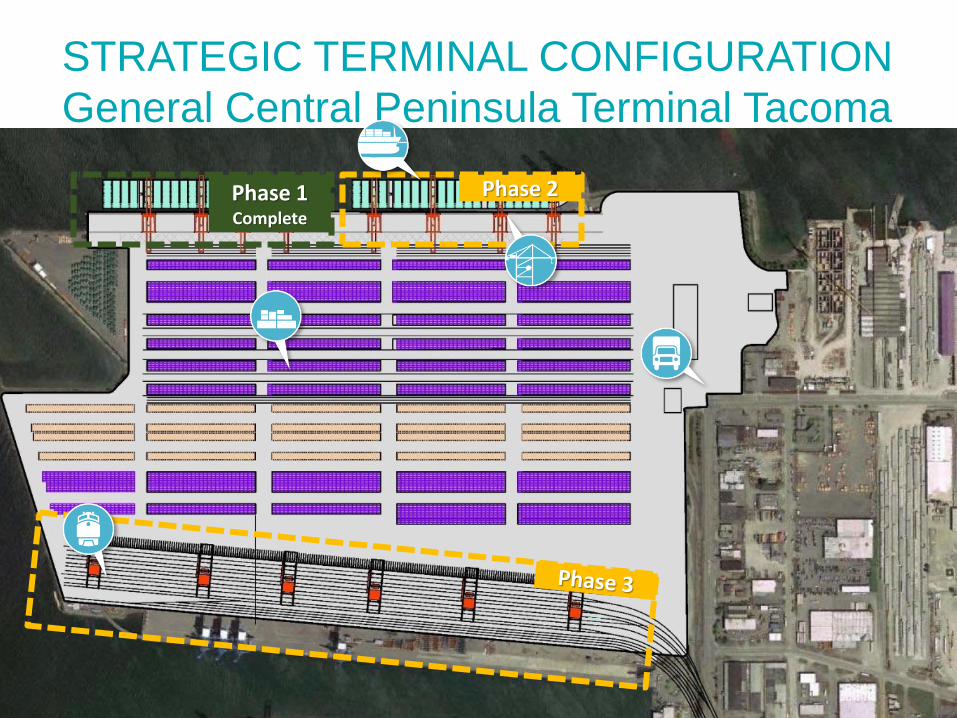
STRATEGIC TERMINAL CONFIGURATION
General Central Peninsula Terminal Tacoma
31
Phase 1Complete
Phase 2
31
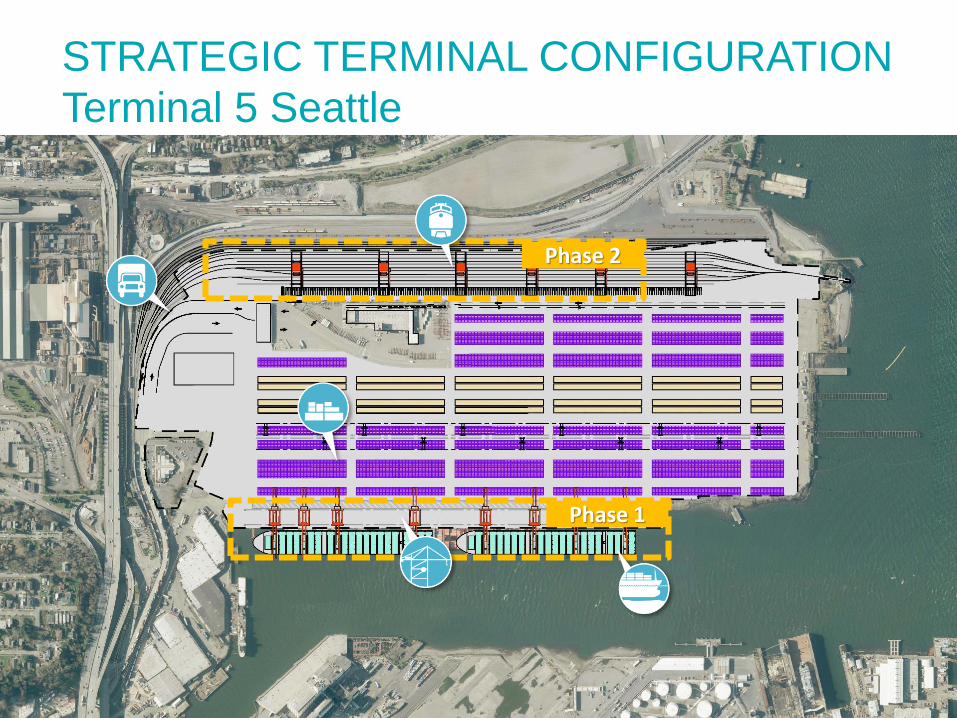
STRATEGIC TERMINAL CONFIGURATION
Terminal 5 Seattle
32
Phase 1
Phase 2
32
Port of Tacoma Terminals
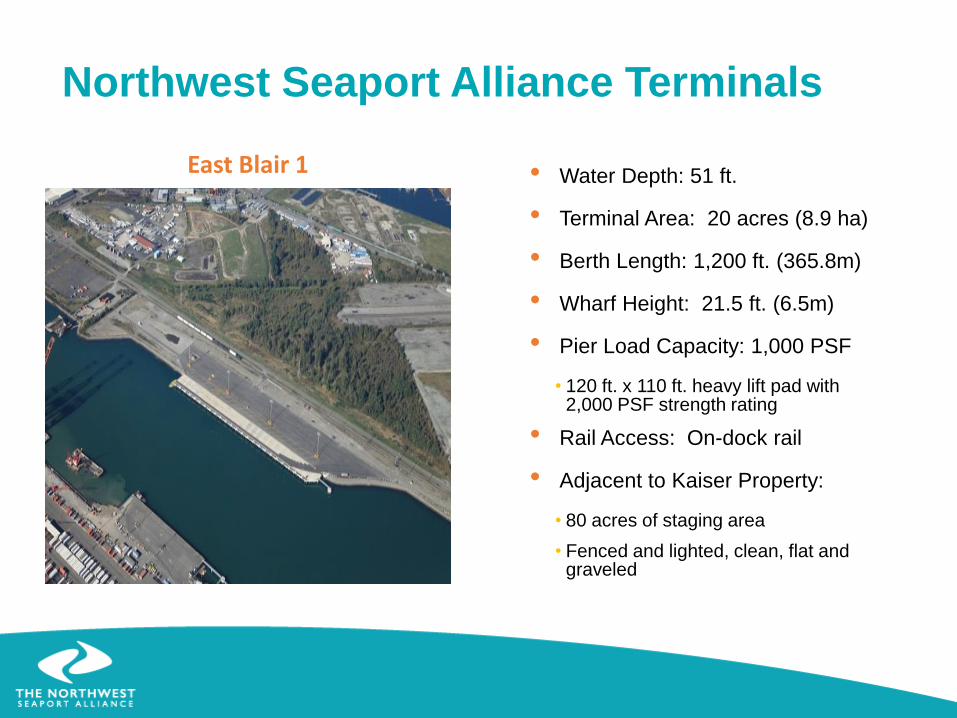
East Blair 1 • Water Depth: 51 ft.
• Terminal Area: 20 acres (8.9 ha)
• Berth Length: 1,200 ft. (365.8m)
• Wharf Height: 21.5 ft. (6.5m)
• Pier Load Capacity: 1,000 PSF
• 120 ft. x 110 ft. heavy lift pad with 2,000 PSF strength rating
• Rail Access: On-dock rail
• Adjacent to Kaiser Property:
• 80 acres of staging area
• Fenced and lighted, clean, flat and graveled
Northwest Seaport Alliance Terminals
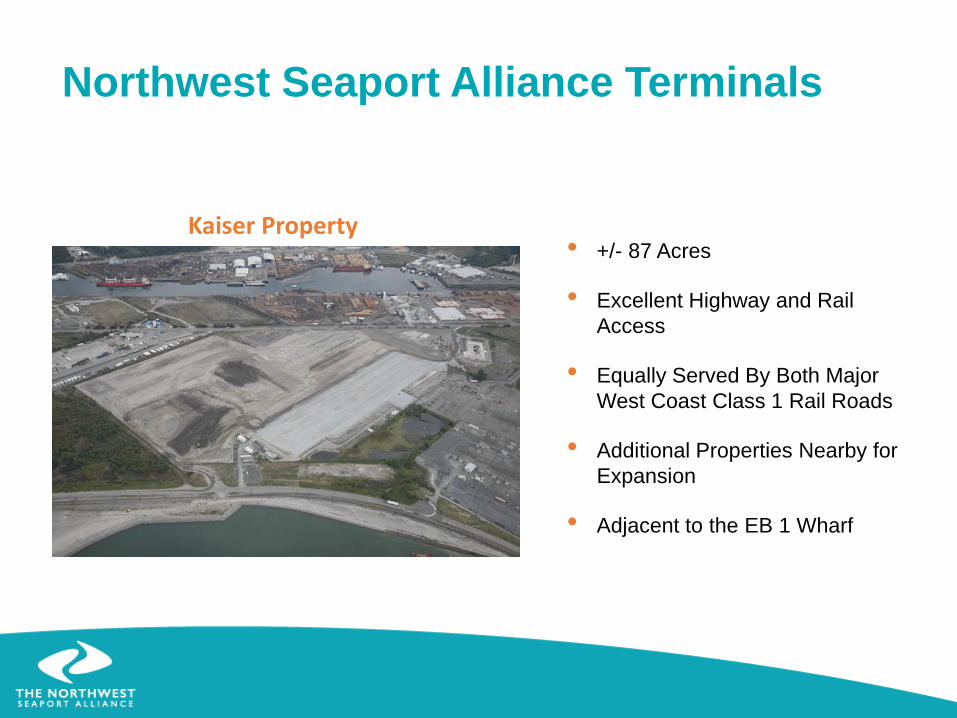
Port of Tacoma TerminalsNorthwest Seaport Alliance Terminals
Kaiser Property • +/- 87 Acres
• Excellent Highway and Rail
Access
• Equally Served By Both Major
West Coast Class 1 Rail Roads
• Additional Properties Nearby for
Expansion
• Adjacent to the EB 1 Wharf
Other key steps
35
• Productivity enhancements
• Rail competitiveness
• Harbor Maintenance Tax reform
• Regulatory climate
• Improve our regional freight system
• Protect industrial lands
36
Thank youDakota Chamberlain, PE, PPM
Chief Facilities Development
Officer253-592-6734
www.nwseaportalliance.com
37
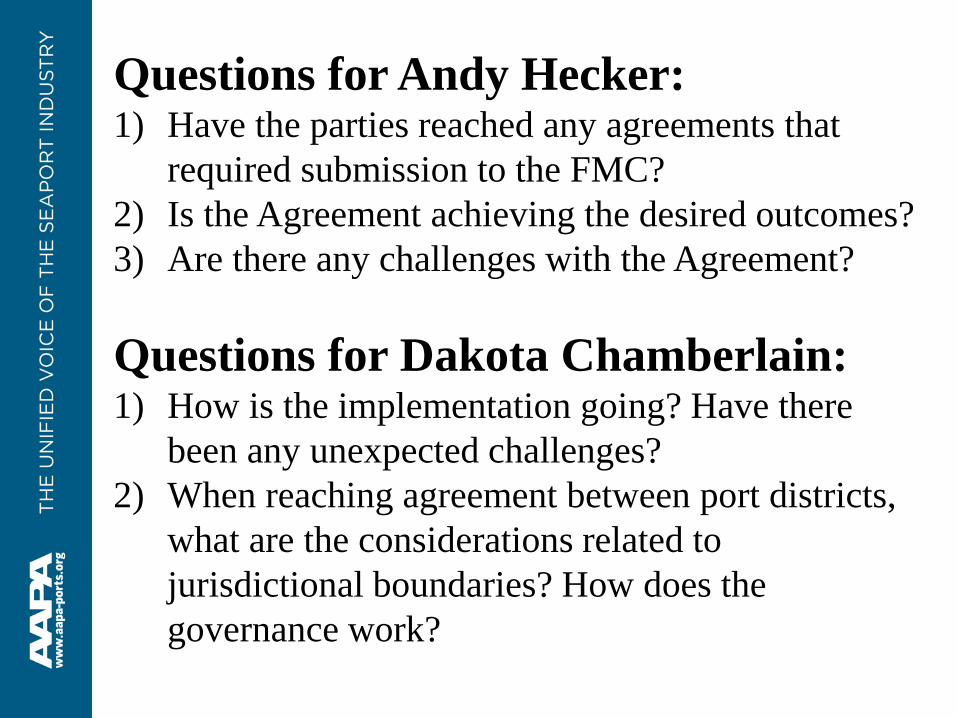
Questions for Andy Hecker:1) Have the parties reached any agreements that
required submission to the FMC?
2) Is the Agreement achieving the desired outcomes?
3) Are there any challenges with the Agreement?
Questions for Dakota Chamberlain:1) How is the implementation going? Have there
been any unexpected challenges?
2) When reaching agreement between port districts,
what are the considerations related to
jurisdictional boundaries? How does the
governance work?