Port and Inland Mode Choice from the Exporters’ and...
21
This is a repository copy of Port and Inland Mode Choice from the Exporters’ and Forwarders’ Perspectives. White Rose Research Online URL for this paper: http://eprints.whiterose.ac.uk/86473/ Version: Accepted Version Proceedings Paper: Nugroho, MT, Whiteing, A and De Jong, G (2015) Port and Inland Mode Choice from the Exporters’ and Forwarders’ Perspectives. In: Proceedings of the World Conference on Transport Research Society: Special Interest Group 2. WCTRS SIG2 2015 Conference: The Port and Maritime Sector: Key Developments and Challenges, 11-12 May 2015, Antwerp, Belgium. Hellenic Institute of Transport . [email protected] https://eprints.whiterose.ac.uk/ Reuse Unless indicated otherwise, fulltext items are protected by copyright with all rights reserved. The copyright exception in section 29 of the Copyright, Designs and Patents Act 1988 allows the making of a single copy solely for the purpose of non-commercial research or private study within the limits of fair dealing. The publisher or other rights-holder may allow further reproduction and re-use of this version - refer to the White Rose Research Online record for this item. Where records identify the publisher as the copyright holder, users can verify any specific terms of use on the publisher’s website. Takedown If you consider content in White Rose Research Online to be in breach of UK law, please notify us by emailing [email protected] including the URL of the record and the reason for the withdrawal request.
Transcript of Port and Inland Mode Choice from the Exporters’ and...

This is a repository copy of Port and Inland Mode Choice from the Exporters’ and Forwarders’ Perspectives.
White Rose Research Online URL for this paper:http://eprints.whiterose.ac.uk/86473/
Version: Accepted Version
Proceedings Paper:Nugroho, MT, Whiteing, A and De Jong, G (2015) Port and Inland Mode Choice from the Exporters’ and Forwarders’ Perspectives. In: Proceedings of the World Conference on Transport Research Society: Special Interest Group 2. WCTRS SIG2 2015 Conference: The Port and Maritime Sector: Key Developments and Challenges, 11-12 May 2015, Antwerp, Belgium. Hellenic Institute of Transport .
[email protected]://eprints.whiterose.ac.uk/
Reuse Unless indicated otherwise, fulltext items are protected by copyright with all rights reserved. The copyright exception in section 29 of the Copyright, Designs and Patents Act 1988 allows the making of a single copy solely for the purpose of non-commercial research or private study within the limits of fair dealing. The publisher or other rights-holder may allow further reproduction and re-use of this version - refer to the White Rose Research Online record for this item. Where records identify the publisher as the copyright holder, users can verify any specific terms of use on the publisher’s website.
Takedown If you consider content in White Rose Research Online to be in breach of UK law, please notify us by emailing [email protected] including the URL of the record and the reason for the withdrawal request.
1
Port and Inland Mode Choice from the Exporters’ and
Forwarders’ Perspectives
Munajat Tri Nugroho1, Anthony Whiteing, Gerard de Jong
1. Introduction
Containerisation has become popular in international trade since its introduction in the
1950s, and in the Indonesian context of this paper, non-oil and mining exports are
now mostly shipped using containers. Such containerised exports have been growing
quickly in recent years; between 2005-2013 Indonesia achieved economic growth
averaging some 5.9% per year, leading to export growth of on average 13.5% in
weight and 12.2% in export value (World Trade Organization, 2013). Three ports on
Java, namely Tanjung Priok Port in Jakarta, Tanjung Emas Port in Semarang and
Tanjung Perak Port in Surabaya account for almost 70% of total container throughput
in entire Indonesian ports, with market shares of around 65%, 5% and 30%
respectively in 2012. (See Table 1)
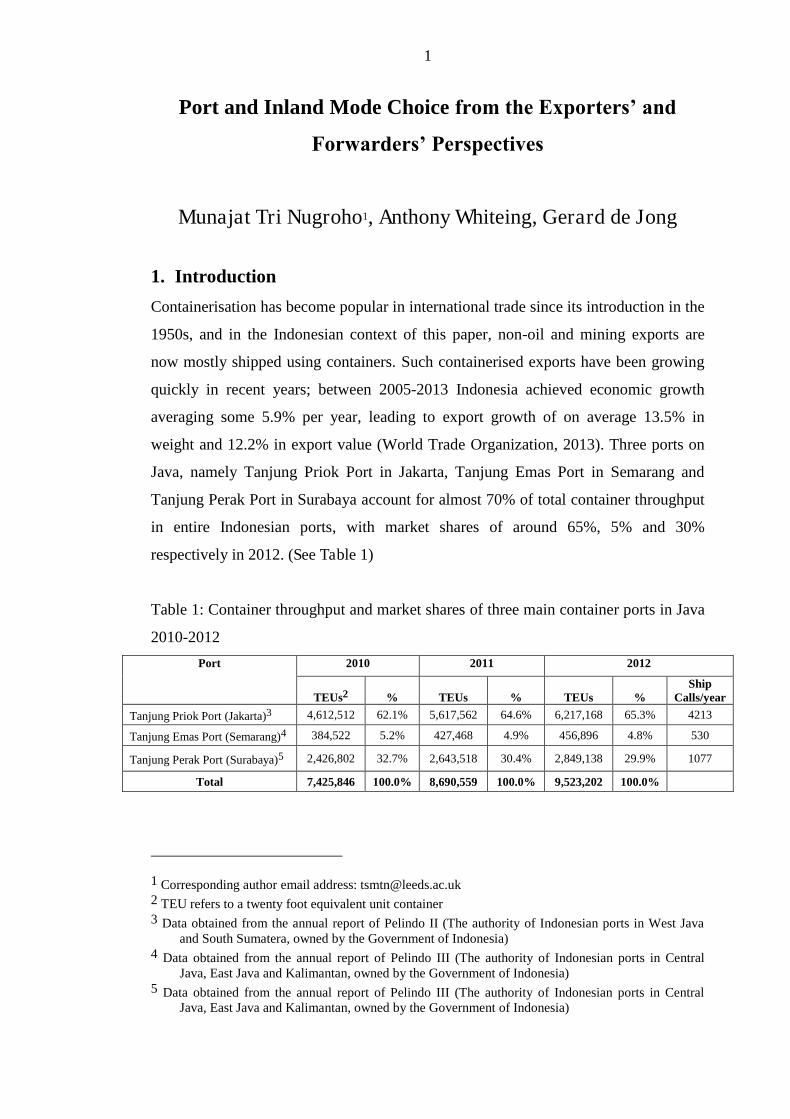
Table 1: Container throughput and market shares of three main container ports in Java
2010-2012
Port 2010 2011 2012
TEUs2 % TEUs % TEUs % Ship
Calls/year
Tanjung Priok Port (Jakarta)3 4,612,512 62.1% 5,617,562 64.6% 6,217,168 65.3% 4213
Tanjung Emas Port (Semarang)4 384,522 5.2% 427,468 4.9% 456,896 4.8% 530
Tanjung Perak Port (Surabaya)5 2,426,802 32.7% 2,643,518 30.4% 2,849,138 29.9% 1077
Total 7,425,846 100.0% 8,690,559 100.0% 9,523,202 100.0%
1 Corresponding author email address: [email protected] 2 TEU refers to a twenty foot equivalent unit container 3 Data obtained from the annual report of Pelindo II (The authority of Indonesian ports in West Java
and South Sumatera, owned by the Government of Indonesia) 4 Data obtained from the annual report of Pelindo III (The authority of Indonesian ports in Central
Java, East Java and Kalimantan, owned by the Government of Indonesia) 5 Data obtained from the annual report of Pelindo III (The authority of Indonesian ports in Central
Java, East Java and Kalimantan, owned by the Government of Indonesia)

2
Tanjung Priok Port currently faces capacity problems due to the high export growth,
and there is traffic congestion near the port as the road mode carries most of the
containers from the regions of origin to the seaport terminal. To address these
problems, the Government of Indonesia plans to build a new port at Cilamaya (100
km east of Jakarta) to support Tanjung Priok Port. In addition to this new port, the
authority of Tanjung Priok Port also plans to extend its current capacity by adding
extra capacity of some 4.5 million TEUs/year in the first phase development plan to
be completed in 20176.
Port throughput depends on the preferences of users – whether they choose to use a
port in preference to other alternatives. This paper focuses on issues relating to port
selection, not merely about port selection in itself, but also relating to the inland mode
chosen to carry containers from the origin locations to the selected port. Most
exporters and freight forwarders in Java choose truck as their preferred mode of
delivery of containerised exports from the origin region to the three ports above.
Fewer than 4% of the total volumes of containers from and to the three ports above
are currently transported by the rail mode.
To encourage shippers and freight forwarding companies to use rail transport, the
government of Indonesia needs to implement appropriate policies that will take into
account the preferences of shippers and freight forwarders with respect to inland mode
choice. Hence, the success of plans to shift containerised freight from road to rail will
depend partly on the behaviour of the shippers and freight forwarders in choosing
combinations of inland modes and ports.
Port choice can be differentiated into three categories based on the decision-makers’
perspectives;
Shippers’ or freight forwarders’ perspective (Tiwari et al. 2003; Tongzon
2009; Nir et al. 2003; Steven & Corsi 2012)
Carriers’ perspective (Chang et al. 2008; Wiegmans et al. 2008; Tongzon &
Sawant 2007; Malchow & Kanafani 2004; Chou 2005)
6 The details of Tanjung Priok Port’s development plan can be found at http://www.indonesiaport.co.id/newpriok/sub/development-program.html

3
Terminal operators’ perspective (Lirn, Thanopoulou, Beynon, & Beresford,
2004).
Previous researchers have revealed that the most prominent factors influencing
shippers and freight forwarders in port selection are: travel time, cost, ship call
frequency, port efficiency and port congestion (Tiwari et al. 2003; Tongzon 2009; Nir
et al. 2003; Steven & Corsi 2012). All of the researchers in the above literature used
Revealed Preference (RP) data to examine the preferences of shippers and freight
forwarders.
Many researchers have tried to investigate the behaviour of shippers or freight
forwarders in terms of inland freight transport mode choice and the factors influencing
such choice. Previous research has used both Revealed and Stated Preference (SP)
data to examine such preferences of shippers. The four most important factors that
influence the decision makers on inland mode choice are; (1) inland mode cost
(Garcia-Menendez et al. 2004; Beuthe & Bouffioux 2008; Ravibabu 2013; De Jong &
Ben-Akiva 2007; Abdelwahab 1998), (2) inland mode time (Garcia-Menendez et al.
2004; Beuthe & Bouffioux 2008; Ravibabu 2013), (3) inland mode reliability
(Shinghal & Fowkes 2002; Beuthe & Bouffioux 2008; Norojono & Young 2003) and
(4) frequency of service (Shinghal & Fowkes 2002; Garcia-Menendez et al. 2004; Feo
et al. 2011).
The main objective of this paper is to investigate the behaviour of exporters or freight
forwarders in Java in their choice of the inland modes and ports to move their export
containers from regions of origin. This research also examines the potential impacts of
various policies that might be implemented to influence switching of users’ choices
from the road to the rail for the inland transportation leg used for such containerised
export movements.
2. Stated Preference Survey
A stated preference (SP) study was used to examine the preferences of exporters and
freight forwarders in Java relating to port and inland mode choice. The primary reason
the SP method was chosen is its capability to carry out a discrete choice experiment
4
for accommodating non-existing alternatives (such as Cilamaya Port) and the
extensive attributes of all available alternatives at different attribute levels (Sanko
2001). The SP survey method was also selected because of the unavailability of
Revealed Preference (RP) data on the shippers’ and freight forwarders’ preferences in
Java.
The SP study in this research is performed using the following steps ( Louviere et al.,
2000): (1) Define the study objectives; (2) Conduct a supporting qualitative study; (3)
Develop and pilot the data collection instrument, partially designing the experiment;
(4) Define sample characteristics; (5) Perform the main data collection; (6) Conduct
model specification; (7) Conduct policy analysis using the most satisfactory model
from the previous step.
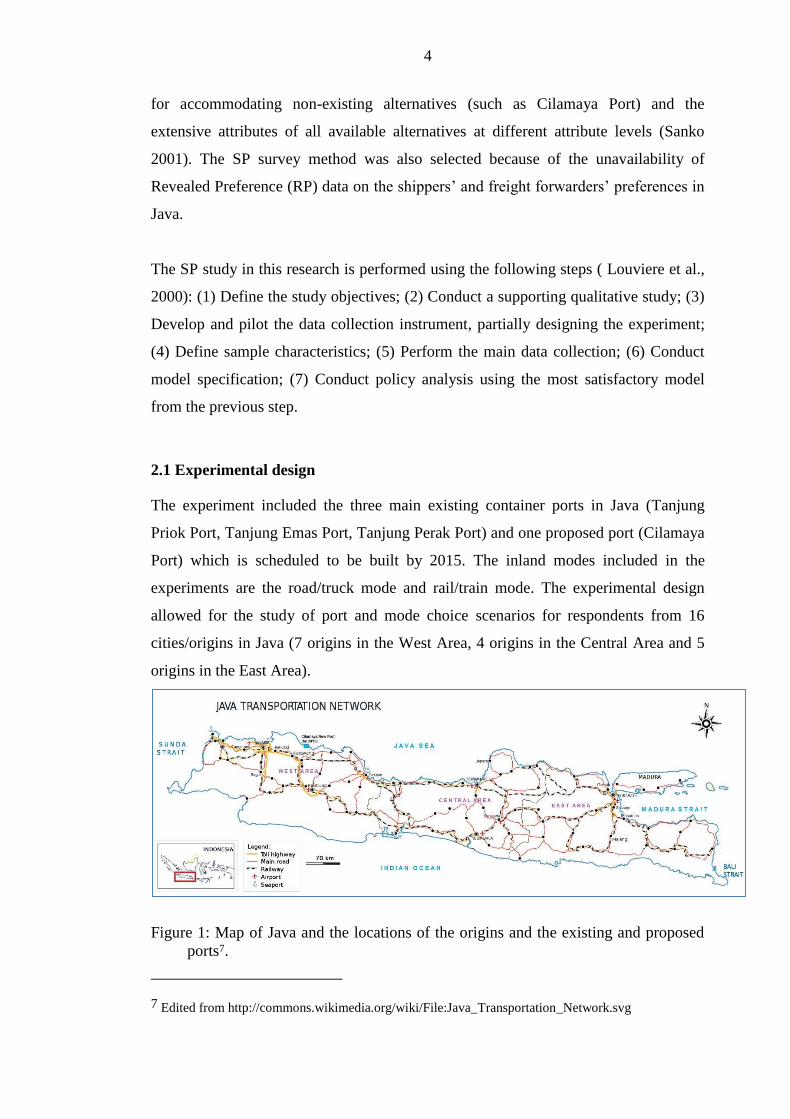
2.1 Experimental design
The experiment included the three main existing container ports in Java (Tanjung
Priok Port, Tanjung Emas Port, Tanjung Perak Port) and one proposed port (Cilamaya
Port) which is scheduled to be built by 2015. The inland modes included in the
experiments are the road/truck mode and rail/train mode. The experimental design
allowed for the study of port and mode choice scenarios for respondents from 16
cities/origins in Java (7 origins in the West Area, 4 origins in the Central Area and 5
origins in the East Area).
Figure 1: Map of Java and the locations of the origins and the existing and proposed ports7.
7 Edited from http://commons.wikimedia.org/wiki/File:Java_Transportation_Network.svg

5
There are eight combinations (alternatives) of port and inland mode, as follows:
Alternative 1: Tanjung Priok Port (Jakarta) – Road (JKT-RD)
Alternative 2: Tanjung Priok Port (Jakarta) – Rail (JKT-RL)
Alternative 3: Tanjung Emas Port (Semarang) – Road (SMG-RD)
Alternative 4: Tanjung Emas Port (Semarang) – Rail (SMG-RL)
Alternative 5: Tanjung Perak Port (Surabaya) – Road (SBY-RD)
Alternative 6: Tanjung Perak Port (Surabaya) – Rail (SBY-RL)
Alternative 7: Cilamaya Port (Cilamaya) – Road (CMY-RD)
Alternative 8: Cilamaya Port (Cilamaya) – Rail (CMY-RL)
The location of the current ports, the proposed port, and the Java regions are shown in
Figure 1 above.
Although there are eight possible alternatives, only four alternatives were shown to
each respondent, depending on the location of the respondents. The four alternatives
for each region are combinations of two or three ports and two available inland modes
(except for Jepara, where only the road mode is available, to four alternative ports).
The four different alternatives for each city/origin region are shown in Table 2 below:
Table 2: Alternatives presented to respondents in different cities / origins
To From
Alternative 1 Alternative 2 Alternative 3 Alternative 4
Port-Mode dopm
(km) Port-Mode dopm
(km) Port-Mode dopm
(km) Port-Mode dopm
(km) Jakarta JKT-RD 14 JKT-RL 19 CMY-RD 98 CMY-RL 88
Bandung JKT-RD 155 JKT-RL 188 CMY-RD 122 CMY-RL 157
Bekasi JKT-RD 35 JKT-RL 50 CMY-RD 51 CMY-RL 63
Tangerang JKT-RD 34 JKT-RL 35 CMY-RD 128 CMY-RL 122
Cirebon JKT-RD 246 JKT-RL 226 CMY-RD 164 CMY-RL 193
Semarang SMG-RD 5 SMG-RL 9 JKT-RL 456 SBY-RL 288
Surakarta SMG-RD 11 SMG-RL 116 JKT-RL 585 SBY-RL 256
Surabaya SBY-RD 9 SBY-RL 9 JKT-RL 740 SMG-RL 285
Malang SBY-RD 100 SBY-RL 97 JKT-RL 833 SMG-RL 378
Bogor JKT-RD 62 JKT-RL 64 CMY-RD 131 CMY-RL 133
Karawang JKT-RD 79 JKT-RL 70 CMY-RD 31 CMY-RL 37
Yogyakarta SMG-RD 131 SMG-RL 173 JKT-RL 524 SBY-RL 313
Jepara SMG-RD 78 JKT-RD 298 SBY-RD 556 CMY-RD 460
Gresik SBY-RD 23 SBY-RL 32 JKT-RL 752 SMG-RL 297

6
Sidoarjo SBY-RD 34 SBY-RL 31 JKT-RL 763 SMG-RL 308
Pasuruan SBY-RD 70 SBY-RL 68 JKT-RL 800 SMG-RL 345 Note: dopm is distance between origin o to port p using inland mode m
Each alternative shown to the respondent is described using two port attributes (cost
and number of ship calls), and four inland mode attributes (cost, time, reliability and
GHG emissions). The definition and dimension of the attributes of the alternatives can
be seen in Table 3.
Table 3: The attributes of port and inland mode used in this research
Factor Attributes Unit Definition
Inland Mode
Cost Thousands
IDR8/TEU-Trip
Inland mode cost to transport 1 TEU container from the origin to the port (including haulage by truck from the shipper location to the consolidation station for an alternative using rail mode).
Time Hours/trip The transport time between the mode departure from the origin and arrival at the port, including waiting time if any.
Reliability Percentage (%) Percentage of on-time delivery GHG
emissions (Kg CO2e / TEU-
Trip) Emissions from the alternative inland modes for a trip from the origin region to the port
Port
Cost Thousands IDR/TEU
The port cost is represented by the handling cost of 1 TEU FCL9 using the port crane
Ship Calls Ship calls / week Ship calls are the number of international container ship calls per week at the port
concerned, including indirect calls10
According to Louviere et al. (2000), an experiment with four alternatives, six
attributes and four levels needs at least 96 sets of scenarios for the smallest design. In
this experiment, a set of scenarios for each city/origin was represented by 128
scenarios, which were divided into 16 blocks, with each block containing eight
scenarios (choice situations) to be shown to the respondent. Overall, there are 1152
and 2048 scenarios for the pilot survey and the main survey respectively. This number
of scenarios made the data collection process more difficult to administer manually,
and the computer was used as a tool to manage the survey.
8 1 GBP (British Pound Sterling) 20,000 IDR (Indonesian Rupiah) 9 FCL is Full container load 10 Indirect calls are the ship calls of feeder vessels, from which the container will be transshipped to a
mother vessel for the intercontinental leg at a hub port. Usually the transshipments of the Indonesian exports are carried out at Singapore Port or Tanjung Pelepas, Port Malaysia.

7
The statistical design was generated by an efficient design using the NGENE software
(CHOICEMETRICS, 2012). Unidentifiable (‘unlabelled’) alternatives for the port
were used to focus on the importance of the presented attributes (we used Port A for
Tanjung Priok Port, Port B for Tanjung Emas Port, Port C for Tanjung Perak Port and
Port D for Cilamaya Port, rather than the actual port names), but this research still
used the name of the mode. Furthermore, to avoid problems of dominant alternatives,
the levels of some options have been changed manually.
2.2 Population and sample
The population of the survey is the set of exporters and freight forwarders in Java. The
candidate respondents for the pilot survey were selected from two main sources. The
data of exporters in Java was obtained from the Directory of 8000 Indonesian
Exporters book11, whilst data on freight forwarder companies was derived from the
Directory of Indonesian Logistics and Guide book12.
The SP experiment was carried out in two phases: a pilot survey was conducted in
September/October 2013, and the main survey was conducted between January and
April 2014. Both surveys also collected the current choice of port and inland mode for
the exports, as RP data. During the recruitment of the prospective respondents, 4593
companies were contacted by email, fax and postal letter. To encourage the candidates
to fill out the questionnaire, they received reminders in the last month before the end
of the main survey. The participation rate is 4%, with 181 companies completing the
online survey. However 17 respondents were excluded from the parameter estimation
process, either because some answers were irrational (for example giving the same
answers for the all eight experiments) and/or their completion times were very short
(less than 10 minutes). In these cases, it was deemed that data may not be valid for use
in the estimation process. Hence, data from only 164 respondents was used.
11 The Directory of 8000 Indonesian Exporters book, was published by The Indonesian Statistics and Indonesian Exim Bank in 2011.
12 The Indonesian Logistics Directory and Guide book was published by the Indonesian Logistics Association (ALI) and PPM Management School

8
3. Model Specification and Simulation
3.1 Utility model of the alternative
The utility of each alternative can be expressed by the following formula:
ൌ ܥܣ ൯ܥଵ൫ߚ ൯ܥଶ൫ߚ ൯ܥܯܫଷ൫ߚ ܯܫସ൫ߚ ൯ ߚହ൫ܯܫ൯ ൯ܩܯܫ൫ߚ
where: = The observed utility of the alternative p using inland mode m ܥܣ = Alternative specific constant for alternative port p using inland mode m ߚଵ = parameter of port cost ܥ = port cost for 1 TEU in port p (thousands IDR) ߚଶ = parameter of port ship calls ܥ = ship calls of international container vessels per week in port p ߚଷ = parameter of inland mode cost ܥܯܫ= inland mode cost for transporting 1 TEU FCL container from origin o
to port p using inland mode m (thousands IDR) ߚସ = parameter of inland mode cost ܯܫ = inland mode time for transporting 1 TEU FCL container from origin o
to port p using inland mode m (hours) ߚହ = parameter of inland mode reliability ܯܫ= inland mode reliability for transporting container from origin o to port
p using inland mode m (%) ߚ = parameter of inland mode GHG emissions ܩܯܫ= inland mode GHG emissions for transporting 1 TEU FCL container
from origin o to port p using inland mode m (Kg CO2e)
3.2 Model Estimation
The estimation of parameters has been carried out using Multinomial Logit (MNL),
Nested Logit (NL), Mixed Multinomial Logit (MXMNL) and Mixed Nested Logit
(MXNL) models. The models were estimated using BIOGEME (Bierlaire’s
Optimisation Toolbox for General Extreme Value Model Estimation) version 2.2,

9
free software for estimation of various discrete choice models (Bierlaire, 2009). The
estimation used joint SP and RP data as well as solely the SP data, obtained from both
the pilot and the main survey. However, this paper presents and analyses the results
from estimation using the SP data only.
According to the value of final log-likelihood, likelihood ratio test, 2, adjusted 2,
and the signs of the estimated parameters, the MXNL model has been selected as the
best model for the SP data. The MXNL has the highest value of final likelihood (-
1352.993), likelihood ratio test (862.335), 2 (0.242) and adjusted 2 (0.229). The
comparison of the models parameters is presented in Table 4.
Table 4: Comparison of the statistics of the models
Model Final
Likelihood Value
Likelihood ratio test 2
Adjusted 2
Parameters Signs
Multinomial Logit -1366.12 836.091 0.234 0.224 All parameters have
expected signs
Nested Logit -1355.5 857.332 0.24 0.228 All parameters have
expected signs
Mixed Multinomial Logit -1364.097 840.128 0.235 0.224 All parameters have
expected signs
Mixed Nested Logit -1352.993 862.335 0.242 0.229 All parameters have
expected signs
The best model is MXNL with the inland mode cost coefficient normally distributed.
All coefficients of attributes are significant at the 95% confidence level and show the
expected signs. The cost of inland modes, inland mode time, GHG emissions and cost
of ports have negative signs. Meanwhile the number of ship calls at the port and the
reliability of inland modes have positive signs. Both the estimated alternative-specific
constants (ASCs) and the corrected ASCs indicate that the alternative of JKT-RD is
the most attractive alternative compared to the other alternatives. The corrected ASCs
are calculated by reducing the estimated ASCs by the natural logarithm of the ratio of
the real share for all container exports from Java to the sample share, this process
being iterated until the simulation results were found to be very close to the actually
observed shares.

10
Table 5: Estimation results of the Mixed Nested Logit Model using SP Data
Utility Parameters Value Robust Std err
Robust t-test
Alternative Specific Constant 1 (JKT-RD) 0
Alternative Specific Constant 2 (JKT-RL) -1.3 (-6.347) 0.243 -5.33***
Alternative Specific Constant 3 (SMG-RD) 0.694 (-7.151) 0.325 2.14**
Alternative Specific Constant 4 (SMG-RL) -1.990 (-11.36) 0.443 -4.5***
Alternative Specific Constant 5 (SBY-RD) 0.010 (-2.901) 0.33 0.03
Alternative Specific Constant 6 (SBY-RL) -0.846 (-7.389) 0.319 -2.65***
Alternative Specific Constant 7 (CMY-RD) -0.786 (-1.673) 0.242 -3.25***
Alternative Specific Constant 8 (CMY-RL) -1.740 (-8.881) 0.452 -3.85***
Mode Cost for number Per shipment > 2 TEUs -0.410 0.068 -6.02***
Mode Cost for number Per shipment up to ≤ 2 TEUs -0.312 0.064 -4.9***
Mode Cost Std Deviation for number Per shipment ≤ 2 TEUs -0.329 0.103 -3.19***
Mode GHG Emissions for Volume export > 10 TEUs/month -1.080 0.217 -5.01***
Mode GHG Emissions for Volume export ≤ 10 TEUs/month -0.757 0.2 -3.79***
Mode Reliability for Exporters 1.990 0.377 5.28***
Mode Reliability for Forwarders 4.170 1.02 4.09***
Mode Time for the product with HS13 Code = 44 or HS Code = 94 -1.08 0.278 -3.9***
Mode Time for the product with others HS Code -1.06 0.224 -4.74***
Port Cost for shipment frequency > 5 times per month -0.879 0.186 -4.73***
Port Cost for shipment frequency ≤ 5 times per month -0.411 0.15 -2.73**
Port Ships calls for Exporters 0.684 0.29 2.36**
Port Ships calls for Forwarders 1.54 0.555 2.78**
Nesting Parameters
Cilamaya Port (New Port) 0.622 0.168 3.71***
Tanjung Priok Port (Existing Port) 0.751 0.155 4.84***
Tanjung Perak Port (Existing Port) 1
Tanjung Emas Port (Existing Port) 0.519 0.0733 7.08***
Number of estimated parameter 23
Number of Observations 1287
Null log-likelihood -1784.161
Final log-likelihood -1352.993
Likelihood ratio test 862.335
2 0.242
Adjusted 2 0.229 Note:- * Significant at the 90% level, ** Significant at the 95% level, *** Significant at the 99% level.
- The values of ASCs in parentheses are the corrected ASCs.
3.3 Policies
Five policy scenarios have been simulated using the MXNL model to examine the
impact of each policy for the inland transportation leg of containerised exports from
Java. These policies are:
13 HS Code is Harmonised System Code. This is a standard and very widely adopted code for classifying goods in international trade.

11
Route and time restrictions for the truck/road mode, on an assumption that truck/road cost will increase by 5% on average and truck/road time will increase by 10%.
Reducing fuel subsidies, which will increase fuel price by 50%, leading to an increase in truck/road mode cost of 25%.
Establishment of the rail network between Jakarta and Surabaya, which will reduce the rail transport time by 20%.
The expansion of Tanjung Priok Port, which will increase its capacity from 6 million TEUs/year to 9 million TEUs/year by 2016. It is assumed that this expansion will increase ship calls at Tanjung Priok Port by 30%.
Provision of subsidy to rail freight transport, to reduce the rail tariff by 20%.
3.4 Simulation results
The simulation process was carried out using the best model obtained from the
estimation process on the SP data; the RP data was used in the simulation stage as a
sample for model application; the corrected ASCs were used to reflect closely the real
situation. Eight alternatives were used in the simulation, instead of four alternatives
presented to the respondents during the survey. The market share for each alternative
is the average probability of the respondents to select the alternative, based on their
current choice. The simulation results for the five policies are shown in Table 6.
Table 6: Market share of the alternatives through simulating the policy scenarios using RP data and model from SP data
Port-Mode Alternative
Without Policy
With Policy Scenario 1
With Policy Scenario 2
With Policy Scenario 3
With Policy Scenario 4
With Policy Scenario 5
Share (%) Share (%) Share (%) Share (%) Share (%) Share (%)
JKT-RD 54.30 53.04- 52.95- 54.16- 56.36+ 54.13-
JKT-RL 2.07 2.29+ 2.37+ 2.36+ 2.22+ 2.46+
SMG-RD 4.00 4.71+ 5.08+ 3.94- 3.83- 3.85-
SMG-RL 0.15 0.19+ 0.24+ 0.16+ 0.14- 0.18+
SBY-RD 24.92 25.14+ 24.77- 24.73- 24.42- 24.58-
SBY-RL 0.95 1.13+ 1.29+ 1.05+ 0.93- 1.20+
CMY-RD 13.10 12.94- 12.72- 13.04- 11.64- 13.01-
CMY-RL 0.50 0.55+ 0.58+ 0.56+ 0.45- 0.59+
Combined alternative share (Port Alternative – Mode Alternative)
Tanjung Priok Port 56.37 55.33- 55.32- 56.52+ 58.58+ 56.59+
Tanjung Emas Port 4.15 4.91+ 5.33+ 4.10- 3.98- 4.03-
Tanjung Perak Port 25.88 26.27+ 26.06+ 25.78- 25.35- 25.78-
Cilamaya Port 13.60 13.49- 13.30- 13.60# 12.09- 13.60#
Road mode 96.33 95.83- 95.52- 95.87- 96.25- 95.57-
Rail mode 3.67 4.17+ 4.48+ 4.13+ 3.75+ 4.43+ Note: The numbers in italic format are the minimum shares, and the numbers in bold are the maximum shares. The - signs indicate that the market shares decrease, the + signs indicate that the shares increase compared to the ‘without policy’ condition. The # signs indicate that the result is unchanged from the previous shares.

12
4. Discussion
4.1 Attractiveness of the alternatives
The values of corrected ASCs indicate the dominance of the JKT-RD alternative over
the other alternatives. The JKT-RD alternative is superior to other alternatives because
most exporters in Java are located near Tanjung Priok Port and the road mode offers
the quicker and cheaper alternative inland mode compared to the rail mode for such
shorter distance haulage. Furthermore, the high number of international container ship
calls in Tanjung Priok Port also contributes to the attractiveness of the JKT-RD
alternative (see Table 1). The JKT-RL alternative is less attractive than the JKT-RD
alternative as the JKT-RL alternative still needs road/truck haulage to carry the
container from the origin to the nearest rail freight terminal. However, the JKT-RL
alternative is more attractive compared to the use of the rail mode than for the other
port alternatives.
The least attractive alternative is the SMG-RL alternative, with a corrected ASC of -
11.36. This alternative is the least attractive alternative because of the location of
Tanjung Emas Port is in Central Java area. This location means that distances from the
traffic origins to the port are insufficient to make rail haulage attractive. The longest
distance to the Tanjung Emas Port is from Pasuruan, which is 345km (see Table 2).
However, the SMG-RD alternative is also the least competitive port for the road
mode, and this finding is relevant as Tanjung Emas Port has the fewest international
container ship calls (530 ship calls in 2012).
The range of corrected ASCs for the alternatives using the road mode is from -7.151
(SMG-RD) to 0 (JKT-RD alternative), whereas for the rail mode the range is from -
11.36 (SMG-RL) to -6.347 (JKT-RL). These ranges of ASCs for each inland mode
signify that the road mode is more attractive to respondents, compared with the rail
mode, for all ports. These results reveal that strong policies will be needed to increase
the attractiveness of the rail mode to exporters and freight forwarders.

13
4.2 Attributes of port and inland mode
All of the utility parameter coefficients have the expected signs, and the robust t-test
values indicate that all of the coefficients are significant or highly significant (see
Table 5). These results are consistent with findings by previous researchers, both for
inland port mode choice and choice. Coefficients of parameters for inland mode cost,
inland mode time, inland mode GHG emissions, and port cost display negative signs,
meaning that increases in any of these factors will reduce utility. Conversely, positive
coefficients for inland mode reliability and ship calls indicate that improvements in
these factors will increase the utility of the alternative.
The attributes of inland mode examined in this research include inland mode cost,
inland mode time, inland mode reliability, and inland mode GHG emissions. The
inland mode cost for shipments of up to two TEUs per shipment is the only attribute,
which shows significant observed and unobserved heterogeneity of the individual
decision makers, and suggests that inland mode cost is less important for decision
makers with shipment sizes of up to two TEUs per shipment. This research also tried
to estimate separately the impact of inland mode time for those products with HS code
numbers 44 and 94 (wood products) compared to other products, but no significant
difference between these two groups was found.
Exporters and freight forwarders with bigger volumes of exports (more than 10 TEUs
per month) are more sensitive to changes in GHG emissions than companies with
smaller export volumes. This finding suggests that bigger companies have a greater
awareness of GHG emissions.
Inland mode reliability is the only inland mode attribute with a positive sign.
Exporters and freight forwarders have different preferences for port and inland mode
selecting for their export activities based on inland mode reliability. For freight
forwarders, inland mode reliability is a very significant factor that influences their
decisions. In contrast, the importance of inland mode reliability is much less from the
exporters’ perspective. Freight forwarders may pay more attention to inland mode
reliability because they wish to minimise complaint from their clients and/or they
have to ensure their services are fully utilised.

14
For exporters and freight forwarders with more frequent shipments (more than five
times per month), the port cost is found to be a more important consideration than for
companies making less frequent shipments. Many researchers have revealed that port
cost is one of the key factors for shippers when selecting their preferred port. The
frequency of ship calls is a factor that has a positive sign, as expected. This factor to
be a more important consideration for freight forwarders than for exporters when
choosing between alternative port/inland mode combinations.
4.3 Market shares
Comparing the simulation results in Table 6 with the current market shares in Table 1
indicates that the major impact of the development of Cilamaya port will be on the
Tanjung Priok Port market share, reducing it from about 65% to only 56%.
Nevertheless, the market shares of Tanjung Emas Port and Tanjung Perak Port will
also impacted by the establishment of Cilamaya Port. The reduced market share of the
Tanjung Priok Port is mainly caused by the shifting of user choices in areas which are
closer to Cilamaya Port than to Tanjung Priok Port. These areas include Bekasi,
Karawang and Cirebon. The expansion of the Tanjung Priok Port capacity, on the
other hand, will raise its market share from 56% to 58% and will reduce all other
port’s market shares.
Traditionally a port has a relatively stable hinterland, with its market share largely
dependent on the hinterland size and the connections between the hinterland to the
port (Notteboom, 2008). The hinterland area of Tanjung Priok Port covers the
surrounding areas of West Java including Jakarta, Bandung, Bekasi, Tangerang,
Cirebon, Bogor and Karawang. These areas contribute more than 90% of exports from
Tanjung Priok Port14. Meanwhile, the hinterland of Tanjung Emas Port is the Central
area of Java, namely Semarang, Jepara, Surakarta and Yogyakarta, which provide
72%15 of the port’s exports. The traditional hinterland of Tanjung Perak Port is the
region in East Java – parts of Surabaya, Malang, Gresik, Sidoarjo and Pasuruan.
14 Based on the interview with the staff of Pelindo II in Jakarta. 15 Data from the authority of the Tanjung Emas Port

15
From the simulation results in Table 6, we can also observe that all of the suggested
policies will reduce the market share of the JKT-RD alternative, with the exception of
the policy of expanding the capacity at Tanjung Priok Port, which will make more
exporters and freight forwarders shift their choices to that port. The policy of reducing
fuel subsidies will lead to the largest decrease in the market share of the JKT-RD
alternative. All policies will have a positive impact on the JKT-RL alternative, with
the largest increase in market share being obtained when the incentive to reduce the
freight rail tariff is applied.
There are surprising results obtained from simulations for alternative SMG-RD,
policies 1 and 2. Whilst it was anticipated that these policies would lower the market
share for the SMG-RD alternative, it is found that the market share is projected to
increase from 4% to 4.71% and 5.08% respectively. This finding might be explained
by the fact that the location of Tanjung Emas Port in the middle of Java allows for
road mode users from other ports to switch to the SMG-RD alternative rather than
switch to the rail mode. All the policies have positive impacts on the SMG-RL
alternative, except for Policy 4. This result is very reasonable because the other four
policies act to increase the utility of alternatives using the rail mode or to reduce the
utility of the road mode alternatives.
All the policies decrease the market share of the SBY-RD alternative, with the
exception of the policy of route and time restrictions for the road mode. This result is
particularly interesting because it is hypothesised that such route and time restrictions
will reduce the market share of alternatives using the road modes. However, it may be
the case that this policy has the largest impact on the JKT-RD alternative due to the
traffic congestions near Tanjung Priok Port. The introduction of this policy will have
direct negative impact on the JKT-RD alternative that will cause the road users to
switch to other ports such as Tanjung Emas and Tanjung Perak.
The market shares of the CMY-RD alternative decline as a result of all of the
proposed policies. The largest decrease results from the extension of Tanjung Priok
Port, because of the location of Cilamaya Port just 100km away. The only decrease in

16
share for the CMY-RL alternative is that resulting from the extension of Tanjung
Priok Port and the biggest increase in market share for that option is caused by the
introduction of subsidies to reduce the freight rail tariff.
The market shares of all the alternatives using rail modes are increased by the
proposed policies, with the largest positive impacts on the rail modes resulting from
Policy 2 (reducing fuel subsidies). This policy is also easier to implement, and the
government would not need to spend any budget to apply this policy. Furthermore, the
extension of Tanjung Priok Port has the least positive impact – a plausible finding
since this policy is not directly related to the inland mode attributes.
5. Conclusion
This paper has examined port and inland mode choice from the perspective of
exporters and freight forwarders using SP data collected for this purpose. Data
collection has been carried out in 16 cities in Java using SP methods and conducted in
two phases - a pilot and a main survey. Parameter estimation was conducted using
four models: MNL, NL, MXMNL, and MXNL. The MXNL model was chosen as the
best model based on the value of final log-likelihood, likelihood ratio test, 2, adjusted
2, and the signs of the estimated parameters.
Estimation results using the MXNL model show that all of the inland mode attributes
and the port attributes are significant and have the expected signs. Coefficients of
parameters for inland mode cost, inland mode time, inland mode GHG emissions and
port cost display negative signs implying negative effects on the utilities of the
alternatives concerned, whereas coefficients for inland mode reliability and ship calls
demonstrate positive effects on utilities of the alternatives. Exporters and freight
forwarders display somewhat different preferences with respect to both inland mode
reliability and port ship calls.
The JKT-RD alternative is the alternative with the largest market share. However, the
market share of Tanjung Priok Port will be the most affected by the establishment of
the new Cilamaya Port. Implementation of Policy 2 (reducing fuel subsidies) has the

17
largest potential for shifting inland mode choice from the road mode to the rail mode.
However, the increase in the rail market share would be very small - just less than 1%.
This research is ongoing, with the next step aiming to explore the use of the joint SP
and RP data for estimation, in an attempt to make the model replicate closer to the real
observed situation.
6. Acknowledgements
The authors wish to thank all the exporters and freight forwarders who participated in
the surveys underpinning this research. The authors also wish to thank the Directorate
of Higher Education, Ministry of Research, Technology and Higher Education, the
Republic of Indonesia for financial support for this research. The authors are also
grateful to referees for their suggested improvements to this paper.
Annexe 1: The nesting structure for NL and MXNL models
Annexe 2: Non-response bias test
A non-response bias test has been conducted in the light of the low survey response
rate of around 4%. As data relating to non-respondents was not available for this
research, the procedure adopted was to investigate whether early and late respondents
to the survey provided significantly different responses. There are 735 observations
from 93 respondents in the group of early respondents, and 552 observations from 71
respondents in the group of late respondents. The test used the simple multinomial
logit (MNL) to compare the characteristics of early respondents with those of late

18
respondents. According to the test results, there are no significant differences between
the two respondents groups. Results of the test are presented in Table 7.
Table 7: Comparison results of model estimation, using data for early respondents and
late respondents
Name Early respondents16 Late respondents
Value Robust std err
Robust t-test Value
Robust std err
Robust t-test
ASC_1_JKT_ROAD 0
0
ASC_2_JKT_RAIL -0.859 0.15 -5.73 -1.43 0.199 -7.16
ASC_3_SMG_ROAD 0.619 0.346 1.79 0.605 0.404 1.5
ASC_4_SMG_RAIL -0.863 0.368 -2.34 -1.29 0.43 -3
ASC_5_SBY_ROAD 0.583 0.367 1.59 -0.233 0.43 -0.54
ASC_6_SBY_RAIL -0.63 0.356 -1.77 -1.05 0.397 -2.65
ASC_7_CMY_ROAD -0.448 0.144 -3.11 -0.713 0.168 -4.24
ASC_8_CMY_RAIL -1.19 0.178 -6.67 -1.36 0.21 -6.45
B_M_COST -0.292 0.0468 -6.24 -0.204 0.0533 -3.83
B_M_GHG -0.825 0.154 -5.37 -0.807 0.168 -4.81
B_M_RELI 2.24 0.377 5.95 1.55 0.454 3.42
B_M_TIME -0.942 0.19 -4.95 -0.807 0.233 -3.47
B_P_COST -0.357 0.127 -2.81 -0.464 0.154 -3.01
B_P_SHIP 0.628 0.268 2.34 0.704 0.372 1.89
Number of observations 735 552
Number estimated parameters 13 13
Init log-likelihood: -1018.926 -765.234
Final log-likelihood: -779.967 -579.978
Likelihood ratio test: 477.918 370.513
Rho-square: 0.235 0.242
Adjusted rho-square: 0.222 0.225
16 Early respondents are those respondents who completed the surveys after having received the first invitation. Late respondents completed the surveys after having received the reminder.

19
Bibliography
Abdelwahab, W. M. (1998). Elasticities of mode choice probabilities and market elasticities of demand: evidence from a simultaneous mode choice/shipment-size freight transport model. Transportation Research, Part E, 34(4), 257–266.
Beuthe, M., & Bouffioux, C. (2008). Analysing qualitative attributes of freight transport from stated orders of preference experiment. Journal of Transport Economics and Policy, 42(Part 1), 105–128.
Bierlaire, M. (2009). Estimation of discrete choice models with BIOGEME 1.8. Retrieved from http://biogeme.epfl.ch/v18/tutorialv18.pdf
Chang, Y.-T., Lee, S.-Y., & Tongzon, J. L. (2008). Port selection factors by shipping lines: Different perspectives between trunk liners and feeder service providers. Marine Policy, 32(6), 877–885. doi:10.1016/j.marpol.2008.01.003
CHOICEMETRICS. (2012). Ngene 1.1.1 User Manual and Reference Guide The Cutting Edge in Experimental Design.
Chou, C.-C. (2005). A comparative study of models for port choice (Vol. 5, pp. 608–616). Bangkok, Thailand: Eastern Asia Society for Transport Studies.
De Jong, G., & Ben-Akiva, M. (2007). A micro-simulation model of shipment size and transport chain choice. Transportation Research Part B-Methodological, 41(9), 950–965. doi:DOI 10.1016/j.trb.2007.05.002
Feo, M., Espino, R., & García, L. (2011). A stated preference analysis of Spanish freight forwarders modal choice on the south-west Europe Motorway of the Sea. Transport Policy, 18(1), 60–67. doi:10.1016/j.tranpol.2010.05.009
Garcia-Menendez, L., Martinez-Zarzoso, I., & De Miguel, D. P. (2004). Determinants of Mode Choice between Road and Shipping for Freight Transport Evidence for Four Spanish Exporting Sectors. Journal of Transport Economics and Policy, 38(Part 3), 447–466.
Lirn, T. C., Thanopoulou, H. A., Beynon, M. J., & Beresford, A. K. C. (2004). An Application of AHP on Transhipment Port Selection: A Global Perspective. Maritime Econ Logistics, 6(1), 70–91. Retrieved from http://dx.doi.org/10.1057/palgrave.mel.9100093
Louviere, J. J., Hensher, D. A., & Swait, J. D. (2000). Stated choice methods analysis and applications. Cambridge; New York, NY, USA: Cambridge University Press.
Malchow, M. B., & Kanafani, A. (2004). A disaggregate analysis of port selection. Transportation Research Part E: Logistics and Transportation Review, 40(4), 317–337. doi:10.1016/j.tre.2003.05.001

20
Nir, A.-S., Lin, K., & Liang, G.-S. (2003). Port choice behaviour--from the perspective of the shipper. Maritime Policy & Management, 30(2), 165–173. doi:10.1080/0308883032000069262
Norojono, O., & Young, W. (2003). A stated preference freight mode choice model. Transportation Planning and Technology, 26 (2), 195–212.
Notteboom, T. E. (2008). The Relationship between Seaports and the Intermodal Hinterland in light of Global Supply Chains. Paris, France. doi:10.1787/9789282102251-en
Ravibabu, M. (2013). A nested logit model of mode choice for inland movement of export shipments: A case study of containerised export cargo from India. Research in Transportation Economics, 38(1), 91–100. doi:10.1016/j.retrec.2012.05.007
Shinghal, N., & Fowkes, T. (2002). Freight mode choice and adaptive stated preferences. Transportation Research Part E: Logistics and Transportation Review, 38, 367–378. doi:10.1016/S1366-5545(02)00012-1
Steven, A. B., & Corsi, T. M. (2012). Choosing a port: An analysis of containerized imports into the US. Transportation Research Part E: Logistics and Transportation Review, 48(4), 881–895. doi:10.1016/j.tre.2012.02.003
Tiwari, P., Itoh, H., & Doi, M. (2003). Shippers’ Port and Carrier Selection Behaviour in China: A Discrete Choice Analysis. Maritime Economics & Logistics, 5(1), 23–39. doi:10.1057/palgrave.mel.9100062
Tongzon, J. L. (2009). Port choice and freight forwarders. Transportation Research Part E: Logistics and Transportation Review, 45(1), 186–195. doi:10.1016/j.tre.2008.02.004
Tongzon, J. L., & Sawant, L. (2007). Port choice in a competitive environment: from the shipping lines’ perspective. Applied Economics, 39 (4-6)(4-6), 477–492.
Wiegmans, B. W., Hoest, A. van der, & Notteboom, T. (2008). Port and terminal selection by deep-sea container operators. In European Transport Conference 2008. Leeuwenhorst Conference Centre, The Netherlands: Association for European Transport and Contributors.
World Trade Organization, W. (2013). International Trade Statistics 2013. Retrieved from http://www.wto.org/english/res_e/statis_e/its2013_e/its2013_e.pdf