
AUTOMATIC OBJECT EXTRACTION OVER MULTI- SCALE EDGE FIELD FOR

PNNL-21882 RPT-DVZ-AFRI-011
Prepared for the U.S. Department of Energy under Contract DE-AC05-76RL01830
Pore-Water Extraction Scale-Up Study for the SX Tank Farm MJ Truex M Oostrom TW Wietsma GV Last DC Lanigan January 2013

PNNL-21882 RPT-DVZ-AFRI-011
Pore-Water Extraction Scale-Up Study for the SX Tank Farm MJ Truex M Oostrom TW Wietsma GV Last DC Lanigan January 2013 Prepared for the U.S. Department of Energy under Contract DE-AC05-76RL01830 Pacific Northwest National Laboratory Richland, Washington 99352


iii
Executive Summary
Nitrate and technetium-99 (Tc-99) concentrations measured in the water condensate of soil gas extracted as part of earlier work at the U.S. Department of Energy’s Hanford Site in southeastern Washington State suggest that pore water was extracted from the sediment and entrained in the exhausted soil gas. As a remedial approach, pore-water extraction offers the possibility of contaminant and water removal from the vadose zone, which may be beneficial in reducing the flux of vadose zone contaminants to the groundwater. Previous laboratory and modeling efforts examining pore-water extraction have focused on two implementation approaches: 1) application of negative pressure (vacuum) via soil-gas extraction at a well to induce coincident pore-water extraction; and 2) deployment of super-absorbent polymers in a well to extract water from the surrounding soil.
In this study, laboratory experiments and numerical modeling were conducted to specifically examine pore-water extraction for sediment conditions relevant to the vadose zone beneath the SX Tank Farm at the Hanford Site. Available SX Tank Farm data were evaluated to generate a conceptual model of the subsurface in areas with elevated moisture and Tc-99 concentration. This conceptual model formed the basis to select materials for subsequent laboratory hydraulic property analyses, and for conducting numerical modeling to simulate a targeted application of pore-water extraction.
Hydraulic properties of the types of sediment in the targeted zone of the SX Tank Farm subsurface were determined in the laboratory. Sediment mixtures were prepared in the laboratory based on borehole sediment particle-size data for each type of sediment. Measurements quantified the sediment porosity, hydraulic conductivity, and the nature of pressure-saturation relationships, thereby extending the available sediment characterization data. These sediment characterization data were used to estimate the pore-water extraction potential for each sediment type as a function of initial moisture content and applied suction. In summary, study results showed that pore-water extraction through application of vacuum or absorbent polymers can extract water from SX Tank Farm sediments primarily when initial volumetric moisture content is above 20% (m3
water/m3
total) and applied suction is greater than 300 cm H2O. Another important finding was that the hydraulic properties of the sediments in the targeted pore-water extraction area are similar. Thus, inefficiencies in pore-water extraction caused by hydraulic property heterogeneity may not be extreme for the targeted vadose zone depth intervals at the SX Tank Farm. Future laboratory flow cell tests will provide more specific information for evaluating the impact of sediment property differences on pore-water extraction performance and are also required to select appropriate well filter-pack materials to ensure efficient pore-water extraction.
Numerical modeling was used as an evaluation tool to examine scale-up of pore-water extraction. In numerical simulations, the pore-water extraction rate declined rapidly from initial extraction rates to a steady-state rate under conditions with an infinite water supply (e.g., a laterally extensive high moisture zone). Although not simulated, a finite water supply would result in a continued decline of pore-water extraction rates over time. The rate of pore-water extraction is relatively slow for the simulated SX Tank Farm conditions because water content reduction near the extraction well resulted in a decreased water relative permeability. In general, unless the hydraulic conductivity encountered in the field is significantly different (greater or smaller) from the values determined in the laboratory, pore-water extraction rates are expected to be approximately 5 to 15 L/day. As an example, these pore-water extraction rates translate to remediation time frames on the order of decades for the goal of decreasing volumetric moisture content by 5% (m3
water/m3
total) in a 10-m radius around an extraction well. Thus, the

iv
remedy must be applied over a relatively long time frame to meet objectives, much like other contaminant extraction technologies (e.g., pump-and-treat of groundwater). These estimates of pore-water extraction rates (and corresponding remediation time frames) should be considered as an approximation. Additional data from planned laboratory flow cell experiments and field testing will provide more specific remedy performance information.

v
Acknowledgments
This document was prepared by the Deep Vadose Zone-Applied Field Research Initiative at Pacific Northwest National Laboratory. Funding for this work was provided by the U.S. Department of Energy Richland Operations Office. Pacific Northwest National Laboratory is operated by Battelle Memorial Institute for the U.S. Department of Energy under contract DE-AC05-76RL01830.


vii
Acronyms and Abbreviations
CAD computer-aided design
CCUcal Cold Creek Unit caliche
CCUz Cold Creek Unit silt
DOE U.S. Department of Energy
PNNL Pacific Northwest National laboratory
SAP super-absorbent polymer
STOMP Subsurface Transport Over Multiple Phases


ix
Contents
Executive Summary .............................................................................................................................. iii Acknowledgments ................................................................................................................................. v Acronyms and Abbreviations ............................................................................................................... vii 1.0 Introduction .................................................................................................................................. 1 2.0 Summary of Previous Efforts ....................................................................................................... 3
2.1 Vacuum-Induced Pore-Water Extraction ............................................................................. 3 2.2 Wicking by Super-Absorbent Polymers ............................................................................... 4
3.0 Approach ...................................................................................................................................... 7 3.1 SX Tank Farm Conceptual Model for Pore-Water Extraction ............................................. 7 3.2 Hydraulic Property Measurement ........................................................................................ 7 3.3 Numerical Simulation Study ................................................................................................ 8 3.4 Flow Cell Development ....................................................................................................... 11
4.0 SX Tank Farm Conceptual Model for Pore-Water Extraction ..................................................... 13 4.1 Target Area ........................................................................................................................... 13
4.1.1 Plume Distribution .................................................................................................... 13 4.1.2 Moisture and Tc-99 Targets ...................................................................................... 15
4.2 Data Compilation ................................................................................................................. 18 4.3 Conceptual Model Development .......................................................................................... 18
4.3.1 Hanford Formation, H1 Unit ..................................................................................... 19 4.3.2 Hanford Formation, H2 Unit ..................................................................................... 20 4.3.3 Cold Creek Unit Silt .................................................................................................. 21 4.3.4 Cold Creek Unit Caliche ........................................................................................... 22
4.4 Conceptual Model Spatial Distribution ................................................................................ 23 4.5 Correlation to Potential Test Site ......................................................................................... 26
5.0 Sediment Property Testing ........................................................................................................... 29 6.0 Numerical Simulation Results ...................................................................................................... 33 7.0 Conclusions .................................................................................................................................. 43 8.0 References .................................................................................................................................... 45 Appendix – Flow Cell Design for Pore-Water Extraction Experiments ............................................... A.1

x
Figures
1 Experimental apparatus used to determine hydraulic properties .................................................. 8 2 Computational domain for wicking and vacuum-induced pore-water extraction simulations ..... 11 3 Area most likely indicative of soil moisture and electrolyte concentrations ................................ 14 4 Cross-sectional view of below the 0.8-log ohm-meter contour area that is most likely
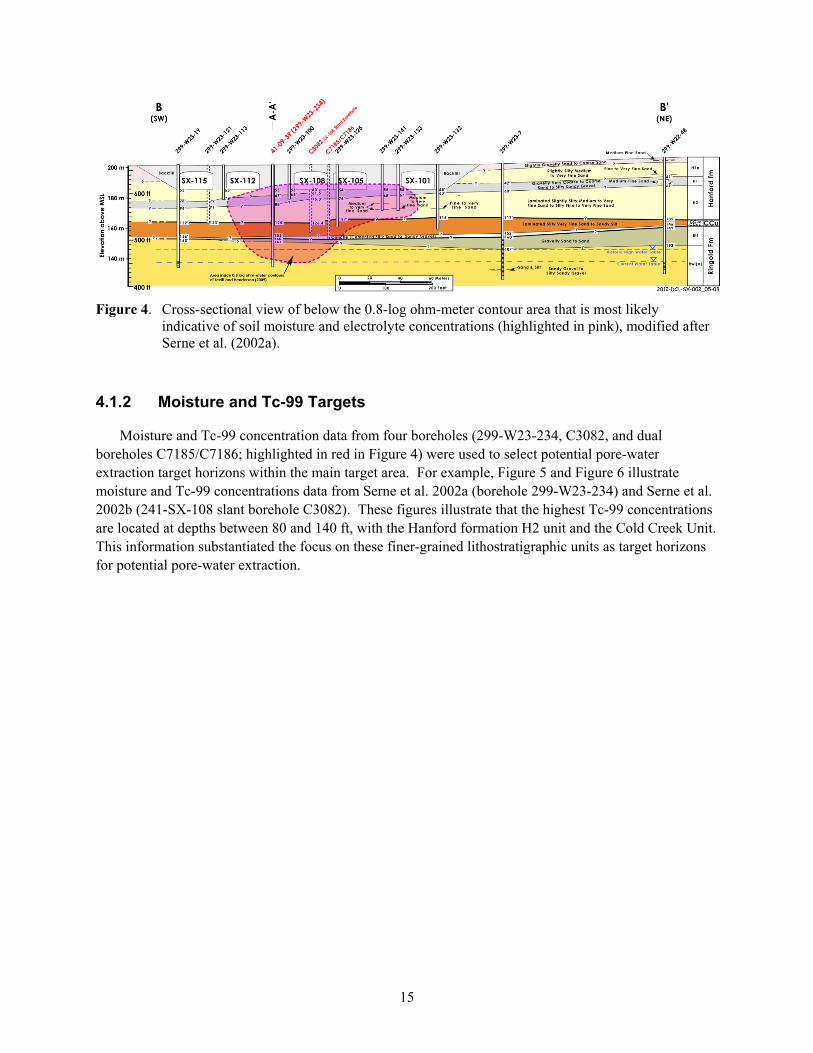
indicative of soil moisture and electrolyte concentrations, modified after Serne et al. (2002a) .......................................................................................................................................... 15
5 Moisture content and Tc-99 distribution for borehole 299-W23-234 ........................................... 16 6 Moisture content and Tc-99 distribution for the 241-SX-108 slant borehole ............................... 17 7 Composite borehole log for borehole 299-W23-234 showing the vertical distribution
of lithofacies selected for the conceptual model to support SX Tank Farm pore-water extraction modeling ...................................................................................................................... 25
8 Boreholes in between the 241-SX-108 Tank and a potential pore-water extraction test site near boreholes C7155 and C7156 .......................................................................................... 26
9 Cross-section C-C' beneath the SX Tank Farm and extending west to the potential location of a field test site ............................................................................................................. 27
10 Experimentally determined water-retention relations for the four tested samples listed in Table 9 .......................................................................................................................................... 29
11 Extraction rate as a function of time for Base Case A for vacuum-induced pore-water extraction at 200 and 300 cm H2O, and wicking at 400 and 600 cm H2O of suction ................... 34
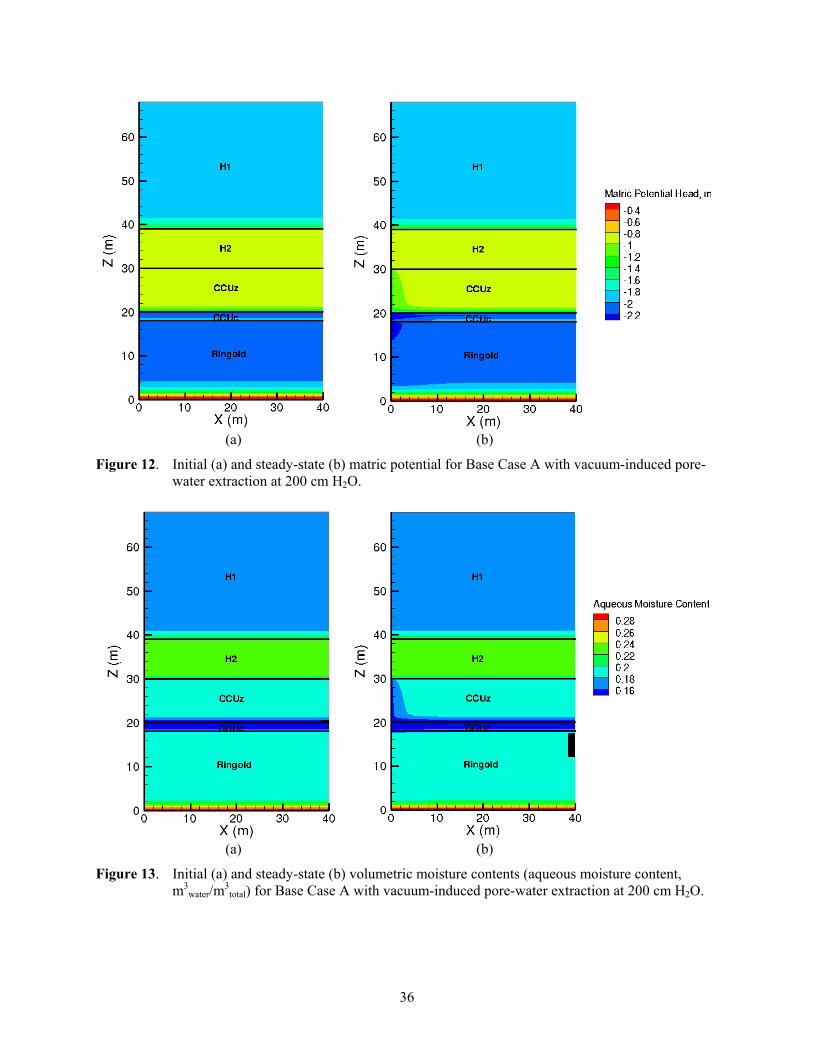
12 Initial and steady-state matric potential for Base Case A with vacuum-induced pore- water extraction at 200 cm H2O .................................................................................................... 36
13 Initial and steady-state volumetric moisture contents for Base Case A with vacuum- induced pore-water extraction at 200 cm H2O .............................................................................. 36
14 Soil matric potential as a function of time at various distances from the extraction well in the center of the CCUz for Base Case A with an imposed vacuum of 200 cm H2O ................ 37
15 Volumetric moisture content as a function of time at various distances from the extraction well in the center of the CCUz for Base Case A with an imposed vacuum of 200 cm H2O ................................................................................................................. 37
16 Steady-state volumetric moisture contents and matric potential for Base Case A with a wicking suction of 600 cm H2O .................................................................................................... 38
17 Matric potential and volumetric moisture content as a function of time for water extraction for Base Case A using wicking at a suction of 600 cm H2O ........................................ 39
18 Steady-state volumetric water contents for Base Case B with a vacuum-induced pore- water extraction of 200 cm H2O, and a wicking suction of 600 cm H2O ..................................... 40
19 Steady-state volumetric water contents for Case A Ksat/10 and Case A Ksat × 10 with a vacuum-induced pore-water extraction of 200 cm H2O ............................................................... 40
20 Steady-state volumetric water contents for Case B Ksat/10 and Case B Ksat × 10 with a vacuum-induced pore-water extraction of 200 cm H2O ............................................................... 41

xi
Tables
1 Particle-size distribution of the prepared sediment mixtures representing the H2 unit and CCUz lithofacies ........................................................................................................................... 7
2 Description of the lithofacies defined for each lithostratigraphic unit .......................................... 19 3 Average particle-size and calcium carbonate content data from the ROCSAN database
for lithofacies of the Hanford H1 unit, using Folk-Wentworth grain-size divisions .................... 20 4 Average particle-size and calcium carbonate content data for lithofacies of the Hanford
H2 unit from the ROCSAN database using Folk-Wentworth grain-size divisions ...................... 21 5 Average particle-size and calcium carbonate content data for CCUz lithofacies taken
from the ROCSAN database using Folk-Wentworth grain-size divisions .................................... 22 6 Average particle-size, moisture content, and matric suction data for Cold Creek Unit
CCUz lithofacies taken from Serne et al. (2002a) using modified Folk-Wentworth grain-size divisions ....................................................................................................................... 22
7 Average particle-size and calcium carbonate content data for Cold Creek Unit caliche lithofacies taken from the ROCSAN database using Folk-Wentworth grain-size divisions ........ 23
8 Depths for the contact at the top of lithofacies penetrated by borehole 299-W23-234, modified from Serne et al. (2002a) ............................................................................................... 24
9 Hydraulic properties of the four tested sediment mixtures and the statistical mean values provided by Last et al. (2006) ....................................................................................................... 29
10 Calculated volumetric moisture content reduction as function of sediment type, initial moisture content, and applied suction ........................................................................................... 30
11 Overview of the conducted simulations ........................................................................................ 33 12 Hydraulic properties of the five layers used in the STOMP simulations ...................................... 33 13 Steady-state extraction rates for all simulations ........................................................................... 35


1
1.0 Introduction
Nitrate and technetium-99 (Tc-99) concentrations measured in the water condensate of soil gas extracted as part of earlier work (DOE/RL 2010) at the U.S. Department of Energy (DOE) Hanford Site in southeastern Washington State suggest that pore water was extracted from the sediment and entrained in the exhausted soil gas. As a remedial approach, pore-water extraction offers the possibility of contaminant and water removal from the vadose zone, which may be beneficial in reducing the flux of vadose zone contaminants to the groundwater. Previous laboratory and modeling efforts examining pore-water extraction have focused on two implementation approaches: 1) application of negative pressure (vacuum) via soil-gas extraction at a well to induce coincident pore-water extraction (Oostrom et al. 2011); and 2) deploying super-absorbent polymers (SAPs) in a well to extract water from the surrounding soil (Oostrom et al. 2012). A summary of this previous work is provided in Section 2.0.
The phenomena related to pore-water extraction from unsaturated sediments have been previously examined with limited laboratory experiments and numerical modeling. However, key scale-up issues have not yet been addressed. Laboratory experiments and numerical modeling were conducted to specifically examine pore-water extraction for sediment conditions relevant to the vadose zone beneath the SX Tank Farm at the Hanford Site. Available SX Tank Farm data were evaluated to generate a conceptual model of the subsurface in areas with elevated moisture and Tc-99 concentration. This conceptual model formed the basis to select materials for subsequent laboratory hydraulic property analyses, and for conducting numerical modeling to simulate a targeted application of pore-water extraction. Hydraulic properties of the types of sediment in the targeted zone of the SX Tank Farm subsurface were determined in the laboratory. Measurements quantified the sediment porosity, hydraulic conductivity, and the nature of the pressure-saturation relationships, thereby extending the available sediment characterization data. Numerical modeling was used as an evaluation tool to examine scale-up of pore-water extraction.
This report provides a summary of previous laboratory and modeling evaluations of pore-water extraction (Section 2.0). Section 3.0 presents the study approach. The conceptual model for a targeted potential remediation application of pore-water extraction at the Hanford Site SX Tank Farm is presented in Section 4.0. Results of sediment property testing (Section 5.0) and the numerical simulation study (Section 6.0) are then provided. Section 7.0 presents conclusions for the study. The details of a flow cell constructed for use in a future laboratory evaluation of pore-water extraction are provided in the Appendix.


3
2.0 Summary of Previous Efforts
Previous Pacific Northwest National Laboratory (PNNL) laboratory and modeling efforts examining pore-water extraction are summarized below; details are available in the cited references.
2.1 Vacuum-Induced Pore-Water Extraction
Both numerical simulations and laboratory experiments were used to investigate the process of pore-water extraction by inducing a vacuum with soil-gas extraction. An initial series of numerical simulations were used to evaluate the potential conditions for pore-water extraction and the temporal pattern of the pore-water extraction rate. Based on these simulations, a set of laboratory experiments was designed and conducted to measure pore-water extraction under controlled conditions. The simulation model was revisited to model the laboratory experiments and confirm that the numerical model properly reproduced the experimental results.
Numerical simulations were used to examine the phenomena of pore-water extraction for selected sand, silt, and clay sediment properties. Simulations were configured with a negative pressure (suction) applied at an extraction well, creating a pressure gradient towards the extraction well. From these simulations, it was concluded that the induced pressure gradient across the sediment could result in pore-water migration to the well, with the most movement occurring in silt type sediments (versus sand or clay type sediments). In the simulations, not all pore water could be extracted. Only a portion of water above a threshold moisture content (a function of the sediment properties and imposed vacuum) could be extracted. The simulation results also suggest that the pore-water extraction process can potentially be sustained for as long as water content conditions remain above the threshold for pore-water movement.
A limited set of flow cell tests and associated numerical simulations have also been conducted to demonstrate the phenomena of pore-water extraction (Oostrom et al. 2011) and are summarized in the remainder of this section. A series of six flow cell experiments were conducted to demonstrate the process of pore-water extraction in unsaturated systems as a result of induced vacuum. An intermediate-scale flow cell was specifically designed and constructed for this purpose. The experimental configurations consisted of homogeneous packings that represent, in terms of particle-size distribution, targeted subsurface sediments at the SX Tank Farm that contain high moisture contents and high contaminant concentrations. The porous media used in the actual experiments were mixtures of several classes of other Hanford Site sediments to arrive at the selected particle-size distribution. The water in the flow cell experiments did not contain contaminants.
In the six experiments conducted, the variables considered were the imposed negative pressure (100 cm H2O and 200 cm H2O), initial volumetric moisture content (0.11 and 0.18 m3
water/m3
total), water supply (no flow boundary condition and a condition where extracted water was replenished), and the inclusion of fine-grained sand to represent a filter pack around the extraction well. The experiments without the fine-grained filter pack sand were conducted for 7 days, while the experiments with the fine-grained filter pack sand lasted for 10 days. Temporal data included water content distribution and measurement of water pressure at four locations in the flow cell. For the experiments with the fine-grained filter pack sand, gas pressures were also obtained at the same locations as the water pressures.

4
In experiments where a zero flux water boundary condition was imposed, the application of a negative pressure (vacuum) in a controlled manner resulted in pore-water extraction until the water pressure gradients towards the extraction boundary approached zero. A few scoping tests indicated that when the extraction boundary pressure was applied instantaneously, virtually no water outflow was obtained, likely because of the formation of larger conduits through which air could easily be conducted without associated movement of water. For field applications, it is recommended that the imposed vacuum be slowly increased to avoid the water continuity problems observed in the laboratory.
Additional simple scoping experiments in l-m-long columns indicated that the relative permeability of uniform coarse- and medium-grained sands during pore-water extraction decreased rapidly to a point where virtually no water outflow was observed. To avoid that problem, a fine-grained filter pack sand was used with an entry pressure greater than the imposed vacuum of 100 cm H2O. Inclusion of a saturated, fine-grained filter pack sand resulted in lower production rates than the case without fine-grained filter pack sand. Although limited, this set of experiments suggests that the design of the well and associated filter-pack sands is critical to pore-water extraction performance.
Although the experimental matrix was not sufficiently large to come to conclusions regarding maximizing cumulative pore-water extraction, several general trends were observed. Increased cumulative pore-water extraction was obtained with an increase in initial moisture content or applied negative pressure (suction), and when the water supply was not limited.
The experiments demonstrated that pore-water extraction from unsaturated porous media is, in principle, possible under the highly controlled conditions in the laboratory. The design was such that the moving air was forced to travel through sediment containing the pore water available for extraction. More complex systems with porous media heterogeneities were not investigated.
The pore-water extraction performance and pressure predictions of the simulations were similar to the experimental observations for all six experiments. This result demonstrates that numerical simulations can be used as a design tool for field-scale applications of pore-water extraction. Some of the reasons good agreement between numerical and experimental results were obtained include the independent determination of hydraulic properties and the control of experimental boundary and initial conditions.
2.2 Wicking by Super-Absorbent Polymers
Water removal, including dissolved contaminants, from unsaturated sediments may also be achieved using SAPs (Oostrom et al. 2012), as summarized below. This process may be referred to as “wicking” because the sorbents have the ability to pull water into the material by capillary forces. SAPs are typically cross-linked macromolecules with segments of hydrophilic groups that are able to absorb and retain water. The absorbed water is difficult to remove, even under pressure (Fernandez et al. 2005). SAPs are able to absorb and thereby convert aqueous solutions from a liquid state to a gel-like semi-solid state. Typical absorption capacity ranges from 100 to up to 1000 times the mass of the dry SAP. The rate of absorption is a function of material surface area, and the degree and type of cross-linking.
Column and flow cell experiments were conducted to test the potential of SAPs to remove water from unsaturated porous media. Column experiments, with emplacement of a layer of polymer on top of unsaturated porous media, showed the potential of the SAPs to extract up to 80% of the initially emplaced water (working against gravity) into the sorbent over periods of up to 4 weeks. Flow cells were used to

5
test the wicking behavior of SAPs in two dimensions. The largest removal percentages occurred for a configuration with the largest sorbent-porous medium interfacial area. In some tests, a woven nylon “sock” was packed with sorbent and subsequently placed between perforated metal plates, mimicking a well configuration. After 1 week of contact time, the sock was removed and replaced by a fresh sock. The results of this sock experiment showed that the sorbent was able to continuously extract water from the porous media, although the rate decreased over time. The reduction in absorption rate is associated with the sharp reduction in moisture content and water relative permeability in the porous media near the sorbent. However, the capillary pressure continued to increase over the total contact time of 14 days, indicating that the sorbent remained active over that period. This work demonstrated the potential of soil moisture wicking using SAPs at the proof-of-principle level.


7
3.0 Approach
There were four primary components of this study, as described below.
3.1 SX Tank Farm Conceptual Model for Pore-Water Extraction
Available SX Tank Farm data were evaluated to generate a conceptual model of the subsurface for a targeted potential application of pore-water extraction in areas with elevated moisture and Tc-99 concentration. The conceptual model focuses on the vertical variation in sediments and moisture conditions that are relevant to evaluating the performance of pore-water extraction in the presence of these heterogeneities. Details of the conceptual model development based on site data are described in Section 4.0.
3.2 Hydraulic Property Measurement
The hydraulic properties of the types of porous media representative of the subsurface zone of interest at the SX Tank Farm were determined using sediment mixtures prepared in the laboratory based on the conceptual model data (Section 4.0). Stocks of sieved sediment fractions were combined in the portions identified for the important sediment zones (H2 unit and Cold Creek Unit silt [CCUz]) present within the selected target depth intervals at the SX Tank Farm (see Section 4.0). The mixtures shown in Table 1 for hydraulic testing are consistent with the information provided in Table 4 and Table 5 (Section 4.0) with the following exceptions: 1) the gravel fraction in Table 1 was obtained from a 4–2-mm stock; 2) the fine sand fraction in Table 1 is the sum of the fine and very fine sand fractions in Table 4 and Table 5; and 3) the minimum size of the coarse sand and the maximum size of the medium sand in Table 1 is 0.6 mm because that particular sieve is typically used to make stocks of sediment fractions.
Table 1. Particle-size distribution of the prepared sediment mixtures representing the H2 unit (Table 4) and CCUz (Table 5) lithofacies.
Sample Name Gravel
(4–2 mm)
Sand
Mud (<0.063 mm)
Very Coarse
(2–1 mm) Coarse
(1–0.6 mm) Medium
(0.6–0.25 mm) Fine
(0.25–0.063 mm)
A: H2-m[f-vf]S 0.2 1.5 5.3 21.6 55.6 15.9
B: H2-(m)[m-vf]S 0.3 1.5 3.4 12.5 57.3 24.9
C: CCU-sM 2.5 10.0 7.3 7.1 37.0 36.1
D: CCU-m[vf]S 27.3 8.7 4.9 5.2 30.8 23.1
Hydraulic properties for the four sediment mixtures listed in Table 1 were obtained using procedures described by Schroth et al. (1996) and Wietsma et al. (2009). The experimental setup for determining hydraulic properties is shown in Figure 1. For each material, permeability was obtained first using the constant head method (Wietsma et al. 2009) for columns with a length of 15 cm and an internal diameter of 9.525 cm. The columns were packed with damp porous media (25 g water per kilogram of sediment) in 1-cm-thick layers. After packing each layer, the surface was gently scratched before the next layer was

8
emplaced. This method prevents distinct layering of the porous media. The porosity was calculated using a particle density of 2.70 g/cm3. After packing, the samples were slowly saturated until a saturated equilibrium condition was obtained, as indicated by pressure readings from two transducers located at 2.5 and 12.5 cm from the bottom of the cores. Permeability values were obtained in triplicate using heads of 5, 10, and 15 cm. After the permeability measurements, a sintered metal plate with an entry pressure of 300 cm H2O was attached to the bottom of the core and the core was subsequently drained by applying increased air pressure at the top. Water pressures and displaced water were recorded as a function of time. After the highest pressure was obtained, the cores were dried to obtain the final water saturation. The saturation-capillary pressure data were then fitted to the van Genuchten (1980) retention relation using the RETC procedure (van Genuchten et al. 1991).
Figure 1. Experimental apparatus used to determine hydraulic properties.
3.3 Numerical Simulation Study
Numerical modeling was used as an evaluation tool for scale-up, including simulations to assess the impact of heterogeneities and treatment system configuration on pore-water extraction performance for targeted field applications. These numerical simulations and sediment property data also provide information needed to design subsequent laboratory flow cell investigations by identifying the critical permeability contrasts, screen materials, and operating conditions that are appropriate for bench-scale testing. Results of the simulation effort and porous media property data can be also used to address identified scale-up factors for the technology and as input to the test design.
Simulations included three-dimensional configurations with appropriate variations in porous media properties and heterogeneities and with imposed vacuum/pressure conditions at selected scenarios. These simulations evaluated overall extraction performance in terms of water removal rate, water removal extent

9
(i.e., percent of initial moisture content), and lateral influence as a function of time. Simulations were conducted using an approach similar to that applied for previous pore-water extraction efforts (Oostrom et al. 2011).
The vacuum-induced, pore-water extraction simulations were conducted with the water-air-energy mode of the Subsurface Transport Over Multiple Phases (STOMP) simulator (White and Oostrom 2006). This fully implicit integrated finite difference mode of the simulator has been used to simulate a variety of water-air systems (e.g., Oostrom et al. 2009). For the simulations, constant temperature boundary conditions (20°C) were assumed. The applicable governing equations (1 through 5) are the component mass-conservation equations for water and air:
[ ] wwlll
wlD mFsn
t+−∇=ρω
∂∂ (1)
( ) { } a
gl
aa
gl
aD mJFsn
t+∇+∇−=
== ,, γ
γγγ
γγγ ρω∂∂
(2)
where
( )gzPkk
F rlw
wγγ
γ
γγγ ρ
μρω
+∇−= for γ = l, g, (3)
( )gzPkk
F ra
aγγ
γ
γγγγ ρ
μρω
+∇−= for γ = l, g (4)
aaa
Da D
M
MsnJ γγ
γγγγγ χρτ ∇−= for γ = l, g (5)
The subscripts l, and g denote aqueous and gas phases, respectively; the superscripts w and a denote water and air components, respectively; t is time (s), nD is the diffusive porosity, nT is the total porosity, ω is the component mass fraction, ρ is the density (kg/m3), s is the actual liquid saturation (m3
liquid/m3
pore space), V is the volumetric flux (m/s), J is the diffusive-dispersive mass flux vector (kg/m2s), m is the component mass source rate (kg/m3s), k is the intrinsic permeability (m2), krγ is the relative permeability of phase γ, µ is the viscosity (Pa s), P is the pressure (Pa), gz is the gravitational vector (m/s2), τ is the tortuosity, M is the molecular weight (kg/mole), D is the diffusive-dispersive tensor (m2/s),
and χ is the component mole fraction. The governing partial differential equations (Equations 1 and 2) are discretized with the integrated-volume finite difference method by integrating over a control volume. Using Euler backward time differencing, yielding a fully implicit scheme, a series of nonlinear algebraic expressions are derived. The algebraic forms of the nonlinear governing equations are solved with a multivariable, residual-based Newton-Raphson iterative technique, where the Jacobian coefficient matrix is composed of the partial derivatives of the governing equations with respect to the primary variables.
Assuming the aqueous phase never disappears, the primary variable for the water equation is always the aqueous pressure. For the air equation, the primary variable is Pa. The algebraic expressions are evaluated using upwind interfacial averaging for fluid density, mass fractions, and relative permeability.

10
Specified weights (i.e., arithmetic, harmonic, geometric, upwind) are applied to the remaining terms of the flux equations. For the simulations described in this report, harmonic averages were used and the maximum number of Newton-Raphson iterations was eight, with a convergence factor of 10-6.
Secondary variables, those parameters not directly computed from the solution of the governing equations, are computed from the primary variable set through the constitutive relations. In this section, only the relations between relative permeability, fluid saturation (m3
liquid/m3
pore space), and capillary pressure (k-S-P) pertinent to the conducted simulations are described. The k-S-P relations consist of the van Genuchten (1980) S-P relations in combination with the k-S relations derived from the Mualem (1976) model. The k-S-P relations distinguish between actual and effective saturations. Actual saturations are defined as the ratio of fluid volume to diffusive pore volume. Effective saturations represent normalized actual saturations based on the pore volumes above the irreducible or minimum saturation of the wetting fluid (i.e., aqueous phase liquid).
Simulations modeling the wicking by SAP simulations were conducted with the STOMP-W mode. In that mode, only the water conservation equation (Equation 1) is used and the gas phase is assumed to be at constant pressure.
The computational domain for both sets of simulations is the same and is shown in Figure 2. The two-dimensional cylindrical domain (45 degrees) extends from the surface to the water table and consists of five layers (H1, H2, CCUz, CCUc, and Ringold, as indicated in cross section C-C' on Figure 9). The hydraulic sediment properties used in the simulations are listed in Table 12 in Section 6.0. The well diameter was assumed to be 5.08 cm (2 in.). The domain was discretized in 10- × 10-cm grid cells in the x and z direction except for the first meter adjacent to the west boundary (x = 0), where the cells were 2.5 × 2.5 cm. The simulations consisted of two parts. In the first part, a steady-state system with a constant recharge rate was established. In the second part, either 1) vacuum-induced pore-water extraction at 200 or 300 cm H2O of suction, or 2) soil wicking with suctions of 400 and 600 cm H2O was imposed. Water was allowed to flow through the east boundary (x = 40 m). The duration of the extraction simulations was 1 year.
The following three scenarios were evaluated for both water removal methods:
1. Extraction from the full CCUz layer (10 m)
2. Extraction from the middle 5 m of the CCUz unit
3. Extraction from the lowest 5 m of the H2 unit.

11
Figure 2. Computational domain for wicking and vacuum-induced pore-water extraction simulations.
3.4 Flow Cell Development
A flow cell was designed to support future experiments that will be conducted to test pore-water extraction performance and evaluate the field-test design configuration (well construction and operating conditions) under controlled conditions. The flow cell was configured to enable evaluation of well screen design and well filter-pack materials, two key factors in pore-water extraction performance. In addition, the flow cell scale is sufficient to examine the impact of expected porous media heterogeneity. In conjunction with the results reported herein, these future laboratory flow cell test data and refined simulations will be used to describe the test design elements and estimate performance under the expected SX Tanks Farm conditions (e.g., subsurface properties, heterogeneities, and moisture conditions). Flow cell design specifications are provided in the Appendix.


13
4.0 SX Tank Farm Conceptual Model for Pore-Water Extraction
Conceptual interpretations of the lithostratigraphy and hydrogeologic properties beneath the SX Tank Farm were developed. Of primary interest were the fine-grained sediments of the Hanford formation H2 unit and the CCUz beneath and adjacent to the 241-SX-108 Tank. The objective was to produce a one-dimensional lithostratigraphic column representative of the thicknesses, physical properties, and sequence of lithostratigraphic units beneath a potential pore-water extraction target area for incorporation into numerical simulations.
4.1 Target Area
The first objective was to define a potential target area for pore-water extraction. This target area was then used to determine the available geologic, geophysical, and laboratory data most representative of the area for a potential pore-water extraction system.
4.1.1 Plume Distribution
Levitt and Henderson (2009) presented surface-to-surface electrical resistivity data collected to identify low resistivity response for evaluation as potential areas of contamination in the SX Tank Farm area. They presented a comparison between the 0.8-log ohm-meter contour lines from their modeling results at various depths beneath the SX Tank Farm. Levitt and Henderson (2009) state that “These contours do not represent the interpreted boundary of possible subsurface contamination or increased soil moisture.” However, they selected this contour to represent the high gradient between highly conductive and moderately conductive responses, with the values below 0.8 log ohm-meters the most likely to provide the highest confidence in locating increased soil moisture and electrolyte concentrations. Thus, the 0.8-log ohm-meter contour was used in this work to infer a target area for compiling representative data for use in evaluating a pore-water extraction system.
Figure 3 and Figure 4 illustrate the plan and cross-sectional view (respectively) of the highly conductive area represented by the 0.8-log ohm-meter contours of Levitt and Henderson (2009). Based on this information, a square area defined by the center of tanks SX-104, SX-106, SX-110, and SX-112 (see Figure 3) was selected for evaluation. Predicted success of pore-water extraction technology is dependent, in part, on the matric suction properties of the host sediments, and may be negatively affected by preferential gas flow in relatively dry coarse-grained high-permeability sediments (Oostrom et al. 2011). Thus, the evaluation area was further defined to focus on the finer-grained lithostratigraphic units, the Hanford formation H2 unit and CCUz, located at depths between 70 to 160 ft beneath the SX-108 Tank (see Figure 4).

14
Figure 3. Area most likely indicative of soil moisture and electrolyte concentrations (after Levitt and Henderson 2009).
15
Figure 4. Cross-sectional view of below the 0.8-log ohm-meter contour area that is most likely indicative of soil moisture and electrolyte concentrations (highlighted in pink), modified after Serne et al. (2002a).
4.1.2 Moisture and Tc-99 Targets
Moisture and Tc-99 concentration data from four boreholes (299-W23-234, C3082, and dual boreholes C7185/C7186; highlighted in red in Figure 4) were used to select potential pore-water extraction target horizons within the main target area. For example, Figure 5 and Figure 6 illustrate moisture and Tc-99 concentrations data from Serne et al. 2002a (borehole 299-W23-234) and Serne et al. 2002b (241-SX-108 slant borehole C3082). These figures illustrate that the highest Tc-99 concentrations are located at depths between 80 and 140 ft, with the Hanford formation H2 unit and the Cold Creek Unit. This information substantiated the focus on these finer-grained lithostratigraphic units as target horizons for potential pore-water extraction.

16
Figure 5. Moisture content and Tc-99 (99Tc) distribution for borehole 299-W23-234 (after Serne et al. 2002a).
Composite Depth (ft bgs)
1:1 Extract ID TC-99 (pCi/L)
90 06A/B 2.70 E+6
6 UFA 2.48 E+7
95.5 03A/B/C 7.10 E+6
102.5 05A/B/C 6.10 E+6
108.5 04A/B/C 1.20 E+7
4 UFA 9.40 E+7
112 02B/C 8.60 E+6
2 UFA 1.23 E+8
127.4 01A/B/C 3.30 E+5

17
Figure 6. Moisture content and Tc-99 (99Tc) distribution for the 241-SX-108 slant borehole (after Serne et al. 2002b).
18
4.2 Data Compilation
A review of available geologic, hydrologic, and geochemical data identified 35 wells and borings within the study area, only 19 of which extended deeper than 75 ft. The data of most interest were lithologic, physical, and hydrologic properties (particularly particle size and moisture content), and geophysical log data (primarily neutron-neutron moisture logs). A number of these wells (11) had lithologic contact information and/or particle-size data. The wells/borings with the most complete data sets include boreholes 299-W23-234, C3082 (the SX-108 slant hole), and the paired direct push borings of C7185 and C7186.
The primary data sets for borehole 299-W23-234 were taken from Serne et al. (2002a). Data sets for boring C3082 were taken from Serne et al. (2002b), and those from the direct push borings (C7185 and C7186) were taken from Steffer (2009) and Ritenour (2012). Historic particle-size and calcium carbonate content data for 20 wells in the study area were exported from the Hanford Virtual Library’s ROCSAN module (http://vlprod.rl.gov/vlib/app/index.cfm). Geologic contact data were extracted from the latest version of the geologic contacts database (in the file GSatTOD-GeoContacts-GeoElev DB 2010-12-31.xls).1 Additional lithostratigraphic information was also derived from visual inspection/analysis of maps and cross sections by Price and Fecht (1976).
4.3 Conceptual Model Development
A lithostratigraphic column was developed to represent the thickness and sequence of discrete lithofacies for which physical and hydrologic properties could be defined. Borehole 299-W23-234 provided the best data set (Serne et al. 2002a) for development of this conceptual model. Besides backfill, Serne et al. (2002a) identified three primary lithostratigraphic units within the Hanford formation (H1a, H1, and H2) and two units (CCUf[lam-msv] and CCUc-f[calc]) associated with Plio-Pleistocene age deposits, which are now referred to as the Cold Creek Unit (DOE/RL 2002). Based on the geologic descriptions, particle-size data, gravimetric moisture content data, and neutron moisture log data, the lithostratigraphic units were further divided into discrete lithofacies containing similar physical properties and hydrologic conditions.
The particle-size data used to identify discrete lithofacies within each lithostratigraphic unit (and indicating the variability within those lithofacies) were taken from the ROCSAN database for wells within the study area. This consisted of 97 samples (between the depths of 70 to 160 ft) from 20 wells. Lithostratigraphic units were assigned to each of these sample depths from the geologic contacts database (where available), supplemented with lithostratigraphic data derived from Price and Fecht (1976). Discrete lithofacies were then defined for each lithostratigraphic unit. Neither backfill nor the Hanford H1a unit were identified below 70 ft, and three of the ROCSAN samples were found to have incomplete particle-size data and/or represented a mixture of more than one lithofacies and were excluded from further analysis. Table 2 illustrates the various lithofacies identified within each lithostratigraphic unit. A summary of the lithofacies and their physical properties selected for inclusion in the conceptual model for borehole 299-W23-234 are provided in Table 2.
1 Williams BA. 2011. E-mail to BA Williams (CH2M HILL Plateau Remediation Company) from GV Last (Pacific Northwest National Laboratory), “Request - Copy Of Geologic Contacts Dataset for 1/10/11,” January 20, 2011, Richland, Washington.

19
Table 2. Description of the lithofacies defined for each lithostratigraphic unit.
Lithostratigraphic Unit Lithofacies Code Lithofacies Description
Number of ROCSAN Samples
Number of Serne et al.
(2002a) Samples
Represented in Borehole
299-W23-234 Conceptual
Model?
Hanford formation, H1 unit
H1-sG Sandy GRAVEL 3 None No
H1-g[vc-c]S Gravelly very coarse to
coarse SAND 13 1 Yes
H1-(g)[vc-c]S Slightly gravelly very
coarse to coarse SAND 2 None No
H1-mg[f-vf]S Muddy gravelly fine to
very fine SAND 2 1 Yes
Hanford formation, H2 unit
H2-(g)m[f-vf]S Slightly gravelly, muddy, fine to very fine SAND
7 None No
H2–[m-vf]S Medium to very fine
SAND 8 None No
H2-(m)[m-vf]S Slightly muddy medium to
very fine SAND 27 None Yes
H2-m[f-vf]S Muddy fine to very fine
SAND 25 2 Yes
Cold Creek Unit silt (fine-grained, laminated to
massive)
CCUz-m[vf]S Muddy very fine SAND 4 3 Yes
CCUz-sM Sandy MUD 3 a 1 Yes
CCUz-sG Sandy GRAVEL to muddy gravelly fine
SAND None 1 Yes
Cold Creek Unit caliche (fine to coarse-grained,
calcium carbonate cemented)
CCUcal-m[vf]S to sM Muddy very fine SAND to
sandy MUD 4 b None No
CCUcal-(m)[m]S Slightly muddy medium
SAND 4 b None No
CCUcal-g[c-m]S to msG Gravelly coarse to
medium SAND to muddy, sandy GRAVEL
3 b 4 Yes
(a) ROCSAN classifies these samples as muddy gravelly SAND to muddy sandy GRAVEL. However, the bi-modal distribution and drill log descriptions suggests that the gravel fraction of these samples was actually composed of silt/clay aggregates.
(b) Taken from an expanded search of the ROCSAN database extending out 150 m from the SX-108 Tank.
4.3.1 Hanford Formation, H1 Unit
Twenty of the 97 samples in the ROCSAN database were identified as being from the Hanford formation H1 unit. Based on their particle-size distributions, the 20 samples were classified into 7 Folk-Wentworth lithologic classes. However, because there is some uncertainty about how representative these samples are of the actual formation (due to drilling and sampling methodologies) and to reduce the number of discrete lithofacies to a manageable number for each lithostratigraphic unit, the seven lithologic classes were binned into four discrete lithofacies (Table 2).
Serne et al. (2002a) reported geologic descriptions for five sidewall core samples from the H1 unit (only three of which were below a depth of 70 ft), including particle-size data for two of those samples.
20
The particle-size data were generated using slightly different grain-size divisions for fine sand, very fine sand, and mud (silt+clay), so they could not be directly integrated with the ROCSAN data. Based on the data from Serne et al. (2002a), only two of the four lithofacies identified for the H1 unit (Table 2) were deemed appropriate for inclusion in the conceptual model. The included lithofacies are the gravelly, very coarse to coarse sand (g[vc-c]S) and the silty-gravelly, fine to very fine sand (mg[f-fv]S). Serne et al. (2002a) also reported moisture content data for the three sidewall cores in H1 that were collected at depths below 70 ft bgs.
Table 3 lists averages of the particle-size data from the ROCSAN database for the two main lithofacies considered as representative of the H1 unit in the borehole 299-W23-234 conceptual model. This table also provides an estimate of the moisture content for these lithofacies based on data from Serne et al. (2002a).
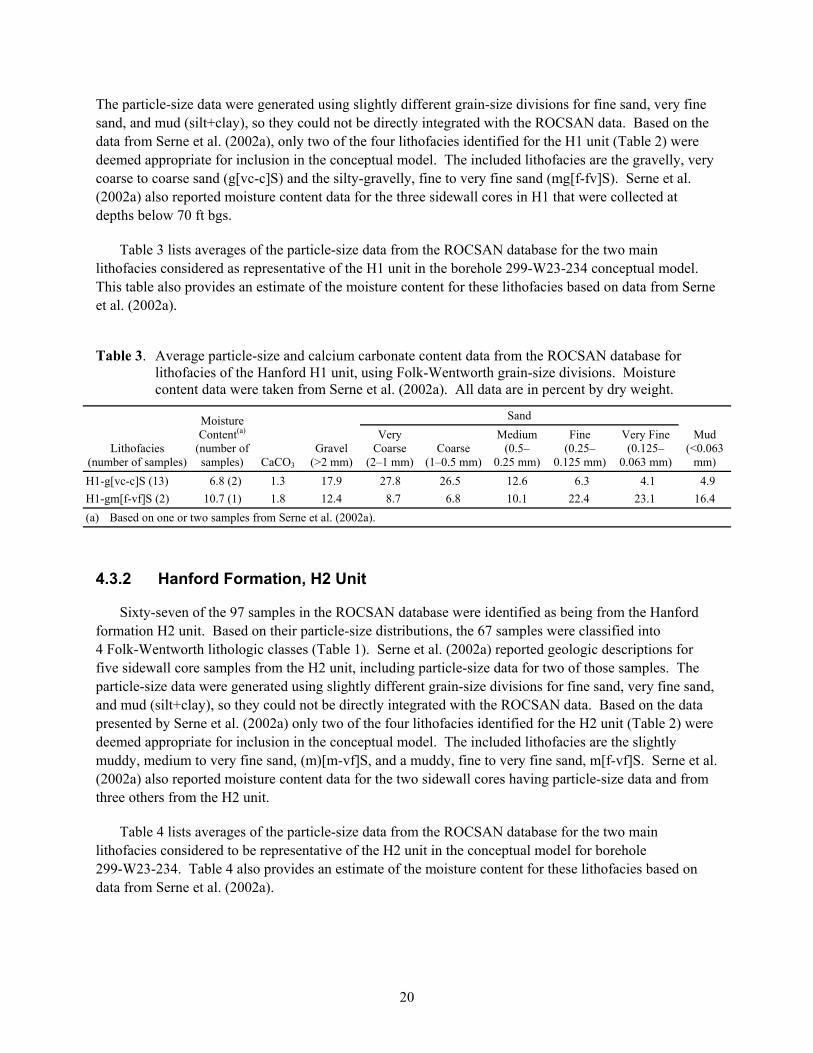
Table 3. Average particle-size and calcium carbonate content data from the ROCSAN database for lithofacies of the Hanford H1 unit, using Folk-Wentworth grain-size divisions. Moisture content data were taken from Serne et al. (2002a). All data are in percent by dry weight.
Lithofacies (number of samples)
Moisture Content(a)
(number of samples) CaCO3
Gravel (>2 mm)
Sand
Mud (<0.063
mm)
Very Coarse
(2–1 mm) Coarse
(1–0.5 mm)
Medium (0.5–
0.25 mm)
Fine (0.25–
0.125 mm)
Very Fine (0.125–
0.063 mm)
H1-g[vc-c]S (13) 6.8 (2) 1.3 17.9 27.8 26.5 12.6 6.3 4.1 4.9
H1-gm[f-vf]S (2) 10.7 (1) 1.8 12.4 8.7 6.8 10.1 22.4 23.1 16.4
(a) Based on one or two samples from Serne et al. (2002a).
4.3.2 Hanford Formation, H2 Unit
Sixty-seven of the 97 samples in the ROCSAN database were identified as being from the Hanford formation H2 unit. Based on their particle-size distributions, the 67 samples were classified into 4 Folk-Wentworth lithologic classes (Table 1). Serne et al. (2002a) reported geologic descriptions for five sidewall core samples from the H2 unit, including particle-size data for two of those samples. The particle-size data were generated using slightly different grain-size divisions for fine sand, very fine sand, and mud (silt+clay), so they could not be directly integrated with the ROCSAN data. Based on the data presented by Serne et al. (2002a) only two of the four lithofacies identified for the H2 unit (Table 2) were deemed appropriate for inclusion in the conceptual model. The included lithofacies are the slightly muddy, medium to very fine sand, (m)[m-vf]S, and a muddy, fine to very fine sand, m[f-vf]S. Serne et al. (2002a) also reported moisture content data for the two sidewall cores having particle-size data and from three others from the H2 unit.
Table 4 lists averages of the particle-size data from the ROCSAN database for the two main lithofacies considered to be representative of the H2 unit in the conceptual model for borehole 299-W23-234. Table 4 also provides an estimate of the moisture content for these lithofacies based on data from Serne et al. (2002a).

21
Table 4. Average particle-size and calcium carbonate content data for lithofacies of the Hanford H2 unit from the ROCSAN database using Folk-Wentworth grain-size divisions. Moisture content data were taken from Serne et al. (2002a). All data are in percent by dry weight.
Lithofacies (number of samples)
Moisture Content(a)
(number of samples) CaCO3
Gravel (>2 mm)
Sand
Mud (<0.063
mm)
Very Coarse
(2–1 mm) Coarse
(1–0.5 mm)
Medium (0.5–
0.25 mm)
Fine (0.25– 0.125 mm)
Very Fine (0.125–
0.063 mm)
H2-(m)[m-vf]S (27) 10.2 (4) 1.7 0.2 1.5 5.3 21.6 31.6 24.0 15.9
H1-m[f-vf]S (25) 7.8 (1)(b) 1.6 0.3 1.5 3.4 12.5 26.2 31.1 24.9
(a) Based on (limited number) of sidewall core data from Serne et al. (2002a). (b) Note that the neutron-neutron moisture logs indicate higher moisture content in this lithofacies than in the one above it.
4.3.3 Cold Creek Unit Silt
The CCUz is a shorthand term for the Cold Creek Unit, fine-grained, laminated to massive [CCUf(lam-msv)] lithofacies of DOE-RL (2002). Only 7 of the 97 samples in the ROCSAN database were identified as being from the CCUz. Based on their particle-size distributions, the seven samples were classified into four Folk-Wentworth lithologic classes. However, comparison of the particle-size data to geologic descriptions in the driller’s logs, and the bi-modal nature of the particle-size distributions, suggests that the gravel fraction measured in these samples most likely consisted of silt and clay aggregates. Thus, the seven samples were categorized into two lithofacies: a muddy, very fine sand and a sandy mud (Table 2).
Serne et al. (2002a) reported geologic descriptions for 50 sidewall and split-spoon core samples from the CCUz unit, with particle-size data for five of those samples. The particle-size data were generated using slightly different grain-size divisions for fine sand, very fine sand, and mud (silt+clay) and thus could not be directly integrated with the ROCSAN data. Based on the data presented by Serne et al. (2002a), a third lithofacies (sandy gravel to muddy gravelly fine sand, sG-mg[f]S) was identified for the CCUz unit, bringing the total number of lithofacies selected for the conceptual model to three (Table 2). Serne et al. (2002a) reported moisture content data for 1 sidewall core and 38 split-spoon core samples and matric suction data (using the filter paper method) for 12 samples from the CCUz.
Table 5 lists averages of the particle-size data from the ROCSAN database for the two main lithofacies considered to be representative of the CCUz in borehole 299-W23-234. Table 6 lists averages of the particle-size data from Serne et al. (2002a) for all three lithofacies considered to be representative of the CCUz in borehole 299-W23-234. Table 6 also provides an estimate of the moisture content for these lithofacies based on those reported by Serne et al. (2002a).

22
Table 5. Average particle-size and calcium carbonate content data for CCUz lithofacies taken from the ROCSAN database using Folk-Wentworth grain-size divisions. All data are in percent by dry weight.
Lithofacies (number of samples)
Moisture Content(a) CaCO3
Gravel (>2 mm)
Sand
Mud (<0.063
mm)
Very Coarse
(2–1 mm) Coarse
(1–0.5 mm)
Medium (0.5–
0.25 mm)
Fine (0.25–
0.125 mm)
Very Fine (0.125–
0.063 mm)
CCUz-m[vf]S (4) NA NA 2.5 10.0 7.3 7.1 11.2 25.8 36.1
CCUz-sM (3) NA NA 27.3(b) 8.7 4.9 5.2 9.3 21.5 23.2(b)
(a) Based on sidewall and split-spoon core sample data from Serne et al. (2002a). (b) The gravel fractions are estimated to consist of aggregates of silt and clay, based on drill log descriptions and the bi-modal
nature of the particle-size data. NA = Not available.
Table 6. Average particle-size, moisture content, and matric suction data for Cold Creek Unit CCUz lithofacies taken from Serne et al. (2002a) using modified Folk-Wentworth grain-size divisions. All data are in percent by dry weight.
Lithofacies (number of samples)
Moisture Content(a) (number
of samples)
Matric Suction (m) (range, number of samples)
Gravel (>2 mm)
Sand
Mud (<0.053
mm)
Very Coarse (2–1 mm)
Coarse (1–
0.5 mm)
Medium (0.5–
0.25 mm)
Fine (0.25–
0.106 mm)(b)
Very Fine (0.106–
0.053 mm)(b)
CCUz-m[vf]S (3) 10.0 (14) 9.5 (3.9-15.0, 3)
0.9 1.5 2.0 1.1 10.2 32.4 52.0
CCUz-sM (1) 15.8 (22) 10.1 (2-26.8, 9)
0.12 0.08 0.35 0.81 5.44 13.4 79.8
CCUz-sG-mg]f]S (1) 5.7 (2) NA 13.5 6.5 6.69 9.54 20.7 9.5 33.6
(a) Based on sidewall and split-spoon core data from Serne et al. (2002a). (b) Note that the grain-size divisions for fine sand, very fine sand, and mud (silt + clay) differ from those reported in the ROCSAN
database. NA = Not available.
4.3.4 Cold Creek Unit Caliche
The CCUcal is a shorthand term for the Cold Creek Unit, fine- to coarse-grained, calcium carbonate cemented lithofacies as described in DOE-RL (2002). There were no reliable ROCSAN data identified as being from the CCUcal within the study area, and none of the samples reported by Serne et al. (2002a) from this unit were analyzed for particle-size data. Serne et al. (2002a) did report geologic descriptions for four split-spoon core samples from the CCUcal unit with moisture content data from two of those samples.
An expanded search of the ROCSAN database (extending out 150 m from the SX-108 Tank) found particle-size data for 11 samples from 6 wells with geologic contact data indicating they were representative of the CCUcal lithostratigraphic unit. These data were grouped into three lithofacies. Table 7 lists average particle-size distribution for the lithofacies considered to be representative of the CCUcal in borehole 299-W23-234. Moisture content data were taken from Serne et al. (2002a).
23
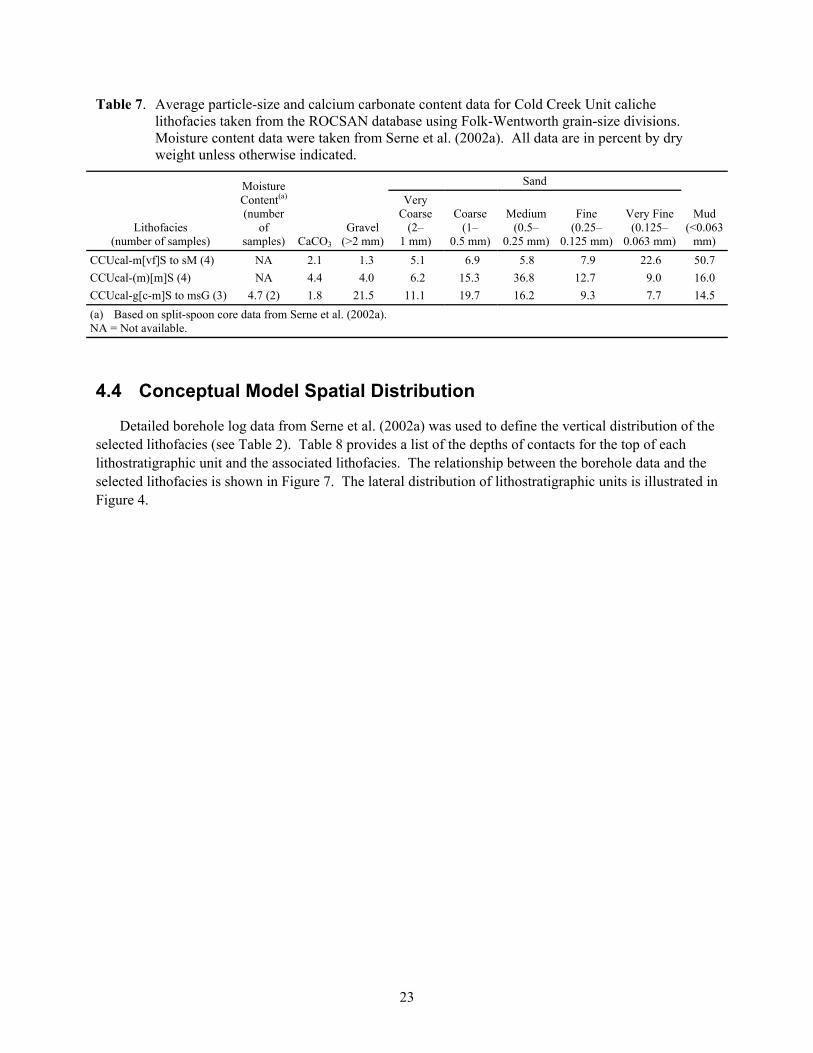
Table 7. Average particle-size and calcium carbonate content data for Cold Creek Unit caliche lithofacies taken from the ROCSAN database using Folk-Wentworth grain-size divisions. Moisture content data were taken from Serne et al. (2002a). All data are in percent by dry weight unless otherwise indicated.
Lithofacies (number of samples)
Moisture Content(a) (number
of samples) CaCO3
Gravel (>2 mm)
Sand
Mud (<0.063
mm)
Very Coarse
(2– 1 mm)
Coarse (1–
0.5 mm)
Medium (0.5–
0.25 mm)
Fine (0.25–
0.125 mm)
Very Fine (0.125–
0.063 mm)
CCUcal-m[vf]S to sM (4) NA 2.1 1.3 5.1 6.9 5.8 7.9 22.6 50.7
CCUcal-(m)[m]S (4) NA 4.4 4.0 6.2 15.3 36.8 12.7 9.0 16.0
CCUcal-g[c-m]S to msG (3) 4.7 (2) 1.8 21.5 11.1 19.7 16.2 9.3 7.7 14.5
(a) Based on split-spoon core data from Serne et al. (2002a). NA = Not available.
4.4 Conceptual Model Spatial Distribution
Detailed borehole log data from Serne et al. (2002a) was used to define the vertical distribution of the selected lithofacies (see Table 2). Table 8 provides a list of the depths of contacts for the top of each lithostratigraphic unit and the associated lithofacies. The relationship between the borehole data and the selected lithofacies is shown in Figure 7. The lateral distribution of lithostratigraphic units is illustrated in Figure 4.

24
Table 8. Depths for the contact at the top of lithofacies penetrated by borehole 299-W23-234, modified from Serne et al. (2002a).
Top of Interval (depth in ft) Lithostratigraphic Unit Lithofacies Code (see Table 1)
70.0 H1 g[vc-c]S
79.0 H1 gm[f-vf]S
82.0 H1 g[vc-c]S
85.0 H2 m[f-vf]S
89.0 H2 (m)[m-vf]S
93.0 H2 m[f-vf]S
96.0 H2 (m)[m-vf]S
118.0 H2 m[f-vf]S
120.0 H2 (m)[m-vf]S
125.0 CCUz sM
131.2 CCUz m[vf]S
133.9 CCUz sM
134.1 CCUz m[vf]S
134.7 CCUz sM
135.0 CCUz m[vf]S
135.4 CCUz sM
136.4 CCUz m[vf]S
138.3 CCUz sM
139.9 CCUz m[vf]S
140.2 CCUz sM
140.6 CCUz m[vf]S
142.0 CCUz sM
145.0 CCUz m[vf]S
145.4 CCUz sM
147.6 CCUz m[vf]S
150.9 CCUz sM
155.1 CCUz m[vf]S
156.1 CCUz sG - mg[f]S
156.9 CCUz sM
157.5 CCUc msG

25
Figure 7. Composite borehole log for borehole 299-W23-234 showing the vertical distribution of lithofacies selected for the conceptual model to support SX Tank Farm pore-water extraction modeling. Volumetric moisture content (m3
water/m3
total) is shown.
26
4.5 Correlation to Potential Test Site
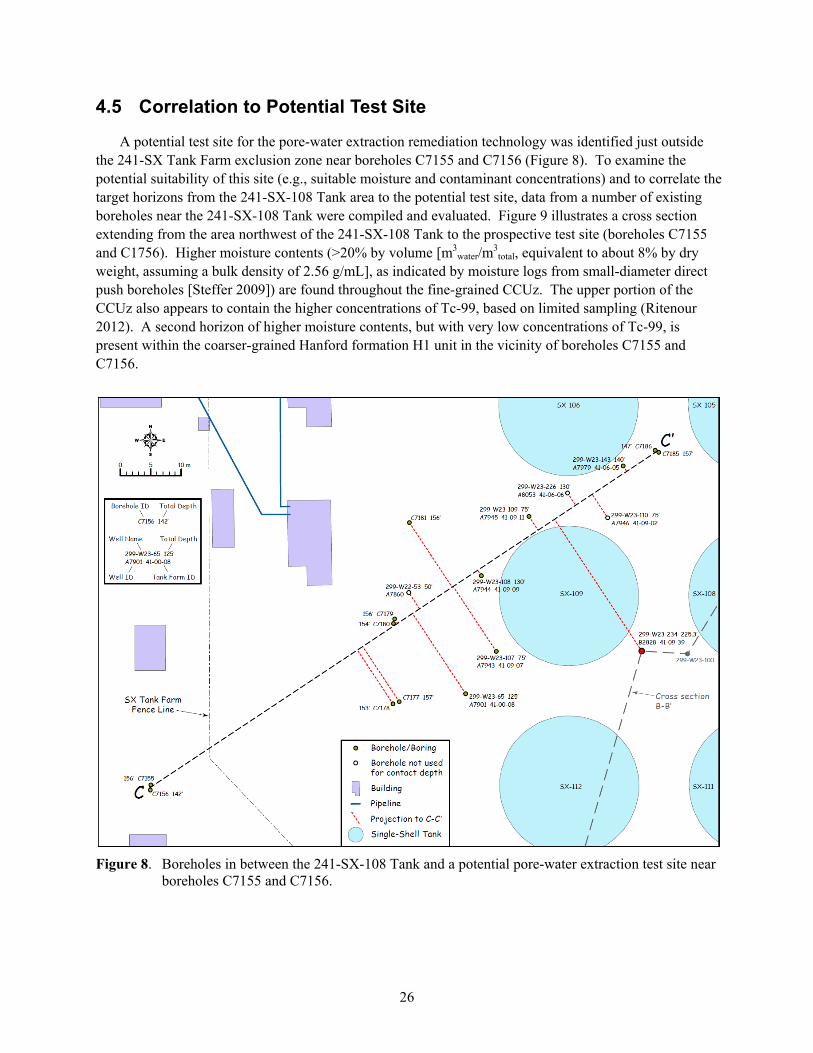
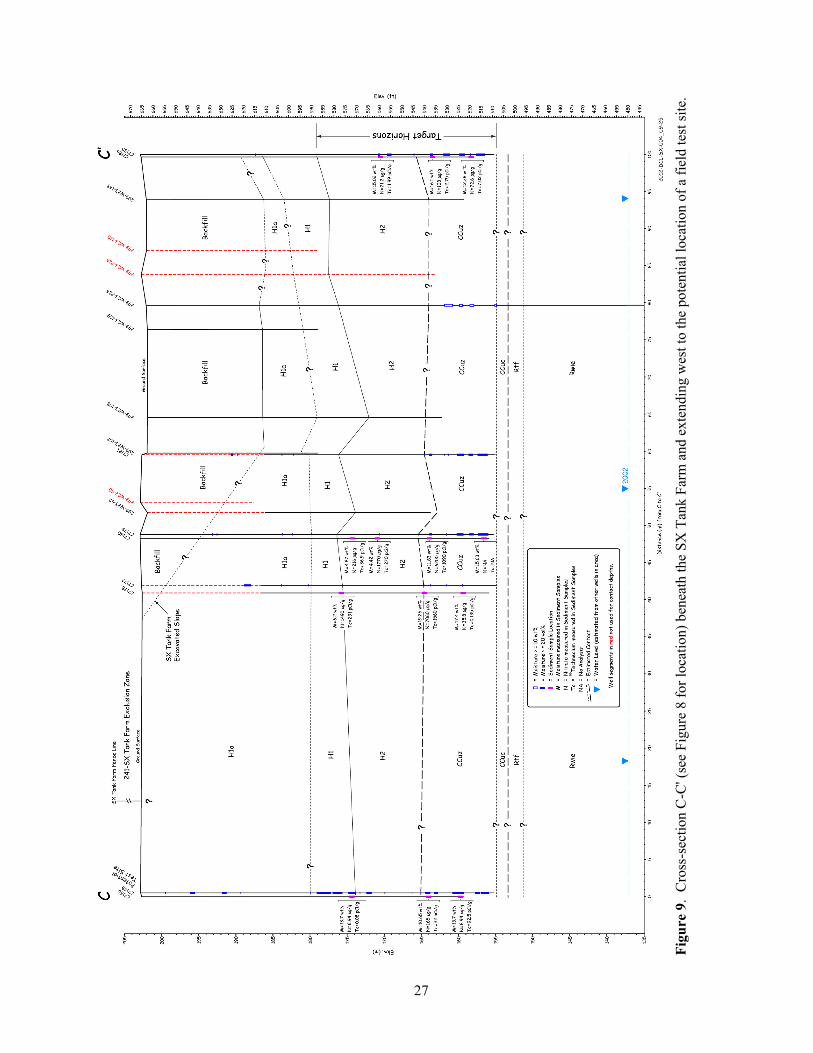
A potential test site for the pore-water extraction remediation technology was identified just outside the 241-SX Tank Farm exclusion zone near boreholes C7155 and C7156 (Figure 8). To examine the potential suitability of this site (e.g., suitable moisture and contaminant concentrations) and to correlate the target horizons from the 241-SX-108 Tank area to the potential test site, data from a number of existing boreholes near the 241-SX-108 Tank were compiled and evaluated. Figure 9 illustrates a cross section extending from the area northwest of the 241-SX-108 Tank to the prospective test site (boreholes C7155 and C1756). Higher moisture contents (>20% by volume [m3
water/m3
total, equivalent to about 8% by dry weight, assuming a bulk density of 2.56 g/mL], as indicated by moisture logs from small-diameter direct push boreholes [Steffer 2009]) are found throughout the fine-grained CCUz. The upper portion of the CCUz also appears to contain the higher concentrations of Tc-99, based on limited sampling (Ritenour 2012). A second horizon of higher moisture contents, but with very low concentrations of Tc-99, is present within the coarser-grained Hanford formation H1 unit in the vicinity of boreholes C7155 and C7156.
Figure 8. Boreholes in between the 241-SX-108 Tank and a potential pore-water extraction test site near boreholes C7155 and C7156.
27
Fig
ure
9.
Cro
ss-s
ecti
on C
-C' (
see
Fig
ure
8 fo
r lo
cati
on)
bene
ath
the
SX
Tan
k F
arm
and
ext
endi
ng w
est t
o th
e po
tent
ial l
ocat
ion
of a
fie
ld te
st s
ite.


29
5.0 Sediment Property Testing
Sediment hydraulic properties were determined for the four primary sediment types identified in the H2 unit and CCUz target zones. The two mixtures for the H2 unit and CCUz layers have particle-size distributions consistent with the H2 unit and CCUz lithofacies in Table 4 and Table 5, respectively. The hydraulic parameter values are listed in Table 9 and the water-retention curves are shown in Figure 10. For comparison purposes, the statistical mean values for the H2 and CCUz units for 200 West Area samples provided by Last et al. (2006) have also been included in Table 9.
Table 9. Hydraulic properties of the four tested sediment mixtures and the statistical mean values provided by Last et al. (2006).
Sediment Mixture Van Genuchten α
(1/cm) Van Genuchten n
Residual Saturation(m3
liquid/ m3
pore space)
Hydraulic Conductivity
(cm/s) Porosity
(–)
A: H2-m[f-vf]S 8.26e-3 2.325 0.124 7.92e-4 0.406
B: H2-(m)[m-vf]S 7.47e-3 2.419 0.118 8.45e-4 0.379
C: CCU-sM 6.58e-3 2.206 0.087 1.38e-3 0.404
D: CCU-m[vf]S 6.02e-3 2.137 0.085 1.19e-3 0.373
Soil Class (Last et al. 2006)
Van Genuchten α (1/cm) Van Genuchten n
Residual Saturation(m3
liquid/ m3
pore space)
Hydraulic Conductivity
(cm/s) Porosity
(–)
H2 (Hss_2W) 4.53e-3 2.116 0.141 1.91e-5 0.398
CCUz (PPLz) 5.57e-3 2.101 0.080 5.57e-5 0.420
Figure 10. Experimentally determined water-retention relations for the four tested samples listed in Table 9.

30
The results indicate that the differences between the two H2 units as well as between the two CCUz laboratory samples are relatively small for all hydraulic parameters. It is notable that the H2 unit mixtures are slightly less permeable than the CCUz samples, which is likely related to the amount of mud in the samples. The effect of the considerable amount of gravel in mixture D: CCU-m[vf]S on the hydraulic conductivity is remarkably small. Compared to the statistical mean values (Last et al. 2006), the laboratory-determined properties using the mixtures are similar, except for the hydraulic conductivity. The laboratory values for the hydraulic conductivity of the H2 unit and CCUz mixtures are approximately 40 and 20 times larger, respectively, than the Last et al. (2006) values. As is shown in Section 6.0, hydraulic conductivity differences of this magnitude have a large effect on water extraction rates.
Pore-water removal from each type of sediment can be evaluated as a function of applied suction and initial moisture content using the sediment hydraulic properties (pressure-saturation properties) determined above as an initial estimate of pore-water extraction capacity. This estimate does not consider rate of removal or impacts of surrounding sediments of different properties. However, the estimates can be used to establish target moisture contents for effective application of pore-water extraction using vacuum-induced or wicking designs. Table 10 shows the calculated moisture content reduction as a function of applied suction and initial moisture content for each of the tested sediment types. As shown by these calculations, the capacity for water removal by pore-water extraction increases with increased initial moisture content and applied suction for all sediments, but the effectiveness varies by sediment type. These calculations should be viewed as screening-level information because other factors such as the distribution of sediment types and moisture content, well design, distance from the extraction well, and operational approach will also impact the capacity for water removal.
Table 10. Calculated volumetric moisture content (VMC, m3water/m
3total) reduction as function of
sediment type, initial moisture content, and applied suction. A “–” indicates no water extraction is possible.
Sediment Initial VMC Applied Suction
(cm H2O) Maximum Decrease
in VMC
H2-m[f-vf]S 0.1 200 (vacuum) –
H2-m[f-vf]S 0.1 300 (vacuum) –
H2-m[f-vf]S 0.1 400 (wicking) –
H2-m[f-vf]S 0.1 600 (wicking) 0.008
H2-m[f-vf]S 0.15 200 (vacuum) –
H2-m[f-vf]S 0.15 300 (vacuum) –
H2-m[f-vf]S 0.15 400 (wicking) 0.029
H2-m[f-vf]S 0.15 600 (wicking) 0.058
H2-m[f-vf]S 0.2 200 (vacuum) –
H2-m[f-vf]S 0.2 300 (vacuum) 0.050
H2-m[f-vf]S 0.2 400 (wicking) 0.079
H2-m[f-vf]S 0.2 600 (wicking) 0.108
H2-m[f-vf]S 0.25 200 (vacuum) 0.043
H2-m[f-vf]S 0.25 300 (vacuum) 0.100
H2-m[f-vf]S 0.25 400 (wicking) 0.129
H2-m[f-vf]S 0.25 600 (wicking) 0.158

31
Table 10. (contd)
Sediment Initial VMC Applied Suction
(cm H2O) Maximum Decrease
in VMC
H2-m[f-vf]S 0.3 200 (vacuum) 0.093
H2-m[f-vf]S 0.3 300 (vacuum) 0.150
H2-m[f-vf]S 0.3 400 (wicking) 0.179
H2-m[f-vf]S 0.3 600 (wicking) 0.208
H2-(m)[m-vf]S 0.1 200 (vacuum) –
H2-(m)[m-vf]S 0.1 300 (vacuum) –
H2-(m)[m-vf]S 0.1 400 (wicking) –
H2-(m)[m-vf]S 0.1 600 (wicking) 0.016
H2-(m)[m-vf]S 0.15 200 (vacuum) –
H2-(m)[m-vf]S 0.15 300 (vacuum) 0.007
H2-(m)[m-vf]S 0.15 400 (wicking) 0.037
H2-(m)[m-vf]S 0.15 600 (wicking) 0.066
H2-(m)[m-vf]S 0.2 200 (vacuum) –
H2-(m)[m-vf]S 0.2 300 (vacuum) 0.057
H2-(m)[m-vf]S 0.2 400 (wicking) 0.087
H2-(m)[m-vf]S 0.2 600 (wicking) 0.116
H2-(m)[m-vf]S 0.25 200 (vacuum) 0.048
H2-(m)[m-vf]S 0.25 300 (vacuum) 0.107
H2-(m)[m-vf]S 0.25 400 (wicking) 0.137
H2-(m)[m-vf]S 0.25 600 (wicking) 0.166
H2-(m)[m-vf]S 0.3 200 (vacuum) 0.098
H2-(m)[m-vf]S 0.3 300 (vacuum) 0.157
H2-(m)[m-vf]S 0.3 400 (wicking) 0.187
H2-(m)[m-vf]S 0.3 600 (wicking) 0.216
CCU-sM 0.1 200 (vacuum) –
CCU-sM 0.1 300 (vacuum) –
CCU-sM 0.1 400 (wicking) –
CCU-sM 0.1 600 (wicking) –
CCU-sM 0.15 200 (vacuum) –
CCU-sM 0.15 300 (vacuum) –
CCU-sM 0.15 400 (wicking) 0.007
CCU-sM 0.15 600 (wicking) 0.046
CCU-sM 0.2 200 (vacuum) –
CCU-sM 0.2 300 (vacuum) 0.019
CCU-sM 0.2 400 (wicking) 0.057
CCU-sM 0.2 600 (wicking) 0.096
CCU-sM 0.25 200 (vacuum) 0.006
CCU-sM 0.25 300 (vacuum) 0.069
CCU-sM 0.25 400 (wicking) 0.107
CCU-sM 0.25 600 (wicking) 0.146
CCU-sM 0.3 200 (vacuum) 0.056

32
Table 10. (contd)
Sediment Initial VMC Applied Suction
(cm H2O) Maximum Decrease
in VMC
CCU-sM 0.3 300 (vacuum) 0.119
CCU-sM 0.3 400 (wicking) 0.157
CCU-sM 0.3 600 (wicking) 0.196
CCU-m[vf]S 0.1 200 (vacuum) –
CCU-m[vf]S 0.1 300 (vacuum) –
CCU-m[vf]S 0.1 400 (wicking) –
CCU-m[vf]S 0.1 600 (wicking) 0.001
CCU-m[vf]S 0.15 200 (vacuum) –
CCU-m[vf]S 0.15 300 (vacuum) –
CCU-m[vf]S 0.15 400 (wicking) 0.007
CCU-m[vf]S 0.15 600 (wicking) 0.051
CCU-m[vf]S 0.2 200 (vacuum) –
CCU-m[vf]S 0.2 300 (vacuum) 0.022
CCU-m[vf]S 0.2 400 (wicking) 0.057
CCU-m[vf]S 0.2 600 (wicking) 0.101
CCU-m[vf]S 0.25 200 (vacuum) 0.013
CCU-m[vf]S 0.25 300 (vacuum) 0.072
CCU-m[vf]S 0.25 400 (wicking) 0.107
CCU-m[vf]S 0.25 600 (wicking) 0.151
CCU-m[vf]S 0.3 200 (vacuum) 0.063
CCU-m[vf]S 0.3 300 (vacuum) 0.122
CCU-m[vf]S 0.3 400 (wicking) 0.157
CCU-m[vf]S 0.3 600 (wicking) 0.201
VMC = volumetric moisture content.

33
6.0 Numerical Simulation Results
An overview of the simulations conducted is presented in Table 11. In Base Cases A, B, and C, water was extracted over the entire vertical thickness of the CCUz, over the lower 5 m of the H2 unit, and over the middle part of the CCUz, respectively. The hydraulic properties for the base case simulations are listed in Table 12. A limited sensitivity analysis was completed for hydraulic conductivity (Table 11).
Table 11. Overview of the conducted simulations. For all simulations, vacuums of 200 or 300 cm H2O were imposed to simulate vacuum-induced pore-water extraction. Water suctions of 400 or 600 cm H2O were imposed to simulate wicking with absorbent polymers.
Simulation Name Extraction Location Hydraulic Properties
Base Case A Full CCUz thickness (10 m) Table 12
Base Case B Lowest 5 m of H2 Table 12
Base Case C Middle 5 m of CCUz Table 12
Case A – Ksat/10 Full CCUz thickness (10 m) Table 12; hydraulic conductivity CCUz/10
Case A – Ksat*10 Full CCUz thickness (10 m) Table 12; hydraulic conductivity CCUz × 10
Case B – Ksat/10 Lowest 5 m of H2 Table 12; hydraulic conductivity H2/10
Case B– Ksat*10 Lowest 5 m of H2 Table 12; hydraulic conductivity H2 × 10
Table 12. Hydraulic properties of the five layers used in the STOMP simulations. The values for the H2 unit and CCUz are the averages of the experimental data shown in Table 9. The values for the other sediments were obtained from Last et al. (2006).
Sediment Mixture Van Genuchten
α (1/cm) Van Genuchten
n
Residual Saturation (m3
liquid/ m3
pore space)
Hydraulic Conductivity
(cm/s) Porosity
(–)
H1 1.02e-2 2.177 0.118 3.67e-5 0.356
H2 7.87e-3 2.372 0.121 8.19e-4 0.393
CCUz 6.30e-3 2.172 0.086 1.29e-3 0.389
CCUc 1.80e-2 1.727 0.214 5.04e-4 0.306
Ringold 1.32e-2 1.753 0.334 1.06e-4 0.297
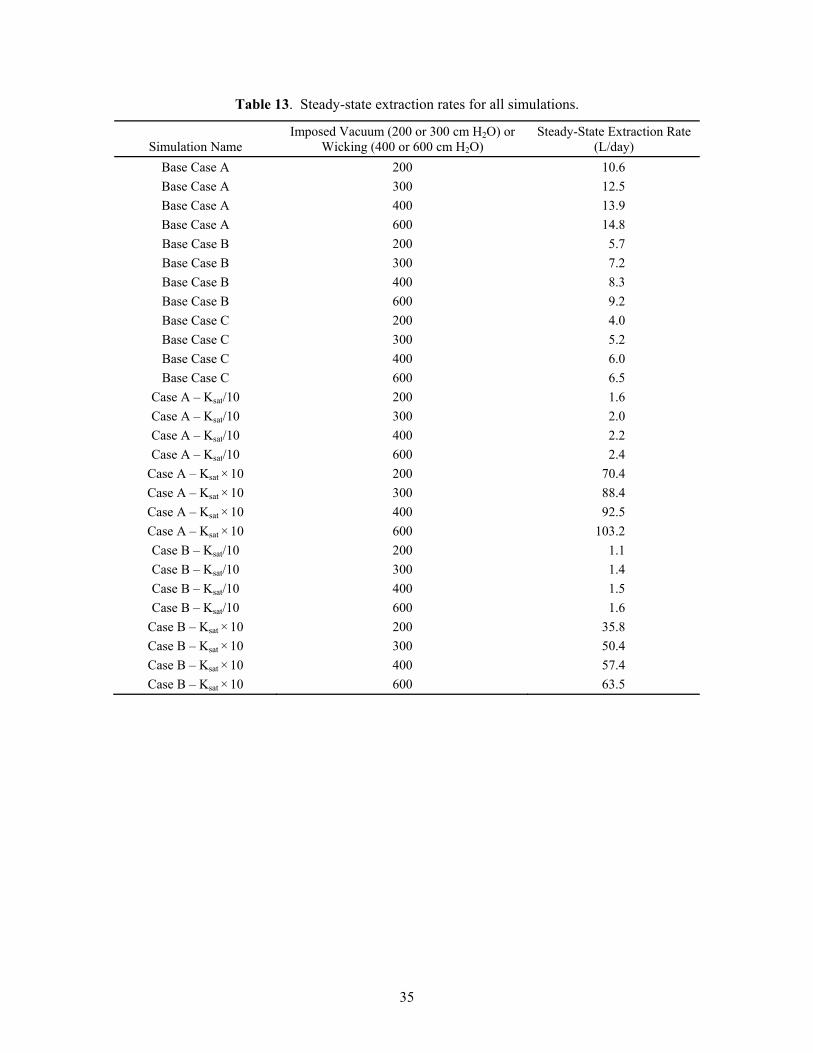
Extraction rates as a function of time all have the same shape, as shown in Figure 11. Directly after initiating a water pressure gradient near the well, the water extraction rate is the highest before decreasing asymptotically to a constant rate. The steady-state extraction rates for all simulations are listed in Table 13. The results in the table show that for all cases, increases in the applied vacuum or suction do not proportionally increase the water-extraction rate. This nonlinearity is a result of drying near the well, leading to a reduction in the water relative permeability. Another nonlinearity occurs when the hydraulic conductivity is either decreased or increased. A factor of 10 reduction of the hydraulic conductivity resulted in decreased water-extraction rates by a factor of about 6. A factor of 10 increase in the conductivity caused the water-extraction rate to increase by a factor of almost 7. Again, these

34
nonlinearities are directly related to the dewatering near the extraction well and the nonlinear relationship between water content and relative permeability.
Figure 11. Extraction rate as a function of time for Base Case A for vacuum-induced pore-water extraction at 200 and 300 cm H2O, and wicking at 400 and 600 cm H2O of suction. Note that in these simulations, there is an infinite supply of water.
To demonstrate the effects of applying suction on the CCUz, the initial and final matric potential and
volumetric moisture contents are shown in Figure 12 and Figure 13, respectively. Figure 12 shows a noticeable reduction in water matric potential up to about 4 m into the CCUz. Both the CCUz and Ringold units were also affected by pore-water extraction imposed over the full length of the CCUz. Associated moisture content reduction near the extraction well is shown in Figure 13. The zone of reduced moisture content does not continue to grow over time because, for the simulated conditions, the CCUz layer is able to supply and conduct water to the extraction well. Moisture content would be reduced for zones where the extent of excess water is of limited extent; however, the rate of water extraction would also decline over time due to the continued impact of lower water relative permeability as moisture content decreased. For the imposed conditions, water removal as a function of distance is shown in Figure 14 and Figure 15. Figure 16 and Figure 17 show the impact of using wicking (absorbent polymers) to increase the water suction for Base Case A to 600 cm H2O. Some water is also removed from the CCUz and Ringold sediments under these conditions (e.g., some vertical water movement is induced).
0
5
10
15
20
25
30
0 2 4 6 8 10
Extr
actio
n Ra
te (L
/day
)
Time (yr)
200 cm vacuum
300 cm vacuum
400 cm suction
600 cm suction
35
Table 13. Steady-state extraction rates for all simulations.
Simulation Name Imposed Vacuum (200 or 300 cm H2O) or
Wicking (400 or 600 cm H2O) Steady-State Extraction Rate
(L/day)
Base Case A 200 10.6
Base Case A 300 12.5
Base Case A 400 13.9
Base Case A 600 14.8
Base Case B 200 5.7
Base Case B 300 7.2
Base Case B 400 8.3
Base Case B 600 9.2
Base Case C 200 4.0
Base Case C 300 5.2
Base Case C 400 6.0
Base Case C 600 6.5
Case A – Ksat/10 200 1.6
Case A – Ksat/10 300 2.0
Case A – Ksat/10 400 2.2
Case A – Ksat/10 600 2.4
Case A – Ksat × 10 200 70.4
Case A – Ksat × 10 300 88.4
Case A – Ksat × 10 400 92.5
Case A – Ksat × 10 600 103.2
Case B – Ksat/10 200 1.1
Case B – Ksat/10 300 1.4
Case B – Ksat/10 400 1.5
Case B – Ksat/10 600 1.6
Case B – Ksat × 10 200 35.8
Case B – Ksat × 10 300 50.4
Case B – Ksat × 10 400 57.4
Case B – Ksat × 10 600 63.5
36
(a) (b)
Figure 12. Initial (a) and steady-state (b) matric potential for Base Case A with vacuum-induced pore-water extraction at 200 cm H2O.
(a) (b)
Figure 13. Initial (a) and steady-state (b) volumetric moisture contents (aqueous moisture content, m3
water/m3
total) for Base Case A with vacuum-induced pore-water extraction at 200 cm H2O.

37
Figure 14. Soil matric potential as a function of time at various distances from the extraction well in the center of the CCUz for Base Case A with an imposed vacuum of 200 cm H2O.
Figure 15. Volumetric moisture content (moisture content, m3water/m
3total) as a function of time at various
distances from the extraction well in the center of the CCUz for Base Case A with an imposed vacuum of 200 cm H2O.

38
(a)
(b)
Figure 16. Steady-state (a) volumetric moisture contents (aqueous moisture content, m3water/m
3total) and
(b) matric potential for Base Case A with a wicking suction of 600 cm H2O.

39
(a)
(b)
Figure 17. Matric potential and volumetric moisture content (moisture content, m3water/m
3total) as a
function of time for water extraction for Base Case A using wicking at a suction of 600 cm H2O.
Water removal from the H2 unit for Base Case B is shown in Figure 18 for the 200-cm H2O vacuum
and 600-cm H2O suction cases. Reductions and increases in the hydraulic conductivity influence the water removal zones, as shown in Figure 19 and Figure 20 for Base Cases A and B (Table 11). The influences in the CCUz unit are more pronounced because the initial moisture contents are smaller than in the H2 unit. Results for an increase in the permeability by a factor 10 are shown for Base Case A (Figure 19) and Base Case B (Figure 20).

40
(a) (b)
Figure 18. Steady-state volumetric water contents (aqueous moisture content, m3water/m
3total) for Base
Case B with a vacuum-induced pore-water extraction of (a) 200 cm H2O, and (b) a wicking suction of 600 cm H2O.
(a) (b)
Figure 19. Steady-state volumetric water contents (aqueous moisture content, m3water/m
3total) for
(a) Case A Ksat/10 and (b) Case A Ksat × 10 with a vacuum-induced pore-water extraction of 200 cm H2O.
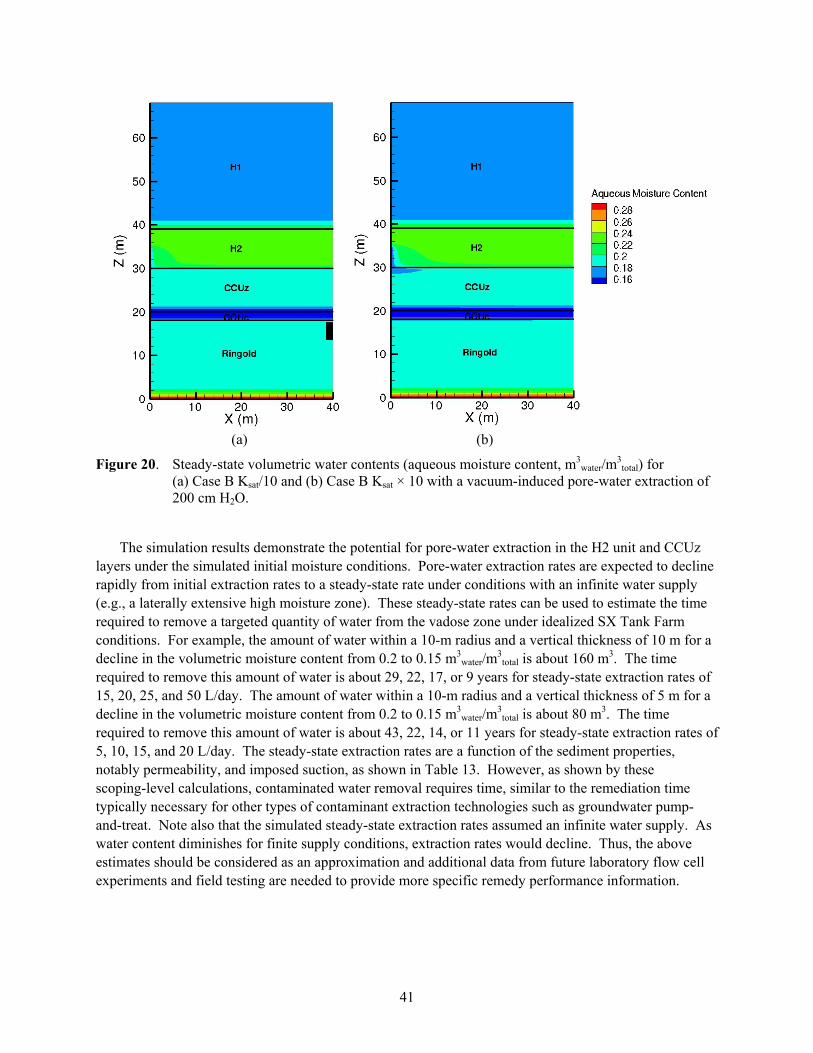
41
(a) (b)
Figure 20. Steady-state volumetric water contents (aqueous moisture content, m3water/m
3total) for
(a) Case B Ksat/10 and (b) Case B Ksat × 10 with a vacuum-induced pore-water extraction of 200 cm H2O.
The simulation results demonstrate the potential for pore-water extraction in the H2 unit and CCUz
layers under the simulated initial moisture conditions. Pore-water extraction rates are expected to decline rapidly from initial extraction rates to a steady-state rate under conditions with an infinite water supply (e.g., a laterally extensive high moisture zone). These steady-state rates can be used to estimate the time required to remove a targeted quantity of water from the vadose zone under idealized SX Tank Farm conditions. For example, the amount of water within a 10-m radius and a vertical thickness of 10 m for a decline in the volumetric moisture content from 0.2 to 0.15 m3
water/m3
total is about 160 m3. The time required to remove this amount of water is about 29, 22, 17, or 9 years for steady-state extraction rates of 15, 20, 25, and 50 L/day. The amount of water within a 10-m radius and a vertical thickness of 5 m for a decline in the volumetric moisture content from 0.2 to 0.15 m3
water/m3
total is about 80 m3. The time required to remove this amount of water is about 43, 22, 14, or 11 years for steady-state extraction rates of 5, 10, 15, and 20 L/day. The steady-state extraction rates are a function of the sediment properties, notably permeability, and imposed suction, as shown in Table 13. However, as shown by these scoping-level calculations, contaminated water removal requires time, similar to the remediation time typically necessary for other types of contaminant extraction technologies such as groundwater pump-and-treat. Note also that the simulated steady-state extraction rates assumed an infinite water supply. As water content diminishes for finite supply conditions, extraction rates would decline. Thus, the above estimates should be considered as an approximation and additional data from future laboratory flow cell experiments and field testing are needed to provide more specific remedy performance information.


43
7.0 Conclusions
Pore-water extraction offers the possibility of contaminant and water removal from the vadose zone and thereby may be beneficial in reducing the flux of vadose zone contaminants to the groundwater. Pore-water extraction could be implemented using two approaches: 1) application of negative pressure (vacuum) via soil-gas extraction at a well to induce coincident pore-water extraction; and 2) deployment of SAPs in a well to extract water from the surrounding soil.
In this study, laboratory experiments and numerical modeling were conducted to specifically examine pore-water extraction for sediment conditions relevant to the vadose zone beneath the SX Tank Farm at the Hanford Site in southeastern Washington State. Available SX Tank Farm data were evaluated to generate a conceptual model of the subsurface for a targeted pore-water extraction application in areas of elevated moisture and Tc-99 concentration. The hydraulic properties of the types of porous media representative of the SX Tank Farm target application were determined using sediment mixtures prepared in the laboratory based on available borehole sediment particle-size data. These data provide specific information for the type of sediments identified in the target pore-water extraction interval of the vadose zone at the SX Tank Farm, and extend the sediment characterization data available to include pressure-saturation relationships. In addition, the sediment characterization data can be used to estimate the pore-water extraction potential for each sediment type as a function of initial moisture content and applied suction. In summary, study results showed that pore-water extraction through application of vacuum or absorbent polymers can extract water from SX Tank Farm sediments primarily when initial volumetric moisture content is above 20% m3
water/m3
total and applied suction is greater than 300 cm H2O. Another important finding was that the hydraulic properties of the tested H2 unit and CCUz sediments are similar. Thus, inefficiencies in pore-water extraction caused by hydraulic property heterogeneity may not be extreme for the targeted vadose zone depth intervals at the SX Tank Farm. Planned laboratory flow cell tests will provide more specific information to evaluate the impact of sediment property differences on pore-water extraction performance. These flow cell tests will also be needed to determine appropriate well filter pack material properties that enable efficient pore-water extraction.
Numerical modeling was used as an evaluation tool to examine scale-up of pore-water extraction. In the simulations, pore-water extraction rate declined rapidly from initial extraction rates to a steady-state rate under conditions with an infinite water supply (e.g., a laterally extensive high moisture zone). If water supply was finite, rates would continue to decline over time, although this condition was not specifically simulated. The rate of pore-water extraction is relatively slow for the simulated SX Tank Farm conditions because of the low water relative permeability induced by moisture content reduction near the extraction well. In most cases, unless hydraulic conductivity encountered in the field is significantly greater or less than the laboratory-derived values, pore-water extraction rates are expected to be on the order of 5 to 15 L/day. As an example, these pore-water extraction rates translate to remediation time frames on the order of tens of years for decreasing volumetric moisture content by 5% m3
water/m3
total within 10 m of an extraction well. Thus, similar to other contaminant extraction technologies such as groundwater pump-and-treat, a pore-water extraction remedy must be applied over a relatively long time frame to meet objectives. These estimates should be considered as an approximation and additional data from planned laboratory flow cell experiments and field testing are needed to provide more specific remedy performance information.

45
8.0 References
DOE-RL (U.S. Department of Energy, Richland Operations Office). 2002. Standardized Stratigraphic Nomenclature for Post-Ringold Formation Sediments Within the Central Pasco Basin. DOE/RL-2002-39, U.S. Department of Energy, Richland Operations Office, Richland, Washington.
DOE-RL (U.S. Department of Energy, Richland Operations Office). 2010. Characterization of the Soil Desiccation Pilot Test Site. DOE/RL-2009-119, U.S. Department of Energy, Richland Operations Office, Richland, Washington.
Fernandez, E.D., L.E. Lopez-Cabarcos, and C. Mijangos. 2005. “Viscoelastic and swelling properties of glucose oxidase loaded polyacrylamide hydrogels and the evaluation of their properties as glucose sensors.” Polymer 46: 2211–2217.
Last GV, EJ Freeman, KJ Cantrell, MJ Fayer, GW Gee, WE Nichols, BN Bjornstad, and DG Horton. 2006. Vadose Zone Hydrogeology Data Package for Hanford Assessments. PNNL-14702, Rev. 1, Pacific Northwest National Laboratory, Richland, Washington.
Levitt M and C Henderson. 2009. Surface Geophysical Exploration of the SX Tank Farm at the Hanford Site. RPP-RPT-42513, Rev. 0, Washington River Protection Solutions LLC, Richland, Washington.
Mualem Y. 1976. “A new model predicting the hydraulic conductivity.” Geoderma 65:81–92.
Oostrom M, TW Wietsma, JH Dane, MJ Truex, and AL Ward. 2009. “Desiccation of unsaturated porous media: Intermediate-scale experiments and numerical simulation.” Vadose Zone Journal 8:643–650.
Oostrom M, VL Freedman, TW Wietsma, and MJ Truex. 2011. Pore-Water Extraction Intermediate-Scale Laboratory Experiments and Numerical Simulations. PNNL-20507, Pacific Northwest National Laboratory, Richland, Washington.
Oostrom M, KV Smoot, TW Wietsma, MJ Truex, MD Benecke, and GB Chronister. 2012. “Soil Moisture Wicking Using Super Absorbent Polymers: A Novel Method for Water and Contaminant Removal from the Vadose Zone.” Vadose Zone Journal, doi:10.2136/vzj2011.0200.
Price, W.H., and K.R. Fecht. 1976. Geology of the 241-SX Tank Farm. ARH-LD-134, Atlantic Richfield Hanford Company, Richland, Washington.
Ritenour GP. 2012. Final Analytical Report for Soil Samples in Support of an Interim Barrier at S Farm. RPP-RPT-47008, Rev. 0, Washington River Protection Solutions LLC, Richland, Washington.
Schroth MH, SJ Ahearn, JS Selker, and JD Istok. 1996. “Characterization of Miller-Similar Silica Sands for Laboratory Hydrologic Studies.” Soil Science Society of America Journal 60(5):1331–1339.
46
Serne RJ, RE Clayton, IV Kutnyakov, GV Last, VL LeGore, TC Wilson, HT Schaef, MJ O’Hara, KB Wagnon, DC Lanigan, CF Brown, BA Williams, CW Lindenmeier, RD Orr, DS Burke, and CC Ainsworth. 2002a. Characterization of Vadose Zone Sediment: Borehole 41-09-39 in the S-SX Waste Management Area. PNNL-13757-3, Pacific Northwest National Laboratory, Richland, Washington.
Serne RJ, RE Clayton, IV Kutnyakov, GV Last, VL LeGore, TC Wilson, HT Schaef, MJ O’Hara, KB Wagnon, DC Lanigan, CF Brown, BA Williams, CW Lindenmeier, RD Orr, DS Burke, and CC Ainsworth. 2002b. Characterization of Vadose Zone Sediment: Slant Borehole SX-108 in the S-SX Waste Management Area. PNNL-13757-4, Pacific Northwest National Laboratory, Richland, Washington.
Steffer RZ. 2009. Completion Report for 241-SX Tank Farm Direct Push Barrier Characterization. RPP-43548, Washington River Protection Solutions LLC, Richland, Washington.
van Genuchten MT. 1980. “A Closed Form Equation for Predicting the Hydraulic Conductivity of Unsaturated Soils.” Soil Science Society of America Journal 44(5):892–898.
van Genuchten MT, FJ Leij, and SR Yates. 1991. The RETC Code for Quantifying the Hydraulic Functions of Unsaturated Soils. EPA/600/2-91/065, U.S. Environmental Protection Agency, Ada, Oklahoma.
White MD and M Oostrom. 2006. STOMP: Subsurface Transport Over Multiple Phases, Version 4.0, User’s Guide. PNNL-15782, Pacific Northwest National Laboratory, Richland, Washington.
Wietsma TW, M Oostrom, MA Covert, TW Queen, and MJ Fayer. 2009. “An Automated Apparatus for Constant Flux, Constant Head, and Falling Head Hydraulic Conductivity Measurements.” Soil Science Society of America Journal 73(2):466–470.

Appendix –
Flow Cell Design for Pore-Water Extraction Experiments


A.1
Appendix
Flow Cell Design for Pore-Water Extraction Experiments
Two identical flow cells were designed and constructed for use in future pore-water extraction experiments. The design sketch (computer-aided design [CAD] drawing) for the flow cell is shown in Figure A.1 and a photograph of a completed flow cell is shown in Figure A.2. Key features of the flow cell (with respect to pore-water extraction experiments) are described below.
• The internal dimensions are 100 cm (long) by 50 cm (high) by 5 cm (wide). The 50-cm height allows for two-dimensional investigations of pore-water removal.
• The front and back walls are made of 3/8-in.-thick polycarbonate, which allows the use of dual-energy gamma scanning to nonintrusively determine the moisture content and bulk density distribution within the flow cell packing at periodic survey times during experiments.
• The design includes provisions to install water and air pressure transducers at discrete locations throughout the flow cell.
• Multiple ports were installed in a uniform vertical distribution down the narrow sides (ends) of the flow cell to allow application of vacuum suction and air flow in and out.
• The design includes provisions to emplace an artificial well and associated filter pack at the suction end of the flow cell. The well (and filter pack material) may extend over all or part of the full 50-cm vertical length.
• The artificial well can be fitted with wicking materials (sorbents) as the applied suction. Wicking material can be removed and replaced periodically by placing it in a “sock” that fits in the well. The narrow ends of the flow cell have removable panels that allow easy access to the socks (Figure A.1).
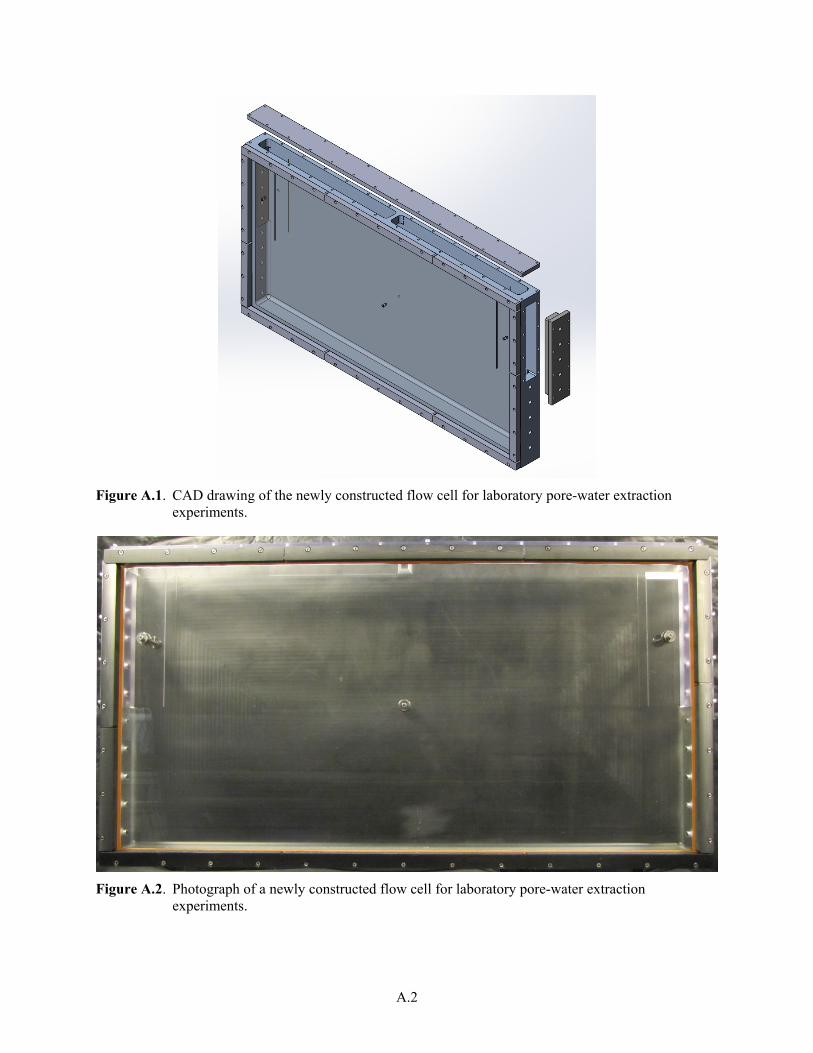
A.2
Figure A.1. CAD drawing of the newly constructed flow cell for laboratory pore-water extraction experiments.
Figure A.2. Photograph of a newly constructed flow cell for laboratory pore-water extraction experiments.

PNNL-21882 RPT-DVZ-AFRI-011
Distribution
No. of No. of Copies Copies
Distr.1
ONSITE 3 U.S. Department of Energy, Richland
Operations Office BL Charboneau A6-33 JG Morse A5-11 DOE Public Reading Room H2-53 2 Washington River Protection Solutions
LLC SJ Eberlein H6-13 D Parker H6-13
3 Pacific Northwest National Laboratory M Oostrom K9-33 MJ Truex K6-96 DM Wellman K3-62


![Multi-Scale and Snakes for Automatic Road Extraction · 2005. 9. 26. · Multi-Scale and Snakes for Automatic Road Extraction 721 nding starting points. [5]and[3] concentrateonhowto](https://static.fdocuments.in/doc/165x107/603665d884097d643546d175/multi-scale-and-snakes-for-automatic-road-2005-9-26-multi-scale-and-snakes.jpg)
