Pore structure and mechanical properties of cement … · Pore structure and mechanical properties...
29
Pore structure and mechanical properties of cement-lime mortars M. Arandigoyen, J.I. Alvarez * Departamento de Química, University of Navarra, 31080 Pamplona, Spain Nº of pages: 23 Nº of tables: 3 Nº of figures: 8 Keywords: D, Blended cement; E, mortar; C, mechanical properties; C, elastic moduli; B, pore size distribution Please, send all correspondence to: Dr. José I. Alvarez Galindo Dpto. de Química Fac. de Ciencias Universidad de Navarra C/ Irunlarrea s/n 31080 Pamplona (Navarra) Spain Phone: 34 948 425600 Fax: 34 948 425740 E-mail: [email protected]
-
Upload
truongdieu -
Category
Documents
-
view
232 -
download
0
Transcript of Pore structure and mechanical properties of cement … · Pore structure and mechanical properties...

Pore structure and mechanical properties of cement-lime mortars
M. Arandigoyen, J.I. Alvarez *
Departamento de Química, University of Navarra, 31080 Pamplona, Spain
Nº of pages: 23
Nº of tables: 3
Nº of figures: 8
Keywords: D, Blended cement; E, mortar; C, mechanical properties; C, elastic moduli;
B, pore size distribution
Please, send all correspondence to:
Dr. José I. Alvarez Galindo
Dpto. de Química
Fac. de Ciencias
Universidad de Navarra
C/ Irunlarrea s/n
31080 Pamplona (Navarra)
Spain
Phone: 34 948 425600
Fax: 34 948 425740
E-mail: [email protected]

Pore structure and mechanical properties of cement-lime mortars
Abstract
Studies focusing on materials used in Cultural Heritage conservation projects are
becoming increasingly important. In this paper, pore structure and mechanical
properties of lime-cement mortars are evaluated in order to analyze their potential use,
because this kind of mortar could reduce the disadvantages presented by both lime-
based mortars and cement-based mortars. The microstructure of these blended mortars
is studied taking into account porosity, pore size distribution and surface fractal
dimension. Compressive and flexural strengths are discussed as a function of several
parameters: curing time, binder composition and B/Ag (Binder/aggregate) ratio. The
mechanical strength versus the deformation of the material is also evaluated, by analysis
of Young’s modulus, as well as the elastic and plastic zones. Unlike cement-based
mortars, blended mortars with a high percentage of lime present a large plastic zone,
which could be useful in the service-life of these mortars as a result of their ability to
absorb strains caused by wall movements.
Keywords: D, Blended cement; E, mortar; C, mechanical properties; C, elastic moduli;
B, pore size distribution

1. Introduction
For several centuries lime-based mortars were used as binding materials in monuments.
Aerial lime was commonly used, and the final characteristics of the mortars were
strongly dependent on the civilization. As a consequence, now a broad variety of
mortars can be found in historical buildings. Nowadays, these traditional mortars have
been replaced with cement mortars [1]. Several characteristics have been attributed to
lime-based mortars: (i) slow setting that hinders and delays restoration work; (ii) lime
mortars present lower strengths than cement mortars, and take longer to reach them.
Together with that, there is a lack of rigorous studies about these material.
Cement-based mortars have therefore displaced lime-based mortars because of their
faster setting, higher mechanical strength and advanced industrial development and
affordable cost. However, in spite of their wide use in Civil Engineering, cement-based
mortars have been found to present major disadvantages as repair mortars for Cultural
Heritage restoration [2]: (i) they present a serious incompatibility with old stones; (ii)
they have a high salt content, which can damage the stone by crystallization and/or
hydration cycles; (iii) they have been found to have low flexibility, in contrast with
lime-based mortars, which hinders the accommodation of movement resulting from
creep or thermal effects [3,4]. In recent times, restoration interventions carried out using
cement mortars have caused significant failures and acceleration of damage to the
monument, which leads to the conclusion that cement-based mortars are unsuitable , as
they are incompatible with historic buildings [1].
Study of different binding materials has been carried out in response to the reported
objections to both lime and cement mortars. These materials should have the following
characteristics: (i) chemical compatibility between the repair mortar and the old

materials (stone or brick and their bedding mortar); (ii) physical compatibility, with
special reference to the processes of solubility and water transport; (iii) structural and
mechanical compatibility with ancient materials, stones and mortars. One previous
study states specifically that a repointing mortar should be considerably weaker than the
stone, and should deform significantly before failure [3].
The use of some blended mortars could be interesting in this sense, because lime
mortars with a certain amount of cement added might behave like hydraulic mortars,
which are characterized by higher strengths than lime mortars (but no as high as cement
mortars), as well as a faster setting time, which improves their application [5-7]. In
some countries, such as Spain, the availability of natural commercial hydraulic lime is
very low, so it may be useful to know whether cement-lime mortars have similar
behaviour to hydraulic-lime mortars, since suitable cement-lime mixtures are easier to
prepare and more widely available. Previous papers have reported some aspects of these
materials such as: the viscosity of lime-cement paste [5], the effect of aggregate
composition in pozzolan repair mortars [8], and the effect of silica fume addition [9].
Our research group has studied the pore structure and capillary porosity [10] and the
variation of microstructure during the carbonation of lime [11] in blended pastes.
During the setting and hardening processes of a mortar, various physical and chemical
phenomena take place as a function of the binder composition:
i) In lime-based mortars the drying of the kneading water takes place, together
with a certain degree of shrinkage [2]. The carbonation process starts when
the water content of the mortar does not hinder the diffusion of the air
through the material [12].
ii) In cement-based mortars the setting is a consequence of the hydration of the
calcium silicates, which starts quickly owing to the hydration of the C3S and

continues more slowly because of the hydration of the C2S. The hydration of
both compounds gives strength to the mortar [13]. The carbonation process
also takes place slowly. The carbonation of cementitious materials is a
reaction of the basic compounds of hydrated cement (essentially Ca(OH)2
and CSH) with carbonic acid. This phenomenon has been studied at length
[14].
However, from the review of the literature, the absence of a systematic study of the
mechanical properties of these blended mortars is noticeable. This kind of study should
analyze the influence of several important factors, such as the dosage of cement or the
B/Ag (binder/aggregate) ratio. This paper aims to add to the experimental data on the
mechanical behavior of lime-cement mortars in the full range of compositions (from
100% cement mortars up till 100% lime mortars). The influence of the B/Ag ratio is
discussed as well as the modulus of elasticity. Pore structure (and surface fractal
dimension, as an indicator of it) is also evaluated, because it is responsible for capillary
absorption and moisture transport, phenomena which are related to the durability,
degradation and service life of building materials [15-17]. The results obtained have
been compared with the results for cement-lime pastes [10,11], which allows us to
analyze the changes due to the addition of the aggregate.

2. Experimental study
2.1. Paste preparation
189 prismatic specimens of 40x40x160 mm were prepared by mixing three components:
a hydrated commercial lime powder (Ecobat) (supplied by Calinsa S.A, Navarra, of
the class CL90 according to the Spanish standard [18]), Portland cement CEM II-A/L
32.5 (according to the Spanish standard [19]), and a commercial calcite aggregate made
up of crushed stones. Seven cement/lime ratios (by volume, including the full range of
cement-lime compositions) were combined with three B/Ag ratios (by volume) to
produce twenty-one different mortars (Table 1). The three B/Ag ratios for each binder
composition - (1:2) to (1:4) – were chosen among the commonest dosages reported in
the literature [2].
Table 2 shows the chemical analyses of the lime (Ecobat®), the cement (CEM II-A/L
32.5) and the aggregate. XRD and TG-DTA analyses were carried out with the aim of
studying the mineralogical composition of lime and cement. The XRD (Fig. 1) and TG-
DTA analyses of the lime show two mineralogical phases: portlandite (87%) and calcite
(10%), with a 3% of free water. Magnesium compounds (MgO, Mg(OH)2, dolomite),
which were shown to present slower carbonation rates, were not found. The XRD
results for the cement (Fig. 2) show the well-known anhydrous phases of a clinker
(calcium silicates and aluminates). Figure 3 shows the cumulative particle size
distribution of the aggregate. The main particle size ranges from 0.1 to 2 mm, with 20%
smaller than 0.1mm.
During the preparation of the mortars, before the addition of the aggregate, lime and
cement were intimately mixed. Then a specific amount of water was added with the aim
of obtaining a similar consistency and workability (measured by the flow table test) [20]
for all the fresh mortars. Pastes were blended for 5 minutes in a Proeti ETI 26.0072

mixer, molded in prismatic casts and demolded 3 days later. The specimens were cured
in a vertical position in a laboratory environment (RH 60 10% and 20 5ºC). The
surrounding CO2 in the room was estimated to be the standard atmospheric
concentration (0.033 0.001% by volume).
Tests and analyses were conducted using the techniques described below after curing
times of 3, 7, 28, 91 and 365 days: one specimen was tested at 3 days after curing, two
after 7 days, three after 28 days, two after 91 days and one after 365 days. The reported
results are an average value of the similar specimens, and the coefficients of variation
are below 5% in compressive strength results.
2.2. Analytical methodology
2.2.1. XRD analysis
The mineralogical phases of the mortars were determined by means of X-ray diffraction
(XRD) using a Brucker D8 Advance diffractometer, according to the diffraction powder
method, with a CuKα1 radiation and 0.02 2θ increment and 1 s·step-1, sweep from 10 to
80º 2θ. The results were compared with the ICDD database.
2.2.2. Thermal analysis
Differential thermal and thermogravimetric analysis (DTA-TG) were conducted using a
simultaneous TGA-sDTA 851 Mettler Toledo thermoanalyser, with alumina crucibles,
fitted with pierced lids, at 20ºC·min-1 heating rate, under static air atmosphere.
2.2.3. Pore structure
The pore structure was evaluated in two ways:

2.2.3.1. Open porosity measurement: the total porosity is expressed as P, in
percent, and it was determined according to the water saturation test [21] with a
hydrostatic balance.
2.2.3.2. Pore size distribution was evaluated using the mercury intrusion
porosimetry technique with a Micrometrics 9320 Poresizer mercury porosimeter,
which automatically registers pressure, pore diameter, intrusion volume and pore
surface area.
2.2.4. Mechanical properties
The mechanical properties were evaluated in two ways:
2.2.4.1. The three-point flexural tests were carried out using a Frank/Controls
81565 compression machine at low rates of loading (4 mm/min). Flexural strength
determination was performed on the Ibertest IB 32-112V01.
2.2.4.2. Compressive strength tests were conducted on the two fragments of each
specimen resulting from the preceding flexural test. Compressive strength
determination was carried out on a Proeti ETI 26.0052, with a loading rate of 4
mm/min. The reported results are the average value of the identical specimens.

3. Results
3.1. Pore Structure
3.1.1. Porosity
Table 3 shows that the porosity in these mortars can be considered constant. Only slight
differences of porosity between the different binder compositions can be perceived
(lime:cement ratios). These results are somewhat surprising, because previous studies
have reported striking differences in the porosity of lime-cement pastes, so that the
higher the percentage of lime in the paste, the higher the porosity [10,11]. In these
previous experiments porosity was found to range from 50 to 65% in lime pastes (as a
function of the W/B (water/binder) ratio) [22], whereas its value was around 30% in
cement pastes [10]. Contrary to expectation, in the current paper, the analysis of lime-
cement mortars shows that porosity remained almost invariable (ranging from 20 to
23%).
This slight increase in porosity was noticed when the quantity of binder increased (from
B/Ag ratio 1:4 to 1:2). This increase was proven to be independent of the lime:cement
ratio. Other research also registered this small variation in lime-based mortars [2,7].
Nevertheless, these previous authors reported a dramatic increase in porosity for the
highest B/Ag ratios (1:1, 2:1 or 4:1).
3.1.2. Pore size distribution
Figure 4 shows the cumulative pore size distribution (%) of the mortars with different
B/Ag ratio: 1:2, 1:3 and 1:4. The intrusion volume registered includes both the pores
and the microcracks created as a result of the internal strains (which could take place,
for example, during the setting of the material) [23].

Using MIP, previous research on the microstructure of both lime pastes and cement-
lime pastes has concluded that all the pore diameters are smaller than 1 µm [10,22].
Nevertheless, the pore size distributions of the mortars in the current study present a
large proportion of pores greater than 1 µm. As can be seen from the data in Figure 4,
this fact must be highlighted in lime-rich mortars (> 50% of lime).
3.1.3. Surface fractal dimension
In a previous paper [24], pore fractal objects were defined as dense objects within which
there exists a distribution of pores with a fractal structure. Fractal geometry is used to
describe chaotic systems which are characterized by their invariability at any scale used
to examine them; any part of the system looks the same as the whole (self-similarity)
[25]. The system is determined by fractal dimension value, which is defined as an
intermediate dimension between the Euclidean dimensions (point 0, line 1, plane 2 and
volume 3) as a consequence of the complexity of the system [26].
This value (DS) can contribute to a description of the heterogeneity and complexity of
the pore system. Perez Bernal et al. explained and compared several methods to
calculate this parameter [25]. In the present paper the Zhang and Li model [27] (derived
from thermodynamic considerations and the analysis of dimensions) has been applied to
the MIP collected data (Eq. 1). In order to obtain the value of DS, the Qn term was
plotted versus the Wn term, and several D values were estimated until they fitted a
straight line (with a slope value of 1). The D value obtained is the surface fractal
dimension.
ii
n
in VPQ
1 n
Dn
Dn WVr 3/2
(Eq. 1)

where, P is the applied pressure, V is the intrusion volume of mercury, r is the pore
radius, D is the surface fractal dimension, Qn is the short expression of ii
n
i
VP 1
and
Wn is the short expression of 3/2 Dn
Dn Vr .
The good correlation coefficients obtained (~ 0.99) show the good adjustment of these
materials to the Zhang and Li’s model. In accordance with Pfeifer and Obert [28], the
range of pore diameters used to calculate the fractal dimension must include at least one
order of magnitude with the purpose of accepting the experimental value of the fractal
dimension. In the present study this model has been applied to the full pore range
obtained by MIP ,which includes around four orders of magnitude.
Figure 5 presents the DS versus the percentage of lime in the binder for each one of the
mortars. In the three series with different B/Ag ratio, it can be seen that the higher the
percentage of cement in the binder, the higher the DS. An identical behavior can be seen
in a previous study on lime-cement pastes [10]. However, in mortars the variation in the
interval is smaller than in pastes.
The values of the slope of the straight line that links the values of DS are very similar for
each of the three series with different B/Ag. The DS variation is shown to be
independent of the B/Ag ratio throughout the same series (with the same B/Ag ratio).
Nevertheless, the value of the DS changes clearly as a function of the B/Ag ratio. For
instance, in mortars with the same binder composition, the smaller value of DS matches
the 1:3 B/Ag ratio; the intermediate one matches the 1:4 ratio; and the highest one
matches the 1:2 ratio.

3.2. Mechanical properties
3.2.1. Influence of the curing time
We must emphasize that the curing process was conducted in laboratory conditions (HR
60 10% and 20 5ºC), which are not the most suitable for the hydration of calcium
silicates. Figure 6 shows the values of the compressive and flexural strength, versus the
curing time. From the data, two different evolutions of the mechanical properties can be
clearly observed:
i) In mortars with a lime-rich binder, a continuous increase in mechanical
strengths occurs (cement-lime 0-1 and 1-8).
ii) In mortars with a cement-rich binder, an increase in strength can be observed
at the beginning of the curing days (registered until the 7th day).
Nevertheless, next a drop in strength is observed before a new increase
registered at the 365th day. In the compressive strength, the decrease is
confirmed at the 91st day (except for mortars 1-0-3 and 1-0-4, in which the
strength decreases from the 28th day). However, in the flexural strength the
decrease generally begins at the 28th day. The reduction in strength shifts
towards earlier curing ages when the cement content increases.
3.2.2. Influence of the binder composition
As expected, the binder composition has a significant influence on the mechanical
properties of the mortar. The following facts have been established in both the
compressive and the flexural strengths:
i) The lime-rich mortars show small variations of the mechanical strength
when the binder composition changes. For example, the mechanical

strengths present very slight changes if the cement percentage ranges from 0
to 40% (cement-lime ratios of 0-1, 1-8 and 1-4).
ii) The cement-rich mortars show a wide variation in their mechanical
properties: an outstanding fall in their mechanical strengths has been
established when a certain amount of lime is added to the cement.
It can thus be concluded that if certain amount of cement is added (0-40%), the
mechanical strength of lime mortars increases slightly, whereas in cement mortars, the
mechanical strength diminishes considerably if a small amount of lime is added: for
instance, the addition of 25% of lime gives rise to 50% loss of strength.
3.2.3. Influence of the B/Ag ratio
It is well-known that cement mortars increase their mechanical strengths if the amount
of binder in the mortar increases [23]. The same behavior has been reported for lime-
based mortars [2,7]. Therefore, analogous behavior might be expected for lime-cement
mortars. The data in Fig. 6 confirm the strength increase over the curing time.
The B/Ag ratio has a strong influence on the strength values: 40% of the rise can be
observed from (1:4) to (1:3), and from (1:3) to (1:2). These variations are outstanding
for rich-in-cement mortars.
3.2.4. Young’s modulus
Figure 7 shows the compressive strength versus the deformation for (1:2) B/Ag ratio
mortars.
As can be noticed in Fig. 7, the limit of strength (beyond which breakage takes place)
fits in with a straight line for the majority of the mortars belonging to the same B/Ag
ratio series. Only the two richest-in-lime mortars do not fit in with this straight line

owing to the presence of a noticeable plastic zone before breakage. These plastic zones
are characterized by a smaller slope: in these areas, if the load disappeared the material
would not recover its initial characteristics, but would suffer a permanent deformation.
From the results, it can be established that the higher the amount of cement, the lower
the plastic zone. In addition, in mortars with over 50% cement, the plastic zone is
actually lost, and the mortars go through the elastic zone up until breakage of the
material.
This plastic zone is not observed during the flexural strength tests, in which all mortars
just break after the elastic zone.
4. Discussion
In mortars, it must be considered:
i) the pores of the aggregate, which depend on the nature of the aggregate;
ii) the pores of the binder, which also depend on the chemical and mineralogical
composition of the binder and the W/B ratio [10,22,29]. It has been established
that the amount of kneading water does not modify the complexity of the pore
system, at least in lime pastes [22], but does change the porosity;
Previous works have demonstrated that the binder is the main factor responsible for the
porosity in the mortar, not including the most porous aggregates [2,7]. Therefore, the
W/B ratio should play an important role in the porosity. Actually, the amount of
kneading water has been reported as the main determining factor of the porosity [29].
It can be stated that the higher the B/Ag ratio, the smaller the W/B ratio. This
phenomenon can be attributed to the fact that the mortars were prepared in order to
achieve similar consistency (workability) for all the fresh pastes. Workability is
extremely important in order to apply the mortar on the building site. In mortars with

small amounts of binder, the reduction in porosity due to the smaller percentage of
binder would achieve an equilibrium with an increase in porosity owing to the
evaporation of a larger amount of kneading water. This dependence of the porosity on
the B/Ag (in line with W/B) ratio can be confirmed by the fact that the values for
porosity are practically constant with changing lime:cement ratios (Table 3). This
behavior is clearly different from the behavior of the pastes, so it can indicate that it has
its origin in the addition of the aggregate.
However, two facts about pore size distribution remain unexplained at this point:
i) As can be seen from the data in Figure 4, there is a proportion of different
pores > 1 µm which did not appear in pastes [10]. When the amount of
aggregate in the mortar increases, the percentage of pores higher than 1 µm
increases slightly.
ii) The MIP results (Fig. 4) show that when the amount of aggregate increases,
the pore size distribution shifts towards smaller diameters of pore.
As a possibility, we suggest that pores > 1 µm could be attributed to the ITZ (interfacial
transition zone), formed by pores that are partly bordered by the aggregate and by the
binder. These ITZ pores depend on the nature of the binder (also affected by the W/B
ratio) and aggregate. In cement mortars, it has been stated that the ITZ is characterized
by its high porosity, smaller degree of hydration of calcium silicates and greater
percentage of portlandite than in the rest of the mortar [30]. The origin of pores <1 µm
turn out to be more difficult to explain: the smaller porosity of the aggregate and/or the
occurrence of ITZ could have some influence on these results. However, further BSE
studies should be carried out in order to characterise the pore structure of this ITZ and
confirm these hypothesis.

Concerning the Ds values, the smaller variation found in the interval compared with
those observed in the pastes [10] can be explained because the change is mainly due to
the variation in the microstructure of the binder, which in the case of mortars represents
only part of the material, but in pastes constitutes 100% of the material. However, no
explanation has yet been put forward for the surprising variation of DS with the B/Ag
ratio.
As far as the mechanical properties are concerned, in mortars with a lime-rich binder,
carbonation predominates as the hardening process, so the mechanical strengths
increase in parallel with the carbonation process. The setting time in lime mortars with
small amounts of cement (mortars with a cement-lime ratio of 1-8) is remarkably
shortened: this fact is useful to apply the mortars in the monument.
In the rich-in-cement mortars, the dry curing conditions, in comparison to more suitable
conditions for hydration of calcium silicates (HR of 100%), could have had some
negative influence on the curing process and could explain the increase in strength at the
beginning of the curing days and the subsequent drop in strength. In the literature, a
decrease in strength has been reported at certain days, followed by a later increase when
the curing of cement takes place at temperatures of 35ºC (in water or steam) [13]. In
addition, the volume increase of the Ca(OH)2 as a result of its carbonation might create
microcracks that could have an influence on the mechanical properties [23].
Blended mortars with around 40% of lime, 60% of cement present compressive strength
very similar to that of natural hydraulic lime-based mortars, with a B/Ag volume ratio
of (1:2) [7]. Moreover, this strength is achieved quickly (7 days). This compressive
strength could be large enough to repair mortars [4].
Two opposite factors must be taken into consideration when a mix of a repair mortar is
designed: i) the increase in strength when the amount of binder increases; ii) the
decrease in strength as a result of cracks that can be produced as a consequence of the
shrinkage [7].
From the data in Figure 7, it can be stated that mortars with a lime-rich binder, in spite
of their lower strengths, are able to absorb a high degree of deformation before
breakage, due to their plastic zone. Owing to this fact, these mortars are very interesting
materials for restoration work: they can accommodate the movements of ancient
buildings [3,4].
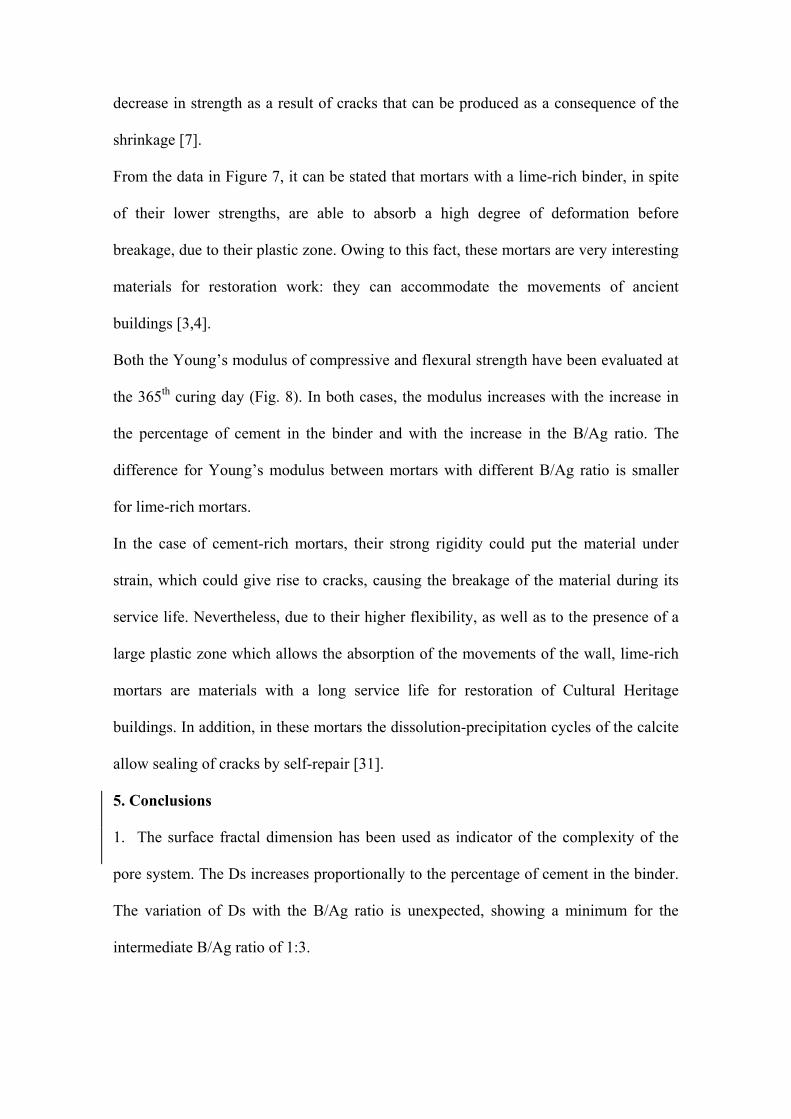
Both the Young’s modulus of compressive and flexural strength have been evaluated at
the 365th curing day (Fig. 8). In both cases, the modulus increases with the increase in
the percentage of cement in the binder and with the increase in the B/Ag ratio. The
difference for Young’s modulus between mortars with different B/Ag ratio is smaller
for lime-rich mortars.
In the case of cement-rich mortars, their strong rigidity could put the material under
strain, which could give rise to cracks, causing the breakage of the material during its
service life. Nevertheless, due to their higher flexibility, as well as to the presence of a
large plastic zone which allows the absorption of the movements of the wall, lime-rich
mortars are materials with a long service life for restoration of Cultural Heritage
buildings. In addition, in these mortars the dissolution-precipitation cycles of the calcite
allow sealing of cracks by self-repair [31].
5. Conclusions
1. The surface fractal dimension has been used as indicator of the complexity of the
pore system. The Ds increases proportionally to the percentage of cement in the binder.
The variation of Ds with the B/Ag ratio is unexpected, showing a minimum for the
intermediate B/Ag ratio of 1:3.

2. When 0-40% of cement is added to lime-based mortars, their mechanical strength
increases slightly. In cement mortars, the mechanical strength diminishes sharply when
a small amount of lime is added (25% of lime gives rise to a drop in strength of around
50%).
3. From the results for Young’s modulus, it can be stated that the lime-rich mortars
present a plastic zone that does not appear in the other blended mortars. Therefore, lime-
rich mortars are able to absorb a high degree of deformation before the breakage. Due to
this, these mortars have great potential as materials for restoration work: they can
accommodate the movements of ancient buildings.
Acknowledgements
The present study was supported by the Spanish Ministerio de Ciencia y Tecnología,
Plan Nacional de Investigación, Desarrollo e Innovación Tecnológica (I+D+I) program,
Project MAT 2000-1347.
References
[1] A. Moropoulou, A. Bakolas, P. Moundoulas, E. Aggelakopoulou, S.
Anagnostopoulou, Strength development and lime reaction in mortars for
repairing historic masonries, Cem. Concr. Res., 27 (2005) 289-294.
[2] J. Lanas, J.I. Alvarez, Masonry repair lime-based mortars: Factors affecting the
mechanical behaviour, Cem. Concr. Res., 33 (2003) 1867-1876.
[3] M.J. Mosquera, D. Benitez, S.H. Perry, Pore structure in mortars applied on
restoration: Effects on properties relevant to decay of granite buildings, Cem.
Concr. Res., 32 (2002) 1883-1888.

[4] E. A.W. Hendry, Masonry walls: material and construction, Constr. Build. Mater.,
15 (2001) 323-330.
[5] Y. Sébaïbi, R. M. Dheilly, M. Quéneudec, A study of the viscosity of lime-cement
paste: influence of the physico-chemical characteristics of lime, Constr. Build.
Mater., 18 (2004) 653-660.
[6] A.H.P. Maurenbrecher, Mortars for repair of traditional masonry, Practice
Periodical on Structural Design and Construction, 9 (2004) 62-65.
[7] J. Lanas, J.L. Pérez Bernal, M.A. Bello, J. I. Alvarez Galindo, Mechanical
properties of natural hydraulic lime-based mortars, Cem. Concr. Res., 34 (2004)
2191-2201.
[8] P. Manita, T.C. Triantafillou, The effect of aggregate composition on physical and
mechanical characteristics of repair mortars, Advances in Architecture, 15 (2003)
781-790.
[9] P.J.P. Gleize, A. Müller, H.R. Roman, Microstructural investigation of a silica
fume-cement-lime mortar, Cem, Concr. Comp., 25 (2003) 171-175.
[10] M. Arandigoyen, J.I. Alvarez, Blended pastes of cement and lime: Pore structure
and capillary porosity, Appl. Surf. Sci., (Available on www.sciencedirect.com)
[11] M. Arandigoyen, B. Bicer-Simsir, J.I. Alvarez, D.A. Lange, Variation of
microstructure with carbonation in lime and blended pastes, Appl. Surf. Sci.,
(2005) (Available on www.sciencedirect.com)
[12] K. Van Balen, D. Van Gemert, Modelling lime mortar carbonation, Mater. Struct.,
27 (1994) 393-398.
[13] F.M. Lea, The chemistry of cement and concrete, Glasgow, Edward Arnold
(1970).

[14] Y.F. Houst, F.H. Wittmann, Influence of porosity and water content on the
diffusivity of CO2 through hydrated cement paste, Cem. Concr. Res., 24(6) (1994)
1165-1176.
[15] N.S. Martys, C.F. Ferraris, Capillary transport in mortars and concrete, Cem.
Concr. Res., 27 (5) (1997) 747-760.
[16] M.S. Goual, F. de Barquin, M.L. Benmaled, A. Bali, M. Quéneudec, Estimation of
the capillary transport coefficient of Clayey Aerated Concrete using a gravimetric
technique, Cem. Concr. Res., 30 (2000) 1559-1563.
[17] V. Fernandes, L. Silva, V.M. Ferreira, J.A. Labrincha, Influence of the kneading
water content in the behaviour of single-coat mortars, Cem, Concr. Res., 35
(2005) 1900-1908.
[18] UNE-EN 459-1, Building Lime: Part 1. Definition, specification and conformity
criteria, 1996.
[19] UNE 80.301:1996 Cementos comunes: Composición especificaciones y criterios.
[20] UNE 83-811-92, Mortars, Test Methods, Fresh Mortars, Determination of
consistence, Flow Table, reference Method, 1992.
[21] RILEM, Mater. Struct. 13 (1980) 175-253.
[22] M. Arandigoyen, J.L Pérez Bernal, M.A Bello López, J.I. Alvarez, Lime pastes
with different kneading water: pore structure and capillary porosity, Appl. Surf.
Sci., (2005) (Available on www.sciencedirect.com)
[23] H.F.W. Taylor, La química de los cementos, (1978) Ed. URMO.
[24] Y. Wang, S. Diamond, A fractal study of the fracture surfaces of cement pastes
and mortars using a stereoscopic SEM method, Cem. Concr. Res., 31 (2001)
1385-1392.

[25] J.L. Pérez Bernal, M.A Bello López, Fractal geometry and mercury porosimetry
Comparison and application of proposed models on building stones, Appl. Surf.
Sci., 185 (2001) 99-107.
[26] A. Stazi, M. D’Orazio, E.Quagliarini, In-life prediction of hygrometric behaviour
of buildings materials: an application of fractal geometry to the determination of
adsorption and suction properties Build. Environ 37 (2002) 733-739.
[27] B. Zhang, S Li, Determination of the surface fractal dimension for porous media
by mercury porosimetry, Ind. Eng. Chem. Res., 34 (1995) 1383-1386.
[28] P. Pfeifer, M. Obert, in: D. Avnir (Ed.), The Fractal Approach to Heterogeneous
Chemistry, Wiley, New York, 1989, p.16.
[29] V. Fernandes, L. Silva, V.M. Ferreira, J.A. Labrincha, Evaluation of mixing and
application process parameters of single-coat mortars, Cem. Concr. Res., 35
(2005) 836-841.
[30] K.L. Scrivener, K.M. Nemati, The percolation of pore space in the cement
paste/aggregate interfacial zone of concrete, Cem. Concr. Res., 26 (1996) 35-40.
[31] C. Rodríguez-Navarro, E. Sebastián, G. Cultrone, Aging of lime putty: Effects on
traditional lime mortar carbonation, J. Am. Cera. Soc, 83 (5) (2000) 3032-3034.

Table 1. Cement / Lime / Aggregate ratios (by volume) of the mortars elaborated.
Cement / Lime
B / Ag 0 - 1 1 - 4 1 - 2 1 - 1 2 - 1 4 - 1 1 - 0
1 - 2 0-1-2 1-4-10 1-2-6 1-1-4 2-1-6 4-1-10 1-0-2
1 - 3 0-1-3 1-4-15 1-2-9 1-1-6 2-1-9 4-1-15 1-0-3
1 - 4 0-1-4 1-4-20 1-2-12 1-1-8 2-1-12 4-1-20 1-0-4
Table 2. Chemical analysis of the main components of the hydrated commercial lime
powder (Ecobat)a,b, the Portland cement CEM II-A/L 32.5 and the aggregate used.
LOIc
(%) SiO2
(%) CaO (%)
MgO (%)
R2O3d
(%) SO3 (%)
Na2O (%)
K2O (%)
Lime 25.25 1.03 68.53 3.29 0.89 1.37 0.09 0.05
Cement 6.94 16.23 58.28 4.65 9.99 2.35 0.38 0.35
Aggregate 43.10 0.49 52.83 2.28 1.14 0.57 0.07 0.05 a Percentages related to original dry lime.
b The methods specified by the European Standard EN-196 were followed for the chemical analyses.
c Loss of ignition indicates the weight loss due to calcinations at 975-1000ºC
d Percentage of Fe and Al oxides together.
Table 3. Porosity of the different mortars.
Porosity (%) Cement / Lime
0-1 1-8 1-4 1-2 1-1 2-1 1-0
B/Ag
1:2 23.06 22.14 22.44 22.59 22.39 21.86 20.91
1:3 20.87 20.57 21.41 21.37 21.62 21.45 20.62
1:4 20.41 19.16 21.03 21.46 21.47 21.17 20.49

Figure 1. XRD of the lime Ecobat® (C: Calcite (ICDD 05-0586); P: Portlandite (ICDD
44-1481)).
10 20 30 40 50 60 70 802θ
C
P
P
P P
P
P P P C C
P

Figure 2. XRD of the cement CEM II-A/L 32.5 (C: Calcite (ICDD 05-0586); 2:
Dicalcium silicate (ICDD 02-0843); 3: Tricalcium silicate (ICDD 02-0849); G: Calcium
sulphate hydrated (ICDD 01-0385); A: Calcium aluminate (ICDD 38-1429)), F:
Aluminoferrite (ICDD 85-1092).
0.01 0.1 1 100
10
20
30
40
50
60
70
80
90
100
Pas
sing
(%
)
Grain size (mm)
Figure 3. Grain size distribution of the aggregate.
10 20 30 40 50 60 70 80
G
G G
F
A
C C F C
2
C
C C C 2 3
2
2
2
2
2
2
2
3
3
3
3
3
3
3
3
3
2θ
F
F
F

0.01 0.1 1 10 100
0
20
40
60
80
100
B/Ag 1:2
0-1-2 1-8-18 1-4-10 1-2-6 1-1-4 2-1-6 1-0-2
Intr
usio
n (%
)
Diameter (m)
0.01 0.1 1 10 100
0
20
40
60
80
100
B/Ag 1:3
0-1-3 1-8-27 1-4-15 1-2-9 1-1-6 2-1-9 1-0-3
Intr
usio
n (%
)
Diameter (m)
0.01 0.1 1 10 100
0
20
40
60
80
100
B/Ag 1:4
0-1-4 1-8-36 1-4-20 1-2-12 1-1-8 2-1-12 1-0-4
Intr
usio
n (%
)
Diameter (m)
Figure 4. Cumulative pore size distributions (%) of the mortars with a B/Ag ratio of:
1:2, 1:3 and 1:4.

0 20 40 60 80 1002,68
2,72
2,76
2,80
2,84
2,88
2,92 B/Ag 1:2 B/Ag 1:3 B/Ag 1:4
DS
% Lime
Figure 5. Surface fractal dimension for the different mortars composition

0 50 100 150 200 250 300 350 4000
5
10
15
20
25
30
Com
pres
sive
Str
engt
h (N
/mm
2 )
Curing time (Days)
0 50 100 150 200 250 300 350 4000
5
10
15
20
Com
pres
sive
Str
engt
h (N
/mm
2 )
Curing time (Days)
0 50 100 150 200 250 300 350 4000
2
4
6
8
10
12
14
Com
pres
sive
Str
engt
h (N
/mm
2 )
Curing time (Days)
0 50 100 150 200 250 300 350 4000
1
2
3
4
5
6
7
8
Fle
xura
l Str
engt
h (N
/mm
2 )
0-1-2 1-8-18 1-4-10 1-2-6 1-1-4 2-1-6 1-0-2
Curing time (Days)

0 50 100 150 200 250 300 350 4000
1
2
3
4
5
6
0-1-3 1-8-27 1-4-15 1-2-9 1-1-6 2-1-9 1-0-3
Fle
xura
l Str
engt
h (N
/mm
2 )
Curing time (Days)
0 50 100 150 200 250 300 350 4000
1
2
3
4
5
0-1-4 1-8-36 1-4-20 1-2-12 1-1-8 2-1-12
1-0-4
Fle
xura
l Str
engt
h (N
/mm
2 )
Curing time (Days)
Figure 6. Compressive and flexural strength versus the curing time.
Figure 7. Compressive strength (N/mm2) vs. deformation (mm).
0.0 0.2 0.4 0.6 0.8 1.0 1.2 1.4 1.60
5
10
15
20
25
30
35
40
45
50 0-1-2 1-8-18 1-4-10 1-2-6 1-1-4 2-1-6 1-0-2
Com
pres
sive
Str
engh
t (N
/mm
2 )
Deformation (mm)

29
0 20 40 60 80 100
5
10
15
20
25
30
35
40
45 Compressive strength
B/Ag 1:2 B/Ag 1:3 B/Ag 1:4
You
ng's
Mod
ulus
(N
/mm
2 )
% Lime
0 20 40 60 80 100
2
4
6
8
10
12
14Flexural strength
B/Ag 1:2 B/Ag 1:3 B/Ag 1:4
You
ng's
Mod
ulus
(N
/mm
2 )
% Lime
Figure 8. Young’s modulus (N/mm2) at 365 days of flexural strength and compressive
strength.