PORCUPINE P H S DEVIL S TOWER N M 2015 PROGRESS REPORT … · To assess forest features promoting...
18
PORCUPINE POPULATION AND HABITAT SURVEY OF DEVIL’S TOWER NATIONAL MONUMENT: 2015 PROGRESS REPORT Prepared by: Douglas A. Keinath, Senior Zoologist Wendy A. Estes-Zumpf, Zoologist Ian Abernethy, Zoologist Wyoming Natural Diversity Database University of Wyoming 1000 E. University Ave., Dept. 3381 Laramie, Wyoming 82071 December 30, 2015 Prepared for: Rene Ohms Chief of Resource Management Devils Tower National Monument Devils Tower, WY 82714
Transcript of PORCUPINE P H S DEVIL S TOWER N M 2015 PROGRESS REPORT … · To assess forest features promoting...
PORCUPINE POPULATION AND HABITAT SURVEY OF
DEVIL’S TOWER NATIONAL MONUMENT:
2015 PROGRESS REPORT
Prepared by:
Douglas A. Keinath, Senior Zoologist
Wendy A. Estes-Zumpf, Zoologist
Ian Abernethy, Zoologist
Wyoming Natural Diversity Database
University of Wyoming
1000 E. University Ave., Dept. 3381
Laramie, Wyoming 82071
December 30, 2015
Prepared for:
Rene Ohms
Chief of Resource Management
Devils Tower National Monument
Devils Tower, WY 82714

Devil’s Tower Porcupine Report: 2015 2
INTRODUCTION
The porcupine (Erethizon dorsatum) is found throughout much of the United States and
Canada, however, most knowledge of porcupine ecology comes from studies in the eastern US
and boreal forests in Canada. Very little information is available on porcupine populations in
habitats of the intermountain west. Though anecdotally common in Devil’s Tower National
Monument (DETO), the density and population status of porcupines there is currently unknown.
Changes to forest resources in the monument, either through active management or natural
causes (e.g. pine beetle infestation) could impact porcupine populations in DETO.
The Wyoming Natural Diversity Database (WYNDD) collaborated with DETO to: 1)
conduct an inventory to determine current porcupine abundance on DETO, 2) assess habitat used
by porcupines on DETO for use in resource management decisions, and 3) establish a monitoring
plan that can be implemented by DETO staff to track population trends over time.
Porcupines are most easily surveyed during winter, when movement is restricted to travel
between diurnal dens and nocturnal foraging sites. Studies have reported that porcupines
typically will use the same den throughout the winter season, foraging in the same pocket of
trees all winter long (Dodge 1967, Woods 1973, Roze 1984). Snow tracks can be used to
determine where porcupines are denning and foraging. Furthermore, ‘damage pockets’ caused
by porcupines feeding on the bark of the same group of trees all winter long, are highly visible
by late winter and can serve as an index of porcupine abundance under certain scenarios
(Spencer 1964). Therefore, WYNDD attempted to use systematic snow track surveys in
combination with radio telemetry of individual porcupines to identify where porcupines were
denning and foraging in DETO, determine the number of porcupines using specific areas, and
describe damage pockets (number of trees, tree species, etc.).
Ultimately, WYNDD plans to use this information to estimate porcupine population size and
examine whether density of snow tracks or the number and size of damage pockets can be used
as an index of porcupine abundance in DETO. In addition to documenting the abundance of
porcupines in DETO and establishing a monitoring program for the monument, the proposed
study will also provide information on the location and type of den sites used by porcupines in
DETO and document which tree species are being used most heavily by overwintering
porcupines. This information could then be used to assess potential impacts to porcupine
populations on the monument by forest management activities and/or natural disturbances such
as pine beetle infestations and wildfire.
METHODS
Study Area
The study area encompassed all treed areas within the 1347-acre DETO boundary. Much of
the monument is dominated by Ponderosa pine (Pinus ponderosa) forest. Burr Oak (Quercus
macrocarpa) occurs along many drainage bottoms throughout the park and around the
administration buildings in the southern portion of the monument. Boxelder (Acer negundo) and
juniper (Juniperus scopulorum) also are sparsely distributed throughout the area surrounding the
administration buildings. The Belle Fourche River floodplain on the southern edge of the

Devil’s Tower Porcupine Report: 2015 3
monument supports a mature cottonwood (Populus deltoides) riparian forest. Aspen (Populus
tremuloides) are largely restricted to the edge of the talus slope at the base of the tower.
Survey Protocols
WYNDD conducted systematic, foot-based surveys across DETO from January 14, 2015
through February 19, 2015. The entire monument was divided into 6.25 hectare grid cells
(Figure 1; N = 97). One to three surveyors walked each cell looking for evidence of porcupines,
including tracks in the snow, evidence of foraging (i.e., scars on tree bark or nip-twigs; Roze
1989), or visual observations of porcupines. Surveyors walked non-overlapping paths at a
consistent pace, stopping periodically to scan nearby areas using 10X42 binoculars. All
evidence of porcupines was georeferenced using standard handheld GPS units (Garmin Oregon
450). Snow tracks were followed until the trail was lost or until a porcupine was found. We
characterized individual foraging trees by recording the tree species, the number of foraging
scars on the trunk and branches of the three, the diameter of the tree at breast height (DBH), and
the total height of the tree. DBH was measured using a Biltmore stick and/or diameter tape
(Moran and Williams 2002), and tree height was calculated using the sine method (Bragg 2008).
Groups of trees with evidence of feeding by porcupines that were within roughly 20 meters of
each other were classified as a ‘foraging pocket,’ and the number of trees in each foraging pocket
was tallied. We assigned a tentative age category to each foraging scar (pending further
investigation to accurately assess scar age) based on its overall appearance. Categories included
‘fresh’ (within the current winter; light-colored with a reddish boarder of fresh bark that was
flush with the chewed area), ‘moderate’ ( 1 – 3 years old; covered in dried, yellow sap and the
bark was raised relative to the level of the scar), or ‘older’ (> 3 years old; the sap had weathered
away to expose dried, gray wood).
Habitat
To assess forest features promoting porcupine occupation, we conducted tree density
transects centered on foraging pockets and compared that information to transects conducted at
random locations throughout DETO. Transects were belts 2 meters wide and 40 meters long.
All trees whose center fell within the belt were counted and the resulting tally was used to
estimate tree density within the transect. Transect results were then summarized to estimate tree
densities across the landscape. For each tree counted, we also recorded tree species, DBH, total
height of the tree, and whether the tree had evidence of foraging by porcupines.
In order to develop landscape habitat relationships for porcupine occurrence at DETO,
WYNDD is in the process of compiling a tree cover map of the monument digitized from
publically available aerial imagery (Figure 2). We believe this layer will be useful in explaining
porcupine occurrence on DETO, but may also be useful for other projects on the monument,
such as the ongoing efforts to identify roosting habitat for bat species. This data will be finalized
at the time of the final porcupine report and provided to DETO as a shapefile, but draft versions
can be obtained earlier if requested.
Capture and Marking
We attempted to capture each porcupine detected to assess sex, age, and health, and to
individually mark animal for abundance analyses. We captured porcupines in live traps set at the
base of occupied trees. Traps were checked multiple times each day to minimize the amount of

Devil’s Tower Porcupine Report: 2015 4
time animals spent in a trap. Captured porcupines were chemically immobilized using a
combination of Ketamine and Dexmedetomidine to minimize stress. All captured porcupines
were individually marked with a passive integrated transponder (PIT) tag implanted via
subcutaneous injection at the base of the tail. To facilitate individual identification during the
2015 field season without the need to physically recapture an animal we also used non-toxic
livestock spray paint to give each porcupine a unique color mark on the haunches. These color
marks proved easily visible from the ground and from a distance, minimizing stress to the
animals.
We fitted three porcupines with radio transmitters (Holohil Systems Ltd., Ontario, Canada) in
order to track daily activity patterns. Transmitters weighed 3.8g and were either glued to a small
cluster of quills between the shoulder blades or attached via a padded collar setup to minimize
chafing. We recorded the location of all porcupines found and attempted to relocate them on a
daily basis following initial observation. All capture and marking techniques were approved by
the University of Wyoming Institutional Animal Care and Use Committee (protocol
#20141113DK00132-01) and follow guidelines approved by the American Society of
Mammalogists for the use of wild mammals in research (Sikes et al. 2011).
RESULTS AND DISCUSSION
Summary of Survey Results
Of the 97 survey grid cells across DETO, 91 contained at least some tree cover and had
surveyable area within the monument. We surveyed 61 of the cells (67%) with tree cover at least
once during our month in the park (Figure 2). This represents roughly 75% of the treed area of
the monument, because numerous unsurveyed cells were only partially in DETO and had
fragmentary tree cover.
During this time we found six porcupines, captured five of them, and placed radio
transmitters on three. The primary method of finding porcupines was supposed to be snow
tracks, which we could then follow back to the trees where porcupines were foraging.
Unfortunately, survey efforts were hampered by warm temperatures and lack of snow during the
survey period. We found portions of tracks at several locations on the monument, but all tracks
were lost over bare ground before locating porcupines. All porcupines were found by observing
the animal in a feeding tree, either independently or following initial observation of fresh feeding
scars in nearby trees.
Of the known porcupines (Table 1), most were female. Given the low sample size and the
fact that there were at least 5 porcupines of unknown sex in the monument (see section on
Porcupine Abundance), we do not know if this represents a true sex bias of the animals at DETO.
All captured animals were adults older than 2 years and all appeared to be in good health.
The most common evidence of porcupines was feeding scars, where animals chewed bark off
trees to eat the cambium (Figure 3). Fresh scars (i.e., those created within the past few months)
were readily identifiable, because they were very light-colored, had a reddish boarder of fresh
bark that was flush with the chewed area, and sometimes had beads of clear, glistening sap
(Figure 3A). Fresh scars were most useful in determining locations of porcupines currently on
DETO. Older scars were more abundant on the DETO landscape than fresh scars, and likely will

Devil’s Tower Porcupine Report: 2015 5
prove useful in determining long-term habitat use on the monument. Scars that were presumably
a few years old were covered in dried, yellow sap and the bark was raised relative to the level of
the scar due to tree growth subsequent to when the scar was created (Figure 3B), while even
older scars were no longer yellow because the sap had weathered away to expose dried, gray
wood beneath. These age categories are very coarse assumptions based on general appearance.
More precisely determining the ages of these scar categories will help in assessing long term
habitat use trends on DETO (Spencer 1964).
Porcupine Abundance In the winter of 2014-15, we believe there were roughly 9-11 porcupines on DETO during the
time of our surveys. Estimated abundance is based on the following evidence.
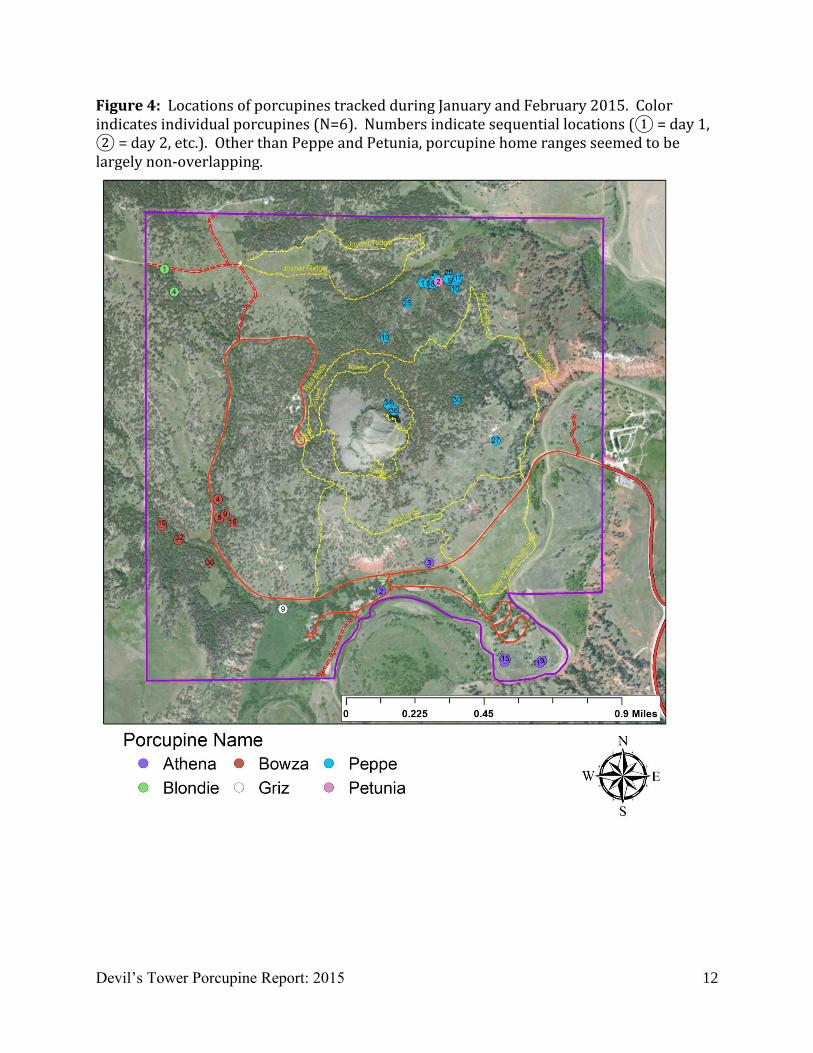
1. Known porcupines in DETO seemed to have largely non-overlapping ranges (Figures 5
and 6). Exceptions to this rule were Peppe and Petunia, which were both in the same
stand of ponderosa when we first found them. It is possible that this occurred because
they were of the opposite sex, with animals potentially defending foraging areas from
others of the same sex. However, Petunia left the area immediately after we captured her.
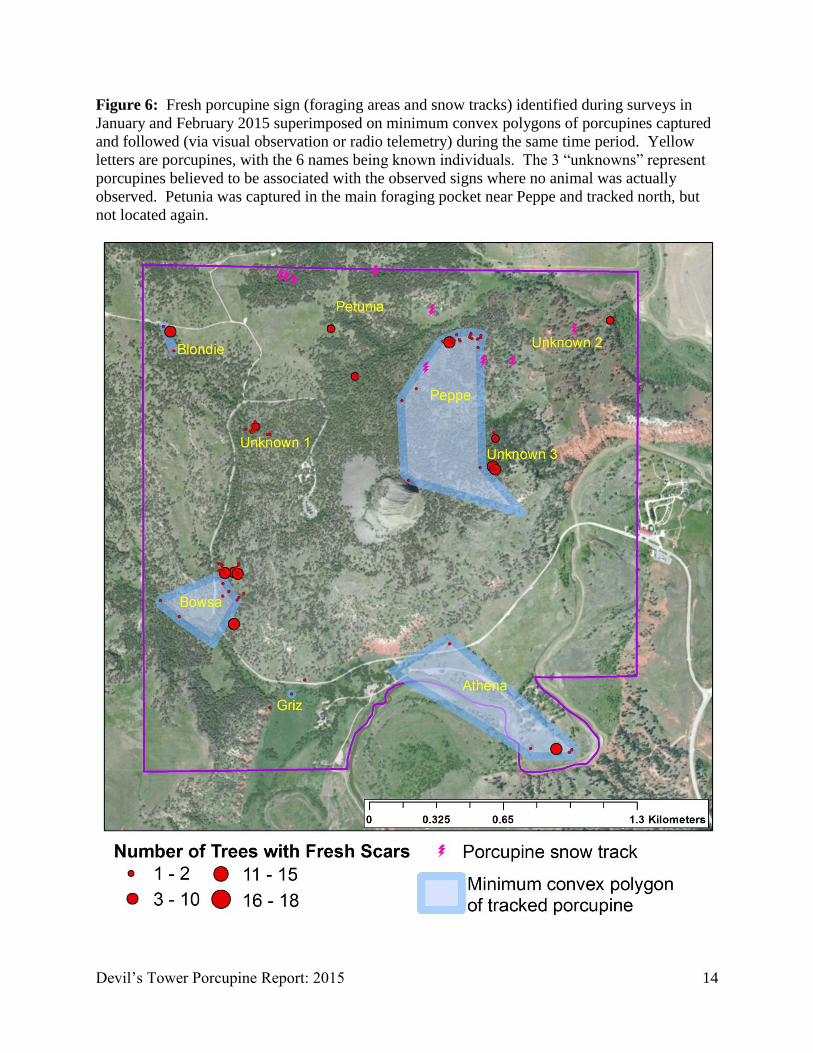
2. Areas where known porcupines were tracked seemed to reliably contain pockets of fresh
feeding scars found during surveys (Figure 6).
3. There were three pockets of fresh feeding scars not clearly attributable to known
porcupines, so it is likely that they represented 2 or 3 additional animals that we did not
detect (Unknowns 1 – 3 in Figure 6).
a. Unknown 1: This likely represents an undetected porcupine, as it was a very fresh
pocket isolated from all other animals, though one of the known porcupines could
have used this pocket earlier in the winter.
b. Unknown 2: We are less confident that Unknown 2 was an undetected animal,
because it was a small pocket that could have been one of the other porcupines
(e.g., Petunia, see below) passing through the area.
c. Unknown 3: We are fairly confident that Unknown 3 was an undetected animal
(or perhaps even two animals of opposite sex, similar to Peppe and Petunia),
because the associated feeding pocket was large, near a den, and showed fresh
feeding that occurred at roughly the same time that the nearest documented
porcupines (Peppe and Petunia) were known to be in the northern portion of the
monument.
4. Since we surveyed roughly 75% of the forested area of the monument, resulting in 8-9
porcupines, it is possible that another 2 porcupines (i.e., 0.25 * 8) occurred in unsurveyed
areas. However, we believe that the much of the unsurveyed portion of DETO
represented somewhat marginal habitat, primarily due to patchy tree cover. Thus, 2
additional porcupines occurring in unsurveyed areas is potentially an overestimate.
Petunia represents a confounding factor, because she dispersed north after we lost track of
her early in the study. We assume that she made the tracks and scars north of her capture site,
but there is an outside possibility that she then dispersed west or south and made the scars near
Unknown 1 or 2.

Devil’s Tower Porcupine Report: 2015 6
Porcupine Habitat
Habitat data are still being compiled, so this report contains only cursory information and
preliminary analyses. All data will be compiled and analyzed for the final project report.
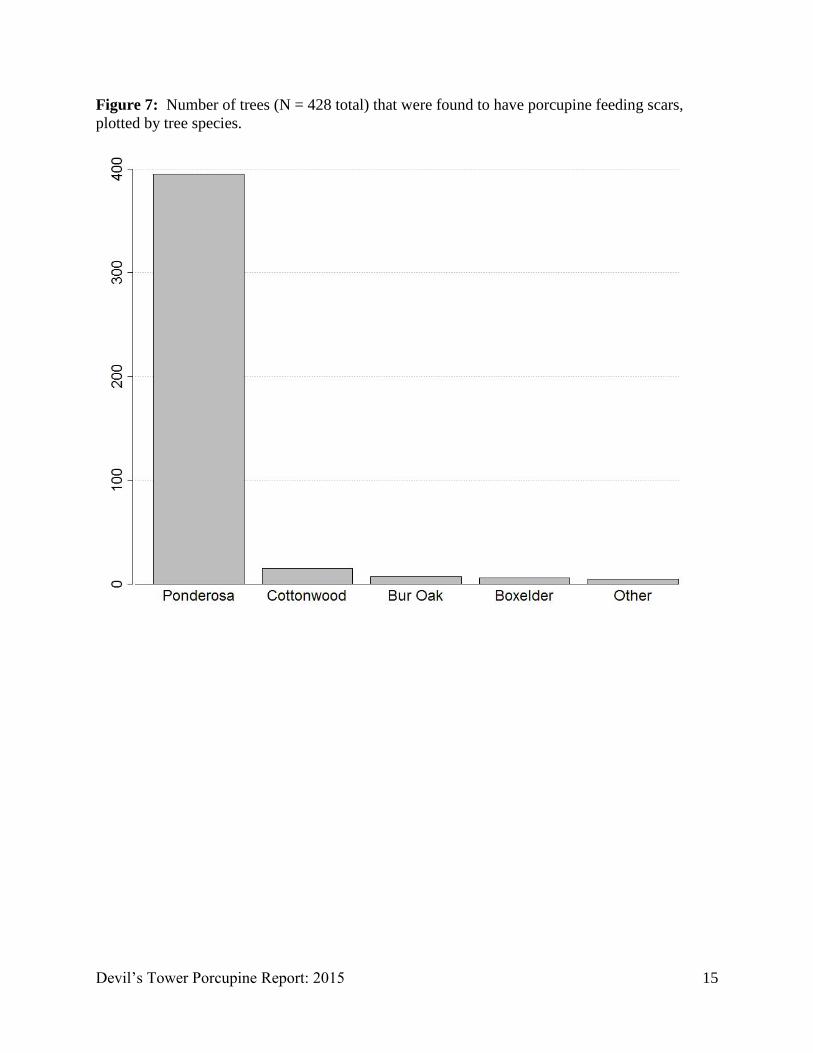
Porcupines appear to largely use ponderosa pine trees for winter foraging on DETO (Figure
7). However, all habitat data are not yet compiled, limiting our ability to determine if porcupines
are selecting ponderosa or if use is simply a function of there being far more ponderosa
available. At least two porcupines (Athena and Griz) were found predominantly feeding in
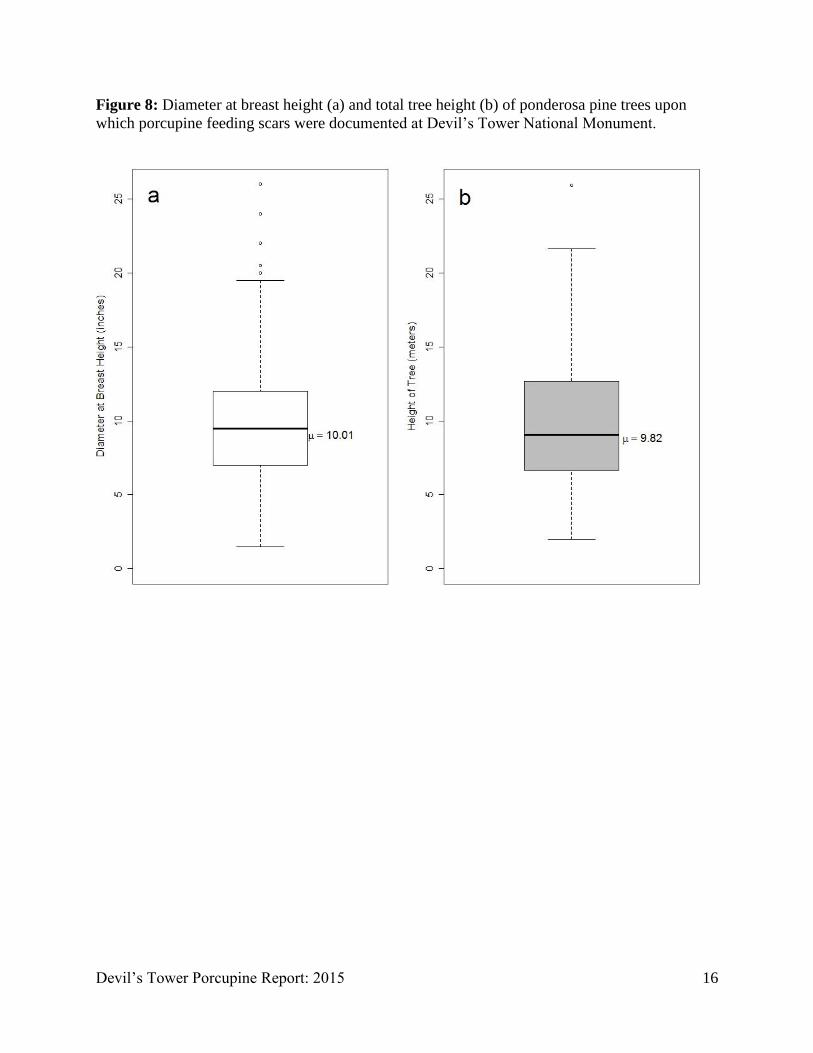
cottonwood trees. Ponderosa trees used as forage by porcupines were in middle size classes,
typically on the order of 10 inches DBH and 10 meters tall (Figure 8), though again we do not
have available size distributions compiled. Anecdotally, foraging pockets (i.e., collections of
proximate foraging trees where porcupines spend extended periods of time) seemed to be in
drainages, rather than ridges, and to occur in or on the edge of relatively dense forest.
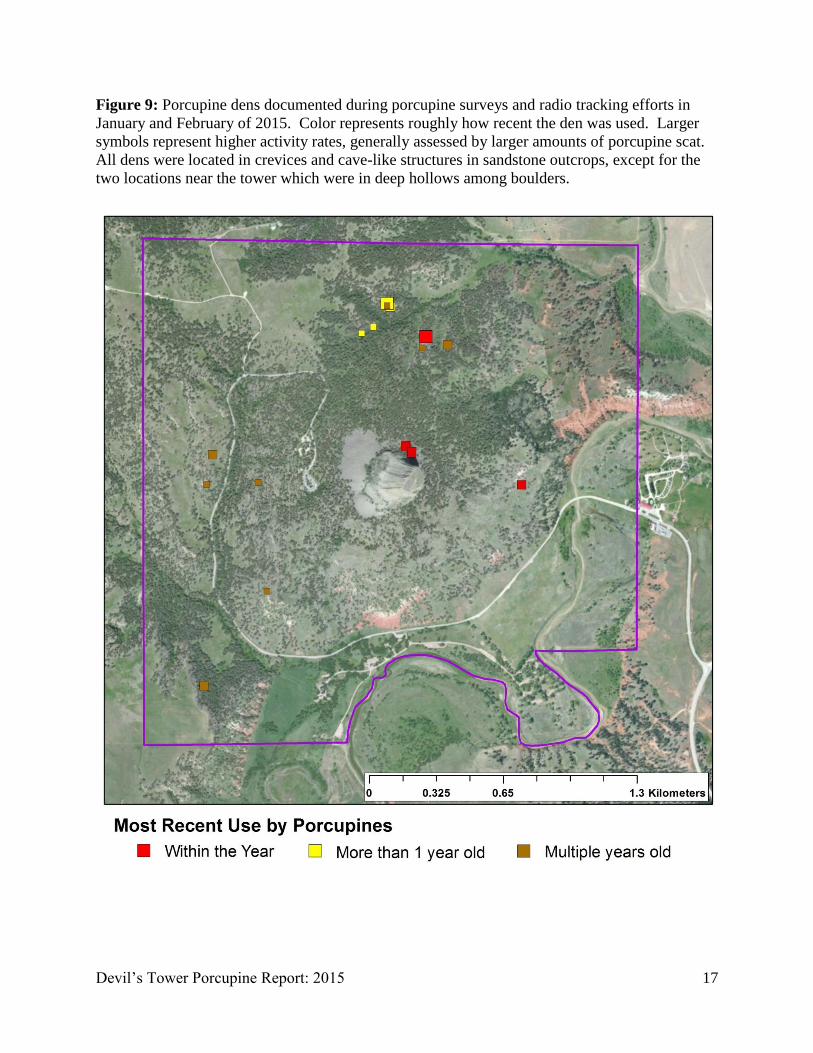
Although known porcupines primarily used trees as day roosts during the time of our
surveys, rather than retreating to dens, we documented 20 porcupine dens on the monument
(Figure 9). Of these, 18 dens were in rock caves in sandstone outcrops and were identified based
on tracks, accumulation of porcupine scat, or by tracking porcupines to their location. The
remaining 2 dens, both found by tracking Peppe while he had a radio transmitter, were among
the large boulders at the base of the tower. Cave dens tended to be south facing. It is possible
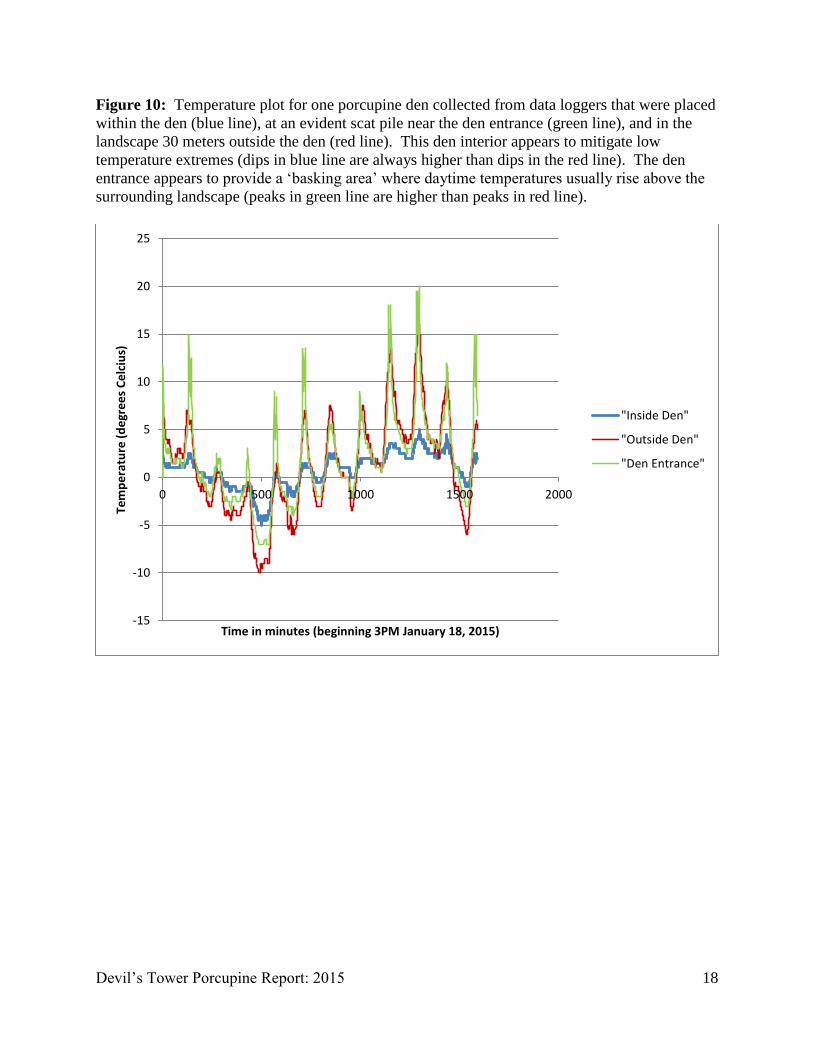
that they may have been chosen to mitigate temperature extremes of the surrounding landscape,
which would concord with studies in other areas. This was evidenced by temperature recordings
from data loggers placed at the entrance to one such den (Figure 10), which showed that low
temperatures within the den were higher than ambient temperatures, possibly providing a refuge
from the cold. This den also had an evident area of accumulated porcupine scat at its entrance,
suggesting that porcupines occupied that area. A temperature logger at that location showed
daytime temperatures substantially higher than ambient temperatures, possibly providing a
basking area with easy access to the den. Such conclusions are entirely speculative at this point.
We plan to place temperature sensors at multiple dens in 2016 to further investigate this pattern.
Next Steps
We will repeat our survey efforts in January and February of 2016 using substantially the
same methods. In addition to resurveying areas with documented, recent porcupine activity, we
hope to survey all previously unsurveyed grid cells in 2016, resulting in a comprehensive survey
of DETO over the course of two winters. As in 2015, we will document all evidence of
porcupines, particularly focusing on feeding scars. We will also complete collection of available
habitat data throughout DETO. Once we have surveyed all grid cells and fully compiled the
available habitat data, we will attempt to use this information to develop an occupancy-based
analysis in order to better assess habitat preferences within he monument.
Two additional pieces of data will be collected in 2016. First, to better inform habitat
analyses, we will attempt to assess the age of a representative sample of tree scars by counting
the number of growth rings occurring after the scar was made (Spencer 1964). Second, to better
understand den site selection, we will place temperature loggers at den sites (e.g., Figure 10), as
well as several random locations across the landscape of DETO.

Devil’s Tower Porcupine Report: 2015 7
Acknowledgements
We sincerely thank Richard Thiel (Wisconsin Department of Natural Resources) for his
insights on trapping, handling, and marking of porcupines. We also thank Jessica Sellers for her
tremendous help and expertise in the field. This project would not have been possible without
logistical support from Rene Ohms and many others at DETO.
REFERENCES
Bragg, D. C. 2008. An improved tree height measurement technique tested on mature southern
pines. Southern Journal of Applied Forestry 32:38-43.
Dodge, W. E. 1967. The biology and life history of the porcupine (Erethizon dorsatum) in
western Massachusetts.
Moran, L. A., and R. Williams. 2002. Field Note—Comparison of Three Dendrometers in
Measuring Diameter at Breast Height Field Note. Northern Journal of Applied Forestry
19:28-33.
Roze, U. 1984. Winter foraging by individual porcupines. Canadian Journal of Zoology 62:2425-
2428.
Roze, U. 1989. The North American porcupine. Smithsonian Institution Press Washington, DC.
Sikes, R. S., W. L. Gannon, and M. Amer Soc. 2011. Guidelines of the American Society of
Mammalogists for the use of wild mammals in research. Journal of Mammalogy 92:235-
253.
Spencer, D. A. 1964. Porcupine population fluctuations in past centuries revealed by
dendrochronology. Journal of Applied Ecology:127-149.
Woods, C. A. 1973. Erethizon dorsatum. Mammalian Species:1-6.

Devil’s Tower Porcupine Report: 2015 8
TABLES AND FIGURES
Table 1: Porcupines identified during surveys of Devil’s Tower National Monument in January
and February of 2015.
Porcupine
Name
Capture Date PIT Number Sex Age
(Years)
Weight
(kg)
Radio
Tagged
Peppe Jan 16 048-859-842 Male ~ 2 8.2 Yes
Petunia Jan 20 048-775-586 Female ~ 2 6.8 No
Bowsa Jan 29 048-572-010 Female * > 2 7.0 Yes
Athena Jan 29 048-620-863 Female > 2 7.24 Yes
Blondie Feb 11 048-578-318 Female > 2 8 No
Griz Not Captured None Unknown Unknown Unknown No
* Determination of sex for Bowsa was female, but technicians were not 100% sure of this
designation.

Devil’s Tower Porcupine Report: 2015 9
Figure 1: Percent tree cover in 25 meter pixels for all of Devil’s Tower National Monument,
digitized using digital imagery from ESRI.

Devil’s Tower Porcupine Report: 2015 10
Figure 2: Porcupine survey grid for Devil’s Tower National Monument displayed with sampling effort by grid cell in 2015.

Devil’s Tower Porcupine Report: 2015 11
Figure 3: Examples of fresh (A) and multiple year old (B) porcupine foraging scars on ponderosa pine trees. In older scars, the sap weathers away leaving bare, grey wood.
A B
Devil’s Tower Porcupine Report: 2015 12
Figure 4: Locations of porcupines tracked during January and February 2015. Color indicates individual porcupines (N=6). Numbers indicate sequential locations (① = day 1, ② = day 2, etc.). Other than Peppe and Petunia, porcupine home ranges seemed to be largely non-overlapping.

Devil’s Tower Porcupine Report: 2015 13
Figure 5: Locations of trees with porcupine foraging marks mapped during surveys conducted in
January and February 2015, with approximate age of foraging scars shown by color and groups
of proximate trees displayed as larger circles. Tree locations are superimposed on minimum
convex polygons of porcupines that were located during surveys and subsequent radio-tracking
efforts (see Figure 3 for locations on which polygons were based).
Devil’s Tower Porcupine Report: 2015 14
Figure 6: Fresh porcupine sign (foraging areas and snow tracks) identified during surveys in
January and February 2015 superimposed on minimum convex polygons of porcupines captured
and followed (via visual observation or radio telemetry) during the same time period. Yellow
letters are porcupines, with the 6 names being known individuals. The 3 “unknowns” represent
porcupines believed to be associated with the observed signs where no animal was actually
observed. Petunia was captured in the main foraging pocket near Peppe and tracked north, but
not located again.
Devil’s Tower Porcupine Report: 2015 15
Figure 7: Number of trees (N = 428 total) that were found to have porcupine feeding scars,
plotted by tree species.
Devil’s Tower Porcupine Report: 2015 16
Figure 8: Diameter at breast height (a) and total tree height (b) of ponderosa pine trees upon
which porcupine feeding scars were documented at Devil’s Tower National Monument.
Devil’s Tower Porcupine Report: 2015 17
Figure 9: Porcupine dens documented during porcupine surveys and radio tracking efforts in
January and February of 2015. Color represents roughly how recent the den was used. Larger
symbols represent higher activity rates, generally assessed by larger amounts of porcupine scat.
All dens were located in crevices and cave-like structures in sandstone outcrops, except for the
two locations near the tower which were in deep hollows among boulders.
Devil’s Tower Porcupine Report: 2015 18
Figure 10: Temperature plot for one porcupine den collected from data loggers that were placed
within the den (blue line), at an evident scat pile near the den entrance (green line), and in the
landscape 30 meters outside the den (red line). This den interior appears to mitigate low
temperature extremes (dips in blue line are always higher than dips in the red line). The den
entrance appears to provide a ‘basking area’ where daytime temperatures usually rise above the
surrounding landscape (peaks in green line are higher than peaks in red line).
-15
-10
-5
0
5
10
15
20
25
0 500 1000 1500 2000
Tem
pe
ratu
re (
de
gre
es
Ce
lciu
s)
Time in minutes (beginning 3PM January 18, 2015)
"Inside Den"
"Outside Den"
"Den Entrance"