POPULATION STATUS, DISTRIBUTION, AND HOME ......of nearly 4448 N (1000 lbs) (T.M. Thomas,...
72
1 POPULATION STATUS, DISTRIBUTION, AND HOME RANGE OF THE ALLIGATOR SNAPPING TURTLE (MACROCHELYS TEMMINCKII) IN THE SUWANNEE RIVER, FLORIDA BY TRAVIS M. THOMAS A THESIS PRESENTED TO THE GRADUATE SCHOOL OF THE UNIVERSITY OF FLORIDA IN PARTIAL FULFILLMENT OF THE REQUIREMENTS FOR THE DEGREE OF MASTER OF SCIENCE UNIVERSITY OF FLORIDA 2013
Transcript of POPULATION STATUS, DISTRIBUTION, AND HOME ......of nearly 4448 N (1000 lbs) (T.M. Thomas,...
1
POPULATION STATUS, DISTRIBUTION, AND HOME RANGE OF THE ALLIGATOR SNAPPING TURTLE (MACROCHELYS TEMMINCKII) IN THE SUWANNEE RIVER,
FLORIDA
BY
TRAVIS M. THOMAS
A THESIS PRESENTED TO THE GRADUATE SCHOOL
OF THE UNIVERSITY OF FLORIDA IN PARTIAL FULFILLMENT OF THE REQUIREMENTS FOR THE DEGREE OF
MASTER OF SCIENCE
UNIVERSITY OF FLORIDA
2013

2
© 2013 Travis M. Thomas

3
ACKNOWLEDGMENTS
I would like to thank my committee members: Perran Ross, Bill Pine, Rob
Fletcher, and Steve Johnson for their support. Brittany Burtner, Adam Casavant, Lauren
Cashman, Madeleine Cascarano, Kevin Enge, Michael Granatosky, Jerry Johnston,
Anthony Lau, Paul Moler, Eric Suarez, Mike Ruccolo, Bill Turner, and Allan “Woody”
Woodward assisted in the field. Natalie Lamneck provided radiographs. Katie Sieving
helped with study design. Savanna Barry and Erin Leone provided statistical
consultation. Ryan Butryn and Anna Farmer provided GIS assistance. Adam Kaeser
assisted with side-scan sonar mapping. Cameron Carter and Hugo Gianfrancesco
helped modify and repair equipment. Tim Donovan took photos and a video of the
project. Andrew Gude, Larry Woodward, Amy Thompson, Bobby Toothaker, Benjamin
Gill, Kevin Lamar, Joe Roman, and Brad Stanley facilitated research. Kenneth Krysko
vouchered photographs in the Florida Museum of Natural History. May Lehmensiek,
Derek Piotrowicz, Rick Stout, and Ben Williams supplied bait.
4
TABLE OF CONTENTS page
ACKNOWLEDGMENTS .................................................................................................. 3
LIST OF TABLES ............................................................................................................ 6
LIST OF FIGURES .......................................................................................................... 7
LIST OF ABBREVIATIONS ............................................................................................. 9
ABSTRACT ................................................................................................................... 10
CHAPTER
1 INTRODUCTION .................................................................................................... 12
The Alligator Snapping Turtle ................................................................................. 12
Natural History .................................................................................................. 12 Distributional Gap ............................................................................................. 15 Conservation Status ......................................................................................... 16 Status of Macrochelys in the Suwannee River ................................................. 17
Geomorphic Riverine Processes ............................................................................ 18
Objectives ............................................................................................................... 20 Turtle Relative Abundance and Density ........................................................... 20
Turtle Population Structure ............................................................................... 20 Turtle Home Range .......................................................................................... 20 Prevalence of Ingested Fish Hooks .................................................................. 21
2 METHODS .............................................................................................................. 24
Study Site ............................................................................................................... 24
Sampling ................................................................................................................. 25 Ultrasonic Telemetry ............................................................................................... 28
Habitat Mapping ...................................................................................................... 28 Bush Hook Surveys ................................................................................................ 29 Data Analyses ......................................................................................................... 29
Turtle Relative Abundance and Density ........................................................... 29 Turtle Population Structure ............................................................................... 30
Turtle Home Range .......................................................................................... 30 Prevalence of Ingested Fishhooks ................................................................... 31
3 RESULTS ............................................................................................................... 40
Turtle Relative Abundance and Density .................................................................. 40 Turtle Population Structure ..................................................................................... 40
Turtle Home Range ................................................................................................ 41

5
Prevalence of Ingested Fish Hooks ........................................................................ 42
4 DISCUSSION / CONCLUSION ............................................................................... 54
Hypotheses Revisited ............................................................................................. 54
Discussion .............................................................................................................. 55 Conclusions ............................................................................................................ 64
REFERENCES .............................................................................................................. 67
BIOGRAPHICAL SKETCH ............................................................................................ 72
6
LIST OF TABLES
Table page 3-1 Captures, trap nights, and mean Capture Per Unit Effort (CPUE) by reach
and site. .............................................................................................................. 44
3-2 Sex ratios for the entire sample and by reach. No adults were captured in Reach 6. ............................................................................................................. 44
3-3 Morphological measurements and masses of 132 Macrochelys captured in the Suwannee River. .......................................................................................... 45
3-4 Mean linear home range of Macrochelys with standard error for sex and reach. ................................................................................................................. 45
7
LIST OF FIGURES
Figure page 1-1 Genetic structure of Macrochelys showing both nuclear and mitochondrial
genetic variation among drainages. Used with permission from the authors (Echelle et al., 2010). .......................................................................................... 22
1- 2 The distributional gap within the range of Macrochelys. The distributional gap is made up of small coastal rivers including: the St. Marks, Aucilla, Ecofina, Fenhollaway, and Steinhatchee Rivers in Florida. .............................................. 22
1-3 Photograph of the open mouth of an adult Macrochelys (top to bottom) showing the nostrils, upper jaw, modified wormlike tongue, and lower jaw.. ...... 23
2-1 Map of the Suwannee River. .............................................................................. 32
2-2 Map of the Suwannee River showing 6 ecological reaches. ............................... 32
2-3 Photographs of Reach 1 showing high limestone banks and a narrow river channel.. ............................................................................................................. 33
2-4 Photographs of Reach 2 showing an increase in channel width and a reduction of limestone banks. ............................................................................. 33
2-5 Photographs of Reach 3 showing a wider channel and spring water flowing into the channel. Limestone banks are less frequent.. ........................................ 34
2-6 Photographs of Reach 4 showing wide channel with major spring input. Photos courtesy of Travis Thomas and Kevin Enge. .......................................... 34
2-7 Photographs of Reach 5 showing very wide channel, emergent vegetation, and expansive flood plain.. ................................................................................. 35
2-8 Photographs of Reach 6 (estuary) showing very wide channel, tidal salt marsh, and floodplain creek................................................................................ 35
2-9 Map of the Suwannee River showing 2 randomly selected study sites within each reach. ......................................................................................................... 36
2-10 Photographs showing traps set during this study.. ............................................. 37
2-11 Photograph showing modified trapping technique utilized within the estuary.. ... 37
2-12 Photographs of morphologic measurements being taken.. ................................. 38
2-13 Photographs showing mass of adult (above) and immature (below) turtles being taken.. ....................................................................................................... 38

8
2-14 Photograph showing the insertion of a Passive Integrated Transponder (PIT) tag into the ventral tail of a Macrochelys captured in the Suwannee River.. ....... 39
2-15 Photograph showing the attachment of an ultrasonic transmitter to the posterior carapace of a Macrochelys captured in the Suwannee River.. ............ 39
3-1 Catch Per Unit Effort (CPUE) by reach with standard error. Letters indicate significance. Reach 1 and 5 had relatively lower estimated abundance than Reaches 2, 3, and 4. .......................................................................................... 46
3-2 Estimation of adult turtle density by reach from a closed population model with standard error. Estimate is for 10km of river in each reach. ........................ 46
3-3 Size distribution for Macrochelys captured in the Suwannee River from 2011–2013.......................................................................................................... 47
3-4 Size distribution for Macrochelys captured in the Suwannee River by reach from 2011–2013. ................................................................................................ 48
3-5 Frequencies of captured Macrochelys with mass ≥ 45 kg by reach. ................... 49
3-6 Measurements of A) carapace length, B) mass, C) carapace width, D) plastron length, and E) head width of adult male and female Macrochelys using ANOVA with reach as a covariate. Letters indicate significance. .............. 50
3-7 Map showing 4 turtles located within the floodplain during high water levels in Reach 1. Different colors represent different turtles. .......................................... 51
3-8 Sonar map image showing turtle #115 frequently located around a cluster of submerged woody debris. .................................................................................. 51
3-9 Map showing turtle #31 frequently located in a small spring and spring run. ...... 52
3-10 Radiograph showing 3 fishing hooks in the upper gastrointestinal tract of a Macrochelys from the Branford site (Reach 3). .................................................. 52
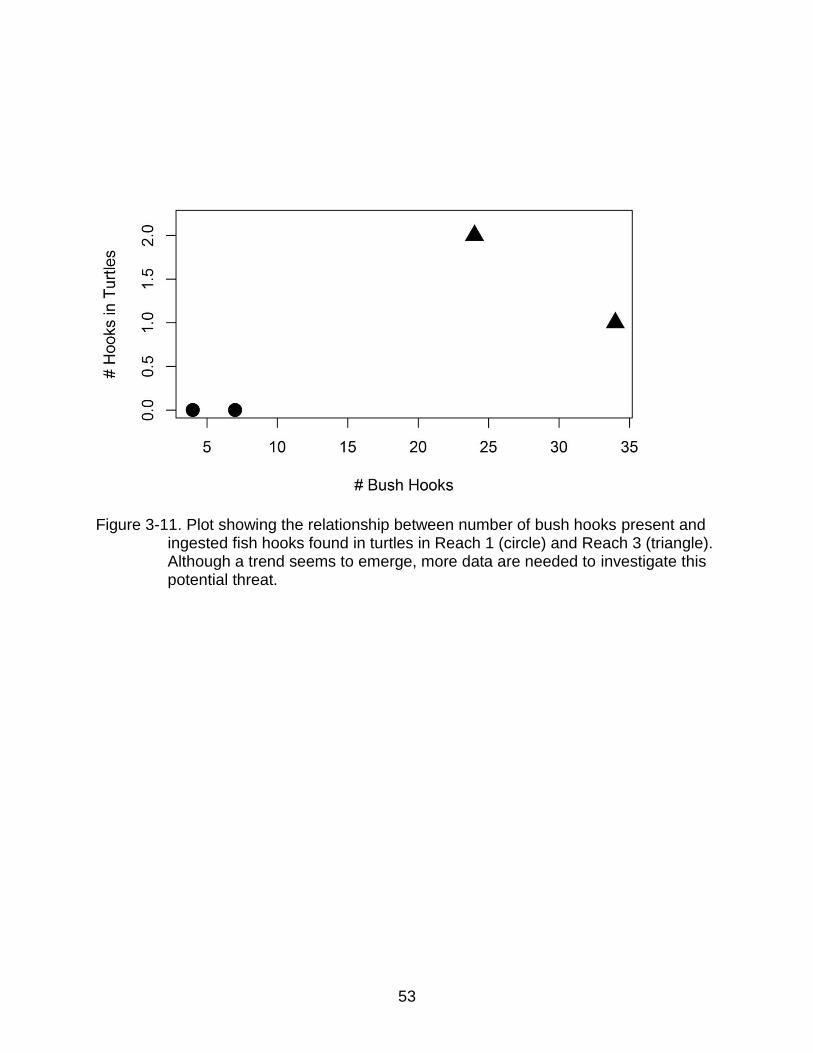
3-11 Plot showing the relationship between number of bush hooks present and ingested fish hooks found in turtles in Reach 1 (circle) and Reach 3 (triangle)... .......................................................................................................... 53
4-1 Photographs of damage ascertained from a boat propeller on 2 Macrochelys in the Suwannee River.. ..................................................................................... 66

9
LIST OF ABBREVIATIONS
ANOVA Analysis of variance
CITES Convention on International Trade in Endangered Species
CL Midline carapace length
CPUE Capture per unit effort
CW Carapace width
DNA Deoxyribonucleic acid
ESU Evolutionarily significant units
Fwc Florida Fish and Wildlife Conservation Commission
FLMNH Florida Museum of Natural History
GPS Global positioning system
HW Head width
MTDNA Mitochondrial deoxyribonucleic acid
NDNA Nuclear deoxyribonucleic acid
PCL Precloacal tail length
PIT Passive integrated transponder
PL Plastron length
PVC Polyvinyl chloride
RCC River continuum concept
SDI Sexual dimorphism index
SRWMD Suwannee River Water Management District
TL Tail length
USFWS United States Fish and Wildlife Service

10
Abstract of Thesis Presented to the Graduate School of the University of Florida in Partial Fulfillment of the Requirements for the Degree of Master of Science
POPULATION STATUS, DISTRIBUTION, AND HOME RANGE OF THE ALLIGATOR SNAPPING TURTLE (MACROCHELYS TEMMINCKII) IN THE SUWANNEE RIVER,
FLORIDA
By
Travis M. Thomas
December 2013
Chair: James Perran Ross Major: Wildlife Ecology and Conservation
The alligator snapping turtle (Macrochelys temminckii) has experienced
population declines throughout much of its range because of extensive harvest. Little is
known about the genetically and morphologically distinct population of Macrochelys in
the Suwannee River. In Georgia, efforts failed to capture Macrochelys in the Suwannee
River, creating concern about this species status. To determine the status of
Macrochelys in the Suwannee River, a mark-recapture and telemetry study was
conducted between 2011 and 2013. In total, 132 individual Macrochelys were captured
(21.2% juveniles, 17.4% females, and 61.4% males). Sex ratio was male-skewed
(3.5:1) and 41% of males weighed ≥45kg. Relative abundance and density estimates
revealed an uneven distribution of turtles throughout the river, with more productive river
sections maintaining higher population densities and larger turtles. Mean linear home
ranges were 1,896 m ± 252 m for males and 1,615 m ± 301 m for females. Telemetry
data revealed habitat use patterns not previously reported for Macrochelys, with
individuals making overland movements between the floodplain and river channel. Side-
scan sonar maps paired with turtle locations indicated coarse woody debris, undercut

11
banks and large rocks are important habitat during low water levels. Bush hook surveys
and radiographs revealed a positive correlation between bush hook abundance and
number of ingested hooks. Macrochelys in the Suwannee are more numerous than
previously thought; however, several threats exist including fish hook ingestion, boat
propeller damage, and the removal of woody debris.
12
CHAPTER 1 INTRODUCTION
The Alligator Snapping Turtle
Natural History
The alligator snapping turtle (Macrochelys temminckii) is the largest freshwater
turtle in the western hemisphere (Ernst et al., 1994; Pritchard, 2006). Macrochelys
possesses a carapace that is heavily serrated posteriorly with three longitudinal rows
of prominent keels. Pritchard (2006) discussed historical size of Macrochelys, but
many accounts are unconfirmed and anecdotal in nature. Pritchard (2006) mentioned
a record-sized (404-lb) specimen reported by Hall and Smith (1947); however, after
correspondence with one of the authors, he suggested that this record should not be
accepted. One well known trapper, Al Redmond, a 142-kg (313-lb) Macrochelys in
the 1970’s from the Flint River system in Georgia, but this record is also
questionable. The largest Macrochelys on record with a verifiable mass was an
individual that was captured in Texas and then kept in captivity in the Metropolitan
Toronto Zoo. In 1984, this turtle weighed 104.3 kg (230 lbs). While males potentially
reach large sizes, Macrochelys exhibit sexual dimorphism and females weigh much
less (Ernst et al., 1994; Pritchard, 2006).
Alligator snapping turtles are restricted to river systems and associated
wetlands that drain into the northern Gulf of Mexico from Florida to Texas (Pritchard,
2006). Macrochelys is characterized as a secretive turtle, often difficult to study in the
wild (Zappalorti, 1971; Elsey, 2006). Despite this, a considerable amount of
information is available on this species (Dolbie, 1971; Pritchard, 1979, 2006; Ernst et
al., 1994; Roman et al., 1999; Elsey, 2006; Riedle, 2006), but much remains
13
unknown about its basic ecology and conservation status (Pritchard, 2006; Roman et
al., 1999).
Macrochelys possesses a large head and powerful jaws used for crushing prey
items (Pritchard, 2006). For example, a 54.5-kg (120-lb) individual recorded a bite force
of nearly 4448 N (1000 lbs) (T.M. Thomas, unpublished data). Most knowledge
concerning food habits of Macrochelys is derived from anecdotal reports (see Pritchard,
2006) and a few studies conducted in the western part of their range (see Sloan et al.,
1996; Harrel and Stringer, 1997; Elsey, 2006). Dobie (1971) noted an unusual quantity
of acorns and palmetto berries in turtles from Louisiana. Macrochelys have been
reported feeding on fish, mollusks, crustaceans, small alligators (Alligator
mississippiensis), snakes, turtles, insects, birds, mammals, aquatic salamanders, and
plant material (Allen and Neill, 1950; Dobie, 1971; Sloan et al., 1996; Harrel and
Stringer, 1997; Elsey, 2006). This suggests that adult Macrochelys are opportunistic
scavengers (Elsey, 2006), but juveniles may be more reliant on their “lure” (a modified
tongue that resembles a worm) for prey capture (Spindel et al., 1987; Pritchard, 2006).
The diet of Macrochelys in Florida has not been studied.
Macrochelys are characterized as relatively sedentary (Ernst et al., 1994); but
Pritchard (2006) proposed that some individuals may constantly move upstream during
their lifetime. Telemetry studies in Missouri, Kansas, Oklahoma, and Louisiana showed
extensive turtle movements throughout available aquatic habitat, with resting or core
sites generally associated with greater habitat structure and denser canopy cover
(Sloan and Taylor, 1987; Shipman, 1993; Shipman et al., 1995; Riedle et al., 2006).
Most of these studies took place in the western part of Macrochelys’ range and were
14
conducted in lakes, impoundments, and small streams. Thus very little information
exists on turtle movements in large, free flowing river systems or in the eastern part of
their distribution.
Dobie (1971) dissected 231 Macrochelys that were harvested for meat by a
commercial fish-house in Louisiana and estimated that sexual maturity is reached in
11–13 years. However, other studies have shown sexual maturity requires 15–21 years
(Sloan et al. 1996, Tucker and Sloan 1997, Reed et al. 2002, Woolsey 2005).
Information on courtship is absent in this species (Pritchard, 2006), but copulation has
been witnessed by Allen and Neil (1950). According to Allen and Neil (1950),
copulation lasted from 5–25 minutes. Nesting typically occurs in the months of April,
May, and June (Dobie, 1971, Ewert, 1994). Nests are typically constructed in sandy soil
within 20 m of the water, but some nests may be as far away as 200 m (Ewert, 1994).
Macrochelys, like many other reptiles, has temperature-dependent sex determination. It
is believed that higher nesting temperatures produce more female turtles (Ewert, 1994).
Typically, Macrochelys lay one clutch a year, but some individuals may lay every other
year (Dobie, 1971). Clutch sizes in Louisiana had a mean of 24.5 (range 16–52). In
Florida, Ewert (1994) found clutch sizes averaged approximately 36 eggs (range 17–
52). In Florida, most eggs hatch in late August after 100−110 days of incubation (Ewert,
1994).
Molecular studies conducted on Macrochelys using both mitochondrial (mtDNA)
and nuclear (nDNA) revealed considerable genetic variation across its range (Roman et
al., 1999, Echelle et al., 2010; Figure 1-1). Roman et al. (1999) used mtDNA to propose
three distinct genetic assemblages (western, central, and Suwannee), with turtles from

15
the Suwannee River assemblage being the most distinct and showing a deep
separation from other drainages. Nuclear (nDNA) results suggests the presence of six
Evolutionarily Significant Units (ESU’s) within rivers inhabited by Macrochelys: (1)
Trinity, Neches, and Mississippi, (2) Pascagoula, (3) Mobile and Perdido, (4) Pensacola,
(5) Choctawhatchee, Econfina, Apalachicola, and Ochlockonee, and (6) Suwannee
River drainages, and this analysis also identified the Suwannee River assemblage as
most genetically distinct (Echelle et al., 2010).
Recent research suggests that morphological differences, corresponding to
previous molecular findings, also exist among Macrochelys populations, and currently
two new species of Macrochelys have been proposed based on these differences
(Thomas et al., in review).
Distributional Gap
Although this species is restricted to river systems that drain into the Gulf of
Mexico from Florida to Texas, there appears to be a distributional gap in the range of
this species. There are no confirmed records from several small coastal rivers including
the Steinhatchee, Fenholloway, Econfina, Aucilla, Wacissa, Saint Marks, and Wakulla
rivers (Ewert et al. 2006; Figure 1-2). Pritchard (2006) notes there are two
undocumented sightings from the Wacissa River. Additionally, the Florida Natural Areas
Inventory records include a live specimen observed in the Wakulla River, a dead
specimen from the St. Marks River, and a photo of a specimen in the “Woods and
Water” newspaper reportedly from the Aucilla River; however, it is impossible to truly
verify these anecdotal reports. To date, no official vouchered specimens exist between
the Suwannee and Ochlockonee River systems, and this apparent distributional gap
and geographic isolation have likely resulted in Macochelys in the Suwannee River
16
drainage being the most genetically and morphologically distinct (Thomas et al., in
review).
Conservation Status
Due to extensive commercial and non-commercial harvest, Macrochelys
populations have experienced significant declines across much of their geographic
range (Dobie, 1971; Ewert et al., 2006; Pritchard, 2006). Campbell’s Soup Company
was an alleged buyer of Macrochelys during the 1960’s and 1970’s for its canned
snapper soup (Pritchard, 2006). Officials from the Florida Game and Freshwater Fish
Commission reported that turtles were caught in great numbers from the Apalachicola
and Ochlockonee Rivers and presumably trucked to New Orleans to be sold for soup
(Pritchard, 2006). Al Redmond, a commercial fisherman, reportedly harvested 4000–
5000 adult Macrochelys from the Flint River system from 1971–1983 (Johnson, 1989).
Redmond reported that from the mid 1960’s until 1973, turtles were harvest in great
numbers in Mississippi, Louisiana, Georgia, Alabama, and Texas (Pritchard, 2006). In
1972, Florida was the first state to limit take on Macrochelys by passing regulation that
limited possession to one turtle per person. While this regulation still allowed for minimal
non-commercial harvest, it effectively banned any and all commercial harvest in Florida.
In 1983, Peter Pritchard petitioned the United States Fish and Wildlife Service
(USFWS) to list the species as Threatened under the U.S. Endangered Species Act;
however, according USFWS, it did not meet the requirements for listing. Today, the
management of this species continues largely at the state level, and Macrochelys is
afforded some protection in every state in which it occurs (Pritchard, 2006). In 2006,
responding to reports of extensive export to Asian food markets, Macrochelys was listed
in Appendix III of the Convention on International Trade in Endangered Species
17
(CITES), which now requires federal oversight and export permits that monitor and limit
international trade.
In addition to population declines due to harvest, human-altered landscapes and
the modification of rivers and subsequent loss of habitat are also a concern for the
viability of these populations ( Ewert et al., 2006). Abandoned trotlines (a long line with
shorter lines attached at intervals that possess hooks that are usually baited) have been
reported as a major problem in Georgia, and have been known to unintentionally
capture and drown Macrochelys (Pritchard, 2006). Ingested fishing tackle is a concern
because fishhooks can perforate the digestive tract and eventually cause death in
turtles. Several turtles in the Santa Fe River, a tributary of the Suwannee River, were
found to have ingested fishhooks (Thomas, unpublished data). Bush hooks set for fish
(a single baited fishhook, line, and and sinker attached to a branch overhanging the
river) are common in this system and are usually set in the evening and checked the
next day. Because of this, Macrochelys are more likely to come in contact with these
baited hooks due to their nocturnal activity. These and other anthropogenic threats that
lead to increased mortality rates represent a major concern to the long-term viability of
Macrochelys due to long generation times and low reproductive rates (Tucker and Sloan
1997, Reed et al. 2002); therefore, Macrochelys may require a long period of time for
populations to recover.
Status of Macrochelys in the Suwannee River
The Suwannee River is the southeastern most limit of the range of Macrochelys,
and questions concerning this population’s status have persisted for some time.
Although Moler (1996) reported the presence of Macrochelys in the Suwannee and
Santa Fe Rivers during a statewide survey, Pritchard (2006), citing mainly park

18
naturalists in Florida and Georgia, concluded that Macrochelys are scarce within the
Suwannee River and the Okefenokee Swamp. He suggested Macrochelys was more
numerous in years past, and populations may have declined since the 1930’s
(Pritchard, 2006). Surveys conducted in Georgia (Jensen and Birkhead, 2003) failed to
capture Macrochelys in the upper Suwannee despite intensive sampling, and the
authors suggested low pH and its effect on prey items along with impacts associated
with commercial harvest were possible explanations. Alternatively, Jensen and Birkhead
(2003) suggested that Macrochelys may not be common throughout the easternmost
part of their range.
Recent research has suggested that Macrochelys in the Suwannee are unique
from other populations which make the evaluation of its status important. As a proposed
new taxon limited to single river drainage, if Macrochelys is as scarce as previously
suggested, it may be of significant conservation concern and require special
management and protection. Therefore, establishing its true status (including
distribution, density, population structure, home range, habitat use, and threats), is
critical for the future management of this species. These are the questions I addressed
in this thesis.
Geomorphic Riverine Processes
Rivers, in their natural state, are linearly connected and highly dynamic
ecosystems (Decamps, 2011). Typically, rivers exhibit changes in a multitude of
characteristics (i.e., width, depth, velocity, flow volume, and temperature) from the
headwaters to the mouth (Vannote et al., 1980). The changes in patterns and processes
within lotic systems are oriented downstream (Ward, 1989; Townsend, 1996). The
constant change along a river can impede the detection of biological patterns crucial to

19
the management of imperiled species (Duncan, 2009). The River Continuum Concept
(RCC) is one construct to help explain how patterns and processes change
longitudinally in rivers and how they potentially affect biotic communities. Rivers
possess a continuous gradient of physical conditions that results in a continuum of biotic
adjustment as water travels downstream from the headwaters to the lower reaches
(Vannote, 1980). The RCC is based in part on the premise that energy input, organic
matter transport, storage, and use by macroinvertebrate feeding groups (shredders,
collectors, grazers, and predators) may be regulated largely by fluvial geomorphic
processes such that resources tend to increase downstream (Vannote, 1980).
Much of our current knowledge of stream and river ecology has come from
studies on fishes. Past studies have revealed that changes in riverine habitat can
potentially affect biological communities of aquatic insects (Roy et al., 2003), and fish
communities (Sutherland et al., 2002; Walters et al., 2003). However, little is known of
how changes in rivers potentially influence turtle communities.
The Suwannee River is the second largest river by drainage in Florida and
serves as a key geological and ecological break between the peninsula and panhandle
regions. During its course through North Florida, the Suwannee River experiences
geologic and physiogeologic longitudinal changes in water chemistry (Ceryak et al.,
1983). These changes in water chemistry led the Suwannee River Water Management
District (SRWMD) to divide the river into 6 distinct ecological reaches (Hornsby et al.,
2000). These ecological reaches within the Suwannee can be thought as sections of
river that share similar physical, chemical, and ecological conditions, and presumably,
different resources for Macrochelys.
20
Objectives
For this study, my goal was to answer questions regarding the status of
Macrochelys within the Suwannee River. Also, I investigated the effect of geomorphic
riverine processes, embodied by the six distinct ecological reaches, on Macrochelys
relative abundance, density, population size structure, and home range. Lastly, I
investigated the prevalence of ingested fish hooks in Macrochelys within the Suwannee
River.
Turtle Relative Abundance and Density
Question: Does ecological reach affect population abundance of the alligator
snapping turtle within the Suwannee River?
Hypothesis: Based on the RCC, I predict alligator snapping turtle abundance will
increase in the middle and lower reaches relative to upper reaches.
Turtle Population Structure
Question: Does ecological reach affect population structure (sex ratio and size
distribution) of the alligator snapping turtle within the Suwannee River?
Hypothesis: Based on the RCC, I predict that alligator snapping turtles will exhibit
no change in sex ratio among reaches and smaller size classes in the upper reach
relative to middle and lower reaches.
Turtle Home Range
Question: Does linear home range size differ in two distinct river reaches (Reach
1 and Reach 3)?
Hypothesis: Due to the increase in river productivity (predicted by both the RCC
and observed by the SRWMD (Hornsby et al., 2000), I predict alligator snapping turtles
in Reach 3 will exhibit smaller home ranges than turtles in Reach 1.

21
Prevalence of Ingested Fish Hooks
Question: Is the impact and threat to turtles from non commercial fisheries (e.g.
bush hooks) different in different reaches.
Hypothesis: I predict that the prevalence of ingested fish hooks will be higher in
the site with a higher number of bush hooks.

22
Figure 1-1. Genetic structure of Macrochelys showing both nuclear and mitochondrial
genetic variation among drainages. Used with permission from the authors (Echelle et al., 2010).
Figure 1-2. Map of distributional gap within the range of Macrochelys. The distributional
gap is made up of small coastal rivers including: the St. Marks, Aucilla, Ecofina, Fenhollaway, and Steinhatchee Rivers.
23
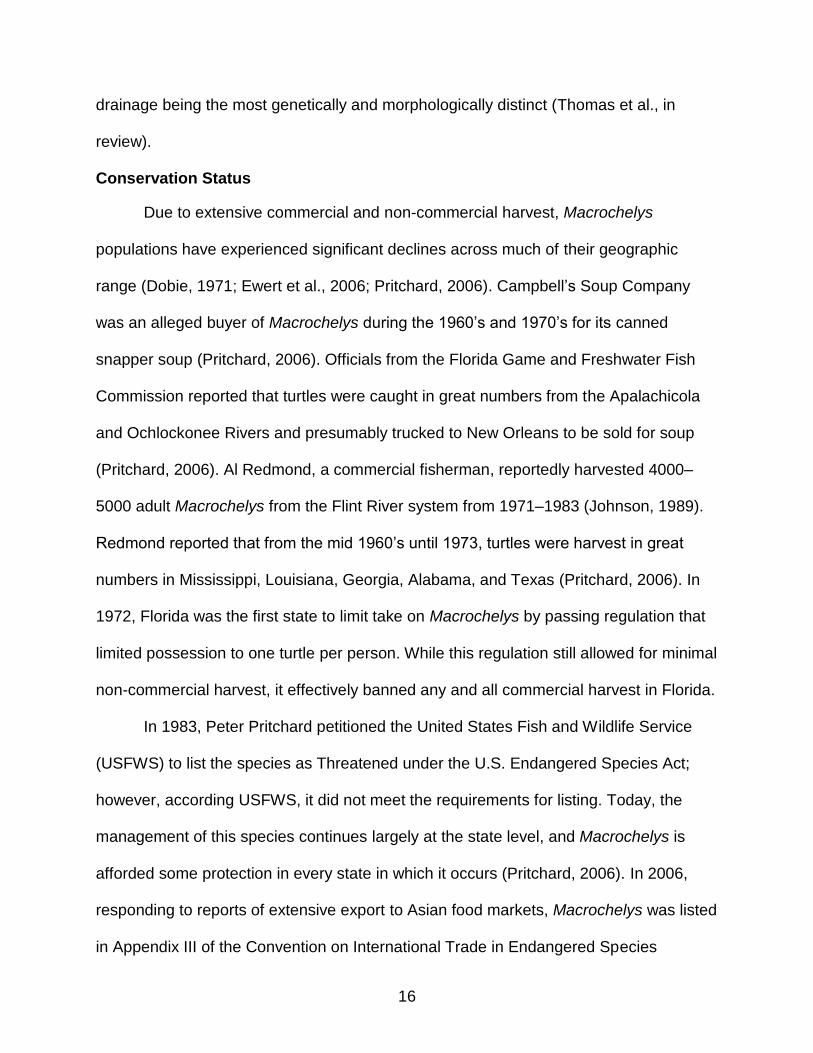
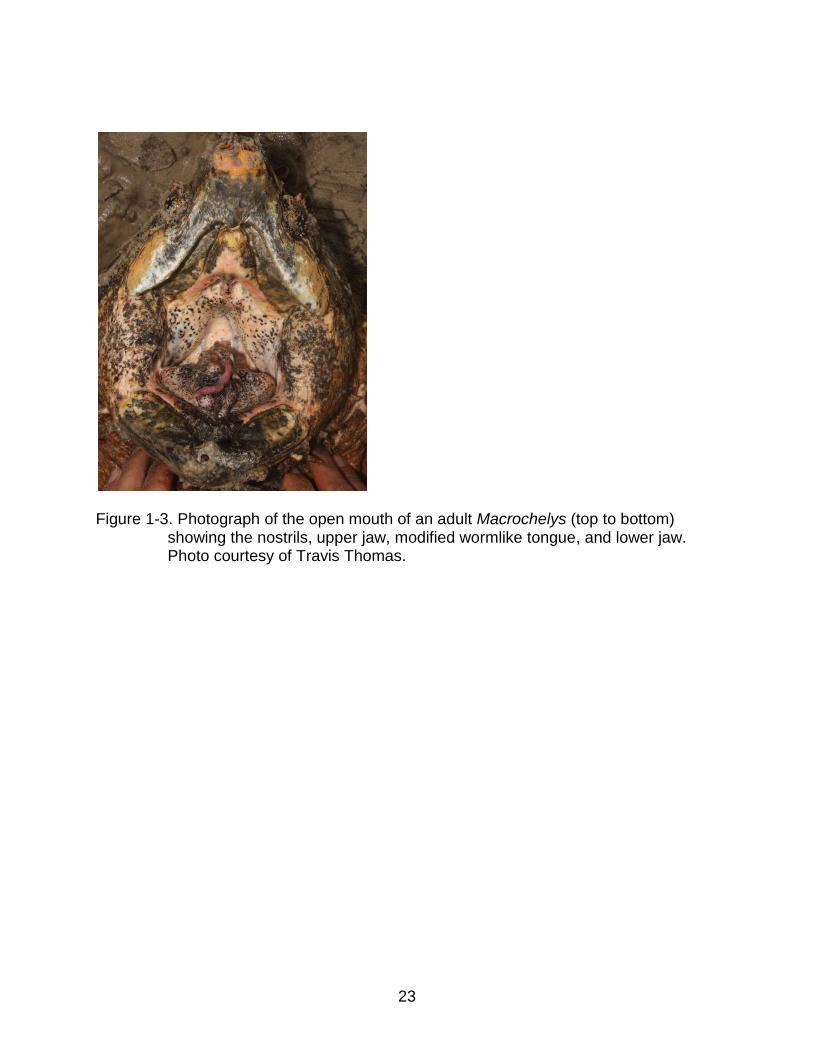
Figure 1-3. Photograph of the open mouth of an adult Macrochelys (top to bottom)
showing the nostrils, upper jaw, modified wormlike tongue, and lower jaw. Photo courtesy of Travis Thomas.

24
CHAPTER 2 METHODS
Study Site
The Suwannee River is a major river system of Florida and southern Georgia that
flows 378 km (235 miles) from the Okefenokee Swamp in southeastern Georgia to the
Gulf of Mexico in Florida (Figure 2-1). The Suwannee River experiences longitudinal
changes in water chemistry from the headwaters to the mouth (Ceryak et al., 1983) that
led the Suwannee River Water Management District (SRWMD) to divide the river into 6
distinct ecological reaches: Upper River Blackwater, Cody Scarp Transitional, Middle
River Calcareous, Lower River Calcareous, Tidal Riverine, and Estuarine (Hornsby et
al. 2000; Figure 2-2). These reaches are characterized by their chemical and ecological
features, including differing levels of biological productivity.
Reach 1 (Upper River Blackwater Reach; Figure 2-3) is characterized by deeply
incised limestone banks with a mostly shallow < 1m channel. The width of the river
varies from ca. 30–49 m with some shoals exposed along the river. The river in Reach 1
is a typical low-nutrient acidic blackwater stream.
Reach 2 (Cody Scarp Transitional Reach; Figure 2-4) has moderately incised
limestone banks; however, the channel widens to ca. 40–80 m in width. The channel is
still somewhat shallow with depths averaging ca. 1–2 m with numerous sandy and rocky
shoals along the river. Reach 2 experiences an increase in nutrients and biological
productivity, and this reach includes the confluences of two tributaries: the Alapaha and
the Withlacoochee Rivers. The Cody Scarp is a steep face that constitutes the most
prominent topographic feature in the state; it divides the Northern Highlands and Gulf

25
Coastal Lowlands physiographic regions. The Suwannee River is the only major stream
that does not go underground while crossing the Cody Scarp (Raulston et al. 1998).
Reach 3 (Middle River Calcareous Reach; Figure 2-5) has higher flows and a
larger floodplain. The river is significantly larger with deep pools and a wider channel of
ca. 80–100 m or more. Some limestone outcrops are still visible. Major springs are fairly
common within this reach. This reach crosses the Central Florida Ridges and Uplands
subregion and the Gulf Coast Flatwoods subregion.
Reach 4 (Lower River Calcareous Reach; Figure 2-6) begins at the Santa Fe
River confluence and lies entirely within the Gulf Coast Flatwoods subregion. The river
channel is 6−18 m deep and 122−152 m wide with coarse sand and exposed limestone
(Fig. 8). Shoals are absent, and major springs are found throughout the floodplain.
Reach 5 (Tidal River Reach; Figure 2-7) begins at the town of Fanning Springs
and also lies entirely within the Gulf Coast Flatwoods subregion. The river channel is
245−305 m wide and surrounded by tidal freshwater marsh. The deep channel is made
up of substrates such as limestone, coarse sand, and sandy mud. Two major springs,
Fanning and Manatee, are present. Tidal variation is evident, particularly during low-flow
conditions, and normally extends ca. 43 km upstream from the mouth.
Reach 6 (Estuary; Figure 2-8) has variable salinity and extends ca. 16 km
upstream from the mouth. About 10 km before it reaches the Gulf, the Suwannee
branches into West Pass and East Pass, which are up to 6 m deep and flow through a
broad delta area.
Sampling
The Suwannee River was divided into 5 km sections from White Springs to the
Gulf of Mexico. Two sections in each of the six distinct ecological reaches were

26
randomly selected as survey sites (Figure 2-9). Alligator snapping turtles were trapped
using custom single-funnel 4-ft (122 cm) diameter fiberglass hoop net traps with #36
twine and 1 7/8” (4.76 cm) square mesh. Typically, 12 traps were set at each site;
however, on a few occasions, inclement weather and water level extremes prevented
the full complement of traps from being set. Traps were baited with fresh-cut or fresh-
ground fish obtained from local fish markets and our trap by catch, and consisted of a
variety of different species such as Florida gar (Lepisosteus platyrhincus), red snapper
(Lutjanus campechanus), American gizzard shad (Dorosoma cepedianum), bowfin
(Amia calva), striped mullet (Mugil cephalus), grass carp (Ctenopharyngodon idella),
gulf flounder (Paralichthy albigutta), and triggerfish (Balistes sp). In order to effectively
sample for population data, traps were dispersed throughout each site. Traps were not
always set upstream from fallen trees, log jams, and undercut banks as suggested by
Moler, 1996; Jensen and Birkhead, 2004. Instead, traps were set from overhanging
branches, roots, or rocks in depths of 0.9– 2.7m (2-6 ft) in moderate current and with
the funnel opening facing downstream. The two front hoops were always sitting on the
bottom and traps were parallel to the bank with current moving directly through the
throat of the trap (Figure 2-10). In the estuary, modified traps were made by attaching
two traps together at the back with cable ties so that funnel openings would be facing
both upstream and downstream directions (Figure 2-11). This allowed traps to function
in shifting currents. Due to the lack of hanging branches in the estuary, we hammered 3
inch polyvinyl chloride (PVC) pipe into the substrate to which traps were attached. Traps
were set in the afternoon and checked the next morning.
27
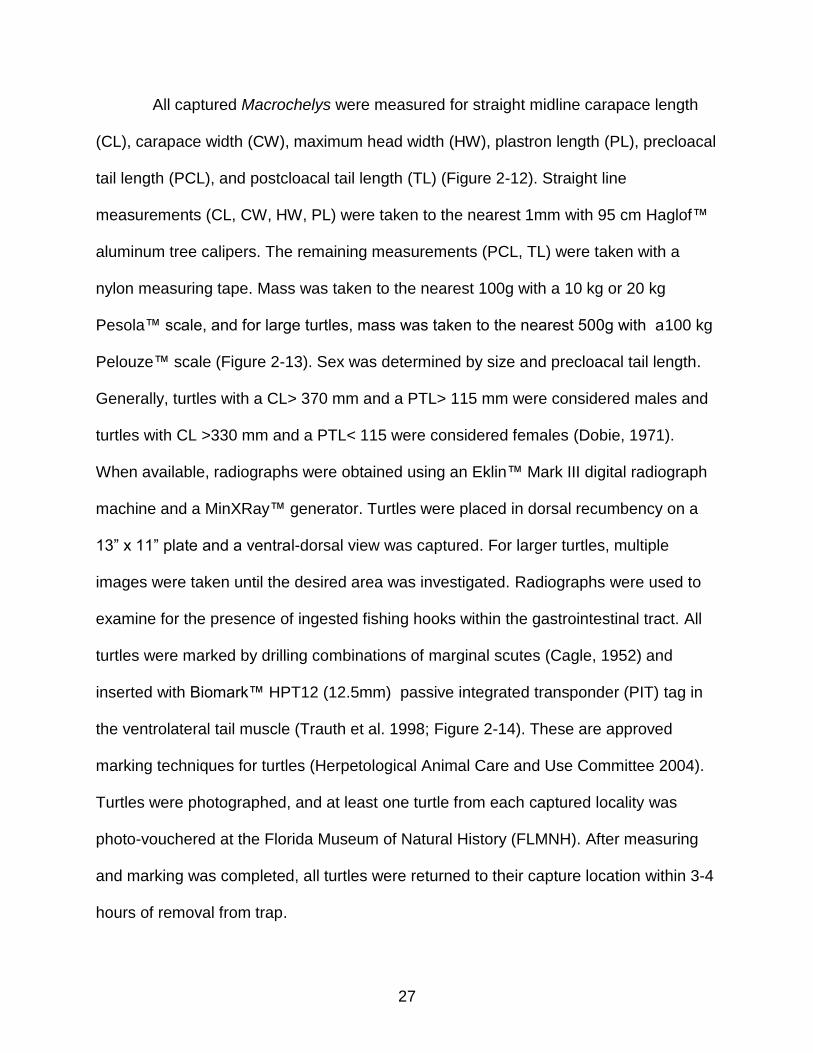
All captured Macrochelys were measured for straight midline carapace length
(CL), carapace width (CW), maximum head width (HW), plastron length (PL), precloacal
tail length (PCL), and postcloacal tail length (TL) (Figure 2-12). Straight line
measurements (CL, CW, HW, PL) were taken to the nearest 1mm with 95 cm Haglof™
aluminum tree calipers. The remaining measurements (PCL, TL) were taken with a
nylon measuring tape. Mass was taken to the nearest 100g with a 10 kg or 20 kg
Pesola™ scale, and for large turtles, mass was taken to the nearest 500g with a100 kg
Pelouze™ scale (Figure 2-13). Sex was determined by size and precloacal tail length.
Generally, turtles with a CL> 370 mm and a PTL> 115 mm were considered males and
turtles with CL >330 mm and a PTL< 115 were considered females (Dobie, 1971).
When available, radiographs were obtained using an Eklin™ Mark III digital radiograph
machine and a MinXRay™ generator. Turtles were placed in dorsal recumbency on a
13” x 11” plate and a ventral-dorsal view was captured. For larger turtles, multiple
images were taken until the desired area was investigated. Radiographs were used to
examine for the presence of ingested fishing hooks within the gastrointestinal tract. All
turtles were marked by drilling combinations of marginal scutes (Cagle, 1952) and
inserted with Biomark™ HPT12 (12.5mm) passive integrated transponder (PIT) tag in
the ventrolateral tail muscle (Trauth et al. 1998; Figure 2-14). These are approved
marking techniques for turtles (Herpetological Animal Care and Use Committee 2004).
Turtles were photographed, and at least one turtle from each captured locality was
photo-vouchered at the Florida Museum of Natural History (FLMNH). After measuring
and marking was completed, all turtles were returned to their capture location within 3-4
hours of removal from trap.
28
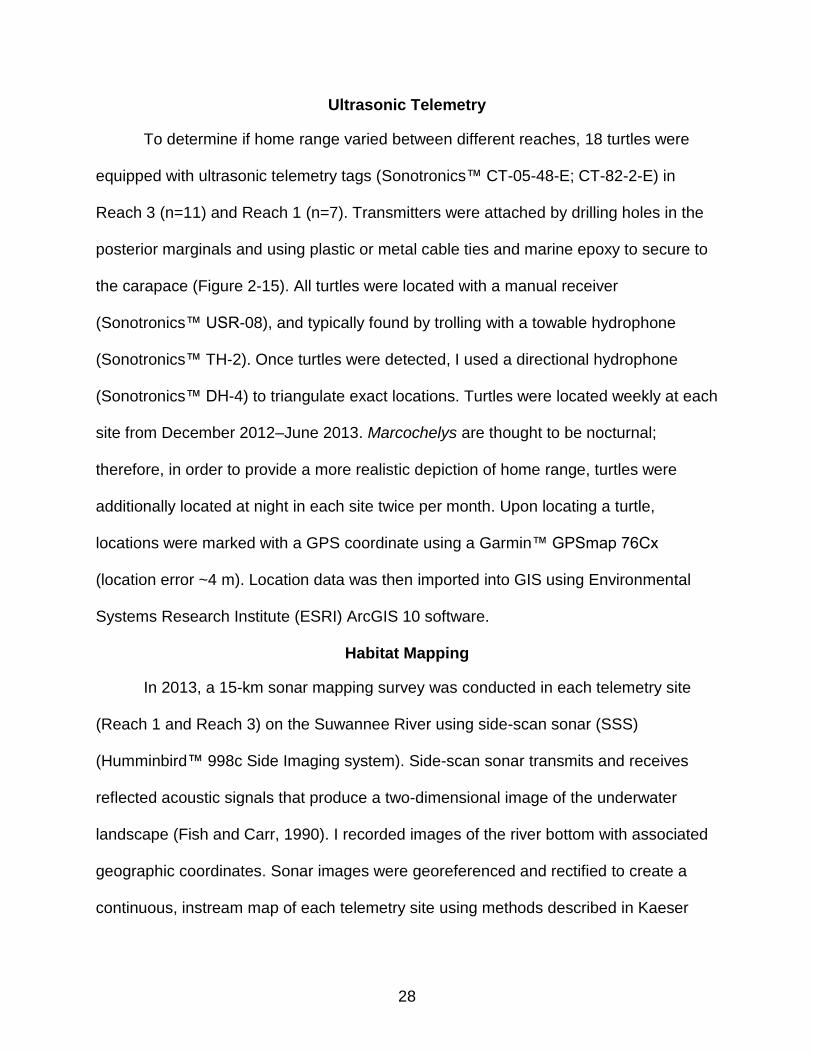
Ultrasonic Telemetry
To determine if home range varied between different reaches, 18 turtles were
equipped with ultrasonic telemetry tags (Sonotronics™ CT-05-48-E; CT-82-2-E) in
Reach 3 (n=11) and Reach 1 (n=7). Transmitters were attached by drilling holes in the
posterior marginals and using plastic or metal cable ties and marine epoxy to secure to
the carapace (Figure 2-15). All turtles were located with a manual receiver
(Sonotronics™ USR-08), and typically found by trolling with a towable hydrophone
(Sonotronics™ TH-2). Once turtles were detected, I used a directional hydrophone
(Sonotronics™ DH-4) to triangulate exact locations. Turtles were located weekly at each
site from December 2012–June 2013. Marcochelys are thought to be nocturnal;
therefore, in order to provide a more realistic depiction of home range, turtles were
additionally located at night in each site twice per month. Upon locating a turtle,
locations were marked with a GPS coordinate using a Garmin™ GPSmap 76Cx
(location error ~4 m). Location data was then imported into GIS using Environmental
Systems Research Institute (ESRI) ArcGIS 10 software.
Habitat Mapping
In 2013, a 15-km sonar mapping survey was conducted in each telemetry site
(Reach 1 and Reach 3) on the Suwannee River using side-scan sonar (SSS)
(Humminbird™ 998c Side Imaging system). Side-scan sonar transmits and receives
reflected acoustic signals that produce a two-dimensional image of the underwater
landscape (Fish and Carr, 1990). I recorded images of the river bottom with associated
geographic coordinates. Sonar images were georeferenced and rectified to create a
continuous, instream map of each telemetry site using methods described in Kaeser

29
and Litts (2008, 2010). Sonar maps were used with telemetry location data to help
identify subsurface habitat used by turtles.
Bush Hook Surveys
Bush hooks are a known source of ingestion of fish hooks by Macrochelys, and
to determine the abundance of available hooks, two surveys for bush hooks were
conducted in Reach 1 and Reach 3. Bush hooks were surveyed by floating a 5-km
section of river along each side of the river and counting the number of hanging lines
with baited and non-baited hooks.
Data Analyses
Turtle Relative Abundance and Density
Capture per Unit Effort (CPUE) can be used to approximate relative abundance.
CPUE for a given sampling event was determined by dividing the number of individuals
captured by the total number of trap nights or effort during the sampling event (1 trap
set over 1 night = 1 trap night). Because CPUE is a ratio and does not meet
assumptions of parametric analyses, I used program R to perform a non-parametric
analysis of variance (Kruskal-Wallis test) to determine if CPUE was equal in each reach.
In addition, Program MARK (version 2.0) was used to estimate population
abundance in each ecological reach. Adult capture-recapture data was organized in a
matrix and imported into Program MARK. I estimated capture-recapture probability and
abundance for each reach by treating reaches as groups in Program MARK. I fit two
models. The first model assumed capture-recapture probability differed by reach, and
the second model assumed capture-recapture probability were the same among
reaches. A closed model was used because telemetry data suggests Macrochelys have

30
limited linear home ranges within the Suwannee River. We assumed no immigration or
emigration during this short study period.
Turtle Population Structure
A chi-square test was used to determine if sex ratio differed significantly from 1:1.
Population structure was determined for the entire river and for each ecological reach. A
Mann-Whitney Rank Sum was used to compare morphological data between sexes. A
sexual dimorphism index (SDI, Equation 1) was used to compare mean sizes between
sexes (Lovich and Gibbons, 1992).
Eq. 2-1
ANOVA was used to compare CL, CW, HW, PL, and mass among reaches.
Separate ANOVAs were conducted for males and females for each response variable.
Data for all analyses were inspected to verify the assumptions of parametric analyses
were satisfied and data transformations were applied when necessary. All analyses
were conducted in Program R (R Development Core Team, 2012).
Turtle Home Range
Telemetry was used to locate turtles in Reach 1 and Reach 3. To determine if
home range varied between these two reaches, I measured the linear distance traveled
between the farthest upstream and downstream locations for 15 individual turtles. To
help minimize error, each turtle was analyzed independently. All measurements were
analyzed in ArcGIS 10 (ESRI, 2011). A t-test was used to determine if linear home
range differed between reach and sex. All statistical analyses were conducted in
Program R (R Development Core Team, 2012).

31
Prevalence of Ingested Fishhooks
In order to determine if the abundance of available fishhooks in two different
reaches had an effect on the prevalence of turtles with ingested hooks, data were
examine visually.

32
Figure 2-1. Map of the Suwannee River.
Figure 2-2. Map of the Suwannee River showing 6 ecological reaches.

33
Figure 2-3. Photographs of Reach 1 showing high limestone banks and a narrow river
channel. Photos courtesy of Travis Thomas and Kevin Enge.
Figure 2-4. Photographs of Reach 2 showing an increase in channel width and a
reduction of limestone banks. Photos courtesy of Travis Thomas, Kevin Enge and Tim Donovan.

34
Figure 2-5. Photographs of Reach 3 showing a wider channel and spring water flowing
into the channel. Limestone banks are less frequent. Photos courtesy of Travis Thomas and Kevin Enge.
Figure 2-6. Photographs of Reach 4 showing wide channel with major spring input.
Photos courtesy of Travis Thomas and Kevin Enge.

35
Figure 2-7. Photographs of Reach 5 showing very wide channel, emergent vegetation,
and expansive flood plain. Photos courtesy of Travis Thomas and Kevin Enge.
Figure 2-8. Photographs of Reach 6 (estuary) showing very wide channel, tidal salt
marsh, and floodplain creek. Photos courtesy of Travis Thomas and Kevin Enge.

36
Figure 2-9. Map of the Suwannee River showing 2 randomly selected study sites within
each reach.

37
Figure 2-10. Photographs showing traps set during this study. Photos courtesy of Travis
Thomas, Kevin Enge, and Tim Donovan.
Figure 2-11. Photograph showing modified trapping technique utilized within the
estuary. Photo courtesy of Travis Thomas and Kevin Enge.

38
Figure 2-12. Photographs of morphologic measurements being taken. Photos courtesy
of Travis Thomas and Kevin Enge.
Figure 2-13. Photographs showing mass of adult (above) and immature (below) turtles
being taken. Photos courtesy of Travis Thomas and Kevin Enge.

39
Figure 2-14. Photograph showing the insertion of a Passive Integrated Transponder
(PIT) tag into the ventral tail of a Macrochelys captured in the Suwannee River. Photo courtesy of Travis Thomas and Kevin Enge.
Figure 2-15. Photograph showing the attachment of an ultrasonic transmitter to the
posterior carapace of a Macrochelys captured in the Suwannee River. Photo courtesy of Travis Thomas and Kevin Enge.
40
CHAPTER 3 RESULTS
Turtle Relative Abundance and Density
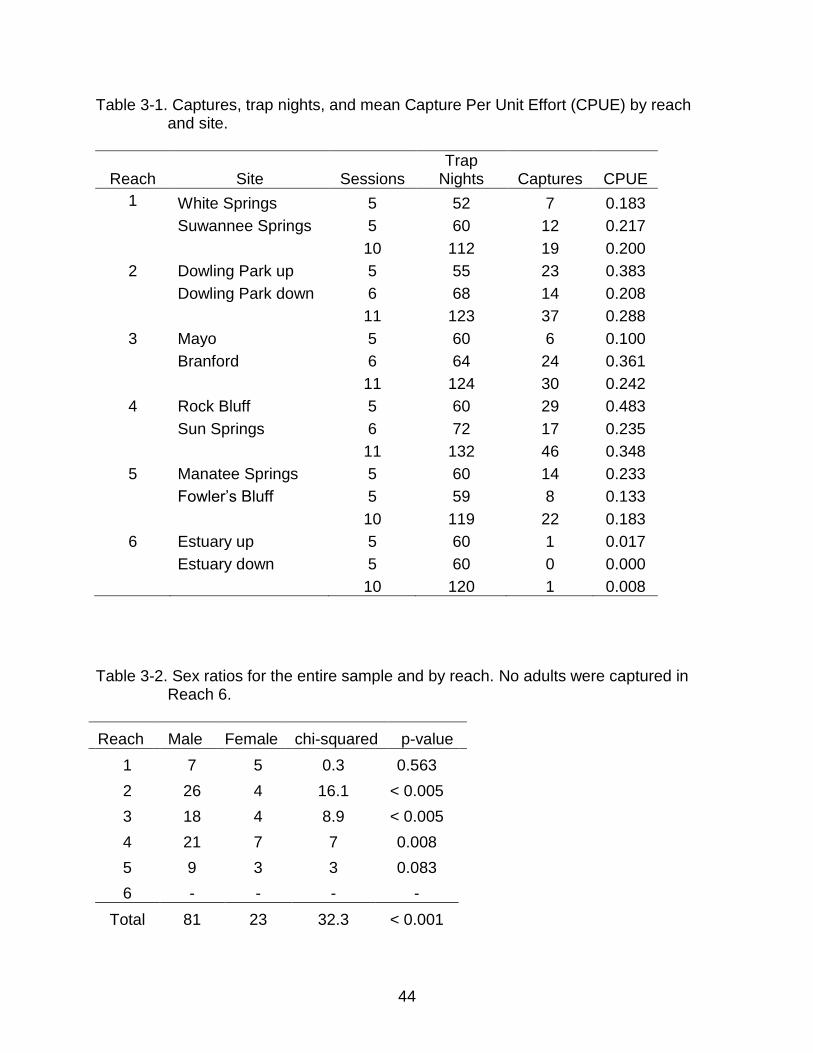
In all, 132 individual Macrochelys were captured (161 total captures and 29
recaptures) within the Suwannee River in 742 trap nights (CPUE=0.217). One turtle was
opportunistically hand captured and 5 turtles were captured outside of the 5-km
sampling sites; however, these turtles were not included for capture-recapture or CPUE
analysis. Turtles were captured in 11 of 12 sites and 6 of 6 ecological reaches (Table 3-
1). The only site that did not produce a capture was the lower estuary.
When data were subdivided according to reach, capture per unit effort (CPUE)
varied significantly among reaches (Kruskal-Wallis F5,57 = 21.8935, p < 0.001). Multiple
pairwise comparisons revealed Reach 6 had significantly lower CPUE than Reaches 2,
3, and 4 (Figure 3-1). Although not significantly different, Reaches 1 and 5 had an
observably lower CPUE than reaches 2, 3, and 4.
The model assuming different capture-recapture by reach did not converged for
several reaches due to the low number of recaptures. Perimeter estimates from the
second model which assumed a common capture-recapture probability among reaches
produced reasonable estimates of capture probability and recapture probability as well
as abundance. Abundance estimates from this model strongly agreed with CPUE
results and showed different abundances among different reaches. Reach 1 and 5 had
relatively lower estimated abundance than Reaches 2, 3, and 4 (Table 3-2; Figure 3-2).
Turtle Population Structure
The total sample consisted of 28 (21.2%) immature individuals, 23 (17.4%) adult
females, and 81 (61.4%) adult males. For the entire river, sex ratios differed significantly
41
from 1:1 (χ2=32.3, p < 0.0001) and was 3.5:1 in favor of males. Sex ratio varied among
reaches and were significantly biased towards males in Reaches 2, 3, and 4; however,
sex ratio did not differ significantly from 1:1 in Reaches 1 and 5 (Table 3-3). All size
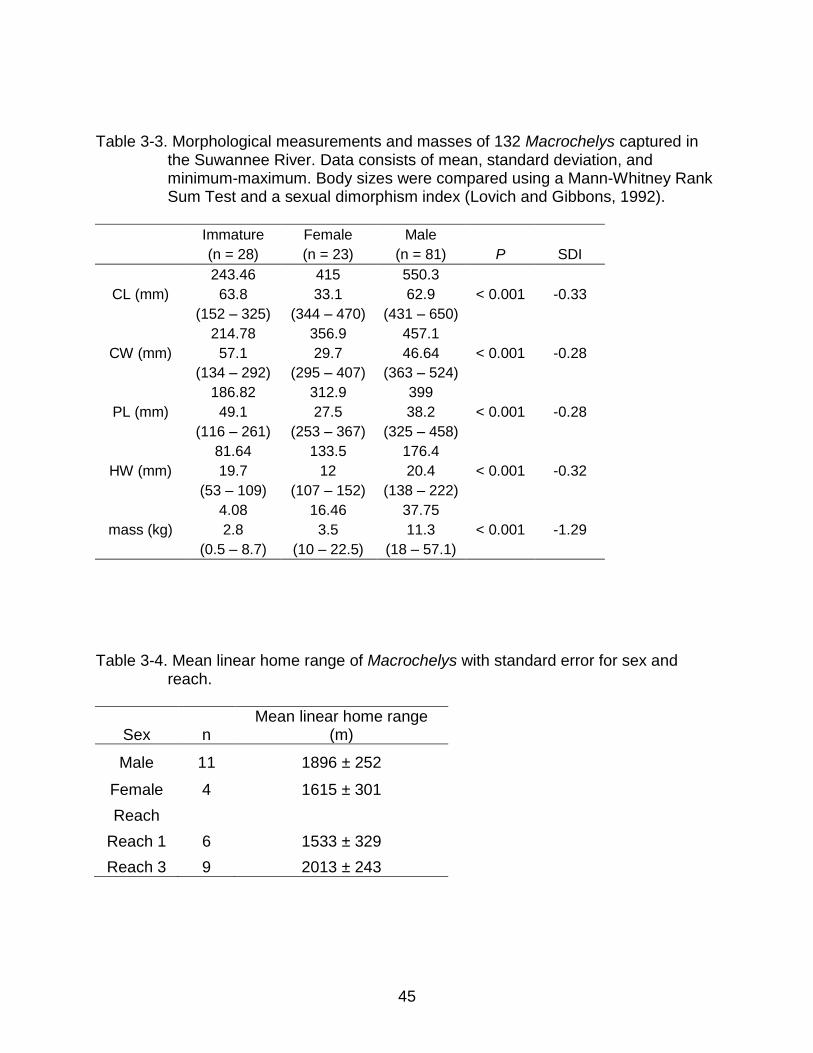
classes between 152 mm and 650 mm were represented. The heaviest individual
captured was a turtle with a mass of 57.15 kg, while the lowest mass recorded was a
500-g individual. As expected, adult males were significantly larger than adult females
for CL, CW, PL, HW, and mass, and sexual dimorphism indices were -0.33 (CL), -0.28
(CW), -0.28 (PL), -0.32 (HW), and -1.29 (mass) (Table3-4).
The entire sample exhibited a right skew toward larger (CL) individuals (Figure 3-
3), but when data are examined by reach, it is obvious that larger individuals are
observed more frequently in Reaches 2, 3, and 4 (Figure 3-4). In total, 33 out of 81
(41%) adult males weighed 45 kg (100 lbs) or greater. The number of 45-kg males
observed varied dramatically among reach, with the greatest number of large males
observed in Reaches 2, 3, and 4 (Figure 3-5).
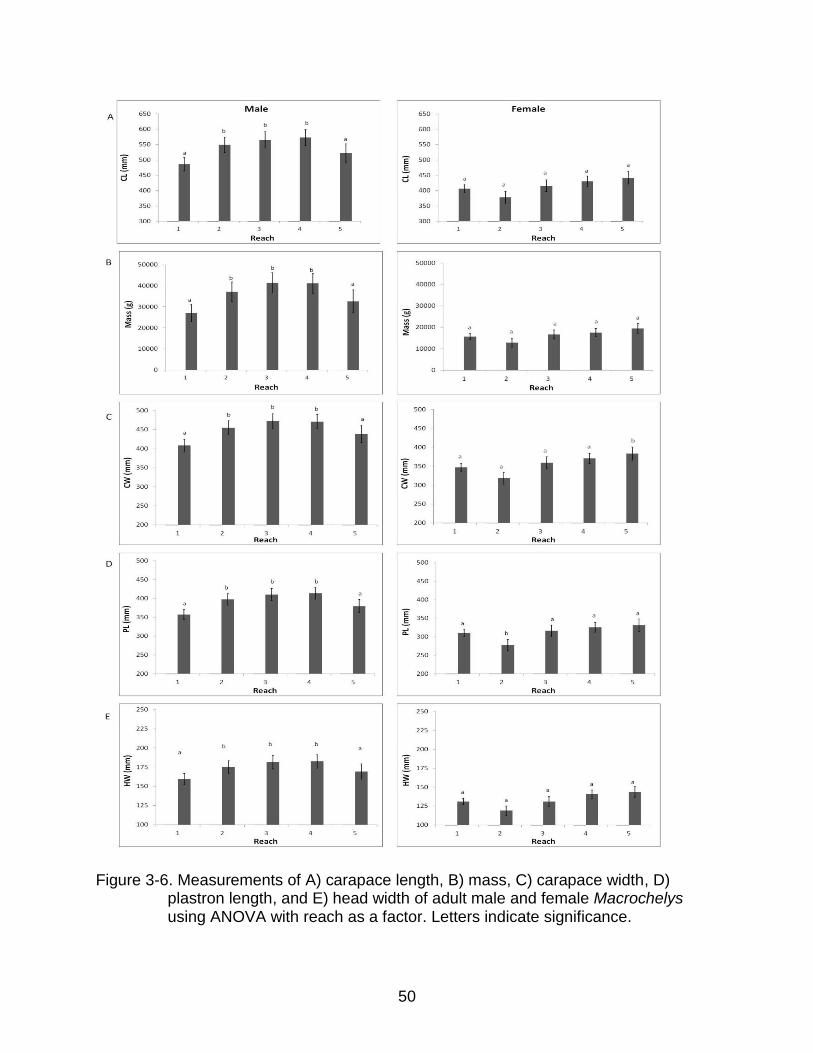
Adult males were significantly larger in CL, CW, PL, HW, and mass within the
middle river, Reaches 2, 3, and 4 (Figure 3-6). Adult females were not significantly
different in CL and mass among reaches, but significance was detected in PL in Reach
2 and CW in Reach 5 (Figure 3-6).
Turtle Home Range
Sixteen of the18 turtles were located after release. In Reach 3, 2 turtles were
never located, and 1 turtle was lost after a month of tracking and was excluded from
analysis. Linear home range did not vary significantly between reach (t=1.1723,
p=0.2681). Turtles in Reach 3 had a mean linear home range of 2,013 m ± 243 m, and
turtles in Reach 1 had a mean linear home range of 1,533 m ± 329 m. Overall, adult

42
males exhibited a slightly larger mean linear home range (1,896 m ± 252 m) than
females (1,615 m ± 301 m); however, there was a no evidence that these were
statistically different (t= -0.7174, p=0.4947). Although no significance was detected,
several interesting behaviors were observed. Turtles at each site were tracked
repeatedly moving back and forth between the floodplain and the river channel with no
aquatic corridor (i.e. overland movement). Telemetry conducted at night found turtles
were mostly active, whereas day time tracking found turtles to be inactive and under
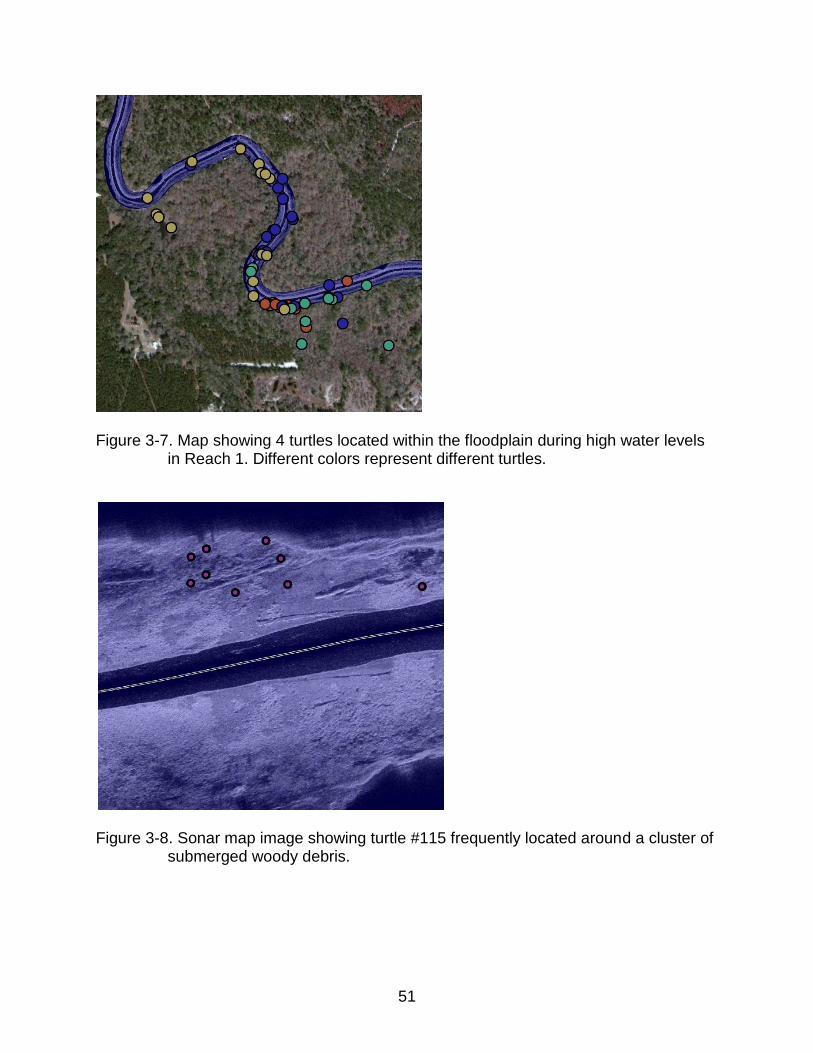
some type of cover or refuge. Sonar mapping revealed turtles used different habitat as
water levels fluctuated. During high water levels turtles were located in floodplains and
were more likely to be located under trees and among roots systems associated with
trees (Figure 3-7). During periods of lower water levels turtles were found using
undercut banks, large rocks, and wood debris within the channel of the river (Figure 3-
8). A large male turtle was frequently located in a spring and spring run in Reach 3
(Figure 3-9).
Prevalence of Ingested Fish Hooks
Two separate surveys for bush hooks were conducted in June of 2013 and
September of 2013 in Reach 1 and Branford Reach 3. During the June sample, 7 bush
hooks were observed in Reach 1 and 34 bush hooks were found in Reach 3. In
September, 4 bush hooks in Reach 1 were observed and 24 in Reach 3; however, high
water levels made lines difficult to detect. Overall, Reach 3 averaged more bush hooks
than Reach 1. Seven turtles were radiographed in Reach 1 and 12 turtles were
radiographed in Reach 3 for the presence of ingested fishing hooks. Radiographs
revealed 3 turtles, all in Reach 3, had fishing hooks within the gastrointestinal tract and
one turtle possessed 3 fishing hooks (Figure 3-10). Results for the bush hook survey

43
are shown in Figure 3-11, and although more data are needed, preliminary results
suggest that a higher prevalence of bush hooks leads to higher fish hook ingestion by
turtles.
44
Table 3-1. Captures, trap nights, and mean Capture Per Unit Effort (CPUE) by reach and site.
Reach Site Sessions Trap
Nights Captures CPUE
1 White Springs 5 52 7 0.183
Suwannee Springs 5 60 12 0.217
10 112 19 0.200
2 Dowling Park up 5 55 23 0.383
Dowling Park down 6 68 14 0.208
11 123 37 0.288
3 Mayo 5 60 6 0.100
Branford 6 64 24 0.361
11 124 30 0.242
4 Rock Bluff 5 60 29 0.483
Sun Springs 6 72 17 0.235
11 132 46 0.348
5 Manatee Springs 5 60 14 0.233
Fowler’s Bluff 5 59 8 0.133
10 119 22 0.183
6 Estuary up 5 60 1 0.017
Estuary down 5 60 0 0.000
10 120 1 0.008
Table 3-2. Sex ratios for the entire sample and by reach. No adults were captured in Reach 6.
Reach Male Female chi-squared p-value
1 7 5 0.3 0.563
2 26 4 16.1 < 0.005
3 18 4 8.9 < 0.005
4 21 7 7 0.008
5 9 3 3 0.083
6 - - - -
Total 81 23 32.3 < 0.001
45
Table 3-3. Morphological measurements and masses of 132 Macrochelys captured in
the Suwannee River. Data consists of mean, standard deviation, and minimum-maximum. Body sizes were compared using a Mann-Whitney Rank Sum Test and a sexual dimorphism index (Lovich and Gibbons, 1992).
Immature Female Male
(n = 28) (n = 23) (n = 81) P SDI
CL (mm)
243.46 415 550.3
< 0.001 63.8 33.1 62.9 -0.33
(152 – 325) (344 – 470) (431 – 650)
CW (mm)
214.78 356.9 457.1
< 0.001 57.1 29.7 46.64 -0.28
(134 – 292) (295 – 407) (363 – 524)
PL (mm)
186.82 312.9 399
< 0.001 49.1 27.5 38.2 -0.28
(116 – 261) (253 – 367) (325 – 458)
HW (mm)
81.64 133.5 176.4
< 0.001 19.7 12 20.4 -0.32
(53 – 109) (107 – 152) (138 – 222)
mass (kg)
4.08 16.46 37.75
< 0.001 2.8 3.5 11.3 -1.29
(0.5 – 8.7) (10 – 22.5) (18 – 57.1)
Table 3-4. Mean linear home range of Macrochelys with standard error for sex and
reach.
Sex n Mean linear home range
(m)
Male 11 1896 ± 252
Female 4 1615 ± 301
Reach
Reach 1 6 1533 ± 329
Reach 3 9 2013 ± 243

46
Figure 3-1. Catch Per Unit Effort (CPUE) by reach with standard error. Letters indicate
significance. Reach 1 and 5 had relatively lower estimated abundance than Reaches 2, 3, and 4.
Figure 3-2. Estimation of adult turtle density by reach from a closed population model with standard error. Estimate is for 10km of river in each reach.

47
Figure 3-3. Size distribution for Macrochelys captured in the Suwannee River from
2011–2013.

48
Figure 3-4. Size distribution for Macrochelys captured in the Suwannee River by reach
from 2011–2013.

49
Figure 3-5. Frequencies of captured Macrochelys in the Suwannee River with mass ≥
45 kg by reach.
50
Figure 3-6. Measurements of A) carapace length, B) mass, C) carapace width, D)
plastron length, and E) head width of adult male and female Macrochelys using ANOVA with reach as a factor. Letters indicate significance.
51
Figure 3-7. Map showing 4 turtles located within the floodplain during high water levels
in Reach 1. Different colors represent different turtles.
Figure 3-8. Sonar map image showing turtle #115 frequently located around a cluster of
submerged woody debris.

52
Figure 3-9. Map showing turtle #31 frequently located in a small spring and spring run.
Figure 3-10. Radiograph showing 3 fishing hooks in the upper gastrointestinal tract of a
Macrochelys from the Branford site (Reach 3).
53
Figure 3-11. Plot showing the relationship between number of bush hooks present and
ingested fish hooks found in turtles in Reach 1 (circle) and Reach 3 (triangle). Although a trend seems to emerge, more data are needed to investigate this potential threat.

54
CHAPTER 4 DISCUSSION / CONCLUSION
A previous study found Macrochelys to be absent within the Suwannee River in
Georgia, and this was a major concern due to the Suwannee River population of
Macrochelys being genetically unique from other populations (Jenson and Birkhead,
2003; Roman et al., 1998). Although Moler (1996) captured Macrochelys in the
Suwannee River in Florida as part of a statewide distribution survey, questions and
concerns remained regarding the status of this unique population. Data from this study
show that Macrochelys within the Suwannee River are more numerous than previously
thought.
Hypotheses Revisited
I predicted that alligator snapping turtle abundance would increase in the middle
and lower reaches relative to upper reach (Reach 1) due to differences in habitat driven
by water chemistry and geomorphic riverine processes predicted by the RCC. My
prediction was partially confirmed as turtle relative abundance and estimated density
was lower in the upper reach and higher in the middle reaches (Reaches 2–4);
however, I found reduced abundance within the lower reaches (Reaches 5 and 6). In
fact, Reach 6 had the lowest relative abundance. These results were supported by
capture per unit effort (CPUE) data and density estimates derived from a closed
population model.
I predicted that alligator snapping turtles would exhibit smaller size classes and
different population structure in the upper reach relative to the middle and lower reaches
due to differing levels of productivity predicted by the RCC. Examination of reach
specific population data revealed that turtles within the middle reaches (Reaches 2–4)

55
had sex ratios skewed toward males and significantly different from 1:1. Not only were
there more males within the middle reaches, but males in the middle reaches were
significantly larger in size when compared to males in the upper (Reach 1) and lower
reaches (Reaches 5 and 6). Females did not show this pattern, but significant
differences were observed for females in PL in Reach 2 and CW in Reach 5.
I predicted that alligator snapping turtles would exhibit smaller home ranges in
Reach 3 than turtles in Reach 1 due increases in river productivity from upstream to
downstream. This was not confirmed. No significant difference was detected in linear
home ranges between reaches.
I predicted the prevalence of ingested fish hooks would be higher in the reach
with the most observed bush hooks. We observed more bush hooks set in Reach 3 than
Reach 1, and radiographs revealed that turtles captured in Reach 3 ingested fish hooks,
whereas turtles captured in Reach 1 had not.
Discussion
Overall, the mean CPUE for this study was 0.22, which is comparable to other
studies conducted in Florida, Arkansas, and Oklahoma (Moler, 1996; Wagner et al.,
1996; Trauth et al., 1998; Riedle et al., 2008). Jensen and Birkhead (2003) found a
slightly lower CPUE (0.20) during a survey of rivers in Georgia, but in 53 trap nights, no
Macrochelys was captured in the Suwannee River; low pH and aspects of commercial
harvest were possible explanations (Jensen and Birkhead, 2003). The authors
alternatively suggested that Macrochelys may not be common in the easternmost part
of its range (Jensen and Birkhead, 2003), but data from my study cast doubt on that
hypothesis. Capture per unit effort data from my study revealed that relative abundance
is low in the upper and lower reaches (Reaches 1 and 5) of the Suwannee River,

56
whereas the middle reaches (Reaches 2, 3, and 4) have the highest relative
abundance. Results from the closed population model suggested that the middle
reaches (Reaches 2, 3, and 4) have the highest estimated density of turtles. The closed
population model assumed no immigration or emigration, and I believed this to be
appropriate because telemetry data revealed small linear home ranges (~1–2 km) in the
Suwannee River. Sampling with baited traps may be biased towards adult turtles
because immature individuals are more likely to lure for prey (Pritchard, 2006);
therefore, I only included adult turtles in the model. The overall estimated population
density was 3.5 adults/km for the entire river, though density was not equal along the
river. The upper and lower reaches (Reaches 1 and 5) had the lowest estimated
abundance (1.7 adults/km and 2 adults/km), whereas the middle reaches (Reaches 2,
3, and 4) had the highest estimated abundance (3.75/adults/km, 2.6 adults/km, 4.3
adults/km). The model strongly agreed with CPUE results and provides further evidence
that turtle relative abundance and density are heavily influenced by river reach. Other
studies estimated population densities, including juveniles, to be 28−34 turtles/km in
Oklahoma streams (Riedle et al., 2008) and 18 turtles/km in an Arkansas stream that
had been commercially harvested in the past (Howey and Dinkelacker, 2013). Although
these studies incorporated immature individuals, even if only adults are considered, the
estimates are much higher than those found in this study. One explanation could be
detectability. Other studies have been restricted to smaller streams and rivers, whereas
my study was conducted in a large free-flowing river. Traps are typically more effective
in smaller streams because the bait scent covers a greater percentage of the area and
57
potentially both banks; however, in a large river, coverage is reduced due to the sheer
volume of water and the distance between banks.
In total, males were captured significantly more often than females and immature
individuals (3.5:1 sex ratio); conversely, other studies found predominantly females
(Howey and Dinkelacker 2013, Lescher et al. 2013) or equal sex ratios (Trauth et al.
1998, Jensen and Birkhead 2003, Boundy and Kennedy 2006, Riedle et al. 2008).
Although our total sample was male biased, sex ratios were not significantly different
from 1:1 within Reaches 1 and 5. Reaches 2–4 were extremely male biased, which
skewed the entire sample. Although individuals of breeding size were captured in all
reaches except Reach 6 (estuary), my data indicate that sex ratios are different along
the river. Macrochelys has temperature-dependent sex determination, and although we
did not locate any nests during this study, past studies have shown that sandy beaches
and warmer nest temperatures produce more females (Ewert, 1994). Nesting habitat
changes as the river makes its way downstream towards the Gulf of Mexico. There are
more upland and open nesting habitats available in the upper river (Reach 1), and as
the elevation decreases and floodplains become more extensive, nesting habitat
becomes potentially more shaded. This pattern could explain why turtles are male
biased in the middle river (reaches 2–4). However, the sex ratio within Reach 5 was not
significantly different from 1:1, and this reach has nesting habitat that is very similar to
the middle reaches. Therefore, differences in nesting habitat among reaches is an
unlikely explanation for the unequal sex ratios found in this study. A more likely
explanation for biased sex ratios in the middle reaches is that adult males, which
dominate the middle reaches, may control juvenile and female populations by
58
competitive exclusion, forcing smaller individuals into less desirable habitat. Although
Macrochelys are occasionally found in estuarine habitat (Jackson and Ross, 1971;
Ewert, 2006), my data suggest that Macrochelys are rare within the Suwannee estuary.
This may be due to the lack of appropriate habitat and an influx of salt water. A study of
the upper Suwannee River estuary found maximum salinity concentrations as high as
31 ppt (Tillis, 2000). The salinity of sea water is approximately 35 ppt.
Overall, I captured a higher proportion of large turtles than any other published
study, but most large turtles were captured in the middle reaches (Reaches 2–4).
Pritchard (1979) proposed that Macrochelys may wander upstream until they reach
large sizes, but data from this study cast doubt on this hypothesis. The headwaters are
far less productive and would not be ideal for optimal growth. Data from this study
suggest that Macrochelys are most abundant and largest in the more productive
sections of the river. Adult males were significantly larger than females in CL, CW, PL,
HW, and mass within the middle reaches (Reaches 2–4). These data suggest that
males potentially grow to larger sizes within these highly productive reaches. Females
were not significantly different in CL, HW, and mass, although significant differences
were detected in PL (Reach 2) and CW (Reach 5). This could potentially be due to low
statistical power caused by the small female sample size. Boundy and Kenney (2006)
reported the heaviest turtle captured in a study (51.4 kg) to date, and the heaviest turtle
reported in my study had a larger mass (57.1 kg). Pritchard (2006) reported much
heavier turtles, but many of these weights may represent estimated weights and should
be interpreted with caution. As a further complication, Pritchard (2006) reports to the
size of many captive animals. In captivity, Macrochelys readily eats and lacks normal

59
movement patterns. This has most likely led to captive turtles being obese, and their
weights are not representative of wild turtles. For example, a turtle in the Brookfield Zoo
in Chicago, Illinois, grew to 66 cm CL and weighed 114 kg (Pritchard 2006), whereas an
apparently healthy turtle from my study measured 65 cm CL and weighed 54.5 kg.
Studies in Georgia, Louisiana, Missouri, Arkansas, and Oklahoma found a lack
of large adult turtles, which has usually been attributed to historical harvest (Wagner et
al. 1996, Jensen and Birkhead 2003, Boundy and Kennedy 2006, Riedle et al. 2006;
2008, East et al. 2013, Howey and Dinkelacker 2013, Lescher et al. 2013). Harvest has
been well documented in this species and has certainly played a role in declines in
many populations (Pritchard, 2006). The reported rarity of Macrochelys in the upper
reaches of the Suwannee River has also been attributed to harvest (Jensen and
Birkhead, 2003; Pritchard, 2006). Many of these population parameters can potentially
be explained by simple ecological stream theory. The upper Suwannee River (Reach 1)
derives most of its water from direct surface runoff, and the water is acidic, high in
organic material, and dark in color (Hornsby et al., 2000), which inhibits benthic and
water column photosynthesis. Due to the low pH, many of the nutrients are biologically
unavailable. As the river flows downstream it passes over an important geological
feature known as the Cody Scarp. The Cody Scarp is a karst escarpment that divides
the Northern Highlands and Gulf Coastal Lowlands physiographic regions (Hornsby et
al., 2000). The Cody Scarp possesses mostly carbonate rock (limestone) near or at the
surface. Upon reaching the Cody Scarp (Reach 2), the acidic water from upstream
comes into contact with carbonate rock that buffers the water, resulting in an increase in
pH. This increase in pH causes nutrients that were previous unavailable to become

60
biologically available increasing invertebrate and fish resources. This increase in the
potential turtle prey base could explain the dramatic increase in turtle CPUE, density,
and size from Reach 1 to Reach 2. Farther downstream in Reaches 3−5, the river
receives increasing amounts of water from the Floridan aquifer, which changes the
water to a slightly colored, alkaline stream (Hornsby et al., 2000) and increases aquatic
productivity. My data indicate that turtle density and size are the highest from
downstream of the Cody Scarp to Reach 4, but turtle CPUE, density, and size decrease
in Reach 5. One explanation for this is saltwater incursion. The Suwannee River
experiences tidal influences within Reach 5 (Hornsby et al., 2000), and during periods of
low flow, pockets of salt water have the potential to form on the river bottom.
Macrochelys are bottom-dwelling turtles, and saltwater incursion could potentially
reduce the availability of preferred habitat. While the ecological reaches described by
Hornsby et al. (2000) help to distinguish different sections of river, my data suggest that
the Cody Scarp is perhaps the most important influence on the population dynamics of
Macrochelys in the Suwannee River.
During my telemetry study, two turtles were never located after release, and one
turtle was lost after being located consistently for a month. Although extreme
movements have been reported in this species (Pritchard, 2006), I searched 32 km
upstream and 35 km downstream of the release site with no success. The most likely
explanation is equipment failure. Macrochelys have been known to wedge themselves
under rocks and limestone banks, and this behavior could have resulted in damage to
the transmitters. Turtles in Reach 3 had a larger mean home range, but there was a
large amount of inter-individual variation, and home range did not differ significantly

61
between reaches. Although the mean linear home range was greater in males than
females, no significant difference was detected. This is contrary to a study in Oklahoma
in which adult females tended to have larger home ranges than adult males, and
juveniles had larger home ranges than adults (Riedle et al., 2006). In my study, small
sample size could have played a factor in detecting a significant difference.
Although no significant differences were detected between sexes and reaches in
linear home-range size, I observed several interesting behaviors. Two large male turtles
(>45kg) were frequently located in springs and spring runs within Reach 3. Springs may
provide a thermally stable refuge for turtles. A study conducted in the Santa Fe River, a
tributary of the Suwannee River, resulted in very few Macrochelys captured in springs. It
is important to note that springs trapped in the Santa Fe River experience high levels of
recreation (e.g. swimming, boating, and fishing), and this could explain the rarity of
Macrochelys within these habitats (Johnston, pers. obs.). My data confirm that
Macrochelys do use spring habitats, but the spring in my study is very small and lacks
recreational use. Unaltered floodplain springs could be important refuges for
Macrochelys within the Suwannee River drainage, and more research is needed to
examine habitat use in Macrochelys.
During periods of high water, turtles were observed in each site moving from the
river channel into the floodplain. During high-water periods the floodplains were
inundated with water and likely utilized as new foraging habitat by turtles. These
floodplains remained inundated for weeks. When water levels fell, the aquatic corridors
between the river channel and the floodplain disappeared. Surprisingly, turtles were
located on multiple occasions moving back and forth between the floodplain and

62
channel without an aquatic corridor. Past studies claim that overland movement is rare
or absent in this species (Pritchard, 2006), but my data suggest that these movements
do take place and could be more common than previously thought. Additionally, turtles
were observed using 2–4 core sites, which has been reported in previous studies
(Riedle et al., 2006). Core sites typically consisted of subsurface rocks, woody debris,
and undercut banks.
As water levels fluctuated, turtles were located in different habitat types. Side-
scan sonar (SSS) revealed turtles were usually associated with limestone bank
outcrops, subsurface rocks, or woody debris, including deadhead logs (pre-cut timber
lost during transport), during low-water periods. As water levels increased, turtles were
located in and around fallen trees and root systems that were previously out of the
water. This suggests that Macrochelys habitat preferences may change with availability.
Data from this study suggest that Macrochelys rely on submerged woody debris as
habitat and refuge, especially during low-water periods when other habitat types are
perched. The state of Florida initiated a deadhead log removal program in 2000. From
2000 to 2008, more than 16,000 logs were removed from Florida’s rivers; however, this
is likely a conservative number (Kaeser and Litts, 2008). The removal of any woody
debris from the Suwannee River could have a negative impact on Macrochelys due to
the high importance of woody debris as a primary refuge during low-water periods.
Ingested fish hooks can perforate the digestive tract lining, and monofilament or
gel spun fishing line attached to the hook can cause severe digestive blockage and
potentially death in turtles (Heard, pers. obs.). Ingested hooks are likely the result of
bush hooks, which are single hooks suspended from tree branches to catch catfish and

63
other forms of wildlife. Bush hooks are typically baited and set in the evening and left
out overnight. Because Macrochelys are primarily nocturnal, they have a higher chance
of an encounter with a bush hook than a manned fishing line. An FWC regulation
requires that bush hooks be clearly labeled with the fisherman’s name and address.
However, most bush hooks we observed were not labeled. My study found bush hooks
to be more abundant in Reach 3. This is most likely due to higher fish abundance and
greater access to the river. Although our sample size was small, the results provided
some insight. We found three individuals, all in Reach 3, with ingested fish hooks, and
one turtle had ingested three hooks. These turtles appeared healthy, and two of the
three turtles have been recaptured and equipped with telemetry transmitters. These
turtles have exhibited normal movements. Fish hooks are possibly not the primary
cause for concern; the associated fishing line attached to the fishhook may pose the
greatest health threat. Additionally, a turtle in Dowling Park (Reach 2) was observed
upon capture to have a fish hook embedded in the upper left forelimb. The hook also
had a line weight and about 3 feet of heavy test, braided monofilament attached. The
hook was removed and the turtle released. Further studies are necessary to determine
the impact, if any, of ingested hooks and associated fishing tackle on Macrochelys
populations. Other than ingested fishhooks, Macrochelys faces additional threats within
the Suwannee River drainage. Injuries obtained from boat propellers are one concern.
Much of the Suwannee River receives heavy recreational use by boaters, especially the
middle and downstream portions of river. Boat propeller scars were observed on the
carapaces of eight turtles, and some damage was extensive but had healed (Figure 4-
1). If the population in the Suwannee River is recognized as a new species, it would
64
likely meet the criterion of threatened in Florida because of its restricted distribution
(FWC, 2011). Because this population is restricted to a single drainage, a catastrophic
chemical spill or similar event could potentially be devastating. These types of events
seem unlikely; however, in 2013, the city of Valdosta had major sewage spills into the
Withlacoochee River, a tributary of the Suwannee River, from its wastewater treatment
plant in which spilled millions of gallons of solid waste into the drainage.
Bycatch of other turtle species primarily consisted of the pond slider (Trachemys
scripta), Suwannee cooter (Pseudemys suwanniensis), and Florida softshell turtle
(Apalone ferox) but included the peninsula cooter (Pseudemys peninsularis), Florida
red-bellied cooter (Pseudemys nelsoni), loggerhead musk turtle (Sternotherus minor),
and Florida snapping turtle (Chelydra serpentina). Eight exotic red-eared sliders were
captured throughout the river (Trachemys scripta elegans). Numerous fish species were
captured, including a bull shark (Carcharhinus leucas).
Conclusions
Fisheries biologists have used basic principles of stream ecology to help explain
population abundance and community structure of organisms within fluvial systems. My
data suggest that the RCC provides a useful framework for understanding the dynamics
of fluvial process and how they affect the distribution of riverine freshwater turtles.
Lower densities of Macrochelys should be expected in less productive sections of river
because these sections lack the resources needed to sustain high population densities.
Furthermore, low turtle densities found in sections of rivers with low biological
productivity are not always indicative of harvest or an unhealthy population, but they are
caused by natural riverine processes that help shape population dynamics within fluvial
systems. The RCC could potentially be a practical tool to help resource managers

65
predict abundance and density levels in order to help focus conservation efforts within
riparian systems. My data indicate that Macrochelys is more abundant in the Suwannee
than previously thought and provides a framework for its future conservation and
management.

66
Figure 4-1. Photographs of damage ascertained from a boat propeller on 2 Macrochelys
in the Suwannee River. Photos courtesy of Travis Thomas and Kevin Enge.
67
REFERENCES
Allen, E. R., and W. T. Neill. 1950. The alligator snapping turtle Macrochelys temminckii in Florida. Ross Allen's Reptile Institute Special Publication 4:1–15.
Boundy, J., and C. Kennedy. 2006. Trapping survey results for the alligator snapping turtle (Macrochelys temminckii) in southeastern Louisiana, with comments on exploitation. Chelonian Conservation and Biology 5:3–9.
Cagle, F. R. 1939. A system of marking turtles for future identification. Copeia 1939:170–173.
Ceryak, R., M. S. Knapp, and T. Burnson. 1983. The geology and water resources of the Upper Suwannee River Basin, Florida. Bureau of Geology, Division of Resource Management, Florida Department of Natural Resources and Suwannee River Water Management District, Tallahassee, Florida, USA.165pp.
Decamps, H. 2011. River networks as biodiversity hotlines. Comptes Rendus Biologies. 334:420–434.
Dobie, J. L. 1971. Reproduction and growth in the alligator snapping turtle, Macroclemys temminckii (Troost). Copeia 1971:645–658.
Duncan, W. W., G. C. Poole, and J. L. Meyer. 2009. Large channel confluences influence geomorphic heterogeneity of a southeastern United States river. Water Resources Research 45:9.
East, M. B., J. D. Riedle, and D. B. Ligon. 2013. Temporal changes in an alligator snapping turtle (Macrochelys temminckii) population. Wildlife Research 40:77–81.
Echelle, A. A., J. C. Hackler, J. B. Lack, S. R. Ballard, J. Roman, S. F. Fox, D. M. Leslie, Jr., and R. A. Van Den Bussche. 2010. Conservation genetics of the alligator snapping turtle: cytonuclear evidence of range-wide bottleneck effects and unusually pronounced geographic structure. Conservation Genetics 11:1375–1387.
Elsey, R. M. 2006. Food habits of Macrochelys temminckii (alligator snapping turtle) from Arkansas and Louisiana. Southeastern Naturalist 5:443–452.
Ernst, C. H., and J. E. Lovich. 2009. Turtles of the United States and Canada. Second edition. Johns Hopkins University Press, Baltimore, Maryland, USA. 827pp.
ESRI 2001. ArcGIS Desktop: Release 10. Redlands, CA: Environmental Systems Research Institute.
Ewert, M. A., and D. R. Jackson. 1994. Nesting ecology of the alligator snapping turtle (Macroclemys temminckii) along the lower Apalachicola River, Florida. Florida

68
Game and Fresh Water Fish Commission, Nongame Wildlife Program Report NC89-020, Tallahassee, Florida, USA. 45pp.
Ewert, M. A., D. R. Jackson, and P. E. Moler. 2006. Macrochelys temminckii – alligator snapping turtle. Pages 58–71 in P. A. Meylan, editor. Biology and conservation of Florida turtles. Chelonian Research Monographs No. 3.
Fish, J. P., and H. A. Carr. 1990. Sound underwater images, a guide to the generation and interpretation of side scan sonar data. Lower Cape Publishing, USA.
Hall, H. H. and H. M. Smith.1947.Selected records of reptiles and amphibians from southeastern Kansas. Transactions of the Kansas Academy of Science 49 (4): 447–454.
Harrel, J. B., and G. L. Stringer. 1997. Feeding habits of the alligator snapping turtle (Macroclemys temminckii) as indicated by teleostean otoliths. Herpetological Review 28:185–187.
Herpetological Animal Care and Use Committee. 2004. Guidelines for use of live amphibians and reptiles in field and laboratory research. Second edition. American Society of Ichthyologists and Herpetologists. 43pp.
Holcomb, S. R., and J. L. Carr. 2013. Mammalian depredation of artificial alligator snapping turtle (Macrochelys temminckii) nests in North Louisiana. Southeastern Naturalist 12:478–491.
Hornsby, D., R. A. Mattson, and T. Mirti. 2000. Surface water quality and biological monitoring. Annual Report 1999. Suwannee River Water Management District Technical Report WR-00-04. 148pp.
Howey, C. A. F., and S. A. Dinkelacker. 2013. Characteristics of a historically harvested alligator snapping turtle (Macrochelys temminckii) population. Copeia 2013:58–63.
Jackson, C. G., Jr., and A. Ross. 1971. The occurrence of barnacles on the alligator snapping turtle, Macroclemys temminckii Troost. Journal of Herpetology 5:188–189.
Jensen, J. B., and W. S. Birkhead. 2003. Distribution and status of the alligator snapping turtle (Macrochelys temminckii) in Georgia. Southeastern Naturalist 2:25–34.
Johnson, S. 1989. Population status of the alligator snapping turtle (Macroclemys temminckii) in the Flint River. Annual performance report, Georgia Department of Natural Resouces, Forsyth, Georgia, USA. 11pp.
69
Kaeser, A. J., and T. L. Litts. 2008. An assessment of deadhead logs and large woody debris using side scan sonar and field surveys in streams of southwest Georgia. Fisheries 33:589–597.
Kaeser, A. J., and T. L. Litts. 2010. A novel technique for mapping habitat in navigable streams using low-cost side scan sonar. Fisheries 35:163–174.
Lescher, T. C., J. T. Briggler, and Z. Tang-Martinez. 2013. Relative abundance, population structure, and conservation of alligator snapping turtles (Macrochelys temminckii) in Missouri between 1993–1994 and 2009. Chelonian Conservation and Biology 12:163–168.
Lovich, J. E. and J. W. Gibbons. 1992. A review of techniques for quantifying sexual size dimorphism. Growth, Development and Aging 56:269–281.
Moler, P. E. 1996. Alligator snapping turtle distribution and relative abundance. Final Report, Study Number 7544. Florida Game and Fresh Water Fish Commission, Tallahassee, Florida, USA. 13pp.
Pittman, J. R., H. H. Hatzell, and E. T. Oaksford. 1997. Spring contributions to water quantity and nitrate loads in the Suwannee River during base blow in July 1995. U.S. Geological Survey Water-Resources Investigations Report 97-4152. U.S. Geological Survey, Tallahassee, Florida, USA. 11pp.
Pritchard, P. C. H. 1979. Encyclopedia of Turtles. T.F.H. Publications, Inc., Neptune, New Jersey USA. 895 pp.
Pritchard, P. C. H. 2006. The alligator snapping turtle: biology and conservation. Second edition. Krieger Publishing Company, Malabar, Florida, USA. 140pp.
R Development Core Team. 2012. R: A language and environment for statistical computing. R Foundation for Statistical Computing, Vienna, Austria. ISBN 3-900051-07-0, URL http://www.R-project.org/.
Raulston, M., C. Johnson, K. Webster, C. Purdy, and R. Ceryak. 1998. Suwannee River Water Management District. Pages 194−213 in E. A. Fernald and E. D. Purdum, editors. Water resources atlas of Florida. Institute of Science and Public Affairs, Florida State University, Tallahassee, Florida, USA.
Reed, R. N., J. D. Congdon, and J. W. Gibbons. 2002. The alligator snapping turtle [Macroclemys (Macrochelys) temminckii]: a review of ecology, life history, and conservation, with demographic analyses of the sustainability of take from wild populations. Report to Division of Scientific Authority, United States Fish and Wildlife Service. Savannah River Ecology Laboratory, Aiken, South Carolina, USA. 17pp.
70
Riedle, J. D., P. A. Shipman, S. F. Fox, and D. M. Leslie, Jr. 2005. Status and distribution of the alligator snapping turtle Macrochelys temminckii in Oklahoma. Southwestern Naturalist 50:79–84.
Riedle, J. D., P. A. Shipman, S. F. Fox, and D. M. Leslie, Jr. 2006. Microhabitat use, home range, and movements of the alligator snapping turtle, Macrochelys temminckii, in Oklahoma. Southwestern Naturalist 51:35–40.
Riedle, J. D., P. A. Shipman, S. T. Fox, J. C. Hackler, and D. M. Leslie, Jr. 2008. Population structure of the alligator snapping turtle, Macrochelys temminckii, on thewestern edge of its distribution. Chelonian Conservation and Biology 7:100–104.
Roman, J., S. D. Santhuff, P. E. Moler, and B. W. Bowen. 1999. Population structure and cryptic evolutionary units in the alligator snapping turtle. Conservation Biology 13:135–142.
Roy, A. H., A. D. Rosemond, D. S. Leigh, M. J. Paul, and J. B. Wallace. 2003. Habitat-specific responses of stream insects to land cover disturbance: biological consequences and monitoring implications. Journal of the North American Benthological Society 22:292–307.
Shipman, P.A., Edds, D.R. and L. E.Shipman. 1995. Distribution of the alligator snapping turtle (Macroclemys temminckii) in Kansas. Transactions of the Kansas Academy of Science, 98: 83–91.
Shipman, P. A., and A. Neeley. 1998. Alligator snapping turtle trap, mark, and telemetry project. Final report to the Missouri Department of Conservation, Jefferson City.
Sloan, K. N., and D. Taylor. 1987. Habitats and movements of adult alligator snapping turtles in northeast Louisiana. Proceedings of the Annual Conference of the Southeastern Association of Fish and Wildlife Agencies 41: 343–348.
Sloan, K. N., K. A. Buhlmann, and J. E. Lovich. 1996. Stomach contents of commercially harvested adult alligator snapping turtles, Macroclemys temminckii. Chelonian Conservation and Biology 2:96–99.
Spindel, E. L., J. L. Dobie, and D. F Buxton. 1987. Functional mechanisms and histologic composition of the lingual appendage in the alligator snapping turtle, Macroclemys temminckii (Troost) (Testudines: Chelydridae). Journal of Morphology 194:287–301.
Sutherland, A. B., J. L. Meyer, and E. P. Gardiner. 2002. Effects of land cover on sediment regime and fish assemblage structure in four southern Appalachian streams. Freshwater Biology 47:1791–1805.

71
Tillis, G. M. 2000. Flow and salinity characteristics of the upper Suwannee River estuary, Florida. Water-Resources Investigations Report 99-4268. U.S. Geological Survey, Tallahassee, Florida.
Trauth, S. E., J. D. Wilhilde, and A. Holt. 1998. Population structure and movement patterns of alligator snapping turtles (Macroclemys temminckii) in northeastern Arkansas. Chelonian Conservation and Biology 3:64–70.
Townsend, C. R. 1996. Concepts in river ecology: Pattern and process in the catchment hierarchy. Archiv fuer Hydrobiologie Supplement 113:3–21.
Tucker, A. D., and K. N. Sloan. 1997. Growth and reproductive estimates from alligator snapping turtles, Macroclemys temminckii, taken by commercial harvest in Louisiana. Chelonian Conservation and Biology 2: 587–592.
U.S. Fish and Wildlife Service. 1984. Endangered and threatened wildlife and plants; finding on a petition to list the alligator snapping turtle as a threatened species. Federal Register 49:7416–7417.
U.S. Fish and Wildlife Service. 2005. Inclusion of alligator snapping turtle (Macroclemys [=Macrochelys] temminckii) and all species of map turtle (Graptemys spp.) in Appendix III to the Convention on International Trade in Endangered Species of Wild Fauna and Flora. Federal Register 70:74700–74712.
Vannote, R. L., G. W. Minshall, K. W. Cummins, J. R. Sedell, and C. E. Cushing. 1980. River continuum concept. Canadian Journal of Fisheries and Aquatic Sciences 37:130–137.
Ward J. V. 1989. The four-dimensional nature of lotic ecosystems. Journal of the North American Benthological Society 8:2–8.
Wagner, B. K., D. Urbston, and D. Leek. 1996. Status and distribution of alligator snapping turtles in Arkansas. Proceedings of the Annual Conference of Southeastern Association of Fish and Wildlife Agencies 50:264–270.
Walters, D. M., D. S. Leigh, M. C. Freeman, B. J. Freeman, B. J., and C. M. Pringle. 2003. Geomorphology and fish assemblages in a Piedmont river basin, U.S.A. Freshwater Biology 48:1950–1970.
Woolsey, L. B. 2005. Population structure and reproduction of alligator snapping turtles, Macrochelys temminckii, at Black Bayou Lake National Wildlife Refuge. M.S. Thesis, University of Louisiana at Monroe, Monroe, Louisiana, USA. 59pp.
Zappalorti, R.T. 1976. The Amateur Zoologist’s Guide to Turtles and Crocodilians. Stackpole Books, Harrisburg, PA. 208 pp.

72
BIOGRAPHICAL SKETCH
Travis M. Thomas received a bachelor’s degree in 2009 from the University of
Florida in natural resources conservation with a minor in wildlife ecology and
conservation. He is currently pursuing a master’s degree in wildlife ecology and
conversation under the supervision of Dr. Perran Ross. His primary research is focused
on chelonian conservation and ecology. Currently his research focuses on geomorphic
riverine processes and its effect on the population dynamics of the alligator snapping
turtle in the Suwannee River. He was hired by the Florida Fish and Wildlife
Conservation Commission in 2009, and he has worked on numerous projects
concerning reptile and amphibian ecology. Previously, he worked for three years at the
Florida Museum of Natural History in the Herpetology Department under Dr. Kenneth
Krysko. He has spent time as a volunteer on numerous projects in Kenya, Africa, under
the supervision of Leigh Ecclestone and the Kenyan Wildlife Service.