Population. SOME DISCUSSION QUESTIONS: Identify one demographic trend that is likely to affect you...
21
Population
-
date post
21-Dec-2015 -
Category
Documents
-
view
215 -
download
0
Transcript of Population. SOME DISCUSSION QUESTIONS: Identify one demographic trend that is likely to affect you...

Population

SOME DISCUSSION QUESTIONS:
• Identify one demographic trend that is likely to affect you at some point during your lifetime.
• Identify one demographic trend that has/will affect Canadian society.

Population and PolicyPopulation and Policy
The main population phenomena are:
FERTILITY
MIGRATION
and MORTALITY.

Processes and StatesProcesses and States
DEMOGRAPHY studies the stock (or state) of populations (their size, distribution and composition) at a given time point and their flow (or processes involving population change).

The stock and flow of population are dynamically interrelated.
For example, P2=P1+B-D+I-E,
where P2 is population at time 2, P1 is population at time 1, B is births, D is deaths, I is immigration and E is emigration.

MalthusMalthus
One of the two classical perspectives on population processes is that of Malthus.
Positive checks on population.
Preventative checks on population.

MarxMarx
The second classical theory of population is Marx’s.

Demographic Transition Demographic Transition TheoryTheory
An important modern demographic theory is the THEORY OF THE DEMOGRAPHIC TRANSITION.
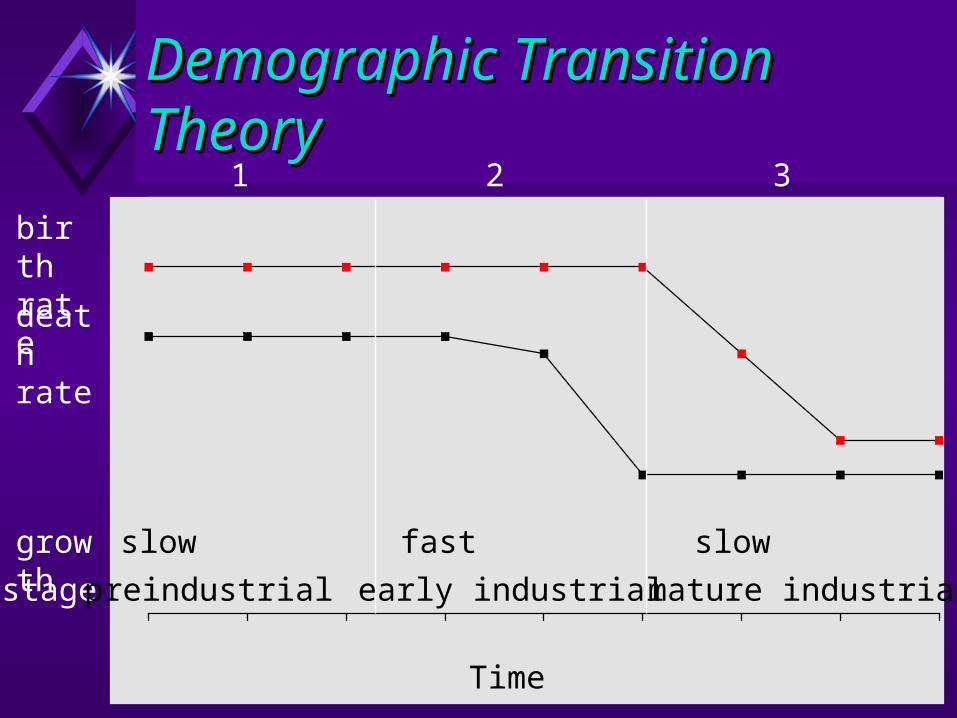
Demographic Transition Demographic Transition TheoryTheory
birth rate
death rate
stage preindustrial early industrial mature industrial
growth slow fast slow
1 2 3
Time

World Population GrowthWorld Population Growth
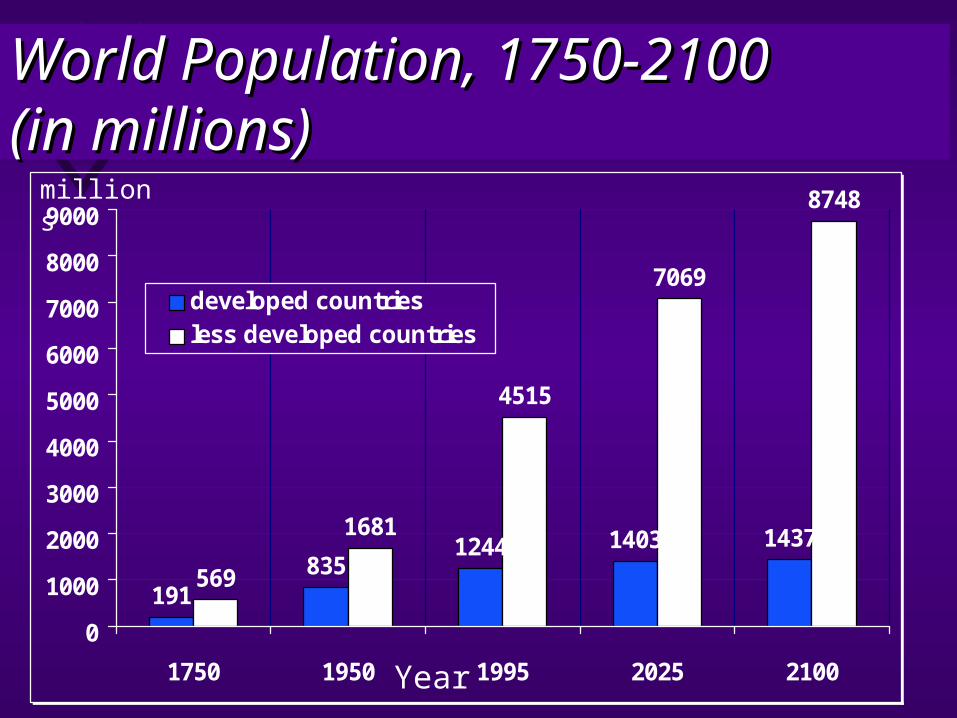
World Population, 1750-2100 World Population, 1750-2100 (in millions)(in millions)
191835
1244 1403 1437
569
1681
4515
7069
8748
0
1000
2000
3000
4000
5000
6000
7000
8000
9000
1750 1950 1995 2025 2100
developed countriesless developed countries
millions
Year

World Population and Urban World Population and Urban Growth, 1950-2020Growth, 1950-2020
rural
cities<1m
cities1m+
1950
2020
2.5 billion
8.1 billion

The World’s Largest Cities, The World’s Largest Cities, 1950 and 2000 (in millions)1950 and 2000 (in millions)1950
London ======= 6.6
New York ==== 4.2Paris === 3.3Berlin == 2.4Chicago == 1.7Vienna == 1.6Tokyo == 1.5St Ptrsbrg. = 1.4Philadel. = 1.4
2000
Mexico C. ========== 31.0
Sao Paulo ========= 25.8
Tokyo ======== 24.2New York======= 22.8Shanghai ======= 22.7Beijing ======= 19.9Los Ang. ====== 17.1Bombay ====== 16.8Calcutta ======16.7

Population Change Population Change in in Canada: MortalityCanada: Mortality
Life Expectancy
Infant Mortality
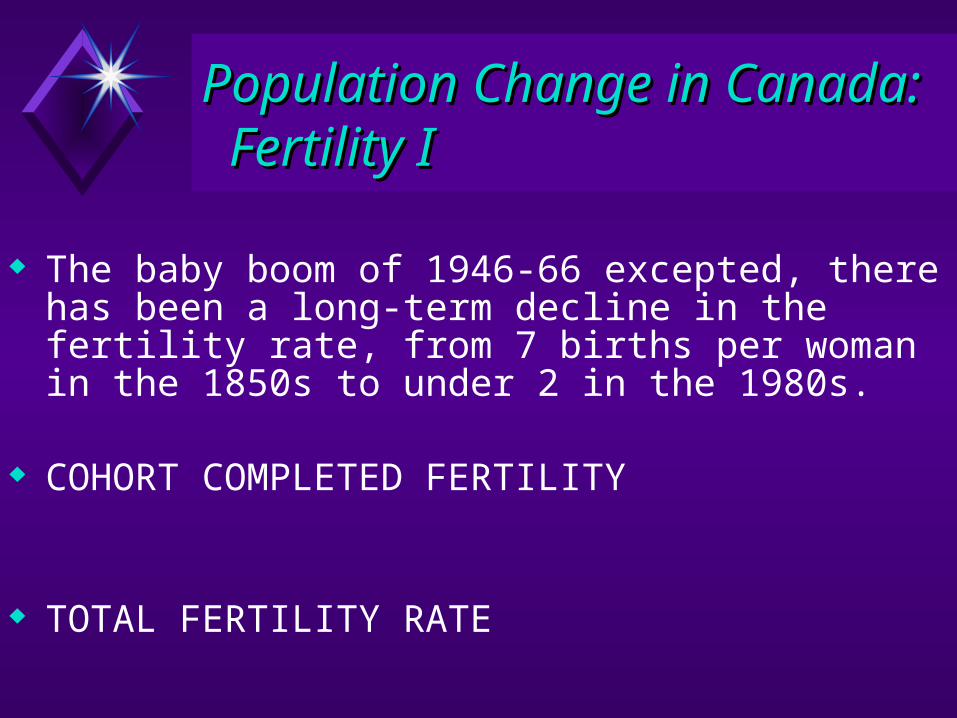
Population Change in Population Change in Canada: Canada: Fertility I Fertility I
The baby boom of 1946-66 excepted, there has been a long-term decline in the fertility rate, from 7 births per woman in the 1850s to under 2 in the 1980s.
COHORT COMPLETED FERTILITY
TOTAL FERTILITY RATE
Population Change in Population Change in Canada: Canada: Fertility II Fertility II
Immediate causes
Economic causes
Structural factors
Cultural factors

Population Change in Population Change in Canada: Immigration ICanada: Immigration I

Population Change in Population Change in Canada: Immigration IICanada: Immigration II

Population Growth, Canada by Population Growth, Canada by Province and Territory, 1951-91 (in Province and Territory, 1951-91 (in percent)percent)
161133 143 145
175
228
143121
277299
319
383
0
50
100
150
200
250
300
350
400NFLD
PEI
NS
NB
QUE
ONT
MAN
SASK
ALTA
BC
YUK
NWT
% growth
Canada = 201%

Immigration and Emigration, Immigration and Emigration, Canada, 1988-95 (in ‘000s)Canada, 1988-95 (in ‘000s)
0
50
100
150
200
250
300
88 89 90 91 92 93 94 95
immigration
emigration
‘‘000s000s
YearYear
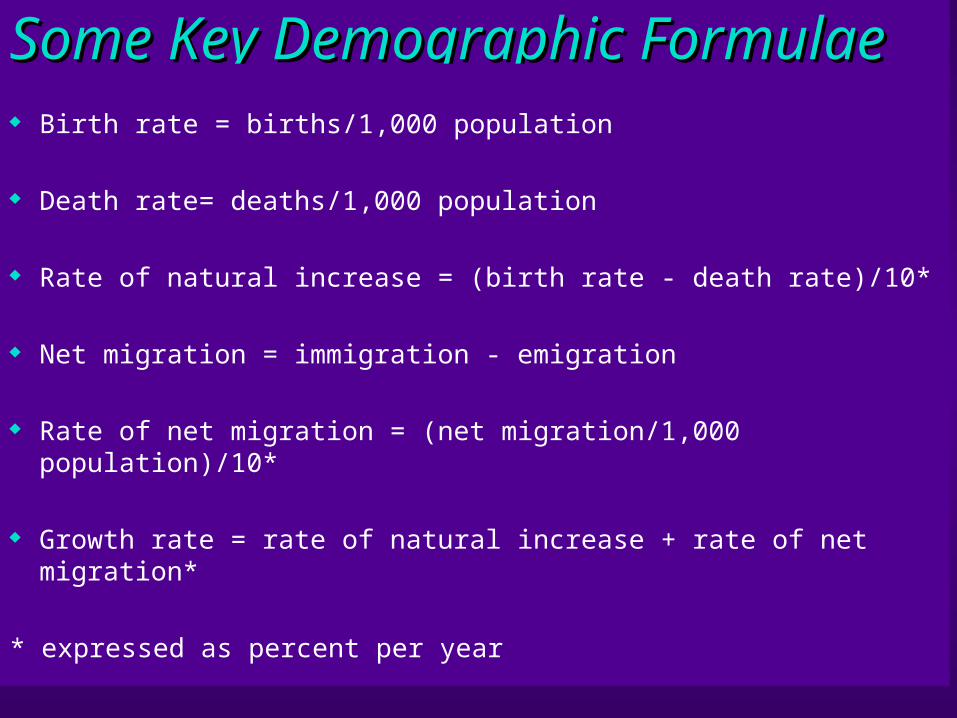
Some Key Demographic Some Key Demographic FormulaeFormulae Birth rate = births/1,000 population
Death rate= deaths/1,000 population
Rate of natural increase = (birth rate - death rate)/10*
Net migration = immigration - emigration
Rate of net migration = (net migration/1,000 population)/10*
Growth rate = rate of natural increase + rate of net migration*
* expressed as percent per year