Population Size Drives Industrial Saccharomyces cerevisiae ...68). Yeast improvement aimed at...
13
APPLIED AND ENVIRONMENTAL MICROBIOLOGY, Apr. 2011, p. 2772–2784 Vol. 77, No. 8 0099-2240/11/$12.00 doi:10.1128/AEM.02547-10 Copyright © 2011, American Society for Microbiology. All Rights Reserved. Population Size Drives Industrial Saccharomyces cerevisiae Alcoholic Fermentation and Is under Genetic Control †‡ Warren Albertin, 1,2 Philippe Marullo, 2,3 Michel Aigle, 4 Christine Dillmann, 5 Dominique de Vienne, 5 Marina Bely, 2 and Delphine Sicard 5 * CNRS, UMR 0320/UMR 8120 Ge ´ne ´tique Ve ´ge ´tale, F-91190 Gif-sur-Yvette, France 1 ; Universite ´ Bordeaux 2, ISVV, USC Oenologie, 210 Chemin de Leysotte, F-33882 Villenave d’Ornon, France 2 ; SARCO/LAFFORT Group, 7 Rue Franc Sanson, F-33370 Floirac, France 3 ; Universite ´ Lyon 1, UMR 5240 Microbiologie Adaptation et Pathoge ´nie, F-69622 Villeurbanne, France 4 ; and Universite ´ Paris-Sud, UMR 0320/UMR 8120 Ge ´ne ´tique Ve ´ge ´tale, F-91190 Gif-sur-Yvette, France 5 Received 29 October 2010/Accepted 17 February 2011 Alcoholic fermentation (AF) conducted by Saccharomyces cerevisiae has been exploited for millennia in three important human food processes: beer and wine production and bread leavening. Most of the efforts to understand and improve AF have been made separately for each process, with strains that are supposedly well adapted. In this work, we propose a first comparison of yeast AFs in three synthetic media mimicking the dough/wort/grape must found in baking, brewing, and wine making. The fermentative behaviors of nine food-processing strains were evaluated in these media, at the cellular, populational, and biotechnological levels. A large variation in the measured traits was observed, with medium effects usually being greater than the strain effects. The results suggest that human selection targeted the ability to complete fermentation for wine strains and trehalose content for beer strains. Apart from these features, the food origin of the strains did not significantly affect AF, suggesting that an improvement program for a specific food processing industry could exploit the variability of strains used in other industries. Glucose utilization was analyzed, revealing plastic but also genetic variation in fermentation products and indicating that artificial selection could be used to modify the production of glycerol, acetate, etc. The major result was that the overall maximum CO 2 production rate (V max ) was not related to the maximum CO 2 production rate per cell. Instead, a highly significant correlation between V max and the maximum population size was observed in all three media, indicating that human selection targeted the efficiency of cellular reproduction rather than metabolic efficiency. This result opens the way to new strategies for yeast improvement. Saccharomyces cerevisiae alcoholic fermentation (AF) has been exploited for several millennia throughout the world in a variety of food processes of crucial importance for humans. It has been used to produce alcoholic beverages, including beer and wine. These beverages seem to be connected to anthropic activity since the beginning of human civilization, as suggested by some archaeological records (11, 40, 47). Leavened bread, another human fundamental foodstuff, has made use of alco- holic fermentation for a long time: the study of baking prac- tices revealed the use of yeast to leaven dough in ancient Egypt (57). At that time, alcoholic fermentation began due to the natural presence of indigenous yeast in wort/grape must/dough or, alternatively, via empirical leavening practice yet with total ignorance regarding the existence of microorganisms and their fermentative role. Indeed, beer, wine, and bread were pro- duced with the help of yeast several thousand years before its role was formally proven by Pasteur in 1860 (45). Controlling alcoholic fermentation actually began with the development of yeast culture in the early 1880s, with the work of Emil Christian Hansen, head of the Carlsberg Laboratory in Copenhagen, Denmark. The use of pure yeast culture to initiate alcoholic fermentation progressively came to dominate worldwide prac- tices, and the utilization of starter strains adapted to each food process is now the rule rather than the exception in brewing, wine making, and baking. Thus, several efforts have been un- dertaken to improve yeast strains used in the food and bever- age industry, using various approaches, such as phenotypic selection of natural isolates (22), mutagenesis (13), clone and meiospore selection (13, 36, 50), breeding programs assisted by technological tests (13, 37, 38, 55) or quantitative trait locus (QTL) introgression (32, 37, 39), and genetic engineering (17, 68). Yeast improvement aimed at enhancing the efficiency of the fermentation process as well as the quality of the products, implying specific biotechnological targets regarding the nature of the final products: freezing tolerance, flocculation, aromatic contribution, and ethanol tolerance, as exhaustively described in the literature (18, 34, 47). Most of the efforts to understand or to improve alcoholic fermentation were specific to each food processing context, ignoring other genetic resources and information from other food processes. As a consequence, food processing strains are genetically clustered according to their industrial origin (21, 33), which reflects human activity. Although important differences exist between these food pro- cesses (e.g., the nature of assimilable sugar, temperature, pro- cess time, etc.), alcoholic fermentation is expected to be one of the main targets of human selection. Alcoholic fermentation is a complex bioprocess that results * Corresponding author. Mailing address: Universite ´ Paris-Sud, UMR 0320/UMR 8120 Ge ´ne ´tique Ve ´ge ´tale, Ferme du Moulon, F-91190 Gif-sur-Yvette, France. Phone: 33 1 69 33 22 42. Fax: 33 1 69 33 23 40. E-mail: [email protected]. † Supplemental material for this article may be found at http://aem .asm.org/. Published ahead of print on 25 February 2011. ‡ The authors have paid a fee to allow immediate free access to this article 2772 on March 28, 2020 by guest http://aem.asm.org/ Downloaded from
Transcript of Population Size Drives Industrial Saccharomyces cerevisiae ...68). Yeast improvement aimed at...

APPLIED AND ENVIRONMENTAL MICROBIOLOGY, Apr. 2011, p. 2772–2784 Vol. 77, No. 80099-2240/11/$12.00 doi:10.1128/AEM.02547-10Copyright © 2011, American Society for Microbiology. All Rights Reserved.
Population Size Drives Industrial Saccharomyces cerevisiae AlcoholicFermentation and Is under Genetic Control�†‡
Warren Albertin,1,2 Philippe Marullo,2,3 Michel Aigle,4 Christine Dillmann,5 Dominique de Vienne,5Marina Bely,2 and Delphine Sicard5*
CNRS, UMR 0320/UMR 8120 Genetique Vegetale, F-91190 Gif-sur-Yvette, France1; Universite Bordeaux 2, ISVV, USC Oenologie,210 Chemin de Leysotte, F-33882 Villenave d’Ornon, France2; SARCO/LAFFORT Group, 7 Rue Franc Sanson, F-33370 Floirac,
France3; Universite Lyon 1, UMR 5240 Microbiologie Adaptation et Pathogenie, F-69622 Villeurbanne, France4; andUniversite Paris-Sud, UMR 0320/UMR 8120 Genetique Vegetale, F-91190 Gif-sur-Yvette, France5
Received 29 October 2010/Accepted 17 February 2011
Alcoholic fermentation (AF) conducted by Saccharomyces cerevisiae has been exploited for millennia in threeimportant human food processes: beer and wine production and bread leavening. Most of the efforts tounderstand and improve AF have been made separately for each process, with strains that are supposedly welladapted. In this work, we propose a first comparison of yeast AFs in three synthetic media mimicking thedough/wort/grape must found in baking, brewing, and wine making. The fermentative behaviors of ninefood-processing strains were evaluated in these media, at the cellular, populational, and biotechnologicallevels. A large variation in the measured traits was observed, with medium effects usually being greater thanthe strain effects. The results suggest that human selection targeted the ability to complete fermentation forwine strains and trehalose content for beer strains. Apart from these features, the food origin of the strains didnot significantly affect AF, suggesting that an improvement program for a specific food processing industrycould exploit the variability of strains used in other industries. Glucose utilization was analyzed, revealingplastic but also genetic variation in fermentation products and indicating that artificial selection could be usedto modify the production of glycerol, acetate, etc. The major result was that the overall maximum CO2production rate (Vmax) was not related to the maximum CO2 production rate per cell. Instead, a highlysignificant correlation between Vmax and the maximum population size was observed in all three media,indicating that human selection targeted the efficiency of cellular reproduction rather than metabolic efficiency.This result opens the way to new strategies for yeast improvement.
Saccharomyces cerevisiae alcoholic fermentation (AF) hasbeen exploited for several millennia throughout the world in avariety of food processes of crucial importance for humans. Ithas been used to produce alcoholic beverages, including beerand wine. These beverages seem to be connected to anthropicactivity since the beginning of human civilization, as suggestedby some archaeological records (11, 40, 47). Leavened bread,another human fundamental foodstuff, has made use of alco-holic fermentation for a long time: the study of baking prac-tices revealed the use of yeast to leaven dough in ancient Egypt(57). At that time, alcoholic fermentation began due to thenatural presence of indigenous yeast in wort/grape must/doughor, alternatively, via empirical leavening practice yet with totalignorance regarding the existence of microorganisms and theirfermentative role. Indeed, beer, wine, and bread were pro-duced with the help of yeast several thousand years before itsrole was formally proven by Pasteur in 1860 (45). Controllingalcoholic fermentation actually began with the development ofyeast culture in the early 1880s, with the work of Emil Christian
Hansen, head of the Carlsberg Laboratory in Copenhagen,Denmark. The use of pure yeast culture to initiate alcoholicfermentation progressively came to dominate worldwide prac-tices, and the utilization of starter strains adapted to each foodprocess is now the rule rather than the exception in brewing,wine making, and baking. Thus, several efforts have been un-dertaken to improve yeast strains used in the food and bever-age industry, using various approaches, such as phenotypicselection of natural isolates (22), mutagenesis (13), clone andmeiospore selection (13, 36, 50), breeding programs assisted bytechnological tests (13, 37, 38, 55) or quantitative trait locus(QTL) introgression (32, 37, 39), and genetic engineering (17,68). Yeast improvement aimed at enhancing the efficiency ofthe fermentation process as well as the quality of the products,implying specific biotechnological targets regarding the natureof the final products: freezing tolerance, flocculation, aromaticcontribution, and ethanol tolerance, as exhaustively describedin the literature (18, 34, 47). Most of the efforts to understandor to improve alcoholic fermentation were specific to eachfood processing context, ignoring other genetic resources andinformation from other food processes. As a consequence,food processing strains are genetically clustered according totheir industrial origin (21, 33), which reflects human activity.Although important differences exist between these food pro-cesses (e.g., the nature of assimilable sugar, temperature, pro-cess time, etc.), alcoholic fermentation is expected to be one ofthe main targets of human selection.
Alcoholic fermentation is a complex bioprocess that results
* Corresponding author. Mailing address: Universite Paris-Sud,UMR 0320/UMR 8120 Genetique Vegetale, Ferme du Moulon,F-91190 Gif-sur-Yvette, France. Phone: 33 1 69 33 22 42. Fax: 33 1 6933 23 40. E-mail: [email protected].
† Supplemental material for this article may be found at http://aem.asm.org/.
� Published ahead of print on 25 February 2011.‡ The authors have paid a fee to allow immediate free access to this
article
2772
on March 28, 2020 by guest
http://aem.asm
.org/D
ownloaded from
from the interaction of numerous genetic, metabolic, and en-vironmental parameters. This complexity may explain in partthe failure of attempts to increase the fermentation ratethrough the overexpression of various glycolytic enzymes (16,30, 31, 46, 58). For a relevant characterization of alcoholicfermentation in various food processes, it is thus necessary toconsider different levels of cellular integration and to analyzetheir relationships. In particular, a high rate of fermentationcan be reached in two ways: by enhancing the rate of fermen-tation per cell (i.e., high CO2 rate per cell) and/or by enhancingthe number of cells per population. Such an issue, which iscrucial to identifying the factors controlling fermentation rate,has never been investigated before and requires the analysis ofthe relationship between fermentation kinetics and populationdynamics.
We propose the first comparison of yeast alcoholic fermen-tation and population growth dynamics in three different syn-thetic media mimicking the dough/wort/grape must found inbaking, brewing, and wine making, respectively. We call thesemedia bakery, brewery, and enology media, respectively. Wecompared the behaviors of nine different food processing S.cerevisiae strains, and we investigated different biological lev-els: we focused on the fermentation kinetics (AF kineticstraits), and the main products of alcoholic fermentation (met-abolic traits) were quantified at the end of the process. Al-though some of these metabolites have a strong impact on thefinal quality of the beverages/foods produced, their variabilitywithin food processes and strains had never been investigatedbefore. At the population level, we measured “life historytraits,” which reflect population kinetics and have been foundto be related to yeast evolution (23, 64).
The aims of this study were (i) to compare the behaviors ofdifferent yeast strains in the three main food processes (winemaking, brewing, and baking); (ii) to examine the effect ofhuman selection on food processing strains; (iii) to study theplasticity and genetic variability of the different fermentationproducts between food processes and strains; (iv) to analyzethe relationships between AF kinetics parameters, metabolictraits, and life history traits during alcoholic fermentation; and(v) to propose a new rationale for strain selection.
MATERIALS AND METHODS
Biological material. Twenty-six strains of Saccharomyces cerevisiae comingfrom different geographical origins and food processing industries (wine making,
brewing, baking, and distilling) were initially selected to be representative of themain genetic clusters found in S. cerevisiae food processing strains (1). A previouswork showed that strains from baking were mostly autotetraploids (1). To avoidpossible effects of ploidy level, we excluded baking strains from the final panel.For each of the nine chosen food processing strains (Table 1), one meiospore wasisolated with a micromanipulator (Singer MSM Manual; Singer Instrument,Somerset, United Kingdom). Six out of nine strains were homothallic (HO/HO)(294, 328, 382, F10, VL1, and BO213), so that the isolated meiospore gave riseto a fully homozygous diploid strain through mating type switch and furtherfusion of opposite-mating-type cells. For the three heterothallic strains (ho/ho)(963, A24, and 7327), the isolated haploid meiospore was diploidized via tran-sient expression of the HO endonuclease: the strains were transformed with thepHS2 plasmid (kindly given by S. Himanshu) using the lithium acetate transfor-mation protocol described by Gietz and Schiestl (26). After diploidization, theplasmid was eliminated from the strains through recurrent cultures on yeastextract-peptone-dextrose (YPD) medium. The resulting biological material wasconstituted by four wine-making strains (E1 to E4) (here called wine strains), twobrewing strains (B1 and B2) (here called beer strains), and three distilling strains(D1 to D3) (here called distillery strains) (Table 1). All strains were currentlygrown at 30°C in YPD medium containing 1% yeast extract (Difco Laboratories,Detroit, MI), 1% Bacto peptone (Difco), and 2% glucose, supplemented or notwith 2% agar.
Synthetic fermentative media. Three synthetic fermentative media were used;they differed in their levels of sugar and nitrogen, pH, osmotic pressure, andanaerobic growth factors in order to reflect the main changes of fermentationmedium between brewing, baking, and wine-making contexts (see Table 2).Maltose is the main available sugar in wort and dough (14, 44), and yet most ofthe strains used in wine making cannot assimilate it (42). Moreover, previouswork shows that the presence of maltose in the medium could affect glycolysiseven for strains lacking the maltose permease (52). Therefore, to compare thebasal fermentative behaviors of different food processing strains including thoseof wine-making origin, we decided to use glucose as the only carbon source in allthree media. Although distillery strains were included, no distilling medium(here called distillery medium) was used. Indeed, the distilling process refers todistinct processes, including the production of distilled beverages such as cognac,whisky, tequila, or other spirits and the production of bioethanol fuel fromvarious crops (sugarcane or beet molasses), etc. The compositions of thesedifferent distillery media vary greatly regarding sugar content, pH, osmotic pres-sure, nutrient limitation, or starvation, as illustrated for molasses composition(2), so that it was not possible to propose a single representative distillerymedium.
The enology medium was modified from the work of Marullo et al. (37) andBely et al. (4, 5) and contained glucose (220 g liter�1), tartaric acid (3 g liter�1),citric acid (0.3 g liter�1), L-malic acid (0.3 g liter�1), and myoinositol (0.3 gliter�1). The available nitrogen was 200 mg liter�1, provided by 315 mg liter�1
(NH4)2SO4 (corresponding to 66.7 mg liter�1 nitrogen) and 0.67% (vol/vol) of amixture of 18 amino acids containing L-tyrosine (9.4 mg liter�1), L-tryptophan(92.3 mg liter�1), L-isoleucine (16.9 mg liter�1), L-aspartic acid (22.9 mg liter�1),L-glutamic acid (62 mg liter�1), L-arginine (192.8 mg liter�1), L-leucine (24.9 mgliter�1), L-threonine (39.1 mg liter�1), L-glycine (9.4 mg liter�1), L-glutamine(260.2 mg liter�1), L-alanine (74.8 mg liter�1), L-valine (22.9 mg liter�1), L-me-thionine (16.2 mg liter�1), L-phenylalanine (19.5 mg liter�1), L-serine (40.4 mgliter�1), L-histidine (16.9 mg liter�1), L-lysine (8.8 mg liter�1), and L-cysteine (6.7
TABLE 1. Origins of Saccharomyces cerevisiae strains
Food processingparental strain
Monosporicderivate Collection/suppliera Food origin Area of origin Reproductive mode Ploidy level
CLIB-382 B1 CIRM-Levures Brewery Japan Homothallic DiploidNRRL-Y-7327 B2 NRRL Brewery Tibet Heterothallic DiploidCLIB-294 D1 CIRM-Levures Distillery France Homothallic DiploidAlcotec 24 D2 Hambleton Bard Distillery UK Heterothallic Diploid963 D3 Confidential Distillery Confidential Heterothallic Not availableCLIB-328 E1 CIRM-Levures Enology UK Homothallic DiploidBO213 E2b Laffort Oenologie Enology France Homothallic DiploidVL1 E3b Laffort Oenologie Enology France Homothallic DiploidF10 E4b Laffort Oenologie Enology France Homothallic Diploid
a CIRM-Levures, http://www.inra.fr/internet/Produits/cirmlevures; NRRL, http://nrrl.ncaur.usda.gov; Hambleton Bard, Chesterfield, United Kingdom; LaffortOenologie, Bordeaux, France.
b E2, E3, and E4 were previously referenced as SB, GN, and G-4A, respectively (37, 38).
VOL. 77, 2011 ALCOHOLIC FERMENTATION WITHIN DIFFERENT FOOD PROCESSES 2773
on March 28, 2020 by guest
http://aem.asm
.org/D
ownloaded from

mg liter�1) in NaHCO3 (134.8 mg liter�1), corresponding to 133.3 mg liter�1
available nitrogen. The mineral salts were provided by KH2PO4 (2 g liter�1),MgSO4 � 7H2O (0.2 g liter�1), MnSO4 (4 mg liter�1), ZnSO4 � 7H2O (4 mgliter�1), CuSO4 � 5H2O (1 mg liter�1), KI (1 mg liter�1), CoCl2 � 6H2O (0.4 mgliter�1), (NH4)6Mo7O24 � 4H2O (1 mg liter�1), and H3BO3 (1 mg liter�1); thevitamins were as follows: biotin (0.04 mg liter�1), thiamine-HCl (1 mg liter�1),pyridoxine-HCl (1 mg liter�1), nicotinic acid (1 mg liter�1), calcium panthothe-nate (1 mg liter�1), and para-amino benzoic acid (1 mg liter�1). Finally, 0.02%(vol/vol) of a mixture of anaerobic growth factors was added, containing 1.5%(wt/vol) ergosterol and 0.5% (wt/vol) sodium oleate in Tween 80-ethanol (1:1,vol/vol). The pH was adjusted to 3.5 using KOH pellets.
The brewery medium was modified from the enology medium. The pH wasadjusted to 4.5 using 40 mM citrate buffer, pH 4, replacing tartaric, citric, andmalic acids. The glucose content was 80 g liter�1, and nitrogen content wasmodified as follows: 400 mg liter�1 available nitrogen, one-third coming from 630mg liter�1 (NH4)2SO4 and two-thirds coming from 13.49% (vol/vol) of themixture of amino acids described below. Brewery medium was not supplementedwith anaerobic growth factors.
The bakery medium was modified from the enology medium. The pH wasadjusted to 5.5 using 40 mM citrate buffer, pH 5.2, replacing tartaric, citric, andmalic acids. The glucose content was 80 g liter�1, and nitrogen content wasmodified as follows: 400 mg liter�1 available nitrogen, one-third coming from 630mg liter�1 (NH4)2SO4 and two-thirds coming from 13.49% (vol/vol) of themixture of amino acids described below. Sorbitol (150 g liter�1, i.e., 0.82 molliter�1) was also added in order to increase the osmotic pressure. Bakery me-dium was not supplemented with anaerobic growth factors.
Fermentation conditions. The media were filtered through an 0.45-�m nitrate-cellulose membrane before inoculation. Precultures were run in diluted half-synthetic medium for 20 h at 24°C with orbital agitation (150 rpm), and popu-lation sizes were measured using a particle counter (Z2 Coulter counter;Beckman Coulter, Villepinte, France). The fermentative media were inoculatedat 106 cells per ml, and fermentation triplicates were run in closed 1.2-liter glassreactors, locked to maintain anaerobiosis, with permanent stirring (�150 rpm) at22°C (5). CO2 was released through a sterile air outlet condenser. After yeastinoculation, the pH of the medium was not controlled, differing from a chemostatmode.
Fermentation kinetics. The amount of CO2 released was determined by au-tomatic measurement of glass reactor weight loss every 20 min (8, 19). The CO2
production rate (g liter�1 h�1) was calculated using a local polynomial regressionfitting (loess function, R program [51]). Different kinetics parameters werecalculated as previously described (37). The lag-phase time (h) was the timebetween inoculation and the beginning of CO2 release (CO2 production ratehigher than 0.05 g liter�1 h�1). Similarly, the end of the fermentation wasdetermined to be when the CO2 production rate dropped below 0.05 g liter�1
h�1. This point allowed us to estimate the AF time (alcoholic fermentation time;hours), which was the time necessary to ferment the sugars in the medium,excluding the lag phase. All strains were able to achieve the fermentation (i.e., toconsume over 98.5% of initial sugar) except strains B1, B2, D1, D2, and D3 inenology medium. However, these five strains displayed sluggish fermentationunder winery-type conditions, so that the corresponding AF time was higher thanthat for strains actually achieving AF. Thus, the AF time parameter was relevantto compare the global fermentation abilities of the strains, whatever the medium.Vmax (g liter�1 h�1) was the maximal CO2 production rate. Finally, CO2tot wasthe total amount of CO2 released at the end of the fermentation (g liter�1).
Population dynamics, cell size, and growth recovery. The population growthand the cell size were monitored regularly using a particle counter (Z2 Coultercounter; Beckman Coulter, Villepinte, France); more than 20 samples per fer-mentation were taken from the inoculation time until the carrying capacity(maximum population size, K) was reached. During the exponential phase, sam-ples were taken every 2 or 3 h in order to have a good estimate of the maximumrate of increase of the population (intrinsic growth rate, r). The experimentalpoints were fitted with a logistic model that allowed estimation of K and r:
Nt �K N0 ert
K � N0�ert � 1�
where Nt is the population size at time t, K is the carrying capacity (cells per ml),N0 is the initial population size, and r is the intrinsic growth rate (number ofdivisions per hour). At the end of the fermentation, the proportion of cells ableto form colonies (CFU) after 2 days on YPD agar plates was determined andreferred to as the growth recovery (%). This parameter is usually assimilated asan indirect measure of cell viability in microbiology (62). Finally, the cell size wasmeasured at the end of alcoholic fermentation using a particle counter (Z2
Coulter counter; Beckman Coulter, Villepinte, France) and the mean cell size(diameter [�m]) was calculated and used for further analyses.
CO2-specific flux. The CO2-specific flux (J, the CO2 production rate per cell,g h�1 cell�1) was calculated by dividing the CO2 production rate by the numberof cells for a given volume. In particular, we calculated the Jmax, which is themaximum CO2 production rate per cell.
Dosage of alcoholic fermentation products. At the end of the alcoholic fer-mentation, several dosages were made: ethanol concentration (percent volume)was determined by infrared reflectance (Infra-Analyzer 450; Technicon, Plaisir,France), and residual glucose (g liter�1) and acetic acid production (g liter�1)were measured by colorimetry (A460) in continuous flux (Sanimat, Montauban,France) in the supernatant. For the analyses of variance (ANOVAs), we con-sidered a derived variable, ethanol/glucose ratio (in mol/mol), to compare eth-anol yields. External glycerol (g liter�1) and residual nitrogen (g liter�1) wereassayed by the enzymatic method (Boehringer kits 10 148 270 035 and 11 112 732035; R-Biopharm, Darmstadt, Germany), and residual nitrogen was used todetermine nitrogen consumption (%). Biomass dry weights were measured from200 ml of final fermentation medium using a desiccator (SMO 01; ScaltecInstruments GmbH, Gottingen, Germany) and were expressed in g liter�1.
For internal glycogen and trehalose dosages, 10 ml of medium was sampled atthe end of AF and washed twice with 4 ml of 5% (wt/vol) NaCl. After centrif-ugation (5 min, 2,750 � g), yeast pellets were chilled at �20°C. Trehalose wasextracted by twice washing the pellets for 1 h at 4°C in 8 ml of 0.5 M trichloro-acetic acid, with an additional wash with 4 ml of cold H2O. The pellets were keptat 4°C for further glycogen dosage (see below). After centrifugation (5 min,2,750 � g), the washing supernatants were merged and adjusted to 25 ml withH2O. Trehalose was determined with anthrone as described by Roustan andSablayrolles (51, 56). Briefly, 2.5 ml of cold anthrone solution (190 mg anthrone[Sigma-Aldrich, Lyon, France] in 83% [vol/vol] sulfuric acid) was added to 250 �lof the supernatant solution, boiled for 12 min, and immediately cooled on ice tostop the reaction. Optical density at 625 nm (OD625) was measured using aspectrophotometer (Lambda EZ201; Perkin-Elmer, Courtaboeuf, France).Gradual dilutions of trehalose dehydrate (Sigma) were used as standards. Forglycogen dosage, the residual pellets were suspended in 0.5 ml of 8 M HCl, andglycogen was solubilized for 30 min at 60°C using 2 ml of dimethyl sulfoxide(DMSO; Sigma, Lyon, France). The suspension was cooled to room tempera-ture, neutralized using 0.5 ml of 8 M NaOH, and buffered using 17 ml of 0.11 Mcitrate buffer (pH 4.5). Five hundred microliters of sample was used for anovernight hydrolysis at 37°C with 25 �l of amyloglucosidase (Roche). The re-leased glucose was determined using a glucose oxidase kit (Sigma). Trehaloseand glycogen concentrations were expressed in glucose equivalents per cell (gcell�1). As glycogen extraction is not considered to be exhaustive, minor varia-tions may be meaningless.
Glucose allocation. During alcoholic fermentation, the principal carbon fluxgoes from the assimilable carbon source (glucose in this work) to ethanol.Glucose catabolism is also used for biomass production and for the formation ofAF by-products (acetic acid, glycerol, trehalose, and glycogen). A slight propor-tion of glucose is used for cellular maintenance functions during the stationaryphase of fermentation but appears negligible compared to the other routes forglucose catabolism. Thus, to investigate glucose allocation to the main fermen-tation products, we expressed ethanol, acetic acid, and external glycerol in glu-cose equivalents (mol liter�1), taking into account that 1 mol of glucose pro-duced 2 mol of ethanol, 2 mol of acetic acid, or 2 mol of glycerol. Since glycogenand trehalose accounted for 6% to 43% of the biomass depending on themedium and strain used, we subtracted glycogen and trehalose contents frombiomass for glucose allocation studies. Biomass was also approximated in glucoseequivalents: 1 mol of glucose produced 2 mol of ATP, which can itself be usedfor biomass production. Verduyn et al. (67) estimated that the maximum biomassyield from ATP was 28.3 g biomass per mol of ATP under fermentative condi-tions. Biomass (g liter�1) was thus divided by 56.6 (28.3 � 2) to obtain a biomassestimate expressed in glucose equivalents. Although glucose equivalents forbiomass may vary depending on the environmental conditions, this calculationmethod allowed us to get an approximate value of the glucose allocation towardthe different AF products.
Statistical analysis. The variation of each trait was investigated using the lme4package (R program), through the following mixed model of ANOVA: Z � � �mediumi � strainj � blockk � positionl � medium � strainij � εijkl, where Z isthe variable, medium is the medium effect (i � 1, 2, 3), strain is the strain effect(j � 1, …, 9), block is the random block effect (effect of each week of experi-mental repetition, k � 1, …, 11), position is the random position effect (glassreactor position, l � 1, . . ., 15), medium � strain is the interaction effect betweenmedium and strain factors, and ε is the residual error. For further statisticalanalyses (principal component analysis [PCA], linear discriminant analysis
2774 ALBERTIN ET AL. APPL. ENVIRON. MICROBIOL.
on March 28, 2020 by guest
http://aem.asm
.org/D
ownloaded from

[LDA], Spearman’s correlations, etc.), the data were corrected for block andposition effects (random effects). Since classical significance tests are controver-sial for fixed effects in mixed models, we used an alternative method based onMarkov chain Monte Carlo (MCMC) sampling by means of R’s languageRpackage version 1.0 (51; R. H. Baayen, 2009, “languageR: data sets and functionswith Analyzing Linguistic Data: a Practical Introduction to Statistics” [http://cran.r-project.org/web/packages/languageR/index.html]). P values were then adjustedfor multiple testing using Benjamini-Hochberg methods by means of R’s multtestpackage, version 2.1.1 (7, 27, 51). For each variable, the homogeneity of thevariance was assessed using a Levene test by means of R’s car package, version1.2-15 (51; J. Fox, 2009, “car: Companion to Applied Regression” [http://cran.r-project.org/web/packages/car/index.html]), as well as the normality of residualdistribution using a Shapiro test (51). For AF time, r, acetic acid, trehalose, andnitrogen consumption variables, a log transformation was necessary to obtainnormally distributed residues; for glycerol and ethanol/glucose variables, aninverse transformation was applied, while a square root transformation was usedfor glycogen and growth recovery.
To get a general overview of the data, a PCA was performed from thefollowing variables: Vmax, lag-phase time, AF time, K, r, Jmax, CO2tot, ethanol,acetic acid, glycerol, glycogen, trehalose, biomass, cell size, growth recovery, andnitrogen consumption. PCA was run using the ade4 package from the R programon the ANOVA predicted mean for each trait and for each medium-strain
combination. The data were corrected for the random effects and standardized,i.e., mean centered and scaled (12, 51).
For the food origin study, LDA was performed using R’s mda package, version0.3-4 (F. Leisch, K. Hornik, and B. D. Ripley, 2009, “mda: mixture and flexiblediscriminant analysis” [http://cran.r-project.org/web/packages/mda/index.html])on the whole set of data corrected for random effects and using the samevariables as those for the PCA.
Pairwise correlations between variables (mean of three replicates; data cor-rected for random effects) were studied using Spearman’s rank correlations ().Since 120 multiple correlations were computed, P values were corrected formultiple testing using Benjamini-Hochberg methods (7) by means of R’s multtestpackage, version 2.1.1 (27, 51).
For Vmax study, multiple linear regressions were performed within each me-dium to estimate the contribution of K and Jmax to Vmax using the lm function inthe R program (51). The entire data set and summarizing graphs for 15 kineticsand metabolic and life history traits are available as supplemental material(Table S2 and Fig. S1).
RESULTS
Multitrait genetic and plastic variation among strainsgrown in synthetic bakery, brewery, and enology media. Thefermentative abilities and population dynamics of nine fullyhomozygous strains from the wine-making, brewing, anddistilling industries were evaluated in three synthetic mediadiffering in their amount of glucose, nitrogen, pH, osmoticpressure, and anaerobic growth factors (Table 2). To obtainan initial overview of the variability between strains andmedia, a principal component analysis (PCA) was per-formed (Fig. 1), using a total of three parameters represen-tative of the fermentation kinetics (lag-phase time, AF time,and Vmax); 10 metabolic traits, including flux data (Jmax); AFmetabolites (CO2tot, ethanol, acetic acid, glycerol, glyco-
TABLE 2. Main differences between the synthetic bakery, brewery,and enology media
Main component Bakerymedium
Brewerymedium
Enologymedium
Glucose 80 g liter�1 80 g liter�1 220 g liter�1
Assimilable nitrogena 0.4 g liter�1 0.4 g liter�1 0.2 g liter�1
pH 5.5 4.5 3.5Sorbitol (osmotic pressure) 150 g liter�1 No NoAnaerobic growth factors No No Yes
a The assimilable nitrogen was available from ammonium sulfate (one-third)and amino acids (two-thirds).
FIG. 1. Principal component analysis (PCA) of nine food processing S. cerevisiae strains in three synthetic media (brewery, bakery, andenology). Fermentations run in bakery, brewery, and enology media are represented by circles, squares, and diamonds, respectively. B1 andB2, D1 to D3, and E1 to E4 stand for brewery, distillery, and enology strains, respectively. PCA was made from the following variables: Vmax,lag-phase time, AF time, K, r, Jmax, CO2tot, ethanol, acetic acid, glycerol, glycogen, trehalose, nitrogen consumption, biomass, cell size, andgrowth recovery. x axis, percentage of variation explained by principal component 1 (PC1) (41.9%); y axis, percentage of variation explainedby PC2 (27.9%).
VOL. 77, 2011 ALCOHOLIC FERMENTATION WITHIN DIFFERENT FOOD PROCESSES 2775
on March 28, 2020 by guest
http://aem.asm
.org/D
ownloaded from

gen, trehalose, biomass, and nitrogen consumption); andfour life history traits (K, r, cell size, and growth recovery).The first two axes accounted for 69.8% of the total variationand allowed a clear clustering of both strains and culturemedia (Fig. 1). The first axis separated the enology mediumfrom the bakery medium on the traits lag-phase time, K, cellsize, trehalose, and nitrogen consumption. It also separatedthe strains within each medium, with B2 and D3 usuallyisolated from the group composed of E1, E3, E4, B1, and D1strains. The two remaining strains, D2 and E2, displayedintermediate positions and clustered either with the B2-D3group or with the second group, depending on the medium.The second axis separated the enology medium from thebrewery medium on the basis of Vmax and glycerol traitsessentially. This medium-based clustering revealed by thePCA mostly reflected the differences in fermentation kinet-ics (lag-phase time and Vmax) and population dynamics (K)between media as shown in Fig. 2 and 3 (see details below).
In the brewery medium, the CO2 production rate curve
was bell shaped, with a short mean fermentation (AF) timeof 37.85 9.04 h and a high maximum CO2 production rate(Vmax, 1.72 0.32 g liter�1 h�1), whereas in enology me-dium, all strains displayed a strongly asymmetrical curvewith a long fermentation time (mean AF time of 273.58 58.72 h) and a lower Vmax (1.09 0.21 g liter�1 h�1) (Fig.2; Table 3). The bakery medium displayed an intermediateprofile with a mean AF time of 68.74 29.04 h and a slightlylower Vmax of 1.03 0.40 g liter�1 h�1. In the enologymedium, the maximum population size K was higher ([7.15 2.02] � 107 cells ml�1) than those in brewery medium([6.24 1.20] � 107 cells ml�1) and bakery medium ([4.94 1.71] � 107 cells ml�1). Similarly, in the enology andbrewery media, the intrinsic growth rate (r) was significantlyhigher (0.24 and 0.25 division per hour, respectively) thanthat in bakery medium (0.16 division per hour).
In each medium, strains E1, E3, E4, B1, and D1 tended tocluster together. Strains D3 and B2 were remote from theothers due to markedly atypical behavior for most of the
FIG. 2. Fermentation kinetics of nine food processing S. cerevisiae strains in three synthetic media (brewery, bakery, and enology). The foodprocessing origin of the strain is indicated in parentheses; “dist” stands for distillery origin. CO2 production rate is expressed in g liter�1 h�1. Inbakery and brewery media, all strains were able to complete fermentation (i.e., the residual sugar at the end of the fermentation was lower than0.5 g liter�1). In enology medium, only the four wine strains displayed completed fermentation (mean residual sugar concentrations of 0.0, 0.0, 2.9,and 2.1 g liter�1 for E1, E2, E3, and E4, respectively), while beer and distillery strains displayed sluggish or stuck fermentation (residual sugarconcentrations of 23.3, 37.2, 34.4, 7.3, and 102.8 g liter�1 for B1, B2, D1, D2, and D3, respectively). For figure visibility, only the first 250 h offermentation in enology medium was represented.
2776 ALBERTIN ET AL. APPL. ENVIRON. MICROBIOL.
on March 28, 2020 by guest
http://aem.asm
.org/D
ownloaded from

traits. They had lower fermentation and growth abilitiesthan did the others in all media (Fig. 2 and 3). Strains E2and D2 were close to the B2-D3 group in the bakery mediumbut joined the second group in brewery and enology media,with a clear-cut difference in population dynamics (Fig. 2)and fermentation kinetics (Fig. 3) due to poorer adaptationto the bakery medium. Regarding the food origin of thestrains, enology, distillery, and brewery strains were mixedtogether within each medium, so that no clustering associ-ated with food origin was observed.
Genetic and plastic variation for all AF kinetics and meta-bolic and life history traits. Analysis of variance for each traitrevealed that the medium effect was always significant (Ta-ble 3) and accounted for a large part of the total variationfor most parameters (from 21.49% of variance explained bymedium effect for trehalose to 88.76% explained for AFtime). Strain effect was also highly significant and accountedfor a large part of the variance for all parameters, yet to alesser extent than medium effect. The only exception was forethanol/glucose ratio, where no significant strain effect wasevidenced. This result is congruent with current knowledge
of ethanol yield, which is known to vary poorly according tothe S. cerevisiae strain used. Finally, the medium-by-straininteraction effect was significant for all parameters but eth-anol/glucose and r and accounted for 3.38% to 26.03% ofthe total phenotypic variation. This means that the rankingorder of the strains was also medium dependent. For exam-ple, strain D2 had a shorter lag-phase time in enology me-dium but a higher value in brewery medium. Interestingly,although the global trend was a major medium effect fol-lowed by strain and medium-by-strain effects, four atypicalvariables were found: K, trehalose, cell size, and growthrecovery, for which medium effect explained less variationthan did strain effect. It is noteworthy that these four pa-rameters are related to yeast growth ability (29). Straineffect accounted for 56.36% of total variation of K, whilemedium effect accounted for 23.61%. Therefore, eventhough significant plasticity was detected for these fourtraits, the genetic component of their variation was preem-inent. From a biotechnological point of view, such traits areparticularly interesting for traditional breeding programs(36). Altogether, these results revealed high plasticity
FIG. 3. Population dynamics of nine food processing S. cerevisiae strains in three synthetic media (brewery, bakery, and enology). Thefood processing origin of the strain is indicated in parentheses; “dist” stands for distillery origin. Population size is expressed in number ofcells per ml.
VOL. 77, 2011 ALCOHOLIC FERMENTATION WITHIN DIFFERENT FOOD PROCESSES 2777
on March 28, 2020 by guest
http://aem.asm
.org/D
ownloaded from

among media for AF kinetics and metabolic traits and astrong genetic effect among the nine domesticated strainsfor life history traits.
The effect of the food process origins of the strains. ThePCA (Fig. 1) showed no particular clustering according to thefood process origins of the strains, indicating that the foodorigin effect was lower than the medium and strain effectspreviously identified. However, to investigate food origin effectin depth, a linear discriminant analysis (LDA) was made andallowed reliable discrimination of the different food origins(beer, distillery, and wine strains): the a posteriori probability ofcorrectly inferring the food origin of the strains was 0.74. Themain variables accounting for food origin effect were two fer-mentation kinetics parameters, CO2tot and AF time (explain-ing 17.7% and 11.6%, respectively, of the variance of the twoLDA axes), and a storage carbohydrate, trehalose (explaining8.1% of the variance). This reflects the fact that the winestrains displayed reduced AF time regardless of the medium(33.0, 57.0, and 262.5 h mean AF times in brewery, bakery, andenology media, respectively) compared to beer strains (44.4,78.9, and 277.8 h in brewery, bakery, and enology media, re-spectively) and distillery strains (39.8, 77.7, and 288.8 h inbrewery, bakery, and enology media, respectively). Winestrains were also able to produce on average more CO2 thandid beer and distillery strains in enology medium (98.4, 67.5,and 88.1 g liter�1 for wine, beer, and distillery strains, respec-tively, in enology medium). Indeed, only the four wine strains(E1, E2, E3, and E4) were able to achieve the fermentationunder winery-type conditions (i.e., to consume over 98.5% ofinitial sugar) while the five remaining strains displayed incom-plete (sluggish) fermentation, with final sugar consumptionranging from 53.2% (D3) to 96.7% (D2). Regarding carbohy-drate storage content, beer strains displayed higher trehaloselevels in bakery and brewery media (11.0 � 10�12 g cell�1 and8.5 � 10�12 g cell�1, respectively) than did distillery strains(5.2 � 10�12 g cell�1 and 4.6 � 10�12 g cell�1 in bakery andbrewery media, respectively) and wine ones (4.8 � 10�12 g
cell�1 and 2.7 � 10�12 g cell�1 in bakery and brewery media,respectively).
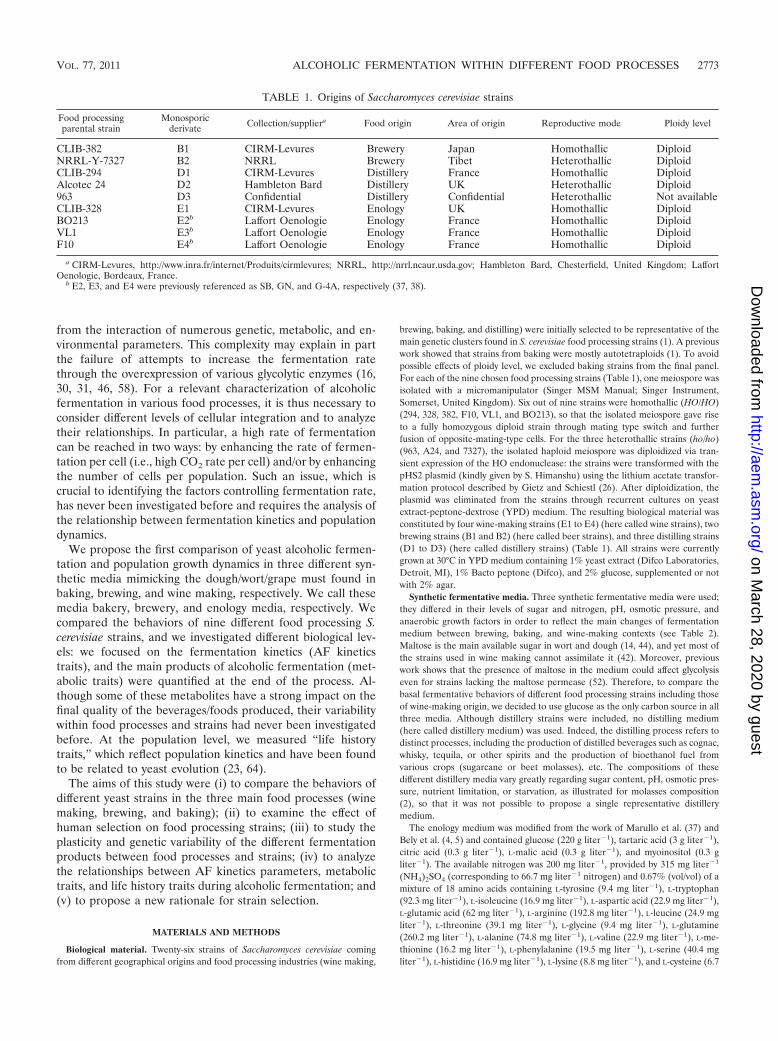
Allocation of catabolized glucose in the cells. To investigatethe variation of glucose allocation to the different AF productsby the cells, we measured the storage carbohydrates (trehaloseand glycogen) and the biomass (without storage carbohy-drates), as well as the acetic acid, glycerol, and ethanol pro-duced at the end of the alcoholic fermentation, and we ex-pressed them in glucose equivalents (mol liter�1; see Table S1in the supplemental material). The total sum of fermentationproducts was close to 100% of catabolized glucose (95.1%,110.5%, and 96.4% in bakery, brewery, and enology media,respectively) (Fig. 4), indicating that our glucose balance ex-plained in a satisfactory way the sugar utilization. Accumula-tion of small errors in dosages of the different fermentationby-products and approximation in conversion of biomass toglucose equivalents may explain the slight under-/overestima-tion of glucose utilization.
We observed clear and significant differences of glucoseallocation depending on the medium (Fig. 4; see also TableS1 in the supplemental material). In bakery medium, 80.9%of the consumed glucose was used for ethanol production,while higher yields were observed in the enology and brew-ery media, with 89.0% and 95.3% of sugar entering theglucose-ethanol flux, respectively. The distribution of theother minor fermentation products was also strongly me-dium dependent, as illustrated in Fig. 4. While a large frac-tion of glucose was devoted to biomass production in brew-ery medium (10.7%), only 6.8% and 3.6% were used forbiomass in bakery and enology media, respectively. Theproportion of glucose going to glycerol also varied greatly,from 3.3% and 3.6% in enology and brewery media, respec-tively, and as much as 5.6% in bakery medium. Glycerol isknown to be produced to counterbalance hyperosmolarity(9, 35). It is thus consistent that the higher glycerol contentwas found in the medium displaying the higher osmoticpressure (bakery). A higher proportion of acetic acid was
TABLE 3. Results of the ANOVAs: mean values and sums of squares for alcoholic fermentation kinetics and metabolic and life history traits
Parameter (unit)a
Mean value % of total sum of squaresb (df)
Bakerymedium
Brewerymedium
Enologymedium Medium (2) Strain (8) Medium by
strain (16) Residual (54)
Vmax (g CO2 liter�1 h�1) 1.03 1.72 1.09 47.62*** 37.29*** 13.84*** 1.26AF time (h) 68.74 37.85 273.58 88.76*** 4.37*** 6.16*** 0.71Lag-phase time (h) 17.72 14.10 12.09 45.44*** 17.63*** 21.86*** 15.07K (cells ml�1) 4.94 � 107 6.24 � 107 7.15 � 107 23.61*** 56.36*** 14.35*** 5.68r (division h�1) 0.16 0.25 0.24 40.58*** 32.81*** 8.38 18.23Ethanol/glucose (mol mol�1) 0.41 0.48 0.45 66.81*** 2.65 7.42 23.13Nitrogen consumption (%) 71 85 95 64.21*** 22.74*** 6.79** 6.26Jmax (g CO2 h�1 cell�1) 2.75 � 10�11 3.34 � 10�11 2.54 � 10�11 29.83*** 23.22*** 26.03*** 20.91Growth recovery (% cultivable cells) 23 44 19 24.93*** 38.42*** 17.96** 18.7Cell size (�m �diam�) 5.61 5.91 5.19 36.63*** 43.26*** 12.38*** 7.72Biomass (g liter�1) 2.01 3.02 2.71 36.23*** 22.25*** 24.55*** 16.97Glycerol (g liter�1) 4.59 2.94 6.56 77.82*** 14.55*** 3.38** 4.24Acetate (g liter�1) 0.79 0.24 0.40 57.25*** 28.28*** 11.57*** 2.89Trehalose (g cell�1) 6.32 � 10�12 4.85 � 10�12 2.72 � 10�12 21.49*** 49.37*** 14.14* 15.01Glycogen (g cell�1) 1.23 � 10�12 1.76 � 10�12 4.02 � 10�12 51.73*** 26.81*** 12.97*** 8.5
a For some parameters, data transformation was necessary to obtain normally distributed residues: log transformation for AF time, r, acetic acid, and trehaloseparameters; inverse transformation for glycerol and ethanol/glucose parameters; and, finally, square root transformation for glycogen and growth recovery.
b With use of the Benjamini-Hochberg correction for multiple testing, significance is indicated as follows: �, significant at 5%; ��, significant at 1%; ���, significantat 0.1%.
2778 ALBERTIN ET AL. APPL. ENVIRON. MICROBIOL.
on March 28, 2020 by guest
http://aem.asm
.org/D
ownloaded from
also made in bakery medium (1.53%) than in brewery andenology media (0.46% and 0.31%, respectively). Finally, lessthan 0.5% initial glucose was used for glycogen and treha-lose storage in all three media. However, allocation to thetwo storage molecules differed. While in enology medium,carbohydrate storage was principally made from glycogen(0.14% compared to 0.09% from trehalose); in brewery andbakery media, it was trehalose (0.33% and 0.31% trehalose,respectively, compared to 0.13% and 0.06% glycogen). Inaddition, although very little initial sugar content is dedi-
cated to trehalose production, we found a significant corre-lation between trehalose and growth recovery ( � 0.57, P 0.01) in accordance with previous data suggesting that tre-halose was related to cell growth ability after quiescence(24, 59, 63, 69).
Analysis of glucose allocation within each medium alsorevealed significant differences between strains. In bakerymedia, subcluster 1 (B2, D3, D2, and E2) was formed ofstrains making, from 1 gram of glucose, more glycerol andmore acetic acid but less biomass than the subcluster 2strains made. Despite overall nonsignificant strain and me-dium-by-strain effects on the ethanol yield, strain B2 in theenology medium differed from other strains by producingmore ethanol with the same amount of glucose but wasunable to complete fermentation (residual sugar of 37.2 gliter�1). In addition, B2 differed by producing more treha-lose than did the other strains.
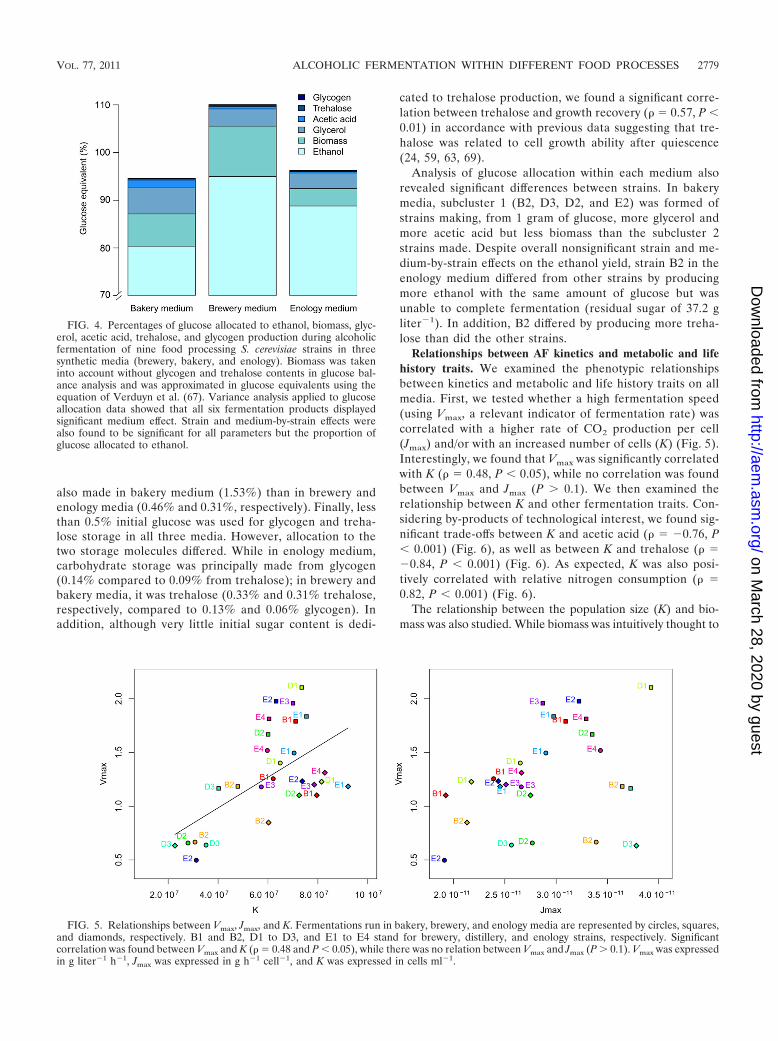
Relationships between AF kinetics and metabolic and lifehistory traits. We examined the phenotypic relationshipsbetween kinetics and metabolic and life history traits on allmedia. First, we tested whether a high fermentation speed(using Vmax, a relevant indicator of fermentation rate) wascorrelated with a higher rate of CO2 production per cell(Jmax) and/or with an increased number of cells (K) (Fig. 5).Interestingly, we found that Vmax was significantly correlatedwith K ( � 0.48, P 0.05), while no correlation was foundbetween Vmax and Jmax (P � 0.1). We then examined therelationship between K and other fermentation traits. Con-sidering by-products of technological interest, we found sig-nificant trade-offs between K and acetic acid ( � �0.76, P 0.001) (Fig. 6), as well as between K and trehalose ( ��0.84, P 0.001) (Fig. 6). As expected, K was also posi-tively correlated with relative nitrogen consumption ( �0.82, P 0.001) (Fig. 6).
The relationship between the population size (K) and bio-mass was also studied. While biomass was intuitively thought to
FIG. 4. Percentages of glucose allocated to ethanol, biomass, glyc-erol, acetic acid, trehalose, and glycogen production during alcoholicfermentation of nine food processing S. cerevisiae strains in threesynthetic media (brewery, bakery, and enology). Biomass was takeninto account without glycogen and trehalose contents in glucose bal-ance analysis and was approximated in glucose equivalents using theequation of Verduyn et al. (67). Variance analysis applied to glucoseallocation data showed that all six fermentation products displayedsignificant medium effect. Strain and medium-by-strain effects werealso found to be significant for all parameters but the proportion ofglucose allocated to ethanol.
FIG. 5. Relationships between Vmax, Jmax, and K. Fermentations run in bakery, brewery, and enology media are represented by circles, squares,and diamonds, respectively. B1 and B2, D1 to D3, and E1 to E4 stand for brewery, distillery, and enology strains, respectively. Significantcorrelation was found between Vmax and K ( � 0.48 and P 0.05), while there was no relation between Vmax and Jmax (P � 0.1). Vmax was expressedin g liter�1 h�1, Jmax was expressed in g h�1 cell�1, and K was expressed in cells ml�1.
VOL. 77, 2011 ALCOHOLIC FERMENTATION WITHIN DIFFERENT FOOD PROCESSES 2779
on March 28, 2020 by guest
http://aem.asm
.org/D
ownloaded from

depend on both K and cell size, biomass and K were found tobe significantly correlated ( � 0.60, P 0.01) (Fig. 6), whileno correlation was detected for biomass and cell size.
Regarding cell size, a positive significant phenotypic corre-lation was found between mean cell size and the maximumCO2 production rate per cell (Jmax) ( � 0.65, P 0.01) (Fig.7). As previously found (61), K was found to be negativelycorrelated with cell size ( � �0.69, P 0.001) (Fig. 7).Interestingly, cell size and growth recovery were positively cor-related ( � 0.58, P 0.01) (Fig. 7), as were cell size andtrehalose ( � 0.70, P 0.001) (Fig. 7).
To explore the genetic relationships between Vmax, Jmax, andK, we also analyzed their relationships within each mediumindividually, using multiple linear regressions (Table 4). Weconfirmed that K was the main component of Vmax variationand accounted for 78.7%, 86.0%, and 94.5% of total Vmax
variation in brewery, enology, and bakery media, respectively(Table 4). In contrast, Jmax was found to be significantly related
to Vmax only in bakery medium and accounted for very littleVmax variation (3.24%) (Table 4).
DISCUSSION
Enology, brewery, and bakery media exhibit relevant fer-mentation differences. The yeast S. cerevisiae has been used formillennia in three essential human food processes: baking,brewing, and wine making, while the very beginning of the 21stcentury saw the world ethanol production for transport fueltripling. In the last century, the constant need for processoptimization led to the development of yeast improvementprograms for each food process individually. Selection of yeaststrains of interest requires knowledge of yeast genetic andplastic variation. We developed three synthetic media reflect-ing the main differences between baking, brewing, and wine-making processes, and we studied the fermentative behavior ofnine S. cerevisiae strains of various industrial origins. This ex-
FIG. 6. Relationships between K and trehalose, acetic acid, nitrogen consumption, and biomass. Symbols are the same as those in Fig. 5.Significant correlation was found between K and trehalose ( � �0.84, P 0.001), K and acetic acid ( � �0.76, P 0.001), K and nitrogenconsumption ( � 0.82, P 0.001), and K and biomass ( � 0.60, P 0.01). K was expressed in cells ml�1, trehalose was expressed in g cell�1,acetic acid was expressed in g liter�1, nitrogen consumption was expressed as the percentage of initial nitrogen content consumed, and biomasswas expressed in g liter�1.
2780 ALBERTIN ET AL. APPL. ENVIRON. MICROBIOL.
on March 28, 2020 by guest
http://aem.asm
.org/D
ownloaded from

perimental design allowed relevant exploration of the alcoholicfermentation process in various medium-strain combinations.As expected, we found that the environment was the mainfactor shaping alcoholic fermentation, followed by the geneticfactor and finally by the interaction between environment andgenotype.
Strain behavior reflects weak human selection for food pro-cessing. Interestingly, we found that the effect of the foodprocessing origin of the strains (wine, beer, and distillery)was lower than the strain and medium effects, indicatinggenerally weak human selection for food processing. Themain impact of the origin was on the fermentation achieve-ment: wine strains produced more CO2 in less time, espe-cially in enology medium, where they were able to consumeall the sugar, while the beer and distillery strains displayedslow or incomplete fermentations. As expected, it seemsthat wine strains were selected for their ability to completefermentation under high sugar concentrations (as found ingrape must), which are a key feature in wine making. Inaddition to fermentation completion, trehalose was shownto discriminate beer strains from distillery and wine ones inbrewery and bakery media. Previous work showed that tre-halose content was a key parameter for the brewery process:
FIG. 7. Relationships between cell size, Jmax, K, growth recovery, and trehalose. Symbols are the same as those in Fig. 5. Significant correlationswere found between cell size and Jmax ( � 0.65, P 0.01), cell size and K ( � �0.69, P 0.001), cell size and growth recovery ( � 0.58, P 0.01), and cell size and trehalose ( � 0.70, P 0.001). Jmax was expressed in g liter�1 h�1 cell�1, cell size was expressed in �m (mean diameter),K was expressed in cells ml�1, growth recovery was expressed as the frequency of cultivable cells, and trehalose was expressed in g cell�1.
TABLE 4. Sums of squares of the multiple linear regressions forVmax in bakery, brewery, and enology media
Factor df% of total sum of squaresa
Bakery medium Brewery medium Enology medium
K 1 92.52*** 79.30** 82.97***Jmax 1 4.97* 0.63 3.42Residual 6 2.51 20.08 13.61
a Significance is indicated as follows: �, significant at 5%; ��, significant at 1%;���, significant at 0.1%.
VOL. 77, 2011 ALCOHOLIC FERMENTATION WITHIN DIFFERENT FOOD PROCESSES 2781
on March 28, 2020 by guest
http://aem.asm
.org/D
ownloaded from

beer production generally includes a pitching step to pro-duce biomass before wort inoculation. The viability of pitch-ing yeast is crucial for the subsequent alcoholic fermenta-tion stage and was shown elsewhere to be directly related totrehalose content (29). By selecting for high growth recoveryof pitching yeast in beer production, humans may have in-directly selected for increased trehalose content. Apart fromfermentation completion and trehalose, no signature of se-lection by a specific food process was found to be prominent.This revealed that yeast selection programs can easily ex-ploit genetic variation of strains of various food processorigins.
Glucose allocation displays plastic and genetic variability.The allocation of catabolized glucose to fermentation productsat the end of fermentation varies among the three media andnine strains. The proportion of sugar used for the formation ofthe different AF by-products varies to a large extent, depend-ing essentially on the medium. A large variability was alsofound between strains, except for the ethanol/glucose ratio,which displays intermedium variation but varies weakly be-tween genotypes, in accordance with current knowledge (48).Ethanol yield is a crucial issue in wine making: the most recentimprovements in viticulture practices led to grape musts withincreased initial sugar content and subsequently wine withhigher alcoholic content, while the inverse tendency is requiredfor public health considerations. Our results confirm that thenatural yeast variability for ethanol/glucose ratio is too low tobe exploited through traditional breeding programs in bakery,brewery, and enology media. Indeed, approaches aiming atlowering ethanol yield (for a wine-making or brewing purpose)focus on rerouting the carbon fluxes toward minor AF by-products such as glycerol through enzymatic engineering, withsome success (17, 41, 43, 53).
We observed genetic and plastic variation related to all fer-mentation by-products but not the ethanol/glucose ratio, andthis allowed yeast improvement through standard breedingprograms. For example, the genetic component explainedabout 35% of acetic acid variation, in accordance with previouswork showing that acetate production was easily optimizedthrough breeding (28, 37). Similary, glycerol production can beimproved using selection programs as previously shown (54).
Alcoholic fermentation is driven by population size ratherthan specific flux. In microorganisms, the AF ability is usuallyconfounded with the glycolytic specific flux, which, per defini-tion, is considered at the cellular level. This is usually thoughtto be the main parameter that controls the fermentation ki-netics of the whole population. In this context, several workssearched for the factors controlling the glycolytic flux: in par-ticular, hexose transport and some glycolytic enzymes such asphosphofructokinase or pyruvate kinase have been suggestedto be rate-limiting steps of glycolysis, through in vivo and/or insilico analyses (10, 15, 20, 25, 49). Increasing these factors wasintuitively supposed to increase the glycolytic flux and, there-fore, the global fermentative ability that was exploited forindustrial purposes (46). However, this hypothesis did not takeinto account that the fermentative ability, at the populationlevel, is the result of both specific flux (i.e., flux per cell) andcell number. While no correlation was found between Jmax andVmax in our experimental design, the variation of the maximumpopulation size K explained 79% to 95% of Vmax variation,
confirming that the major factors controlling fermentative abil-ity were population parameters.
Considering K for a new selection approach. The correlationfound between K and Vmax suggests that increasing K wouldalso increase fermentative ability. Accordingly, previous datashowed that a higher carrying capacity was associated with ahigher CO2 production rate in nearly isogenic S. cerevisiaestrains (38), and Varela et al. (66) showed that adding biomassreduced the time to achieve sugar consumption in slow fer-mentations. Using K as a selection criterion for AF wouldtherefore increase the rate of fermentation. Since no geneticvariation was detected for the ethanol/glucose yield, increasingK does not seem to be associated with a reduction of theethanol yield but rather seems to be related to a reduction ofthe yield of other by-products. Indeed, we showed that K wasnegatively correlated with acetate formation. This suggests thatincreasing K by selection may also allow decreasing acetic acid.Indeed, excess acetate is responsible for a well-known off-flavor (vinegary taste) in wine making and brewing and is theobject of attempts at underproduction through mixed culture,including S. cerevisiae and other yeast species, for example (6).The trade-off between K and acetic acid was previously shownunder hyperosmotic conditions (3) and could be related to theredox-equilibrating process: cell growth is associated withNADH excess that must be regenerated quickly to maintainthe cellular redox balance. The glycerol pathway is usuallythought to be the main way to reoxidize the NADH excess dueto biomass formation (65). However, in our experiment, therewas no significant correlation between glycerol content andbiomass or K, suggesting that other reoxidization pathwaysmight be activated. Another NADH-consuming pathway isthrough acetoin formation; it would be interesting to measureand correlate this pathway with cell growth under our condi-tions. Finally, the third way to reoxidize NADH is through thelast step of ethanol production mediated by aldehyde dehydro-genase isozymes. It can be hypothesized that, under excess-NADH conditions, acetaldehyde may be preferentially routedtoward ethanol formation rather than toward acetate produc-tion, leading to an indirect negative correlation between ace-tate and K. This would have an undetectable effect on ethanolyield, the proportion of glucose entering the acetate routebeing small (�2%) compared to the glucose-ethanol highway(�76%) and below the experimental variation (�4%). Al-though undetectable at the ethanol level, the modulation of theethanol/acetate ratio can be hypothesized as an additional al-ternative for the redox-equilibrating purpose. Besides, what-ever the origin of this trade-off, such a negative correlationcould be exploited for a biotechnological purpose, either toimprove fermentative ability or/and to lower acetic acid pro-duction.
Interestingly, K is one of the few parameters for which thestrain effect explained more variation than the medium effect.Since the genetic component has proven to be preeminent, theexploitation of yeast genetic variability should allow the iden-tification of strains with high carrying capacity associated withenhanced fermentative potential. It is noteworthy that thegreat variability of S. cerevisiae has been poorly exploited inimprovement programs, essentially because estimating the fer-mentative ability of a strain requires expensive and time-con-suming experiments. Here, we proposed a new strategy to
2782 ALBERTIN ET AL. APPL. ENVIRON. MICROBIOL.
on March 28, 2020 by guest
http://aem.asm
.org/D
ownloaded from

preselect S. cerevisiae strains with good fermentative potential,based on their carrying capacity: measuring K can be achievedusing a particle counter or a flow cytometer for numerousstrains in a short time, allowing the evaluation of hundreds ofpoorly studied yeast strains available in collection centers.Strains displaying high carrying capacities could then entertraditional breeding programs involving crosses with well-char-acterized industrial strains, for example (38).
“Ant” strategy versus “grasshopper” strategy and their usefor selection. In a previous work, trade-offs between some lifehistory traits had been found, leading to a continuum of lifehistory strategies distributed between two extremes. “Grass-hoppers” have a large cell size and a high rate of glucoseconsumption but have a low carrying capacity; they illustratethe “selfish” strategy in which individual benefits prevail overpopulation considerations (60, 61, 69). In contrast, “ants” havea small cell size and consume glucose at a low rate, whichallows a high carrying capacity to be reached; this evokes a“cooperative” strategy. Ant and grasshopper strategies werealso identified in this work. In addition, we found that grass-hoppers appeared to be more able than ants to resume growthat the end of the fermentation process. Although this resultneeds to be confirmed with additional strains from variousecological niches, it could explain why the grasshopper strategywas maintained through evolution. It is notable that almost allthese parameters (K, cell size, and growth recovery) werefound to display less plasticity than were other fermentationparameters (strain effect was larger than medium effect). Thissuggests that the ant or grasshopper status is above all genet-ically determined, although some plasticity exists. Indeed, onlyone strain changed its strategy depending on the medium: E2displayed a grasshopper strategy in bakery medium and an antstrategy in enology and brewery media. The eight remainingstrains displayed stable strategies in all three media.
From a technological viewpoint, ant strains are of peculiarinterest since they favor increased maximum population size, atrait closely related to fermentation rate. Spor et al. (60)showed that, in a broad collection of yeast strains from variousecological niches, industrial strains were paradoxically amongthe grasshoppers, while extreme ants can be found in forestand laboratory environments. Thus, it could be interesting tomeasure the carrying capacities of such strains under differentfood processing conditions, in order to include them in breed-ing programs to improve fermentative ability.
ACKNOWLEDGMENTS
We thank the anonymous reviewers for their comments, whichhelped improve the manuscript.
This work was supported by the ANR program “blanc” Adaptale-vure NT05-4_45721 and the ANR program “ALIA” HeterosYeastANR-08-ALIA-9.
REFERENCES
1. Albertin, W., et al. 2009. Evidence for autotetraploidy associated with re-productive isolation in Saccharomyces cerevisiae: towards a new domesticatedspecies. J. Evol. Biol. 22:2157–2170.
2. Attfield, P. V. 1997. Stress tolerance: the key to effective strains of industrialbaker’s yeast. Nat. Biotechnol. 15:1351–1357.
3. Bely, M., A. Rinaldi, and D. Dubourdieu. 2003. Influence of assimilablenitrogen on volatile acidity production by Saccharomyces cerevisiae duringhigh sugar fermentation. J. Biosci. Bioeng. 96:507–512.
4. Bely, M., J. M. Sablayrolles, and P. Barre. 1990. Automatic detection ofassimilable nitrogen deficiencies during alcoholic fermentation in enologicalconditions. J. Ferment. Bioeng. 70:246–252.
5. Bely, M., J. M. Sablayrolles, and P. Barre. 1990. Description of alcoholicfermentation kinetics—its variability and significance. Am. J. Enol. Vitic.41:319–324.
6. Bely, M., P. Stoeckle, I. Masneuf-Pomarede, and D. Dubourdieu. 2008.Impact of mixed Torulaspora delbrueckii-Saccharomyces cerevisiae culture onhigh-sugar fermentation. Int. J. Food Microbiol. 122:312–320.
7. Benjamini, Y., and Y. Hochberg. 1995. Controlling the false discovery rate:a practical and powerful approach to multiple testing. J. R. Stat. Soc. Ser. B57:289–300.
8. Bezenger, M. C., J. M. Navarro, P. Abbal, and J. M. Sablayrolles. 1985. Suivide fermentation a I’aide d’un microordinateur personnel, application a lafermentation alcoolique en oenologie. Ind. Agric. Aliment. 102:1283–1291.
9. Blomberg, A., and L. Adler. 1989. Roles of glycerol and glycerol-3-phosphatedehydrogenase (NAD�) in acquired osmotolerance of Saccharomycescerevisiae. J. Bacteriol. 171:1087–1092.
10. Boiteux, A., and B. Hess. 1981. Design of glycolysis. Philos. Trans. R. Soc.Lond. B Biol. Sci. 293:5–22.
11. Cavalieri, D., P. E. McGovern, D. L. Hartl, R. Mortimer, and M. Polsinelli.2003. Evidence for Saccharomyces cerevisiae fermentation in ancient wine. J.Mol. Evol. 57(Suppl. 1):S226–S232.
12. Chessel, D., A. B. Dufour, and J. Thioulouse. 2004. The ade4 package-I-one-table methods. R News 4:5–10.
13. Codon, A. C., et al. 2003. New Saccharomyces cerevisiae baker’s yeast dis-playing enhanced resistance to freezing. J. Agric. Food Chem. 51:483–491.
14. Coghe, S., H. D’Hollander, H. Verachtert, and F. R. Delvaux. 2005. Impactof dark specialty malts on extract composition and wort fermentation. J. Inst.Brew. 111:51–60.
15. Cortassa, S., and M. A. Aon. 1994. Metabolic control analysis of glycolysisand branching to ethanol production in chemostat cultures of Saccharomycescerevisiae under carbon, nitrogen, or phosphate limitations. Enzyme Microb.Technol. 16:761–770.
16. Davies, S. E., and K. M. Brindle. 1992. Effects of overexpression of phos-phofructokinase on glycolysis in the yeast Saccharomyces cerevisiae. Bio-chemistry 31:4729–4735.
17. Dequin, S. 2001. The potential of genetic engineering for improving brewing,wine-making and baking yeasts. Appl. Microbiol. Biotechnol. 56:577–588.
18. Donalies, U. E., H. T. Nguyen, U. Stahl, and E. Nevoigt. 2008. Improvementof Saccharomyces yeast strains used in brewing, wine making and baking.Adv. Biochem. Eng. Biotechnol. 111:67–98.
19. El Haloui, N., D. Picque, and G. Corrieu. 1988. Alcoholic fermentation inwinemaking: on-line measurement of density and carbon dioxide evolution.J. Food Eng. 8:17–30.
20. Evans, P. R., G. W. Farrants, and P. J. Hudson. 1981. Phosphofructokinase:structure and control. Philos. Trans. R. Soc. Lond. B Biol. Sci. 293:53–62.
21. Fay, J. C., and J. A. Benavides. 2005. Evidence for domesticated and wildpopulations of Saccharomyces cerevisiae. PLoS Genet. 1:66–71.
22. Fleet, G. H. 2008. Wine yeasts for the future. FEMS Yeast Res. 8:979–995.23. Flores-Moya, A., E. Costas, and V. Lopez-Rodas. 2008. Roles of adaptation,
chance and history in the evolution of the dinoflagellate Prorocentrum tri-estinum. Naturwissenschaften 95:697–703.
24. Francois, J., and J. L. Parrou. 2001. Reserve carbohydrates metabolism inthe yeast Saccharomyces cerevisiae. FEMS Microbiol. Rev. 25:125–145.
25. Galazzo, J. L., and J. E. Bailey. 1990. Fermentation pathway kinetics andmetabolic flux control in suspended and immobilized Saccharomyces cerevi-siae. Enzyme Microb. Technol. 12:162–172.
26. Gietz, R. D., and R. H. Schiestl. 1991. Applications of high efficiency lithiumacetate transformation of intact yeast cells using single-stranded nucleicacids as carrier. Yeast 7:253–263.
27. Gilbert, H. N., K. S. Pollard, M. J. van der Laan, and S. Dudoit. 2009.Resampling-based multiple hypothesis testing with applications to genomics:new developments in the R/Bioconductor package multtest. Working paper249. University of California at Berkeley Division of Biostatistics WorkingPaper Series. University of California, Berkeley, CA.
28. Giudici, P., and C. Zambonelli. 1992. Biometric and genetic study on aceticproduction for breeding of wine yeast. Am. J. Enol. Vitic. 43:370–374.
29. Guldfeldt, L. U., and N. Arneborg. 1998. The effect of yeast trehalose contentat pitching on fermentation performance during brewing fermentations. J.Inst. Brew. 104:37–39.
30. Hauf, J., F. K. Zimmermann, and S. Muller. 2000. Simultaneous genomicoverexpression of seven glycolytic enzymes in the yeast Saccharomyces cerevi-siae. Enzyme Microb. Technol. 26:688–698.
31. Heinisch, J. 1986. Isolation and characterization of the two structural genescoding for phosphofructokinase in yeast. Mol. Gen. Genet. 202:75–82.
32. Javelot, C., P. Girard, B. Colonna-Ceccaldi, and B. Vladescu. 1991. Intro-duction of terpene-producing ability in a wine strain of Saccharomyces cerevi-siae. J. Biotechnol. 21:239–252.
33. Legras, J. L., D. Merdinoglu, J. M. Cornuet, and F. Karst. 2007. Bread, beerand wine: Saccharomyces cerevisiae diversity reflects human history. Mol.Ecol. 16:2091–2102.
34. Lodolo, E. J., J. L. Kock, B. C. Axcell, and M. Brooks. 2008. The yeastSaccharomyces cerevisiae—the main character in beer brewing. FEMS YeastRes. 8:1018–1036.
VOL. 77, 2011 ALCOHOLIC FERMENTATION WITHIN DIFFERENT FOOD PROCESSES 2783
on March 28, 2020 by guest
http://aem.asm
.org/D
ownloaded from

35. Mager, W. H., and J. C. Varela. 1993. Osmostress response of the yeastSaccharomyces. Mol. Microbiol. 10:253–258.
36. Marullo, P., M. Bely, I. Masneuf-Pomarede, M. Aigle, and D. Dubourdieu.2004. Inheritable nature of enological quantitative traits is demonstrated bymeiotic segregation of industrial wine yeast strains. FEMS Yeast Res. 4:711–719.
37. Marullo, P., et al. 2006. Breeding strategies for combining fermentativequalities and reducing off-flavor production in a wine yeast model. FEMSYeast Res. 6:268–279.
38. Marullo, P., et al. 2009. Genetic improvement of thermo-tolerance in wineSaccharomyces cerevisiae strains by a backcross approach. FEMS Yeast Res.9:1148–1160.
39. Marullo, P., G. Yvert, M. Bely, M. Aigle, and D. Dubourdieu. 2007. Efficientuse of DNA molecular markers to construct industrial yeast strains. FEMSYeast Res. 7:1295–1306.
40. Meussdoerffer, F. G. 2009. A comprehensive history of beer brewing, p. 1–42.In H. M. Esslinger (ed.), Handbook of brewing: processes, technology, mar-kets. Wiley-VCH, Weinheim, Germany.
41. Michnick, S., J. L. Roustan, F. Remize, P. Barre, and S. Dequin. 1997.Modulation of glycerol and ethanol yields during alcoholic fermentation inSaccharomyces cerevisiae strains overexpressed or disrupted for GPD1 en-coding glycerol 3-phosphate dehydrogenase. Yeast 13:783–793.
42. Naumov, G. I., E. S. Naumova, and C. A. Michels. 1994. Genetic variation ofthe repeated MAL loci in natural populations of Saccharomyces cerevisiaeand Saccharomyces paradoxus. Genetics 136:803–812.
43. Nevoigt, E., and U. Stahl. 1996. Reduced pyruvate decarboxylase and in-creased glycerol-3-phosphate dehydrogenase [NAD�] levels enhance glyc-erol production in Saccharomyces cerevisiae. Yeast 12:1331–1337.
44. Panadero, J., F. Randez-Gil, and J. A. Prieto. 2005. Validation of a flour-freemodel dough system for throughput studies of baker’s yeast. Appl. Environ.Microbiol. 71:1142–1147.
45. Pasteur, L. 1860. Memoire sur la fermentation alcoolique. Ann. Chim. Phys.58:323–426.
46. Peter Smits, H., et al. 2000. Simultaneous overexpression of enzymes of thelower part of glycolysis can enhance the fermentative capacity of Saccharo-myces cerevisiae. Yeast 16:1325–1334.
47. Pretorius, I. S. 2000. Tailoring wine yeast for the new millennium: novelapproaches to the ancient art of winemaking. Yeast 16:675–729.
48. Pretorius, I. S., and F. F. Bauer. 2002. Meeting the consumer challengethrough genetically customized wine-yeast strains. Trends Biotechnol. 20:426–432.
49. Pritchard, L., and D. B. Kell. 2002. Schemes of flux control in a model ofSaccharomyces cerevisiae glycolysis. Eur. J. Biochem. 269:3894–3904.
50. Ramirez, M., J. A. Regodon, F. Perez, and J. E. Rebollo. 1999. Wine yeastfermentation vigor may be improved by elimination of recessive growth-retarding alleles. Biotechnol. Bioeng. 65:212–218.
51. R Development Core Team. 2010. R: a language and environment for sta-tistical computing. R Foundation for Statistical Computing, Vienna, Austria.
52. Reijenga, K. A., et al. 2001. Control of glycolytic dynamics by hexose trans-port in Saccharomyces cerevisiae. Biophys. J. 80:626–634.
53. Remize, F., J. L. Roustan, J. M. Sablayrolles, P. Barre, and S. Dequin. 1999.
Glycerol overproduction by engineered Saccharomyces cerevisiae wine yeaststrains leads to substantial changes in by-product formation and to a stim-ulation of fermentation rate in stationary phase. Appl. Environ. Microbiol.65:143–149.
54. Remize, F., J. M. Sablayrolles, and S. Dequin. 2000. Re-assessment of theinfluence of yeast strain and environmental factors on glycerol production inwine. J. Appl. Microbiol. 88:371–378.
55. Romano, P., G. Soli, G. Suzzi, L. Grazia, and C. Zambonelli. 1985. Improve-ment of a wine Saccharomyces cerevisiae strain by a breeding program. Appl.Environ. Microbiol. 50:1064–1067.
56. Roustan, J. L., and J. M. Sablayrolles. 2002. Trehalose and glycogen inwine-making yeasts: methodological aspects and variability. Biotechnol. Lett.24:1059–1064.
57. Samuel, D. 1996. Investigation of ancient Egyptian baking and brewingmethods by correlative microscopy. Science 273:488–490.
58. Schaaff, I., J. Heinisch, and F. K. Zimmermann. 1989. Overproduction ofglycolytic enzymes in yeast. Yeast 5:285–290.
59. Shi, L., B. M. Sutter, X. Ye, and B. P. Tu. 2010. Trehalose is a key deter-minant of the quiescent metabolic state that fuels cell cycle progression uponreturn to growth. Mol. Biol. Cell 21:1982–1990.
60. Spor, A., et al. 2009. Niche-driven evolution of metabolic and life-historystrategies in natural and domesticated populations of Saccharomyces cerevi-siae. BMC Evol. Biol. 9:296.
61. Spor, A., S. Wang, C. Dillmann, D. de Vienne, and D. Sicard. 2008. “Ant”and “grasshopper” life-history strategies in Saccharomyces cerevisiae. PLoSOne 3:e1579.
62. Takahashi, S., A. Ando, H. Takagi, and J. Shima. 2009. Insufficiency ofcopper ion homeostasis causes freeze-thaw injury of yeast cells as revealed byindirect gene expression analysis. Appl. Environ. Microbiol. 75:6706–6711.
63. Thevelein, J. M. 1984. Regulation of trehalose mobilization in fungi. Micro-biol. Rev. 48:42–59.
64. Travisano, M., J. A. Mongold, A. F. Bennett, and R. E. Lenski. 1995. Ex-perimental tests of the roles of adaptation, chance, and history in evolution.Science 267:87–90.
65. Van Dijken, J. P., and W. A. Scheffers. 1986. Redox balances in the metab-olism of sugars by yeasts. FEMS Microbiol. Lett. 32:199–224.
66. Varela, C., F. Pizarro, and E. Agosin. 2004. Biomass content governs fer-mentation rate in nitrogen-deficient wine musts. Appl. Environ. Microbiol.70:3392–3400.
67. Verduyn, C., E. Postma, W. A. Scheffers, and J. P. van Dijken. 1990. Ener-getics of Saccharomyces cerevisiae in anaerobic glucose-limited chemostatcultures. J. Gen. Microbiol. 136:405–412.
68. Volschenk, H., M. Viljoen-Bloom, R. E. Subden, and H. J. van Vuuren. 2001.Malo-ethanolic fermentation in grape must by recombinant strains of Sac-charomyces cerevisiae. Yeast 18:963–970.
69. Wang, S., et al. 2011. Switch between life history strategies due to changes inglycolytic enzyme gene dosage in Saccharomyces cerevisiae. Appl. Environ.Microbiol. 77:452–459.
70. Wiemken, A. 1990. Trehalose in yeast, stress protectant rather than reservecarbohydrate. Antonie Van Leeuwenhoek 58:209–217.
2784 ALBERTIN ET AL. APPL. ENVIRON. MICROBIOL.
on March 28, 2020 by guest
http://aem.asm
.org/D
ownloaded from