
Population Policy and Program Monitoring and Evaluation Alejandro N. Herrin and Aniceto C. Orbeta,...
49
Population Policy and Program Monitoring and Evaluation Alejandro N. Herrin and Aniceto C. Orbeta, Jr. May 29, 2003
-
Upload
randolf-wilkinson -
Category
Documents
-
view
212 -
download
1
Transcript of Population Policy and Program Monitoring and Evaluation Alejandro N. Herrin and Aniceto C. Orbeta,...

Population Policy and Program Monitoring and Evaluation
Alejandro N. Herrin and Aniceto C. Orbeta, Jr.
May 29, 2003

2
POPCOM and PIDS Project Reports
• Herrin, A. N., 2002, “Population Policy in the Philippines, 1969-2002”.
• Orbeta, A. C., Jr. et al., 2002, “Review of the Population Program: 1986-2002”.
• Racelis, R. H. and A. N. Herrin, 2003, “Philippine Population Management Program (PPMP) Expenditures, 1998 and 2000”.
• Herrin, A. N., A. C. Orbeta, Jr., F. del Prado, I. Acejo, and J. Cuenca, 2003, “An Evaluation of the Philippine Population Management Program” (in progress).

3
Outline
• Part I: Population policy and program review, with attention to population growth and family planning, 1969-2002
• Part II: Monitoring and evaluating the PPMP: a strategy, some results, and information gaps
• Part III: Some conclusions regarding future directions

4
Part I: Population policy and program review, with attention to population growth and family planning, 1969-2002

5
Population Policy and Program, 1969-2002
• Marcos administration (1967-1986)– emphasis on negative consequences of rapid population
growth
– adopted FP that provided both information and services plus advocacy of a small family size norm
• Aquino administration (1986-1992)– emphasis on rights of couples to determine number of
children
– FP program emphasized maternal and child health
6
Population Policy and Program, 1969-2002
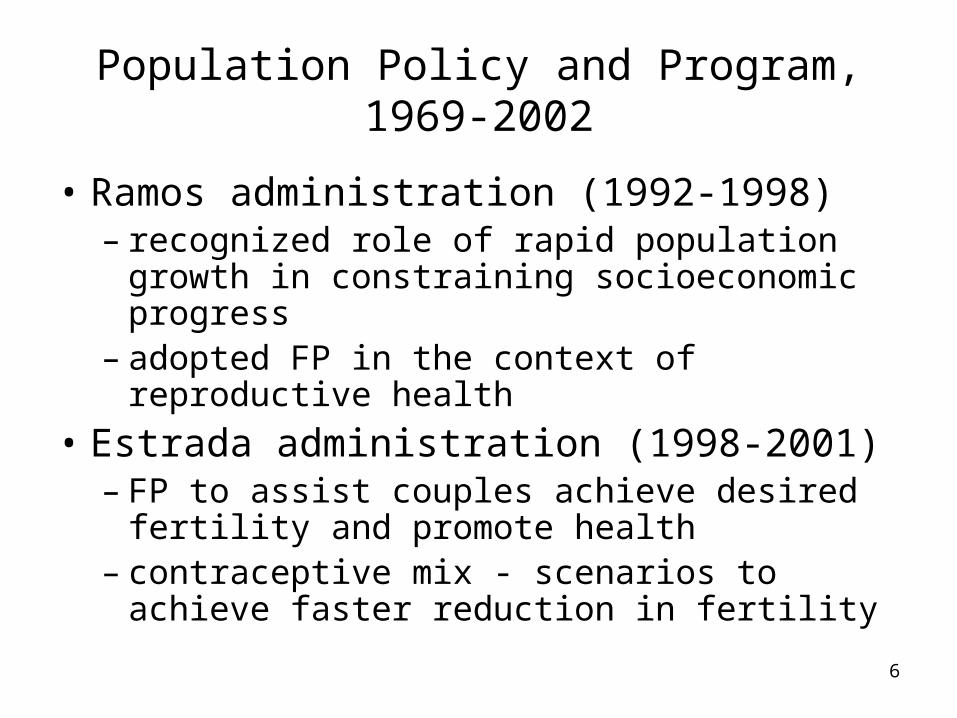
• Ramos administration (1992-1998)– recognized role of rapid population growth in
constraining socioeconomic progress– adopted FP in the context of reproductive health
• Estrada administration (1998-2001)– FP to assist couples achieve desired fertility and
promote health– contraceptive mix - scenarios to achieve faster
reduction in fertility

7
Population Policy and Program, 1969-2002
• Arroyo administration (2001- )– FP emphasizes objective of assisting couples to
achieve desired fertility and promote health– FP program emphasis on promoting modern
Natural Family Planning– Will not fund purchase of contraceptives for
distribution to public health facilities in the event bilateral and multilateral donors stop providing supplies.

8
Factors Influencing Population Policy
• International commitments e.g., International Conference on Population and Development (ICPD)
• Opposition of the Catholic Church hierarchy (especially on the promotion of artificial contraceptives)
• Views of the general public (national demographic surveys and opinion polls)?
• Views of partner GOs and NGOs?

9
Some conclusions from the policy and program review
• Broaden population concerns but address the issue of rapid population growth and fertility reduction once and for all.
• Need for clear and consistent statements of national policy to guide national and LGU programs – need to forge a stable consensus.
• In formulating policy, consider also the views of partner GOs and NGOs, and the larger, albeit unorganized and silent constituency – the married couples with unmet needs for contraception.

10
Some conclusions from the policy and program review
• There are opportunities for working closely with the Catholic Church and other groups in some areas of population policy and family planning.

11
Part II: Monitoring and evaluating the PPMP: a strategy, some results, and information gaps

12
Objective
Strategy
Outputs(services,capacity-building,advocacy,organizationalsupport)
Basic inputs
Utilization(intermediateoutcomes
Outcomes(achievementof policy objective)
Other factors Other factors
Framework for PPMP Monitoring and Evaluation

13
Objective/Strategy
Outputs Utilization/Intermediate
Outcomes
Outcomes (Achievement
of policy objective)
Objective 1: To help couples/parents to achieve their desired family size within the context of responsible parenthood.
Strategy 1: Responsible Parenthood and Family Planning (RP/FP)
Family planning services (available in outlets; wide range of methods)Advocacy/ communication programTraining programsOrganizational support (planning, monitoring, evaluation, coordination, mobilize political support)
Contraceptive prevalence rate: total and by method mixPercent of users by source of supply or service. Unmet need for contraception
Total fertility rate: wanted and unwanted
Responsible Parenthood and Family Planning (RP/FP)
14
Use of Expenditures
1998 2000
Amount (in million pesos)
PercentAmount (in million pesos)
Percent
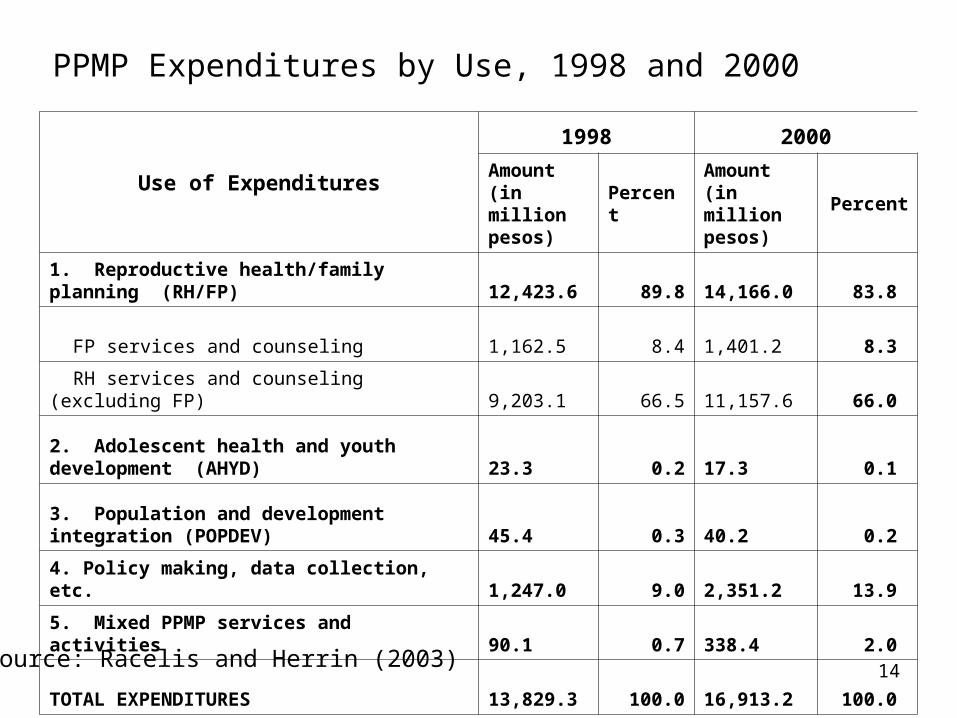
1. Reproductive health/family planning (RH/FP) 12,423.6 89.8 14,166.0 83.8
FP services and counseling 1,162.5 8.4 1,401.2 8.3
RH services and counseling (excluding FP) 9,203.1 66.5 11,157.6 66.0
2. Adolescent health and youth development (AHYD) 23.3 0.2 17.3 0.1
3. Population and development integration (POPDEV) 45.4 0.3 40.2 0.2
4. Policy making, data collection, etc. 1,247.0 9.0 2,351.2 13.9
5. Mixed PPMP services and activities 90.1 0.7 338.4 2.0
TOTAL EXPENDITURES 13,829.3 100.0 16,913.2 100.0
PPMP Expenditures by Use, 1998 and 2000
Source: Racelis and Herrin (2003)

15
10 elements of reproductive health (DOH AO 1-A, January 15, 1998
1. Family planning2. Maternal and child health and nutrition3. Prevention and management of abortion complications4. Prevention and treatment of reproductive tract infections
including STDs and HIV/AIDS5. Breast and reproductive tract cancers and other
gynecological conditions6. Adolescent reproductive health7. Education and counseling on sexuality and sexual health8. Men’s reproductive health 9. Violence against women and children10. Prevention and treatment of infertility and sexual disorders

16
Source of expenditures
1998 2000
Amount (in million pesos) Percent
Amount (in million pesos) Percent
National government 2,892.4 20.9 4,242.1 25.1
Foreign-assisted projects 1,469.2 10.6 1,247.6 7.4
Local government 2,725.4 19.7 3,567.6 21.1
Health Insurance (PhilHealth) 633.7 4.6 1,497.9 8.9
Donors and CAs 823.0 6.0 431.4 2.6
NGOs 235.8 1.7 495.9 2.9
Households 5,049.7 36.5 5,430.7 32.1
Total 13,829.3 100.0 16,913.2 100.0
PPMP Expenditures by Source, 1998 and 2000
Source: Racelis and Herrin (2003)

17
Percent Distribution of Total PPMP Expenditures by Strategy/Activity and by Source of Expenditures, 1998
Uses of Expenditures
Sources of Expenditures, 1998
NG FAPs LGUPhil-
Health
Donors and CAs NGOs HHs Total
1. RH/FP 17.3 10.2 15.0 4.2 5.1 1.4 36.5 89.8
1.1 FP 0.7 0.2 1.6 0.0 1.6 0.4 3.9 8.4
1.2 RH (excluding FP) 16.1 0.1 13.5 4.2 0.0 0.1 32.6 66.5
2. AHYD 0.1 - - - - 0.1 - 0.2
3. POPDEV 0.1 0.3 - - - 0.0 - 0.3
4. Policy & data collection 3.4 0.2 4.7 0.3 0.4 0.0 - 9.0
5. Mixed 0.1 - - - 0.5 0.1 - 0.7
Total Expenditures 20.9 10.6 19.7 4.6 6.0 1.7 36.5 100.0

18
Uses of Expenditures
Sources of Expenditures, 2000
NG FAPs LGUPhil-
Health
Donors and CAs NGOs HHs Total
1. RH/FP 17.4 7.2 15.4
7.8
2.1 1.8
32.1 83.8
1.1 FP 0.7 - 1.8
0.0
1.5 0.5 3.7 8.3
1.2 RH (excluding FP) 16.1 0.0 13.6
7.8 0.1
28.4 66.0
2. AHYD 0.0 - - - - 0.1 - 0.1
3. POPDEV 0.0 0.2 - -
0.0 0.0 - 0.2
4. Policy & data collection
6.9 - 5.7
1.0
0.3 0.0 - 13.9
5. Mixed 0.8 - - -
0.2 1.1 - 2.0
Total Expenditures 25.1 7.4 21.1
8.9
2.6 2.9
32.1 100.0
Percent Distribution of Total PPMP Expenditures by Strategy/Activity and by Source of Expenditures, 2000

19
Sources of supply of modern methods
Source of Supply NDS 1993
NDHS 1998
FPS
1995 2000 2002
Total percent 100.0 100.0 100.0 100.0 100.0
Public Sector 71.5 72.0 78.4 73.7 70.1
Government hospital 32.6 22.7 26.5 25.4 23.6
RHU/UHC 12.4 22.7 16.1 26.5 21.6
BHS 25.0 23.9 33.8 19.6 22.1
BSPO/BHW 1.5 1.9 2.0 2.2 2.6
Private 26.5 26.3 17.9 24.7 28.5
Private hospital/clinic 16.4 15.4 9.8 10.6 10.5
Private doctor 2.6 1.9 1.5 1.5 1.3
Private nurse/midwife 0.3 0.4 0.3
Pharmacy/store 7.5 8.5 6.6 11.6 16.0
NGO 0.1 0.5 0.3
Industry-based clinic 0.2 0.1 0.1
Other private 1.7 1.4 1.9 1.1 1.1
20
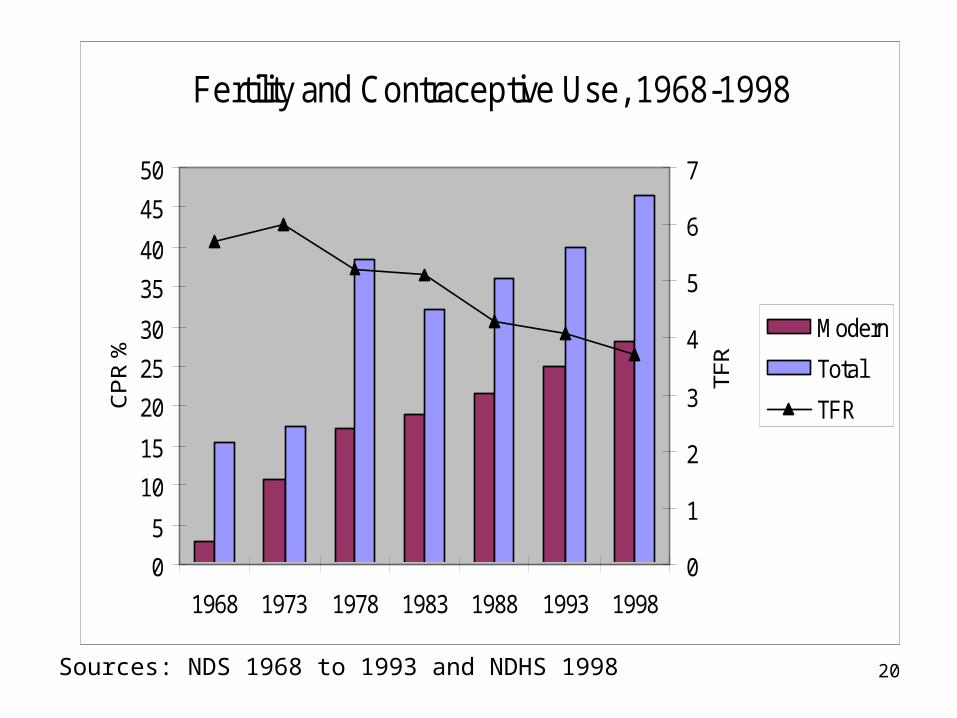
Fertility and Contraceptive Use, 1968-1998
0
5
10
15
20
25
30
35
40
45
50
1968 1973 1978 1983 1988 1993 1998
CP
R %
0
1
2
3
4
5
6
7
TFR
Modern
Total
TFR
Sources: NDS 1968 to 1993 and NDHS 1998

21
Contraceptive Prevalence Rate (%), 1995-2002
0
10
20
30
40
50
60
70
80
1995 1996 1997 1999 2000 2001 2002
Modern
Total
Sources: FPS, various years.

22
Poorest Second Third Fourth Richest Mean
TFR 6.5 4.7 3.6 2.9 2.1 3.7
ASFR (15-19) 130 90 32 29 12 46.0
Use of modern contraception (%) 19.6 26.1 32.7 32.7 29.2 28.0
Fertility and contraceptive use: 1998 NDHS
Source: Gwatkin, et al. (2000)

23
Percent of Currently Married Women by Method, Poor and Non-Poor, 2000 and 2002
Type of Method
2000FPS 2002 FPS
Poor Non-Poor Poor Non-Poor
Any method 40.1 50.2 42.9 51.5
Any modern method 26.3 35.0 29.5 37.6
Pill 13.3 13.8 14.5 15.6
IUD 3.0 3.4 3.8 3.6
Injection 3.0 2.3 3.7 2.8
Condom 0.8 1.6 1.3 1.8
Female sterilization 5.1 13.2 5.8 13.3
Male sterilization 0.1 0.2 0.1
Mucus/billings/ovulation 0.1
LAM 0.9 0.4 0.3 0.2
Any traditional method 13.9 15.1 13.4 13.9

24
Percentage of currently married women with unmet need for family planning
1993 NDS 2002 FPS
TotalFor
SpacingFor
Limiting TotalFor
SpacingFor
Limiting
Total 26.2 12.4 13.8 20.5 10.6 9.9
Residence
Urban 23.5 11.4 12.1 19.5 9.8 9.7
Rural 29.1 13.6 15.6 21.5 11.4 10.2
Education
No educ. 33.6 18.4 15.2
Elem. 29.8 11.6 18.1
H. S. 25.6 13.5 12.1
College 20.3 11.5 8.8

25
Poorest Second Third Fourth Richest Mean
TFR 6.5 4.7 3.6 2.9 2.1 3.7
ASFR (15-19) 130 90 32 29 12 46.0
Use of modern contraception (%) 19.6 26.1 32.7 32.7 29.2 28.0
Fertility and contraceptive use: 1998 NDHS
Source: Gwatkin, et al. (2000)
26
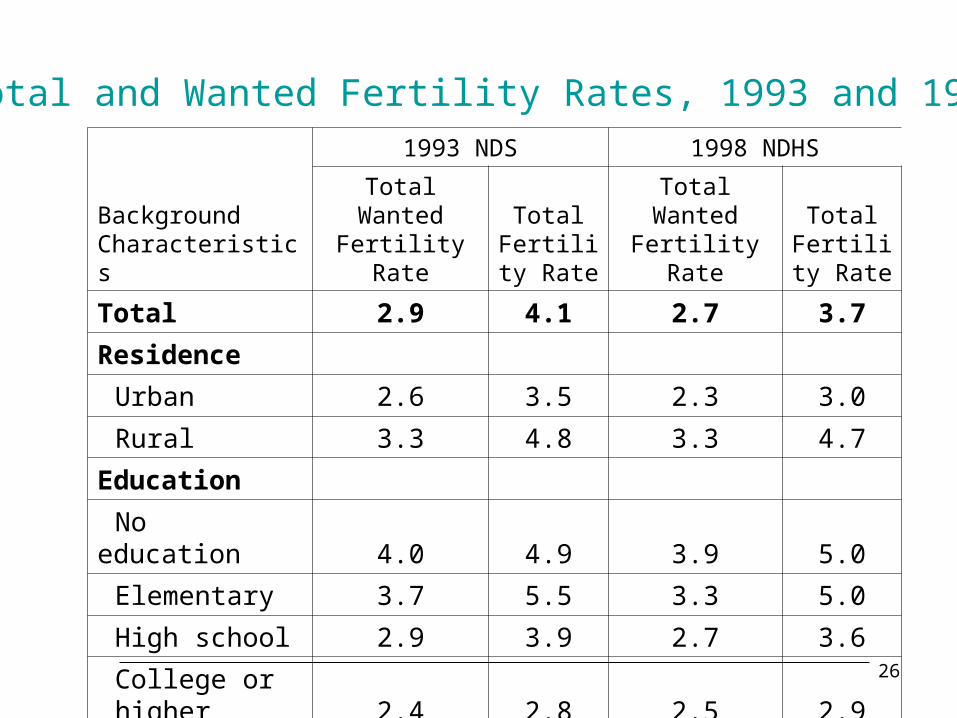
Total and Wanted Fertility Rates, 1993 and 1998
Background Characteristics
1993 NDS 1998 NDHS
Total Wanted Fertility Rate
Total Fertility
RateTotal Wanted Fertility Rate
Total Fertility
Rate
Total 2.9 4.1 2.7 3.7
Residence
Urban 2.6 3.5 2.3 3.0
Rural 3.3 4.8 3.3 4.7
Education
No education 4.0 4.9 3.9 5.0
Elementary 3.7 5.5 3.3 5.0
High school 2.9 3.9 2.7 3.6
College or higher 2.4 2.8 2.5 2.9
27
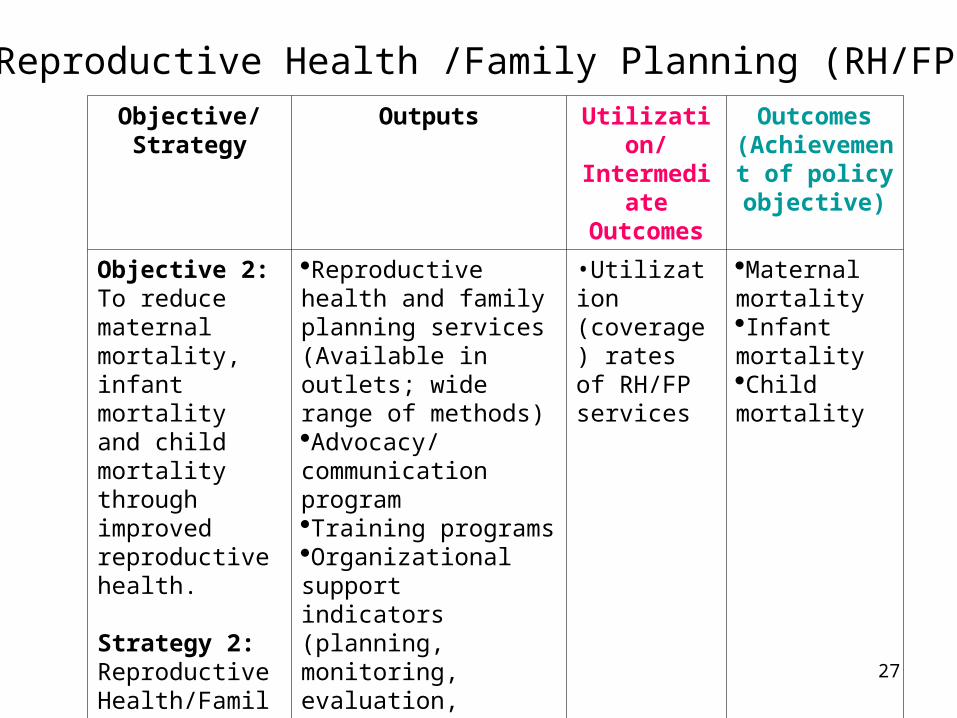
Objective/Strategy
Outputs Utilization/Intermediate
Outcomes
Outcomes (Achievement
of policy objective)
Objective 2:To reduce maternal mortality, infant mortality and child mortality through improved reproductive health.
Strategy 2: Reproductive Health/Family Planning Program(RH/FP)
Reproductive health and family planning services (Available in outlets; wide range of methods)Advocacy/ communication program Training programsOrganizational support indicators (planning, monitoring, evaluation, coordination, mobilize political support)
•Utilization (coverage) rates of RH/FP services
Maternal mortalityInfant mortalityChild mortality
Reproductive Health /Family Planning (RH/FP)

28
MCHS
1999 2000 2001 2002
Number of women ('000) 5,062 5,786 4,781 6870
Percent who received prenatal care 94.2 93.9 94.6 94.1
Percentage who received from:
Doctor 44.7 45.5 41.3 45.4
Nurse/midwife 49.4 49.9 54.0 50.3
Traditional birth attendant/hilot 5.8 4.5 4.5 4.2
Others 0.1 * 0.2 0.1
Percent who received Iron tablet/capsule 78.6 78.5 81.1 82.2
Percent who received Iodine capsule 58.9 64.5 64.4
Percent who received tetanus toxoid vaccine 69.9 70.4 71.4 70.4
Note: * less than 0.1 percent
Prenatal care, 1999-2002

29
Poorest Second Third Fourth Richest Mean
To doctor 10.1 23.7 45.4 64.7 82.3 38.5
To midwife/nurse 61.3 59.7 47.9 30.2 15.2 48.2
Medically trained provider 71.5 83.4 93.3 94.9 97.5 85.7
2+ visits 75.9 83.9 91.7 92.9 95.4 86.1
Pre-natal care visits (%): 1998 NDHS
Source: Gwatkin, et al. (2000)

30
1993 NDS 1998 NDHS 2002 FPS
Total No. of Children ('000) 8,803 7,566 9,621
Doctor 26.0 30.9 33.2
Midwife/nurse 26.8 25.5 27.2
Hilot 45.3 41.3 38.5
Poor
Total No. of children (000) 3780
Doctor 13.0
Midwife/nurse 22.1
Hilot 63.0
Non-poor
Total No. of children (000) 5840
Doctor 46.2
Midwife/nurse 30.6
Hilot 22.7
Percent of children 0-59 months by type of delivery attendant
Percentage for “Others” not shown.

31
Poorest Second Third Fourth Richest Mean
By a doctor 7.1 16.5 35.7 50.2 75.8 30.9
By midwife/nurse 14.1 29.3 37.1 33.8 16.0 25.5
By medically trained provider 21.2 45.9 72.8 83.9 91.9 56.4
In a public facility 7.1 16.0 28.7 29.3 26.3 19.5
In a private facility 1.6 4.1 11.8 25.5 52.5 14.8
At home 91.0 79.4 59.4 44.8 21.2 65.5
Delivery attendance (%): 1998 NDHS
Source: Gwatkin, et al. (2000)

32
MCHS
1999 2000 2001 2002
All Women ('000) 5062 5786 4781 6870
Percent who received postnatal care 63.1 60.0 64.5 71.0
Percentage who received from:
Doctor 47.5 51.7 47.1
Nurse/midwife 37.5 37.1 39.9
Traditional birth attendant/hilot 14.9 10.8 12.8
Type of service
Abdominal exam 55.3 55.4 58.4 56.9
Breast exam 36.2 36.4 37.1 36.3
Internal exam 30.2 34.6 30.2 35.9
Family planning advice 40.8 40.3 42.2 40.6
Breastfeeding advice 58.2 56.1 56.3 55.2
Baby care advice 67.1 64.2 67.5 62.6
Check-up of baby 77.8 77.9 79.5 78.2
Postnatal care, 1999-2002

33
1993 NDSSingle risk category 36.5 1.4 29.1Multiple risk categories 25.9 2.4 39.8In any risk category 62.4 1.9 68.91998 NDHSSingle risk category 35.1 1.4 30.1Multiple risk categories 21.9 2.1 38.6In any risk category 56.9 1.7 68.7
Risk category
Births in last 5 years preceding the survey Percentage of
currently married women
Percentage of births Risk ratio
High risk fertility behavior, 1993 and 1998
Risk defined in terms of early (<18) and late (>34) childbearing, short birth intervals (<24 months), and high birth order (>3)

34
High risk fertility behavior, 1995 and 2002 FPS
Risk Category
Births in last 12 months preceding the survey
Percentage of Births
Percent of currently
married women
1995 FPS
Single risk category 35.7 32.8
Multiple risk category 24.8 48.2
In any high risk category 60.5 81.0
2002 FPS
Single risk category 32.7 28.9
Multiple risk category 23.6 48.7
In any high risk category 53.6 77.6

35
Infant, child and maternal mortality, 1970-1995
Indicator 1970 1980 1990 1995Infant mortality rate: male (a) 93.8 65.2 59.9 53.2Infant mortality rate: female (a) 83.2 59.4 53.4 48.4Child mortality rate: male (1-4 years) (a) 37.2 32.1 23.3 20.0Child mortality rate: female (1-4 years) (a)35.4 30.6 25.4 22.2Maternal mortality ratio 213(b) 209(c) 172(d)Sources:
(a) Flieger and Cabigon (1994) for 1970, 1980 and 1990; Cabigon and Flieger (1999) for 1995.
Rates are life table survival probabilities: qo for infant mortality and 1q4 for child mortality, respectively.
(b) Data from 1993 NDS and refer to the period 1980-1986.
(c) Data from 1993 NDS and refer to the period 1987-1993.
(d) Data from 1998 NDHS and refer to the period 1991-1997

36
Poorest Second Third Fourth Richest Mean
IMR 48.8 39.2 33.7 24.9 20.9 36.0
Under 5 MR 79.8 60.5 49.7 33.4 29.2 54.9
Infant and child mortality: 1998 NDHS
Source: Gwatkin, et al. (2000)

37
Objective/Strategy
Outputs Utilization/Intermediate
Outcomes
Outcomes (Achievement of policy objective)
Objective 3:To reduce the incidence of teenage pregnancy, incidence of early marriage, and the incidence of other reproductive health problems.
Strategy 3:To ensure that adolescents are provided with appropriate information, knowledge, education and services on population and reproductive health. (AHYP)
Education and counseling services (available in outlets? content?)Advocacy/communication programTraining programsOrganizational support indicators
Attendance in education and counseling programsCoverage of advocacy and communication program
Age at marriagePregnancy rate among teenagers and youth age 15-19 and 20-24 yearsFertility rate among teenagers and youthIndicators of reproductive health behavior and problems among the adolescent and youth (e.g.,STD, HIV/AIDS?)
Adolescent Health and Youth Development (AHYD)

38
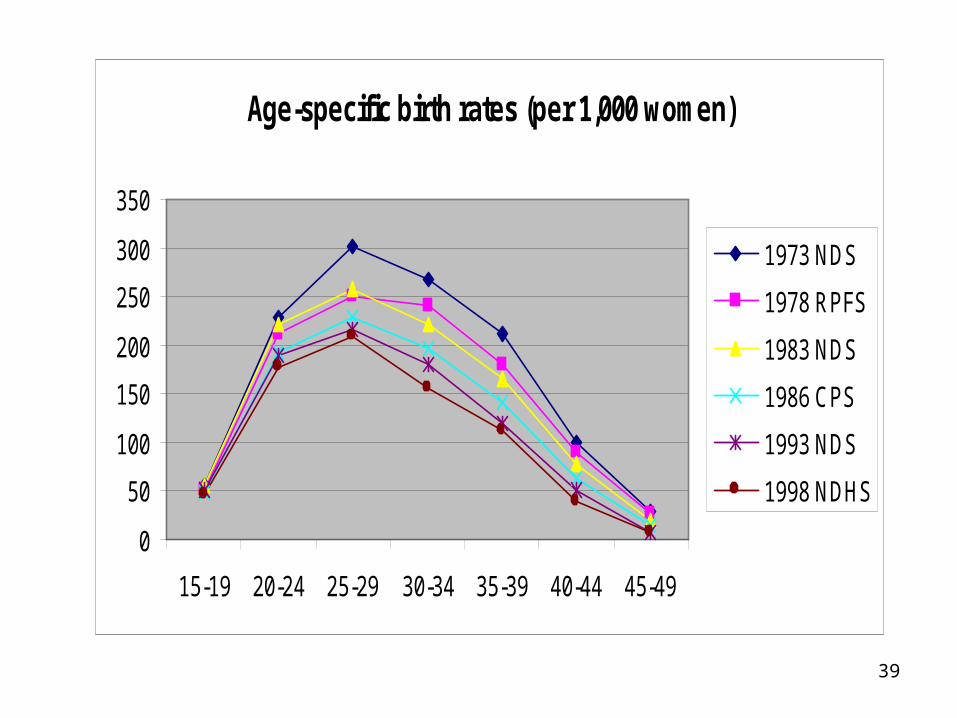
Age-specific birth rates (per 1,000 women)
Age group
1973 NDS
1978 RPFS
1983 NDS
1986 CPS
1993 NDS
1998 NDHS
15-19 56 50 55 48 50 46
20-24 228 212 220 192 190 177
25-29 302 251 258 229 217 210
30-34 268 240 221 198 181 155
35-39 212 179 165 140 120 111
40-44 100 89 78 62 51 40
45-49 28 27 20 15 8 7
39
Age-specific birth rates (per 1,000 women)
0
50
100
150
200
250
300
350
15-19 20-24 25-29 30-34 35-39 40-44 45-49
1973 NDS
1978 RPFS
1983 NDS
1986 CPS
1993 NDS
1998 NDHS
40
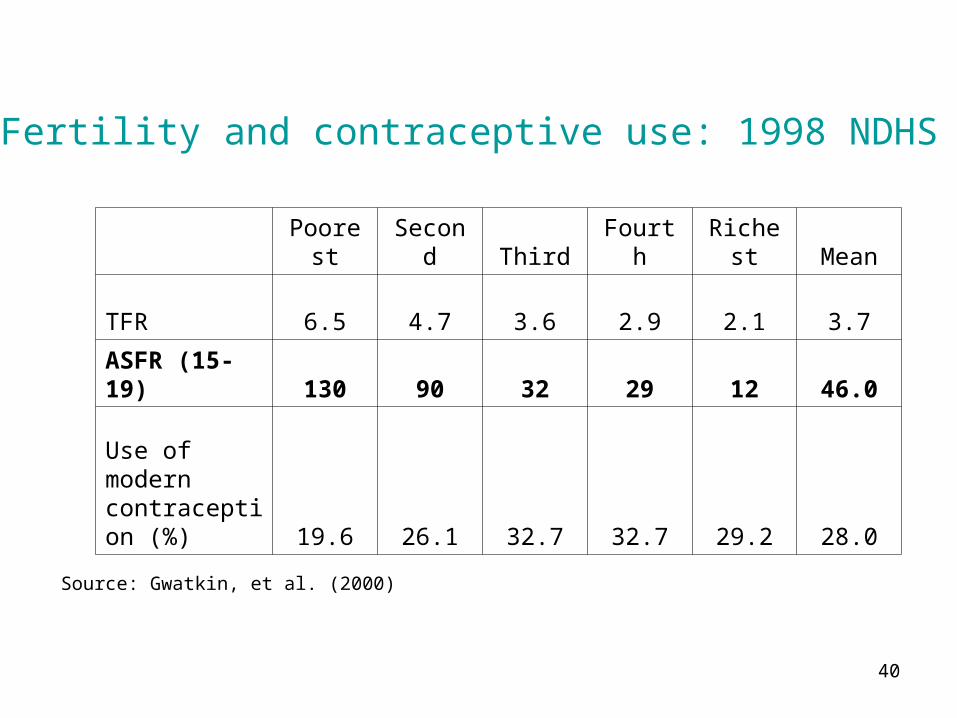
Poorest Second Third Fourth Richest Mean
TFR 6.5 4.7 3.6 2.9 2.1 3.7
ASFR (15-19) 130 90 32 29 12 46.0
Use of modern contraception (%) 19.6 26.1 32.7 32.7 29.2 28.0
Fertility and contraceptive use: 1998 NDHS
Source: Gwatkin, et al. (2000)

41
Background characteristics 1993 NDS 1998 NDHS
Age
15 0.5 0.5
16 1.3 1.6
17 3.6 5.0
18 10.3 10.5
19 19.0 21.3
Residence
Urban 4.8 4.7
Rural 8.9 10.8
Education
No education 15.2 17.3
Elementary 13.5 15.9
High school 5.5 5.7
College or higher 1.8 4.5
Total 6.5 7.2
Teenagers who have begun childbearing, 1993 and 1998

42
Objective/Strategy
Outputs Utilization/Intermediate Outcomes
Outcomes (Achievement of policy objective)
Objective 4:To contribute to policies that will assist government to achieve a favorable balance between population distribution, economic activities, and the environment.
Strategy 4:Integrate population variables, with emphasis on migration and urbanization, into development policies, plans and programs at all levels. (POPDEV)
Advocacy/IEC program on POPDEV integrationTraining program on POPDEV integrationProgram of research and conferencesTechnical assistance program in placeTechnical assistance in managing urban settlements in place.Technical and financial support to regional centers in place.Support system in place (provision of dormitories and housing?)Technical and vocational education in placeEnforcement system in place.
Trained planners in selected provinces and cities.Number of researches and conferences heldNumber of LGUs receiving technical assistanceNumber of regional centers receiving technical and financial support.Number of LGUS receiving technical assistance in managing urban settlements.Number of migrants provided dormitory and housing (?)Number of migrants provided technical and vocational education.Number of environmental law violations seen or handled
Integration of POPDEV in local development plansImproved management of urban settlements (?)Rapid and balanced growth of regional growth centers (?)
Population and Development Integration (POPDEV)

43
Information gaps
• Reasonably updated data on FP use, source of supplies of modern methods, and fertility, but not so with infant, child and maternal mortality, and outcomes data on youth.
• Very limited utilization (intermediate outcomes) and outcomes data on the other components of RH.
• Further disaggregation of utilization and outcomes indicators by major social groups, e.g., poor vs. non-poor.
• Further disaggregation of expenditure data by major public/private and modern/traditional providers of RH/FP services.
• Further development of indicators of utilization and outcomes for AHYD and POPDEV.

44
Part III: Future directions

45
Future directions
• Greater effort at systematic development and application of POPDEV “tools” (data and analysis of interrelationships) to inform policy at both national and LGU levels.
• Monitoring of population welfare through a rights-based, gender and life cycle approach to ensure that gains in one stage of the life cycle are not lost in the next, or that disadvantages in one stage are adequately compensated in the subsequent stages.

46
Annex: Views of GOs and NGOs

47
Views of partner GOs and NGOs
• Role of population growth in development. (88%) agree that a slower population growth is likely to confer greater net benefits than a faster population growth
• Role of government in fertility decision-making. About 42% agreed on the need to provide information and services to couples in order to assist them achieve their fertility goals; another 45% noted that fertility decisions of couples have external effects and that in addition to providing information and services, the government can be justified to advocate a small family size norm.

48
Views of partner GOs and NGOs
• Family planning objectives. About 22% of believe that the objective of a FP program should be to help couples achieve their desired family size, while 75% said that in addition to the above goal, the FP program should also strive to reduce national fertility and population growth.
• Public sector FP service delivery. 93%, view that the government should promote a wide range of legal and medically safe methods from which couples can choose from to achieve their fertility goals; only 5% said that the government should promote only a preferred method, e.g., natural family planning.
49
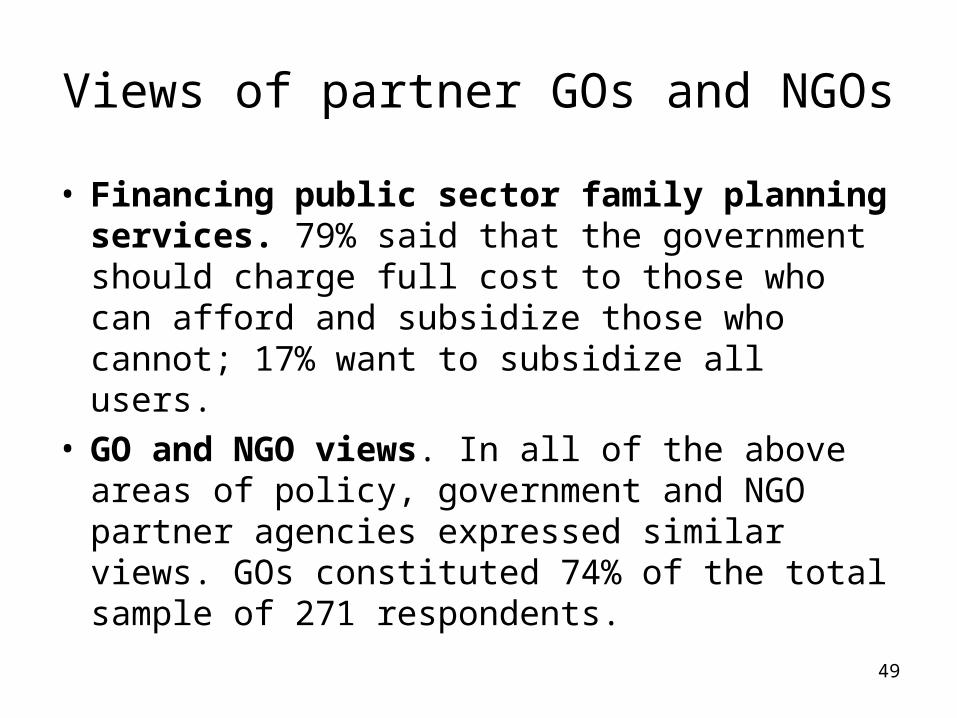
Views of partner GOs and NGOs
• Financing public sector family planning services. 79% said that the government should charge full cost to those who can afford and subsidize those who cannot; 17% want to subsidize all users.
• GO and NGO views. In all of the above areas of policy, government and NGO partner agencies expressed similar views. GOs constituted 74% of the total sample of 271 respondents.