Population Grow~h in India - INFLIBNETshodhganga.inflibnet.ac.in/bitstream/10603/37835/11/11_chapter...
33
Population Grow~h in India
Transcript of Population Grow~h in India - INFLIBNETshodhganga.inflibnet.ac.in/bitstream/10603/37835/11/11_chapter...

Population Grow~h in India

CHAPTER - IV POPULATION GROWTH IN INDIA
INTRODUCTION
Population growth is the most important set of events ever to occur in
human evolution as it alters the way of life in every human civilization. It is
indeed an inevitable force, since every social, political and economic problems
that faces the world has demographic change as one of its root causes.
Population growth as it affects the food security, energy reserves,
environmental degradation, urbanization, international migration, housing,
infrastructure is a problem of main concern.
As population increases, the same rate of growth will produce a larger
absolute increase in size from year to year. Human populations like all the
living things, have the capacity for exponential increase.
The population growth of the world began to grow more noticeable after
the agricultural revolution. The Industrial revolution occurred in past because
of this growth and after this, the size and rate of world population growth
have increased even more rapidly. The rate of population growth in the world
has declined since it attained its peak ie., 2.19 per cent per year in 1962-63
dropping to the current rate of approximately 1.25 per cent.
Population growth is a main issue for developing countries as it plays
an important role in delimiting the size of economic growth. The current
world situation finds China and India as the most populous countries,
followed by the United States, Indonesia and Brazil,
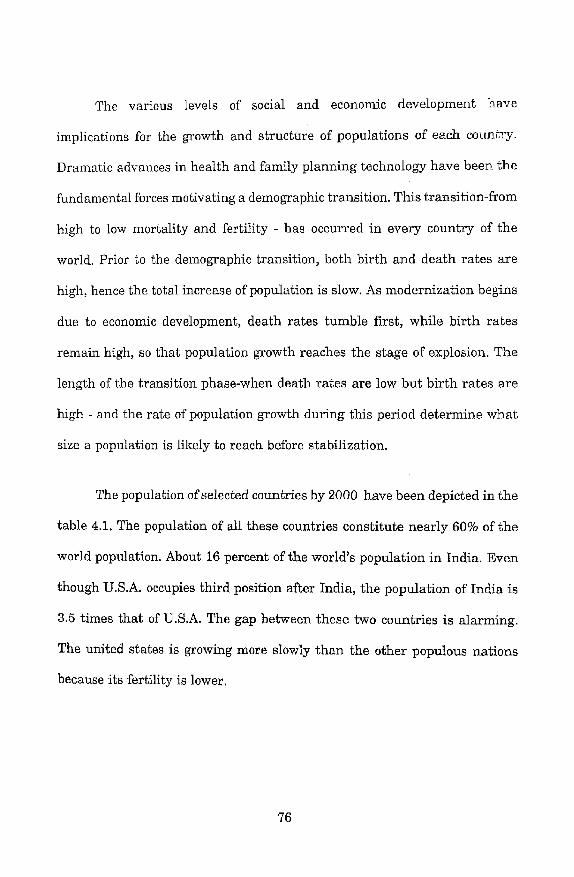
The various levels of social and economic development have
implications for the growth and structure of populations of each country.
Dramatic advances in health and family planning technolorn have been the
fundamental forces motivating a demographic transition. This transition-from
high to low mortality and fertility - has occurred in every country of the
world. Prior to the demographic transition, both birth and death rates are
high, hence the total increase of population is slow. As modernization begins
due to economic development, death rates tumble first, while birth rates
remain high, so that population growth reaches the stage of explosion. The
length of the transition phase-when death rates are low but birth rates are
high - and the rate of population growth during this period determine what
size a population is likely to reach before stabilization.
The population of selected countries by 2000 have been depicted in the
table 4,l. The population of all these countries constitute nearly 60% of the
world population. About 16 percent of the world's population in India. Even
though U.S.A. occupies third position after India, the population of India is
3.5 times that of U.S.A. The gap between these two countries is alarming.
The united states is growing more slowly than the other populous nations
because its fertility is lower.
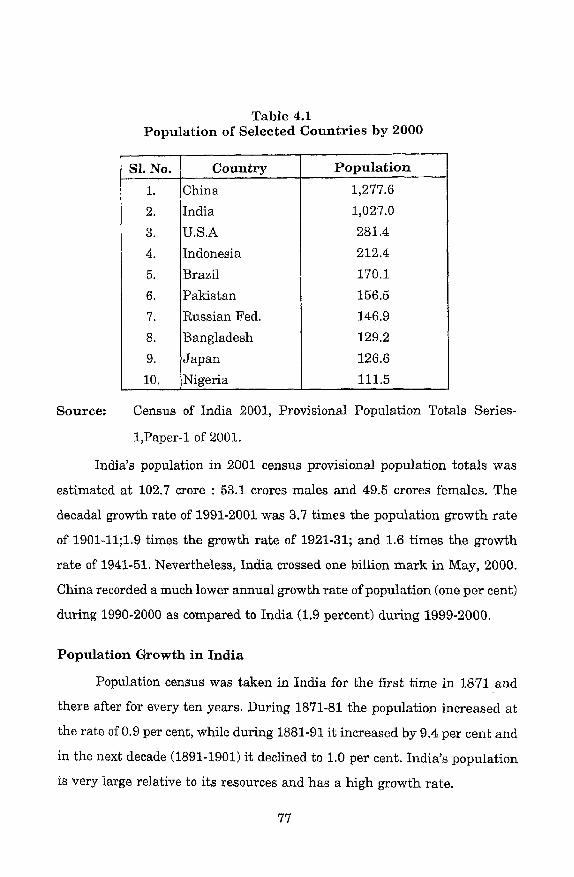
Table 4.1 Population of Selected Countries by 2000
Source: Census of India 2001, Provisional Population Totals Series-
1,Paper-1 of 2001.
India's population in 2001 census provisional population totals was
estimated a t 102.7 crore : 53.1 crores males and 49.5 crores females. The
decadal growth rate of 1991-2001 was 3.7 times the population growth rate
of 1901-11;l.g times the growth rate of 1921-31; and 1.6 times the growth
rate of 1941-51. Nevertheless, India crossed one billion mark in May, 2000.
China recorded a much lower annual growth rate of population (one per cent)
during 1990-2000 as compared to India (1.9 percent) during 1999-2000.
Population Growth in India
Population census was taken in India for the first time in 1871 and
there after for every ten years. During 1871-81 the population increased a t
the rate of 0.9 per cent, while during 1881-91 it increased by 9.4 per cent and
in the next decade (1891-1901) it declined to 1.0 per cent. India's population
is very large relative to its resources and has a high growth rate.
Populat ion
1,277.6
1,027.0
281.4
212.4
170.1
156.5
146.9
129.2
126.6
111.5
S1. No.
1.
2.
3.
4.
5,
6.
7.
8.
9.
10.
Country
China
India
U.S.A
Indonesia
Brazil
Pakistan
Russian Fed.
Bangladesh
Japan
Nigeria

The population of India, which at the turn of the twentieth century was
only around 238.4 nlillions increased by more than four times in a period of
hundred years to reach 1027 million at the dawn of the twenty first century.
Inclia achieved its highest decadal growth rate during 1971 (24.8 per cent).
In absolute terms, the population has increased by a 180.6 million during
1991-2001, which is more than the population of Brazil, the fifth most
populous country in the world.
The prevalence of high birth and death rates during the early years of
the demographic history of India restricted the growth rate and the size of
population. This phenomenon was highest during 1921 when the country
registered a negative growth rate. India has passed through four phases of
population growth from 1901 to 2001. The Indian Population growth is shown
in Table 4.2 in terms of size and percentage (refer to Fig.4.1)
Table 4.2
Source: Census of India, Provisional Population Totals, Series - 1, Paper - 1 of 2001.


I Phase: 1901-21
During this first phase, the population of India recorded a negative
growth. The rates of growth prior to this period was highly unsteady due to
fluctuation in mortality because of catastrophies like famines and epidemics.
The decade 1901-11 can be considered as a normal decade since the
crops were reasonably good and the absence of famines. Yet the population
in the next decade viz., 1911-21 the country witnessed a negative growth of
population due to heavy mortality. The plague and influenza which occurred
in this decade said to have taken 15 to 16 million lives.
The death rate during the decade was 48.6 per thousand against 42.6
in 1901-11. The birth rate was 49 per thousand which was more or less equal
to death rate and as a consequence the growth of population during this
phase was zero or negative.
The decade 1901-11 experienced no specific regional patterns and
growth rates were highly diversified. During the first two decades of the
century, the northern zone suffered a net loss in population of 1.4 per cent
due to various famines and epidemics. In the eastern states of Assam,
Manipur, Nagaland experienced very high population growth rates during
1901-21, The rapid population growth in Assam was mainly to heavy in-
migration. The significant aspect of the first phase has been that a large
number of states experienced either a low or a negative decadal variation in
population.

During 1901-11, the decadal variation was 5.75 per cent where as
average annual exponential growth rate was 0.56 per cent. This rates can be
considered as normal as there were no significant seasonal fluctuations or
famines which covered high mortality.
Up to 1921, the rate of population growth was unsteady. The decade
1911-21 experienced a negative rate of growth. The percent decadal variation
was - 0.31 per cent and average exponential growth rate was -0.03 per cent
which was the lowest during the whole census history. Though agricultural
conditions were favourable during this decade, the epidemic of plague swept
millions of people.
The first phase was characterized by slow growth which extended from
1901-1921, there was a net decrease of 0.3 per cent. During this period, the
states like Andhra Pradesh, Bihar, Karnataka, Madhya Pradesh, Maharastra,
Orissa, Punjab, Rajasthan, Sikkim and Uttar Pradesh recorded a negative
growth of population during either of the two decades.
I1 Phase: 1921-51
The second phase started after 1921 and continued till 1951. During
this period, the annual population growth rate increased by three times. Thus
the year 1921 can be termed as a great divide in the demographic history of
the country, because it marked a beginning of regular growth and also a
rapid growth of population. The decade 1921-31 recorded an average
exponential growth rate of 1.04. During 1921-31, the all-hdia decennial
growth rate was 11.0 with the highest being Kerala 21.9 and the lowest being
Uttar Pradesh with 6.7 per cent,

During the 30 year period of 1921 to 1951, the Indian population grew
on an overall growth rate of 44 per cent. The population was substantially
higher than the national average for some states like Assam, Kerala,
Rajasthan, Tripura, Sikkim and West Bengal, the major factors responsible
for this phenomenon being the migation of the workers into these areas from
different parts of the country.
In Bihar, Haryana, Himachal Pradesh, Madhya Pradesh, Punjab,
Tamil Nadu and Uttar Pradesh the percentage increase in population was
below the national average.
The post 1921 period withnessed a rapid growth of population. The
major causes of high mortality have been gradually brought under control
and between 1921 and 1951 the country witnessed a gradual size in
population growth rates. During this period the population increased from
251.3 million in 1921 to 361.1 million in 1951. The net gain of 109.8 million
people was more than eight times that of 1901-21. The fall in the death rate
during 1921-1931 was to the extent of 25.3 points when compared to the
earlier decade. This fall is due to control of many diseases and epidemics such
as plague, cholera, small-pox and malaria. Several anti-famine measures
were taken up to control famines especially improvement of communications,
During 1931-41, the decennial growth rate was 14.22 per cent and
average annual exponential growth rate was 1.33 per cent. The lowest
decadal growth rate was that of Orissa, with 10.2 per cent and the highest
was that of Assam with 20.1. per cent. Mortality recorded a further decline of
14 percent during this period.
During the decacfe 1941-51, the average decennial growth rate was
13.31 per cent and average exponential growth rate was 1.25 per cent. During
this period, the all-India decennial growth rate was 21.9 per cent the highest
being Kerala with ancl the lowest being Punjab with 1.8 per cent.
Table 4.3 shows the different states showing different patterns of
growth rates from 1921 to 1951. They are classified into five groups according
to their type of' growth patterns.
In group A states, the growth rates are steeply and continuously rising
and average exponential growth rates are also very high.
In group B states, at first growth rates would fall and then rise and
average exponential growth rates are the highest when compared to other
states.
Under Group C, the growth rates of the states rises at first and then
fall but at a slower rate.
In group D states, growth rates rise and then fall to a still lower level
than before and at a faster rate.
In Group E, states, it is only Orissa state whose the growth rates fall
continuously.

Table 4.3 Grouping of States According to their Pattern of Growth 1921-51
Source : Computed from census figures.
84
Average exponential growth rates
1901-50
0.89
0.79
0.88
0.98
1.50
1.00
0.84
0,20
0.87
0.52
1.16
0.88
0.39
0.70
21.5
Group - A
Madras
Mysorezz
West Bengal
Group - B
Andhra Pradesh
Kerala
Maharashtra
Group - C
Jammu & Kashmir
Assam
Bihar
Madhya Pradesh
Uttar Pradesh
Guj ar at
Rajasthan
Group . D
Punja
Group - E Orissa
AS1 India
Decadal
1921-30
8,5
9.4
8.1
13.0
21.9
14.9
10.1
19.5
11.5
11.4
6.7
12.9
14.1
9.0
11.9
11.0
Growth
1931-40
1.9
11.1
13.1
10.8
16.0
12.0
10.4
20.1
12.2
12.3
13.6
19.3
18.0
16.1
10.2
13.5
Rates
1941-50
14.5
19.4
22.7
14.0
22.9
19.3
10.4
19.3
10.3
8.7
11.8
18.7
15.2
1.8
6.4
14.0
Phase I11 : 1951 - 81
The year 1951 marked another land mark in the demographic history
of India after the great divide of 1921 where there has been an acceleration
in the population growth rate since that year. From 1951 onwards, India's
population has been growing al: a phenomenal increase while during 1941-51,
the average decennial growth rate was 13.31, during 1951-61 it increased to
21.6 per cent. From Table 4.4, we can note that there has been a significant
variation in the growth rates of the States and Union Territories during 1951-
61, and the highest growth rate among the states has been that of Tripura
with 78.71 per cent and the lowest was Tamil Nadu with 11.85 per cent.
During the first decade of the phase I11 (1951-61) the population
growth was never than before and it did not happen in the preceding decades
also, the decadal growth rate being 21.64 per cent and absolute growth of
78.1 million population. The growth rate increased by 8.33 points. The year
1951 can be considered as the third landmark as accelerated decline in the
Crude death rate was witnessed until 1971. This phase is characterized by
a clearly marked increase in the growth rate as well as in the size of
population. The Crude birth rate slightly increased in the following decade.
Health, sanitation, food and nutrition improved during this phase very much.
Since 1951, the demographic situation has proved to be very critical for the
country as it is now facing a lot of problems caused by the unprecedented
growth of population. The first decade of the phase-I11 (1951-61) experi.enced
a rise in the Crude birth rate 91.7 per 1000) and a decline in the crude death
rate (4.6 per 1000). The number of states with below 10 per cent decadal
growth rate came down from 8 in 1941-51 to 2 in 1951-61.

The period 1961-71 was the continuation of the previous decade and
the higher growth rates continued in more states. The north-eastern states
constituted one region with highest rate of population growth (above 30 per
cent).
During the decade 1961-71, however the disparity in variation has
narrowed. High growth rates of population are observed for the north-eastern
states of Nagaland, Tripura, Manipur, Assam, West Bengal and Haryana.
Infact, these growth rates were greater than the growth rate of the country
as a whole i.e., The States of Uttar Pradesh, Bihar, Punjab, Andhra Pradesh,
Himachal Pradesh and Karnataka and iegistered somewhat low rates of
population growth.
During this decade, many States and Union Territories showed an
upward trend in the growth rate of population. Among the States Sikkim and
Nagaland occupied the first and second places with 50.44 and 49.73 per cent
respectively and Tamil Nadu recorded the lowest growth rates with 17.23 per
cent. The mean value in table reveals that there has been steep rise in
population just within a short span of one decade. The decadal growth rate
in 1971 (24.80 per cent) and 1981 (24.66 per cent) remained more or less the
same (it is evident from 4.2).
Phase IV-1981-2001
The fourth phase is characterized by the declining trend of population
growth. The population increase in absolute terms is the least in 2001 decade
(17.6 million) when compared to the last five decades.
During the decade 1981-91, the decadal growth rate of India was 23.60
per cent and average exponential growth rate was 2.11 per cent. Actually this
growth rate was two times the growth rate of population of 1941-51 and five
times the growth rate of 1901-11. (see table 4.5) India's population was 84.39
crores according to 1991-census.
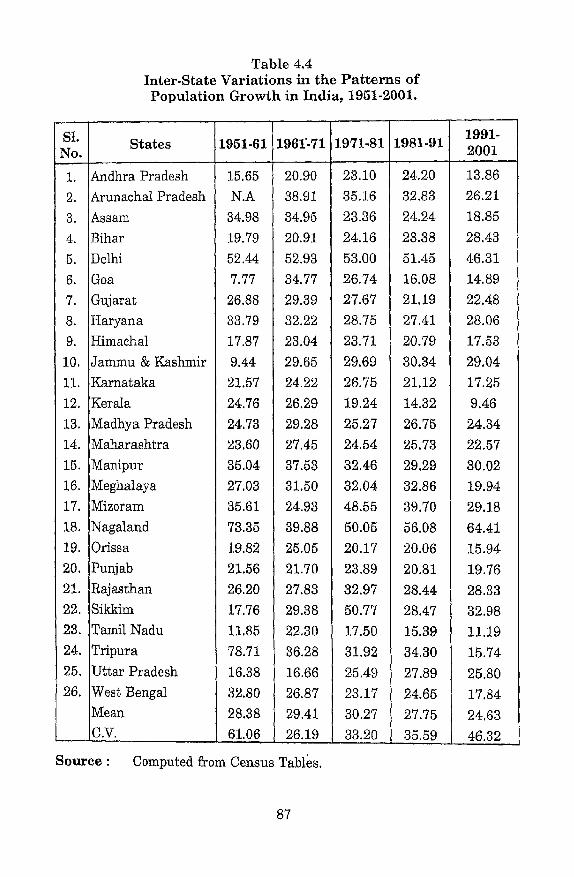
Table 4.4 Inter-State Variations in the Patterns of Population Growth in India, 1951-2001.
Source : Computed from Census ~ab le s .
87
1991- 2001
13.86
26.21
18.85
28.43
46.31
14.89
22.48
28.06
17.53
29.04
17.25
9.46
24.34
22.57
30.02
19.94
29.18
64.41
15.94
19.76
28.33
32.98
11.19
15.74
25.80
17.84
24.63
46.32
1981-91
24.20
32.83
24.24
23.38
51.45
16.08
21.19 27.41
20,79
30.34
21.12
14.32
26.75
25.73
29.29
32.86
39.70
56.08
20.06
20.81
28.44
28.47
15.39
34.30
27.89
24.65
27.75
35.59
1971-81
23.10
35.16
23.36
24.16
53.00
26.74
27.67
28.75
23.71
29.69
26.75
19.24
25.27
24.54
32.46
32.04
48.55
50.05
20.17
23.89
32.97
50.77
17.50
31.92
25.49
23.17
30.27
33.20
S1. No.
1. 2.
3.
4.
5.
6.
7.
8. 9.
10.
11.
12.
13.
14. 15.
16. 17.
18.
19.
20.
21.
22. 23.
24.
25.
26.
1951-61
15.65
N.A 34.98
19.79
52.44
7.77
26.88
33.79
17.87
9.44
21.57
24.76
24.73
23.60
35.04
27.03
35.61
73.35
19.82
21.56
26.20
17.76
11.85
78.71
16.38
32.80
28.38
61.06
States
Andhra Pradesh Arunachal Pradesh
Assam
Bihar
Delhi
Goa Gujarat Haryana Himachal Jammu & Kashrnir Karnataka Kerala Madhya Pradesh Maharashtra Manipur Meghalaya Mizoram Nagaland Orissa Punjab Rajasthan Sikkim Tamil Nadu Tripura Uttar Pradesh West Bengal Mean C.V.
1961-71
20.90
38.91
34.95
20.91
52.93
34.77
29.39
32.22
23.04
29.65
24.22
26.29
29.28
27.45
37.53
31.50
24.93
39.88
25.05
21.70
27.83 29.38
22.30
36.28
16.66
26.87
29.41
26.19

Decadal Variation
Andhra Pradesh
Arunachal Pradesh
Assam
Bihar
tioa
Gujarat
Haryana
Himachal
Jarnmu & Kashmir
Karnataka
Kerala
2 Madhya Pradesh z? --I :: Maharashtra
Manipur
Meghalaya
Mizoram
Nagaland
Orissa
Punjab I Rajasthan
Sikkim
Tamil Nadu
Tripura
Uttar Pradesh
West Bengal - - -
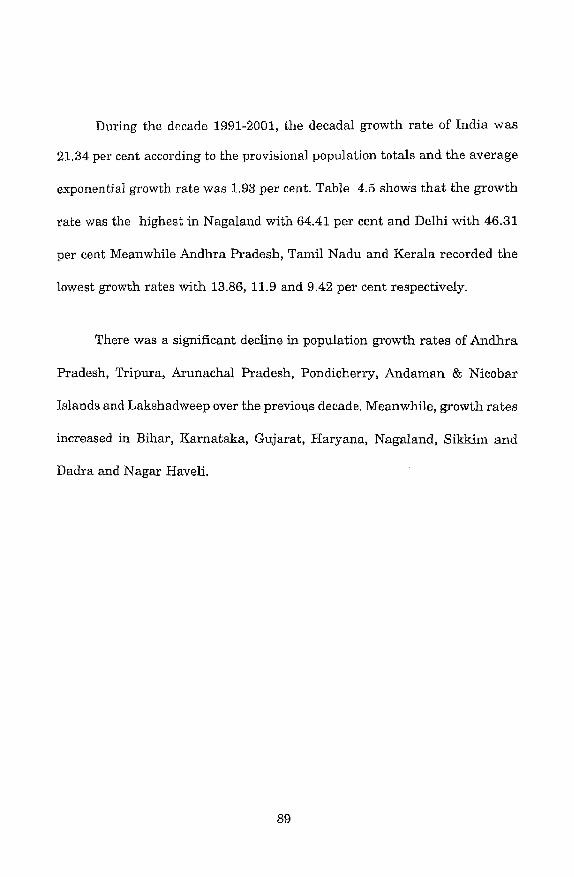
During the decade 1991-2001, the decadal growth rate of India was
21.34 per cent according to the provisional population totals and the average
exponential growth rate was 1.93 per cent. Table 4.5 shows that the growth
rate was the highest in Nagaland with 64.41 per cent and Delhi with 46.31
per cent Meanwhile Andhra Pradesh, Tamil Nadu and Kerala recorded the
lowest growth rates with 13.86, 11.9 and 9.42 per cent respectively.
There was a significant decline in population growth rates of Andhra
Pradesh, Tripura, Arunachal Pradesh, Pondicherry, Andaman & Nicobar
Islands and Lakshadweep over the previoys decade. Meanwhile, growth rates
increased in Bihar, Karnataka, Gujarat, Haryana, Nagaland, SiMrirn and
Dadra and Nagar Haveli.

Souroe: Govt. of India, Census of India, Final Population Totals of 2001 Census,
Percen t t o total
population
16.17
9.42
8.07
7.81
7.37
6.05
5.88
5.50
5.14
4.93
3.57
3.10
2.62
2.59
2.37
2.05
2.03
1.34
0.98
0.83
0.59
0.31
0.23
0.22
0.19
0.13
0.11
0.09
0.09
0.09
0.05
0.03
0.02
0.02
0.01 -
Population Sizes Average
exponential growth r a t e
2.30
2.04
2.50
1.64
1.30
1.06
2.18
2.49
1.59
2.03
1.48
0.90
2.09
1.73
1.80
2.47
1.66
3.81
2.55
1.76
1.62
1.46
2.63
2.62
4.97
1.39
2.33
1.87
3.39
2.56
2.85
3.97
4.95
4.42
1.59
Rank 2001
1.
2.
3.
4.
5.
6,
7.
8.
9.
10.
11.
12.
13.
14.
15.
16.
17.
18.
19.
20.
21.
22.
23.
24.
25.
26.
27.
28. 29.
30.
31.
32.
33.
34.
35.
Table According
Population i n 2001
166,052,859
96,752,247
82,878,796
80,221,171
75,727,541
62,110,839
60,385,118
56,473,122
52,733,958
50,596,992
36,706,920
31,838,619
26,909,428
26,638,407
24,289,296
21,082,989
20,795,956
13,782,976
10.069,917
8,479,562
6,077,248
3,191,168
2,388,634
2,306,069
1,988,636
1,343,998
1,091,117
973,829
900,914
891,058
540,493
356,265
220,451
158,059
60,595
Ranking of States
S t a t f l n i o n Territory
Uttar Pradesh
Maharashtra Bihar
West Bengal Andhra Pradesh Tamil Nadu
Madhya Pradesh
Rajasthan
Karnatalca
Gujarat
Orissa
Kerala Jherkhand
Assam Punjab
Waryana
Chattisgarh Delhi
Jammu & Kashmir
Uttaranchal Himachal Pradesh
Tripura
Manipur Meghalaya Nagaland
Goa Arunachal Pradesh
Pondichery Chandigarh
Mizoram Sikkim Andaman & Nocobar Islands
Dadra & Nagar Haveli
Daman & Diu
Laskhadweep
4.5 to their
Percent increase
25.80
22.57
28.43
17.84
13.86
11.19
24.34
28.33
17.25
22.48
15.94
9.42
23.19
18.85
19.76
28.06
18.06
46.31
29.04
19.20
.17.53
15.74
30.02
29.94
64.41
14.89
26.21
20.56
40.33
29.18
32.98
26.94
59.20
28.62
17.19

Sex ratio
India shares a distinctive feature with the South and East Asian
population of having adverse sex ratio i.e more males per females. The sex
ratio had always remained unfavourable to females. This gap is attributed to
women's lower status when compared to males. Sex ratio can be described as
the number of females per 1000 males. In India, there were 35.5 million less
women than men in 2001.
The sex ratio has been declining almost consistently over the decades.
It can be observed from Table 4.6. It was 972 in the 1901 census, which
declined to 930 by 1971. The decline was sharpest during 1961-71, when the
sex ratio dropped by 11 points. It rose marginally to 93.4 by 1981 and again
it declined to 927 in 1991. In 2001, the sex ratio again rose to 933 which is
a good improvement.
Tablo 4.6 Trends in the Sex Ratio in India : 1901-2001
I Census Year I Females per 1000
Males I
Source: Census of India, 2001, Provisional population totals, series I, paper 1 of 2001.
91

The declining sex ratio for females in India was attributed to causes
like: (1) Women's lower status contributing to low age at marriage for girls,
lower literacy and educational attainment, higher fertility and mortality
levels during the reproductive ages. (2) Lesser attention paid to the female
children when compared to the male ones. (3) Increasing incidence of female
foeticide through the use of the modern techniques of sonography, by
identifying the sex of the baby at early stages of pregnancy.
The increase in sex ratio during 1991-2001 can be seen as a promising
sign of improvement in the status of women, While the world average of sex
ratio is 986 females per 1000 males, most of the nations like Pakistan and
China have shown an improvement from 1950 to 2000, India is the only
exception, where the sex ratio is declining countinuously.
The table 4.7 reveals that in rnany'states, especially the large Hindi-
speaking ones, the sex ratios have been quite low over time and still there
have been further declines between 1981 and 1991. In Bihar it fell from 946
to 911 only in Kerala has the population favoured females throughout the
period. The trends in sex ratio for some of the major states and Union
territories have shown a downward slide. The major states that are largely
responsible for the decline in the overall sex ratio in India are Uttar Pradesh,
Bihar, Jharkand, Orissa, Chattisgarh, Madhya Pradesh, Gujarat, Mahastra
and Tamil Nadu. Although the sex ratio in Punjab has been consistently low,
it has shown a long-term upward trend and has not contributed to the overall
deterioratio in sex ratio of the country. In Rajasthan, the sex ratio kept
fluctuating in a narrow band and always remained at a low level. Haryana,
Andhra Pradesh and Karnataka are the states where the sex ratio has
remained more or less stagnant, (See Fig. 4.3).

Table - 4.7 Sex Ratios in the States 1951-2001
Source: Census of India, 2001, Provisional Population Totals, Series I, Paper 1 of 2001.
93


The overall sex ratio of India is dependent on the sex ratio obtained in
different states and Union territories and their relative weights in terms of
size of population. At the Census of India, 2001, the sex ratio among the
major states ranged from 861 in Haryana to 1058 in Kerala. In 1991 also,
Haryana with a sex ratio of 865 was at the bottom with Kerala 1036 a t the
top. The changes in sex ratio overtime, therefore, are dependent on the
changes in the ratios of the individual States and Union territories and their
relative share in population.
It is clear that the number of States and Union Territories with sex
ratio of below national average has increased from seventeen in 1991 to
eighteen in 2001. In fact the proportion of population below the national
average has increased from 64 per cent to about 60 per cent. The highly
populated States like Uttar Pradesh, ~ i h a i , Rajasthan, and Madhya Pradesh
which together constituted about 34 per cent of India's population in 1991
and increased to 36 per cent in 2001. Therefore, the increase in the overall
sex ratio is possibly due to the relative larger increase in the sex ratio of
these four states.
The sex ratio of Indian population has always been of topical interest
for the demographers, social scientists, women's group, research scholars and
various planners and policy makers. Several reasons are adduced to explain
the consistency low levels of sex ratio and their further decline in the country.
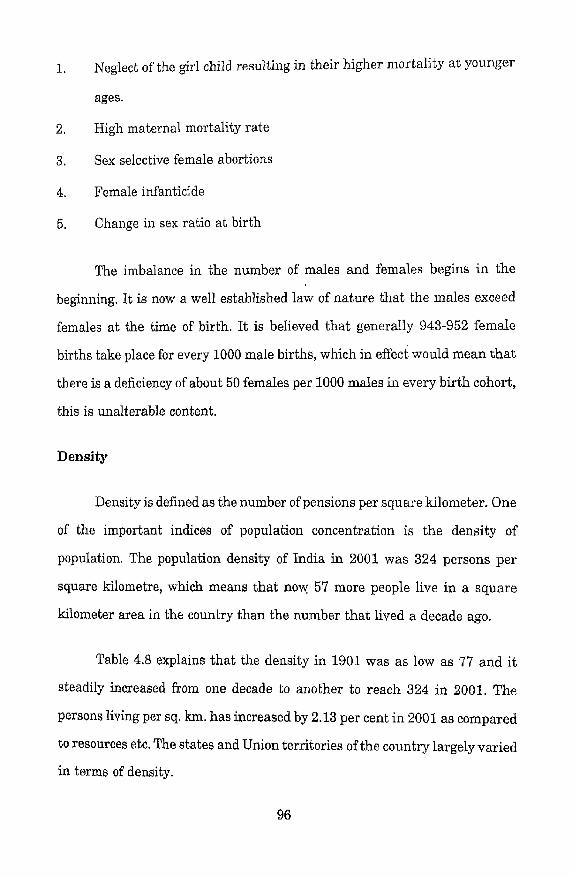
1. Neglect of the girl child resulting in their higher mortality at younger
ages.
2. High maternal mortality rate
3. Sex selective female abortions
4. Female infanticide
5. Change in sex ratio at birth
The imbalance in the number of males and females begins in the
beginning. It is now a well established law of nature that the males exceed
females at the time of birth. It is believed that generally 943-952 female
births take place for every 1000 male births, which in effect would mean that
there is a deficiency of about 50 females per 1000 males in every birth cohort,
this is unalterable content.
Density
Density is defined as the number of pensions per square kilometer. One
of the important indices of population concentration is the density of
population. The population density of India in 2001 was 324 persons per
square kilometre, which means that now 57 more people live in a square
kilometer area in the country than the number that lived a decade ago.
Table 4.8 explains that the density in 1901 was as low as 77 and it
steadily increased from one decade to another to reach 324 in 2001. The
persons living per sq. km. has increased by 2.13 per cent in 2001 as compared
to resources etc. The states and Union territories of the country largely varied
in terms of density,

Table 4.8
Density of Population, India: 1901-2001
Source: Census of India 2001, Provisional Population Totals, Series -1,
Paper-1 of 2001.
Census
1901
1911
1921
1931
1941
1951
1961
1971
1981
1991
2001
The table 4.9 deals with the ranking of States and Union Territories
of India in desending order of densities. The density of population within the
country widely varies across the States and Union Territories. It varied from
13 persons per sq.km. in Arunachal Pradesh to 9294 in Delhi. The density of
population has been increased in all States and Union Territories of the
country between 1991 and 2001 but huge variations in the rate of increase in
density has been observed. Among the major states, West Bengal is still the
most thickly populated, where population density has gone up from 767 in
1991 to 904 in 2001. However, among the major states, Bihar is now the
second highest densely populated state pushing Kerala to the third place in
terms of ranking. Similarly, Punjab and Tamil Nadu have at present
interchanged their relative position of loth and llth ranks respectively in
1991, (See Fig. 4.4).
Density (Per Sq.km) 77
82
81
90
103
117
142
177
216
267
324
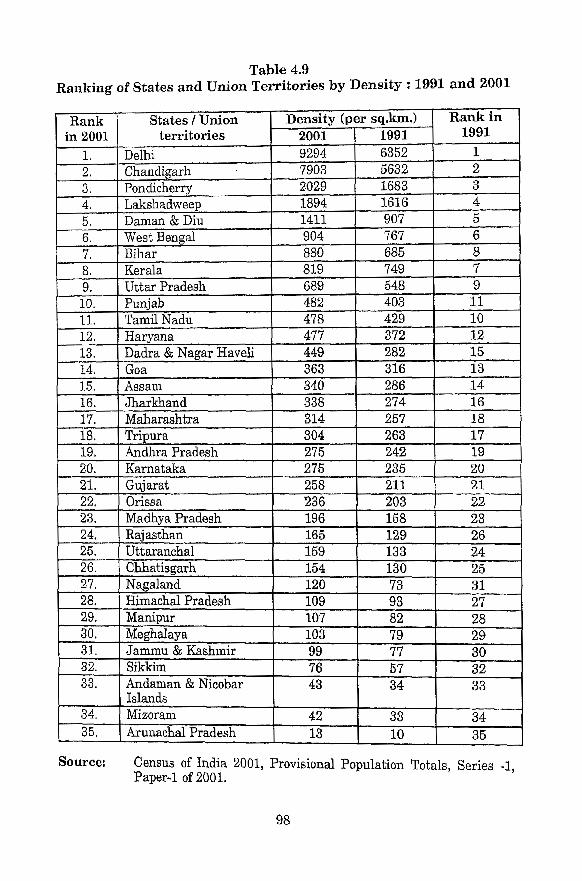
Table 4.9 Ranking of States and Union Territories by Density : 1991 and 2001
Source: Census of India 2001, Provisional Population Totals, Series -1, Paper-1 of 2001.

Density
A N g g g g - t C O ( c l c O O O C
8 9 0 0 0 0 0 0 0 c 0 0 0 0 0 0 0 0 0 0 <
Uttar Pradesh
5? 3 Dadra & Nagar Haveli (P U)
Andhra Pradesh

Literacy
Literacy and education are reasonably the good indicators of
development in a society. Spread and diffusion of literacy is generally
associated with essential traits of civilisation such as modernisation,
urbanisation, industrialisation, communication and commerce. Higher levels
of education and literacy leads to a greater awareness and also contributes
in improvement of economic conditions. It acts as a catalyst for social
upliftment enhancing the returns on investments made in almost every
aspect of development effort, be it population control, health, hygiene,
environmental degradation control, empowerment of women and weaker
sections of the society.
Literacy is one of the important social characteristics on which
information is obtained on every individual in the census. A person aged
seven and above, who can both read and write with understanding in any
language, is treated as literate. It is decided at the 1991 census that all
children in the age group 0-6, will be treated as illiterates by definition and
the population aged seven years and above only is to be classified as literate.
The same criterion has been retained at the census of India, 2001, also.
The Table 4.10 shows the literacy rates for the country since 1951.
Literacy rates in the table for the 1951, 61 and 71 censuses relate to the
population aged five years and above, where as for the 1981, 91 and 2001
relate to the population seven years and above. The literacy rate for the
country in 2001 is 65.38 per cent, for males 75.85 per cent and for females
54.16 per cent. Thus three-fourths of the male and more than half of the
female population are literate in the country. India has continued its
improving in literacy rate by recording a jump of 13.17 percentage points

from 52.21 in 1991 to 65.38 in 2001. There is increase in the percentage
points of female literacy in the order of 11.72 and 14.87 respectively.
The difference in male-female literacy rates of percentage points
increased from 18.30 in 1951 to 26.62 in 1981. But in 1991 this difference was
marginally reduced to 24.84 per cent and in 2001 it is further declined to
21.70 per cent, (See Fig.4.5).
-
Source: Census of India 2001, series-1, Provisional Population Totals,
Table 4.10 Literacy Rates in India : 1951 - 2001
Paper - 1 of 2001, Registrar General and Census commissioner,
India.
Male-female gap in Literacy rate
18.30 25.05 23.98 26.62 24.84 21.70
The Table 4.11 gives a ranking of states and union territories by
literacy rates of 1991 and 2001 along with decadal difference. The first rank
is occupied by Kerala followed by Mizoram and Lakshadweep in 1991 and
they have retained the same position in 2001 census also. Chandigarh has
moved down from 4th rank in 1991 to 6th rank in 2001, while Goa has
jumped up from 5th rank in 1991 t o 4th rank in 2001,
All the States and Union Territories without exception have shown
increase in literacy rates during 1991-2001. The States and Union Territories
which are moved forward by more than 15 percentage points during 1991-
2001 are Rajasthan (22.48 per cent), (22.27 per cent), Madya Pradesh (19.44
per cent) Dadra and Nagar Haveli (19.33 per cent), Andhra Pradesh (17.02
per cent) and Uttar Pradesh (16.65 per cent).
Females
8.86 15.35 21.97 29.76 39.29 54.16
Males
27.16 40.40 45.96 56.38 64.13 75.85
Year
1951 1961 1971 1981 1991 2001
k
Persons
18.33 28.30 34.45 43.57 52.21 65.38


tanking of States and India 1 States I
Union territories
INDIA Jammu & Kashmir Himachal Pradesh Punjab Chandigarh Uttaranchal Haryana Delhi Rajasthan Uttar Pradesh Bihar Sikkim Arunachal Pradesh Nagaland Manipur Mizoram Tripura Meghalaya Assam West Bengal Jarkhand Orissa Chhatisgarh Madhya Pradesh Gujarat Daman & Diu Dadra & Nagar Haveli Maharashtra Andhra Pradesh Karnataka Goa Lakshadweep Ker ala Tamil Nadu Pondicherry Andaman & Nicobar Islands
Table : 4.11
Source: Registrar general, various census years.
-
1991 and 2001. Decadal
difference in Literacy
rate 13.29
13.19 11.45 3.94 14.55 12.74 6.53 22.48 16.65 10.04 12.73 13.15 5.46 8.97 6.22 13.22 14.21 11.39 11.52 12.74 14.52 22.27 19.44 8.40 9.89 19.33
Jnion territories bs Literacy rate
1991
52.20
63.94 58.51 77.81 57.75 55.85 75.29 38.55 40.71 37.49 56.94 41.59 61.65 59.89 82.27 60.44 49.10 52.89 57.70 41.39 49.09 42.91 44.67 61.57 71.20 40.71
Literacv Rates, Rank
2001
65.49 54.46 77.13 69.95 81.76 72.28 68.59 81.82 61.03 57.36 47.53 69.68 54.74 67.11 68.87 88.49 73.66 . 63.31 64.28 69.22 54.13 63.16 65.18 64.11 69.97 81.09 60.03
1991
11 17 4 18 22 6 33 3 1 34 20 29 13 26 2 15 24 23 19 30 25 28 26 14 9 32
2001
11 16 6 14 20 5 29 31 .34 17 32 2 1 19 2 12 27 24 18 33 26 23 25 15 9 30

The table 4.12 illustrates that the absolute number of illiterates in the
country as a whole declined in this decade by 31,958,336. The minimum share
in this decline came from Andhra Pradesh, i.e., 16.7 per cent of the total
decrease in the illiterates during 1991-2001. The States of Uttar Pradesh,
Maharastra Rajasthan, Madhya Pradesh and Tamil Nadu accounts for three-
fourths of the percentage decrease in the total number of illiterates in the
country, where as they share half of country's population.
But Bihar increased its number of illiterates negatively contributing
by 9.33 per cent followed by Delhi.

Table. 4.12 Number of Illiterates, Decadal decrease in Illiterates and Percentage contribution in decrease : 1991,2001
Source: Census of 2001, Provisional Population Totals, Series-1, Paper 1 of 2001.
Conclusion
During the early part of the twentieth century, the country witnessed
fluctuations in population growth but ultimately more or less stagnant
growth of population is observed by the end of 2001. The prevalence of high
birth and death rates during the early part restrictd the growth rate and the
size of population. Since 1951, the country's population is increasing, rapidly
during 1951-81 and then at a slower rate during the last phase.
At present, India has been growing at a faster rate in absolute terms
but it is growing at a slower pace than before in terms of percentage. All the
states in the country are grouped into certain categories on the basis of their
population growth rages in various census decades. The density is increasing
abnormally due to stagnant land area and increasing population pressure the
sex ratio is also decreasing slowly, which is having variations in all the States
and Union Territories linked up with their progress in development. The
literacy rates also increasing but the rate of increase in the literacy of males
is faster than females.